Abstract
The use of mesoporous silica modified with L-arginine (Ar-MSNPs) for the removal of ionic dyes from aqueous solutions has been investigated. Several analytical techniques have been used to determine the characteristics of nanoadsorbents. The removal of crystal violet and fluorescein was performed using the batch method to investigate the effects of cultivation pH, initial concentrations of dyes, and exposure time on adsorption efficiency. The optimum adsorption of fluorescein was achieved at pH 2, whereas the optimum adsorption of crystal violet was achieved at pH 13. The equilibrium was established in both systems at 20 min at low concentrations, and approximately 30 min at high concentrations. The equilibrium adsorption data was analyzed using Langmuir and Freundlich isotherm models. The correlation coefficient (R2) values of the isotherms presented the best fit with the Langmuir isotherm. The adsorption kinetic data was fitted with the pseudo second-order model for both systems.
1. Introduction
In recent years, the excessive use of dyes, due to their entry into the environment, has raised concerns globally. Approximately 7 million tons of dyes are consumed in the world per year [1,2]. Dyes are utilized widely in the cosmetic, textile, pharmaceutical, paper, and food industries. During the dyeing process, approximately 10% (up to 15%) of dyes are discharged into aquatic environments, without any restrictions [3,4]. Although in some cases, the entry of such compounds into the aquatic ecosystem may be low, the cumulative effect is considered to have potential risk to the environments and microorganisms [5].
Fluorescein is an organic dye that has been widely used as a fluorescent tracer for labelling membranes and proteins [6,7]. Fluorescein shows different structural forms (cation, neutral molecule, monoanion, and dianion) depending on pH values [8,9,10,11]. Crystal violet is an organic cationic dye that has a triphenylmethane group in its structure [12]. Crystal violet is widely used in the manufacturing of various products, such as veterinary medicine, textiles, pens, and printers [13,14]. It is carcinogenic and toxic to mammalian cells, and it can be harmful when encountered by inhalation, ingestion, or through skin contact [15,16]. Therefore, there is a need to develop an efficient system to remove these dyes from the wastewater. So far, various methods have been used for water remediation, including membrane separation, chemical oxidation, and biodegradation [17,18,19]. The main disadvantage of these techniques is the secondary pollutants produced from the process. Adsorption is one of the most efficient, easiest, and cheapest methods for removing organic dyes [20,21]. The adsorption performance is directly dependent on the adsorbent properties. Different adsorbents have been studied in recent decades, including activated carbon [22], zeolite [23], clay [24], and mesoporous silica nanoparticles (MSNPs) [25,26].
Mesoporous silica nanoparticles (MSNPs) have been studied as a nanoadsorbent for removing dyes from wastewater [27,28,29]. For instance, methylene blue has been removed from contaminated water using surface-modified MSNPs [28,30]. Naseem et al. synthesized mesoporous silica via a green route for the removal of crystal violet from wastewater [31]. The equilibrium adsorption data was found to follow the Langmuir model, with adsorption capacity ca. 26 mg/g. Hasan et al. reported the synthesis of MSNPs coated by a copolymer chain of L-ascorbic acid (AS) and polyaniline (PAni) as an effective adsorbent for the removal of crystal violet [32]. The experimental data was fitted by the Langmuir model, with a maximum adsorption capacity of 88 mg g−1 at 298 K.
Most of ionic dyes are water soluble, which could have environmental and health risks [33,34,35]. Thus, the removal of ionic dyes from wastewater has attracted a large number of research activities. In the present study, mesoporous silica modified with L-arginine (Ar-MSNPs) was prepared and characterized. The adsorption behaviour of crystal violet and fluorescein on the modified silica was studied. The kinetics of the adsorption process have been investigated. The adsorption isotherms were studied to determine the probable mechanism of adsorption.
2. Materials and Methods
2.1. Materials
L-Arginine (Ar, ≥98%), 3-isocyanatopropyl)triethoxysilane (ICPTES, >95%), ammonium hydroxide (NH4OH, 32 wt%), N-cetyltrimethylammonium bromide (CTAB, 98%), tetraethyl orthosilicate (TEOS, 98%), ethanol (HPLC grade), n-hexane (HPLC grade), fluorescein (95%), and crystal violet (ACS reagent, ≥90.0%) were purchased from Sigma-Aldrich. Hydrochloric acid (HCl, 36.5% v/v), dimethylformamide (DMF, HPLC grade), pyridine (analytical grade), and methanol (HPLC grade) were obtained from Fisher Scientific. All chemicals were used as received, without any further purification.
2.2. Preparation of the Adsorbent
2.2.1. Mesoporous Silica Nanoparticles (MSNPs) Preparation
CTAB (1 g) was dissolved in 150 cm3 of distilled water and sonicated for 5 min. To the aqueous solution, 4 cm3 of NH4OH was added and stirred at 40 °C. TEOS (20 cm3), and 5 cm3 of expanding agent (n-hexane) was mixed and added slowly to the aqueous solution. After 12 h, MSNPs with CTAB were filtered and washed with distilled water and methanol. To extract the templet, the nanoparticles were dispersed in a mixture containing 12.5 cm3 of acetic acid and 12.5 cm3 of hydrogen peroxide, under stirring and at 120 °C. CTAB free MSNPs were separated and washed with distilled water (DW) and methanol [26,27].
2.2.2. MSNPs Modified with L-Arginine (Ar-MSNPs)
Ar-MSNPs were achieved in two steps. First step: CTAB free MSNPs were suspended in dried toluene (30 cm3) and sonicated for 5 min. To the mixture, 0.2 cm3 of ICPTES was added and heated at 120 °C for 12 h. MSNPs-ICP were centrifuged and washed with dry toluene and dry DMF [36].
Second step: The separated nanoparticles were added to dry DMF (10 cm3) and sonicated for 10 min. Then, 10 mg of L-arginine in 10 cm3 of dry DMF was added to the suspension. The mixture was sonicated for 10 min and left under stirring at room temperature for 12 h. Ar-MSNPs were separated and washed with DW and ethanol.
2.3. Characterization
The morphology, structure, and performance of the nanomaterials were characterized by several physiochemical techniques. FTIR spectra were obtained using a Thermo Scientific (Waltham, MA, USA) Nicolet iS10 FT-IR spectrometer instrument, in KBr pellets with a spectral range 4000–400 cm−1, at 25 °C. The chemical composition of the organic film (elemental analysis) was obtained from a Perkin Elmer Series II-2400 analyzer. Scanning electron microscopy (SEM) and transmission electron microscopy (TEM) images were obtained using JEOL instruments, model JSM-6380 LA and model JEM-1230, respectively. The surface charge of the nanoparticles was measured at different pH values by a Malvern instrument (Zetasizer Nano ZS). Dye concentration was evaluated using a UV–vis spectrophotometer—Shimadzu instrument model UV-2600.
2.4. Adsorption Studies
2.4.1. Batch Adsorption
To evaluate the adsorption performance, the adsorption experiments were conducted using fluorescein and crystal violet as probes. The adsorption behavior of both dyes on Ar-MSNPs was investigated at different initial concentrations, pH values, and contact times. Contaminated water was first prepared by dissolving known amounts of fluorescein and crystal violet in distilled water. Second, 10 mg of the adsorbent was placed in a sample tube containing 10 cm3 of the contaminated water at 200 r/min for a certain amount of time. Different concentrations of fluorescein and crystal violet were used. Finally, the adsorbent was separated by centrifuge, and the concentration of unabsorbed dyes was determined by UV–vis spectrophotometer. The amount of dye adsorbed onto the nanoparticles surface and the removal efficiency were determined by:
where qt is the amount of dye adsorbed per unit mass of the nanoparticles at time t in mg.g−1. C0 and Ce (in mg.dm−3) are the dye initial and equilibrium concentrations, respectively. Ct is the dye concentration at time t (min) in mg.dm−3. V is the volume of the solution in dm−3; m is the mass of the nanoparticles in g.
qt = (C0 − Ct)V/m
Removal efficiency (%) = C0 − Ce/C0 × 100%
2.4.2. Adsorption Isotherms
The adsorption behavior of the selected dyes on the Ar-MSNPs surface was determined using two isotherms: Langmuir and Freundlich equation models. The isotherm equations are expressed by:
Langmuir equation:
Freundlich equation:
where in mg.g−1) is the maximum adsorption capacity, and b (in dm−3.mg−1) is a constant value, related to the strength of the adsorbent/adsorbate interaction (Langmuir constant). is a constant value, related to the adsorption intensity; 1/n is a value related to the surface heterogeneity and homogeneity. If the value is small, the surface is a more heterogeneous surface. If the value is equal or closer to one, then the adsorbent has relatively more homogeneous binding sites.
2.4.3. Adsorption Kinetics
The kinetic adsorption of the dyes onto the Ar-MSNPs surface was determined using three adsorption models. The kinetic adsorption equations are expressed by:
- Pseudo first-order model:
- Pseudo second-order model:
- Intraparticle diffusion model:
3. Results and Discussion
3.1. General Characterization
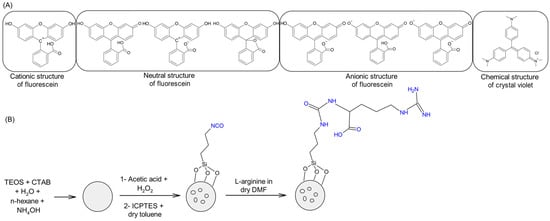
Ar-MSNPs nanoadsorbents were synthesized in four steps. Scheme 1. First, MSNPs with templates were obtained after the condensation reaction of TEOS in basic media in the presence of CTAB (template) and n-hexane (expanding agent). A mixture of acetic acid and hydrogen peroxide was used to extract the template to allow for the reaction with the inner surface. ICPTES was attached to CTAB free MSNPs via condensation reactions between the silanol groups and alkoxysilane groups to obtain MSNPs modified with the isocyanato groups. Primary amine groups in L-arginine can react with isocyanato groups present in MSNPs-ICP to obtain Ar-MSNPs.
Scheme 1.
Schematic representation: (A) the chemical structure of fluorescein and crystal violet in various media, (B) the fabrication processes of the nanoadsorbent used in this study.
The FTIR spectrum of the fabricated nanoparticles shows transmittance peaks at various frequencies, indicating the presence of different functional groups. FT-IR spectra of MSNPs (with CTAB), CTAB free MSNPs, MSNPs-ICP, and Ar-MSNPs are presented in Figure 1. For all samples, it was observed that wave numbers at 450 cm−1 and 800 cm−1 were assigned to the tetrahedron vibration of SiO4 and the symmetric vibration of Si–O–Si, respectively. Strong absorbance was observed at ~1100 cm−1, which was attributed to the Si–O–Si stretch of silica. The absorbance at ~1640 and 3455 cm−1 was observed, as assigned to the surface hydroxyl groups of mesoporous silica. MSNPs (with CTAB) spectra show peaks at wave numbers ~1450 and 2990 cm−1, assigned to –CH vibrations of the template molecules, which disappeared after the extraction process. MSNPs-ICP presented an additional peak at 2280 cm−1, supporting that the –NCO groups were introduced to the MSNPs surface successfully. After MSNPs-ICP was reacted with L-arginine, a new peak at 1700 (C = O group) was apparent, while that at 2280 cm−1 disappeared, supporting that the reaction between MSNPs-ICP and L-arginine was successfully initiated.
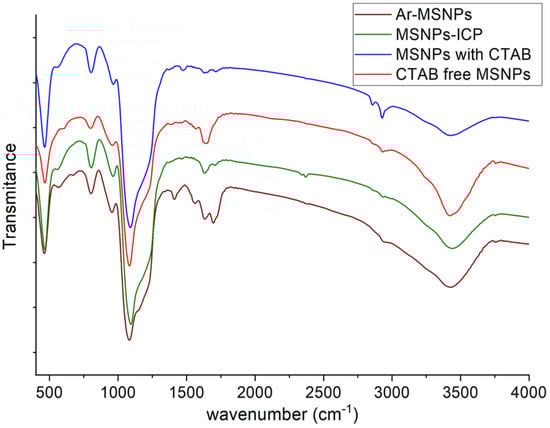
Figure 1.
The FT-IR spectrum of MSNPs (with CTAB), CTAB free MSNPs, MSNPs-ICP, and Ar-MSNPs.
The chemical compositions of the organic layer formed on the silica was also quantified by elemental analysis. Figure 2 shows the results of elemental analysis of the CTAB free MSNPs and modified MSNPs. The low carbon content on CTAB free MSNPs could come from the template and unreacted TEOS and ethoxy groups that were not fully extracted and oxidized by the extraction process. The carbon, hydrogen, and nitrogen contents of modified MSNPs samples are higher due to the grafting of the organic layer on the surface of the particles. After L-arginine reaction with MSNPs-ICP, the carbon and hydrogen contents increased because of the successful attachment of L-arginine onto the MSNPs surfaces.
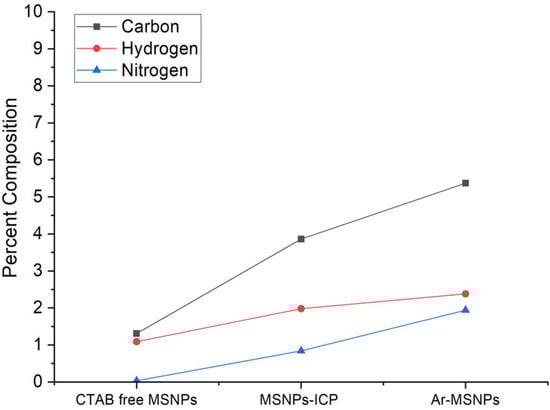
Figure 2.
The chemical compositions of CTAB free MSNPs, MSNPs-ICP, and Ar-MSNPs quantified by elemental analysis.
To determine the surface charge of the selected samples, the zeta potential of CTAB free MSNPs, MSNPs-ICP, and Ar-MSNPs were measured. The zeta potential measurements as a function of pH values were presented in Figure 3. CTAB free MSNPs had a negative value of zeta potential, as the silanol groups were negatively charged at a pH value above 5. Zeta potential measurements of CTAB free MSNPs reached −31 mV at pH 9. However, after functionalization with ICPTES, the values were between +11 mV and –13 mV, under a wide range of pH conditions (acidic and basic media). The value increased to +25 mV, as the L-arginine molecules attached to the MSNPs surface were positively charged at a pH below 3 (pKa of carboxylic acid). The zeta potential was more negative at a pH above 11, due to the deprotonations of the highly ionic functional groups. Therefore, the changes observed in the zeta potential indicated that the functional groups attached successfully on the MSNPs surface.
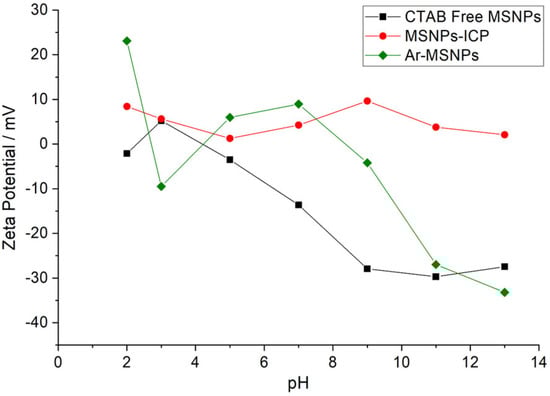
Figure 3.
Comparison of zeta potential value between CTAB free MSNPs, MSNPs-ICP, and Ar-MSNPs in aqueous solutions at different pH values.
The textural properties of CTAB free MSNPs and Ar-MSNPs were measured by N2 adsorption/desorption using an Autosorb-iQ instrument (Quantachrome). The selected samples were heated at 120 °C and degassed for 6 h under flow with N2 prior to measurement. The BET surface areas, pore volume, and pore size of both samples were quantified, and the results are presented in Table 1. The pore diameters and surface areas were slightly decreased 1.3- and 1.14-fold, respectively, due to the formation of a thin organic layer on the surface of the mesoporous structures. Figure 4A shows the BJH pore size distribution (uniformed). The pore volume was also decreased after surface modification due to pore filling with the propyl terminated L-arginine. The nitrogen adsorption/desorption isotherms of the samples indicated a IUPAC type IV isotherm, corresponding to the mesoporous structure, as shown in Figure 4B. A different capillary condensation between CTAB free MSNPs and Ar-MSNPs was observed at higher relative pressures. The hysteresis loop was broader for non-modified MSNPs, compared to Ar-MSNPs, indicating the successful attachment of the propyl terminated L-arginine.

Table 1.
Physical properties of CTAB free MSNPs and Ar-MSNPs obtained from N2 adsorption/desorption studies.
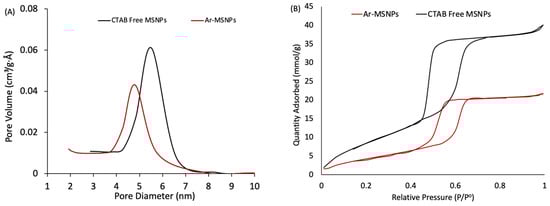
Figure 4.
Physical properties of CTAB free MSNPs and Ar-MSNPs: (A) BJH pore size distribution, and (B) nitrogen adsorption/desorption isotherms.
The scanning electron microscope (SEM) images of CTAB free MSNPs and Ar-MSNPs are shown in Figure 5A,B. Similar to what was reported by Alswieleh (2021), the diameters of the particles were in nanometres, with an average particle size of 260 nm. No difference was observed in morphology when the MSNPs surface was modified in the organic layer, in agreement with previously reported work. To further explore detailed information on morphology, transmission electron microscopy (TEM) was applied to estimate the particle size and observe the pore structure of the silica nanoparticles. The TEM images of CTAB free MSNPs and Ar-MSNPs are shown in Figure 5C,D. It can be clearly seen that the sphere surface of the samples was smooth and they contained pores in their structures. Both samples have a similar average particle size of 280 nm. The size of the majority of the pores was estimated to be between 5 and 6 nm.
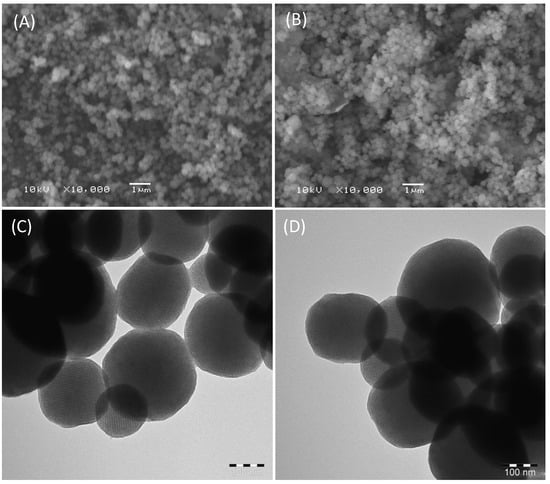
Figure 5.
The SEM images of CTAB free MSNPs (A) and Ar-MSNPs (B), respectively. The TEM images of CTAB free MSNPs (C) and Ar-MSNPs (D), respectively.
3.2. Adsorption Studies
3.2.1. Effect of pH
The absorption properties of the selected dyes (crystal violet and fluorescein) are strongly dependent upon pH. Crystal violet (CV) has a relatively high stability in various pH values. CV has a positive value at a pH value above the pKa value (1) [37]. Fluorescein (Fl) has different forms (cation, neutral molecule, and dianion), depending on the pH environments [38]. The cationic form is the predominate species in a strongly acidic media. Fl is found in neutral species at a pH between 2 and 4, and the anion form is present at a pH above these levels.
A series of batch experiments were carried out to investigate the effect of pH on the dyes adsorption onto the Ar-MSNPs surface at two different concentrations: 40 ppm and 100 ppm for Fl and CV, respectively. These concentrations have been chosen based on the dye solubility. Based on our results, the adsorption of Fl and CV on Ar-MSNPs shows maximum values at pH 2 and 11, respectively (shown in Figure 6). The adsorption of the dyes could be explained by electrostatic attraction between the negatively charged deprotonated amino and carboxylic acid groups on the Ar-MSNPs surface at a pH above 9 and the positive charge of the CV. The maximum adsorption capacity of CV at pH 13 was ca. 138 mg.g−1 at 298 K. Similar results have been reported for L-ascorbic acid-g-polyaniline mesoporous silica nanocomposite (113 mg.g−1 at 333 K) [32]. Moreover, the surface of Ar-MSNPs may have been zwitterionically charged at pH levels higher than 4, which would decrease the number of Fl attracted to the adsorbent surface. The maximum adsorption capacity of Fl was estimated to be 32 mg.g−1 at pH 2 and 298 K.
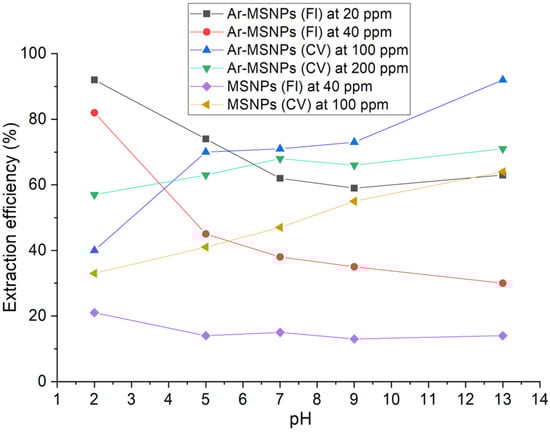
Figure 6.
Effect of initial pH on CV adsorption onto the Ar-MSNPs surface at a temperature of 23 °C, the adsorbent dosage of 10 mg, and a shaking speed of 200 rpm for 24 h.
3.2.2. Adsorption Isotherms
The behavior adsorption was described using two models: the Langmuir and Freundlich models (Figure 7). The difference between these models is that Langmuir makes assumptions that the analytes are adsorbed on the surface of the adsorbent as a monolayer, and the maximum adsorption occurs when the surface is completely covered. Freundlich assumes that the surface is heterogeneous, and that different affinities and analytes are adsorbed as a multilayer adsorption. The correlation coefficients (R2) value was used to determine the suitable isotherm model. For both dyes, the Langmuir adsorption model was found to be the best fitting model. The values of Langmuir constants qm and b were calculated from the slopes and intercepts of the lines, as shown in Table 2. The separation factor (or equilibrium parameter) (RL) is an essential feature of the Langmuir adsorption isotherm, describing the nature of the adsorption isotherm. RL can be expressed by [39]:
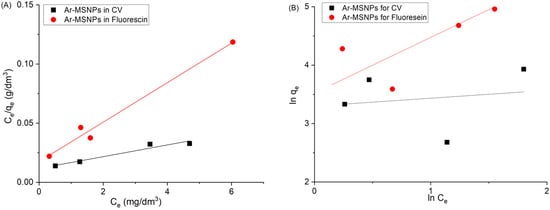
Figure 7.
Adsorption isotherms of Fl and CV at 298 K: (A) Langmuir adsorption isotherm, and (B) Freundlich adsorption isotherm.
Table 2.
Langmuir parameters for the adsorption process at 298 K.
If the value of RL is equal to zero, then the adsorption is irreversible. The adsorption process is favourable if the RL value is between 0 and 1, and unfavourable when RL = 1. As presented in Table 2, the RL values were found between 0 and 1, indicating that the adsorption of both dyes on the Ar-MSNPs is favourable under the conditions used in this study.
Moreover, the comparison of the non-linear form of the Langmuir and the Freundlich isotherm models, with experimental data for the sorption of dyes onto Ar-MSNPs at 25 °C, has been shown in Figure 8, and the nonlinear Langmuir isotherm parameters are summarized in Table 3. For both dyes, it was found that the Langmuir adsorption model showed a better fit to the experimental data than did the Freundlich model. Fitting the experimental data with the non-linear Langmuir isotherm had a lower coefficient of determination in the case of adsorption isotherms of Fl, compared to the linear method. The R2 values differed, and the parameter values between the linear and nonlinear parameters were different. The Langmuir adsorption isotherm of CV showed a remarkable similarity between nonlinear and linear parameters.
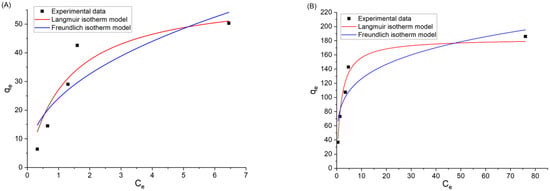
Figure 8.
Langmuir and Freundlich isotherm model nonlinear fitting at 298 K: (A) adsorption isotherms of Fl, and (B) adsorption isotherms of CV.
Table 3.
Parameters of nonlinear Langmuir isotherm model for the adsorption process at 298 K.
3.3. Kinetics
3.3.1. Effect of Initial Concentration of Dye Solutions
To investigate the effects of the initial concentration of the dyes on the adsorptions, the concentration varied in the range of 10–40 ppm of Fl and 25–200 of CV at a constant adsorbent dosage of 10 mg, 23 °C and a shaking speed of 200 rpm. Figure 9A,B illustrates the change in the removal dyes percentage over the initial concentration. The amount of the adsorbent adsorbed on the Ar-MSNPs surface increased with an increasing initial concentration of the dyes. This may be explained by the increasing driving force between the solid phase and aqueous phase, and increasing the collisions between nanoadsorbent and dyes molecules. Generally, the amount of dyes removed by the Ar-MSNPs increased sharply and reached equilibrium in 20 min. At high concentrations, however, the amount of dye adsorbed on the surface increased gradually within 40 min and reached equilibrium after 50 min exposure time. This phenomenon could be interpreted by the fact that the adsorption sites on the nanoadsorbent were sufficient in the early adsorption stage. As time passed, sufficient interactions occurred between the adsorbent and the dyes, until all adsorption sites were occupied by dyes molecules [40].
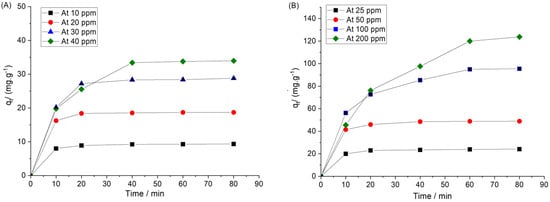
Figure 9.
Adsorption of the selected dyes as a function of time at different initial concentrations and 298 K: (A) adsorption of Fl, and (B) adsorption of CV.
3.3.2. Adsorption Models
The adsorption data can be fitted using kinetics models to determine the dynamics of dye adsorption on the nanoparticles surface with respect to the order of the rate constant. Such parameters can provide important information for designing the adsorption process [41]. Pseudo first-order, pseudo second-order, and intraparticle diffusion kinetics were applied to analyze the adsorption kinetic data, as described by Equations (5)–(7). The pseudo first-order and pseudo second-order kinetic models are useful to determine whether a physical or chemical adsorption process occurred on the surface. If the pseudo first-order model fits better with the result, then the adsorption process can be described as a physical process. If the pseudo second-order model provides better fit, then it is described as a chemical adsorption. Figure 10A,B shows the fit result with the pseudo first-order kinetics of Fl and CV, respectively, and Figure 9A,B shows the experimental values with the pseudo second-order kinetics of Fl and CV, respectively. Table 4 shows the pseudo first-order and pseudo second-order parameters for the adsorption process. According to the correlation coefficients (R2), the adsorption data for both dyes was better represented with the pseudo second-order model than with the pseudo first-order model.
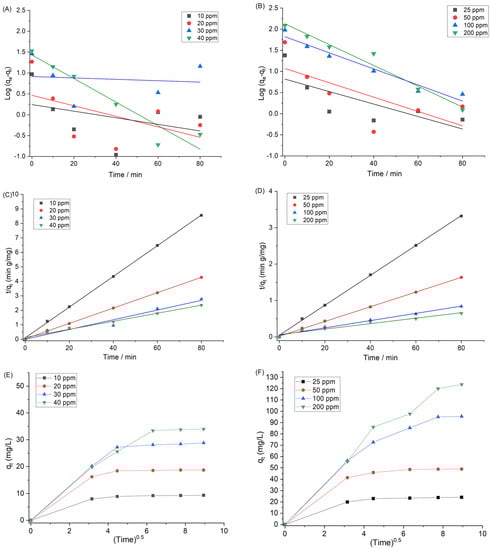
Figure 10.
(A,B) Pseudo first-order kinetics of Fl and CV, respectively. (C,D) Pseudo second-order kinetics of Fl and CV, respectively. (E,F) Intraparticle diffusion kinetics for adsorption of Fl and CV, respectively. At 298 K.
Table 4.
Pseudo first-order and pseudo second-order parameters for the adsorption process at 298 K.
Figure 10E,F shows the adsorption process presented by the intraparticle diffusion model. The first sharp line in the plot displays the adsorption on the external surface (the instantaneous adsorption stage). The larger slope of the first sharp line suggests that the dye adsorption rate was high at the initial time, due to the presence of plenty of active adsorption sites. The second line shows the slow adsorption process, indicating the intraparticle diffusion, or micro-sore diffusion. The lower slopes of the second sharp line suggested that the dye molecules take a long time to diffuse on the mesopores of the Ar-MSNPs, due to a decreased concentration profile [42].
To reduce costs and protect the environment, the regeneration of the adsorbents is essential. For this purpose, regeneration experiments have been performed in successive cycles. It was observed that the adsorption efficiency of the nanoadsorbent gradually decreases with an increasing recycle number of the adsorbent, as shown in Figure 11. The reduction in removal efficiency could be related to the reduction of adsorbent sites and the blockage of pores [43]. After four cycles, the removal efficiencies of Fl and CV were found to be 76 and 72%, respectively.
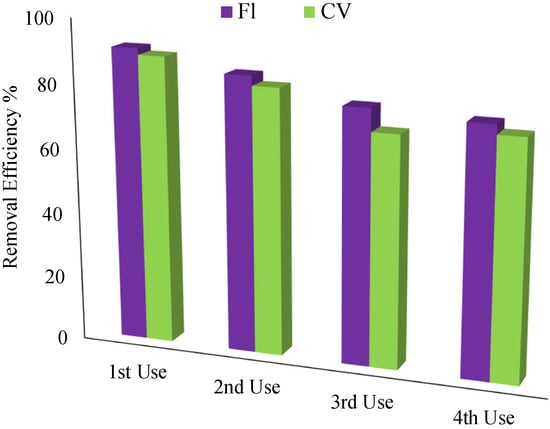
Figure 11.
Effect of regeneration cycles on the removal of Fl and CV from aqueous solution using Ar-MSNPs. Removal conditions—adsorbent amount: 0.1 g, Fl concentration: 20 ppm and pH = 2, CV concentration: 100 ppm and pH = 13.
4. Conclusions
In the present work, experiments were performed to evaluate the use of mesoporous silica modified with L-arginine as an adsorbent for ionic dyes. In the first stage of the study, the adsorbent was fully characterized. The average particle size of the adsorbent was found to be ca. 260 nm. BET analysis shows that the surface area was relatively high (ca. 931 m2/g), with a pore size of 5 nm. The elements of carbon, hydrogen, and nitrogen were found to be increased after each modification step. The effects of operating parameters such as pH, exposure time, and initial dye dose on the sorption capacity of Ar-MSNPs were studied for both selected dyes. The experimental results suggested that the adsorption was influenced by pH solution, contact time, and the concentration of the dyes. The optimum pH of fluorescein and crystal violet were 2 and 13, respectively. It was found that the adsorption of both dyes onto Ar-MSNPs is a fast process, with an equilibrium time of 20 min at low concentrations. The adsorption equilibrium of both systems was described by the Langmuir isotherm. The adsorption kinetics indicated that the adsorption processes fitted well with the pseudo second-order model.
Funding
This research received no external funding.
Informed Consent Statement
Not applicable.
Data Availability Statement
Not applicable.
Acknowledgments
This project was supported by Researchers Supporting Project, number (RSP-2021/238), King Saud University, Riyadh, Saudi Arabia.
Conflicts of Interest
The author declares no conflict of interest.
References
- Gui, W.; Lin, J.; Liang, Y.; Qu, Y.; Zhang, L.; Zhang, H.; Li, X. A two-step strategy for high-efficiency fluorescent dye removal from wastewater. Npj Clean Water 2019, 2, 16. [Google Scholar] [CrossRef] [Green Version]
- Bhagat, C.; Kumar, M.; Tyagi, V.K.; Mohapatra, P.K. Proclivities for prevalence and treatment of antibiotics in the ambient water: A review. Npj Clean Water 2020, 3, 42. [Google Scholar] [CrossRef]
- Yang, J.; Shojaei, S.; Shojaei, S. Removal of drug and dye from aqueous solutions by graphene oxide: Adsorption studies and chemometrics methods. Npj Clean Water 2022, 5, 5. [Google Scholar] [CrossRef]
- Ali, S.S.; Sun, J.; Koutra, E.; El-Zawawy, N.; Elsamahy, T.; El-Shetehy, M. Construction of a novel cold-adapted oleaginous yeast consortium valued for textile azo dye wastewater processing and biorefinery. Fuel 2021, 285, 119050. [Google Scholar] [CrossRef]
- Maged, A.; Iqbal, J.; Kharbish, S.; Ismael, I.S.; Bhatnagar, A. Tuning tetracycline removal from aqueous solution onto activated 2:1 layered clay mineral: Characterization, sorption and mechanistic studies. J. Hazard. Mater. 2020, 384, 121320. [Google Scholar] [CrossRef] [PubMed]
- Arık, M.; Çelebi, N.; Onganer, Y. Fluorescence quenching of fluorescein with molecular oxygen in solution. J. Photochem. Photobiol. A Chem. 2005, 170, 105–111. [Google Scholar] [CrossRef]
- Toprak, M.; Aydın, B.M.; Arık, M.; Onganer, Y. Fluorescence quenching of fluorescein by Merocyanine 540 in liposomes. J. Lumin. 2011, 131, 2286–2289. [Google Scholar] [CrossRef]
- Martin, M.M.; Lindqvist, L. The pH dependence of fluorescein fluorescence. J. Lumin. 1975, 10, 381–390. [Google Scholar] [CrossRef]
- Sjöback, R.; Nygren, J.; Kubista, M. Absorption and fluorescence properties of fluorescein. Spectrochim. Acta Part A Mol. Biomol. Spectrosc. 1995, 51, L7–L21. [Google Scholar] [CrossRef]
- Silva, D.L.; Coutinho, K.; Canuto, S. Electronic spectroscopy of biomolecules in solution: Fluorescein dianion in water. Mol. Phys. 2010, 108, 3125–3130. [Google Scholar] [CrossRef]
- Chen, X.; Pradhan, T.; Wang, F.; Kim, J.S.; Yoon, J. Fluorescent chemosensors based on spiroring-opening of xanthenes and related derivatives. Chem. Rev. 2012, 112, 1910–1956. [Google Scholar] [CrossRef] [PubMed]
- Neupane, S.; Ramesh, S.; Gandhimathi, R.; Nidheesh, P. Pineapple leaf (Ananas comosus) powder as a biosorbent for the removal of crystal violet from aqueous solution. Desalin. Water Treat. 2015, 54, 2041–2054. [Google Scholar] [CrossRef]
- Lim, L.B.; Priyantha, N.; Zehra, T.; Then, C.W.; Chan, C.M. Adsorption of crystal violet dye from aqueous solution onto chemically treated Artocarpus odoratissimus skin: Equilibrium, thermodynamics, and kinetics studies. Desalin. Water Treat. 2016, 57, 10246–10260. [Google Scholar] [CrossRef]
- Yang, H.; Zhou, D.; Chang, Z.; Zhang, L. Adsorption of crystal violet onto amino silica: Optimization, equilibrium, and kinetic studies. Desalin. Water Treat. 2014, 52, 6113–6121. [Google Scholar] [CrossRef]
- Saeed, A.; Sharif, M.; Iqbal, M. Application potential of grapefruit peel as dye sorbent: Kinetics, equilibrium and mechanism of crystal violet adsorption. J. Hazard. Mater. 2010, 179, 564–572. [Google Scholar] [CrossRef] [PubMed]
- Singh, K.P.; Gupta, S.; Singh, A.K.; Sinha, S. Optimizing adsorption of crystal violet dye from water by magnetic nanocomposite using response surface modeling approach. J. Hazard. Mater. 2011, 186, 1462–1473. [Google Scholar] [CrossRef]
- Zhang, S.; Jiang, J.-Q.; Petri, M. Preliminarily comparative performance of removing bisphenol-S by ferrate oxidation and ozonation. Npj Clean Water 2021, 4, 1. [Google Scholar] [CrossRef]
- Liu, Y.; Zhang, F.; Zhu, W.; Su, D.; Sang, Z.; Yan, X.; Li, S.; Liang, J.; Dou, S.X. A multifunctional hierarchical porous SiO2/GO membrane for high efficiency oil/water separation and dye removal. Carbon 2020, 160, 88–97. [Google Scholar] [CrossRef]
- Mi, Y.-F.; Xu, G.; Guo, Y.-S.; Wu, B.; An, Q.-F. Development of antifouling nanofiltration membrane with zwitterionic functionalized monomer for efficient dye/salt selective separation. J. Membr. Sci. 2020, 601, 117795. [Google Scholar] [CrossRef]
- Arabkhani, P.; Asfaram, A. Development of a novel three-dimensional magnetic polymer aerogel as an efficient adsorbent for malachite green removal. J. Hazard. Mater. 2020, 384, 121394. [Google Scholar] [CrossRef]
- Arabkhani, P.; Asfaram, A.; Ateia, M. Easy-to-prepare graphene oxide/sodium montmorillonite polymer nanocomposite with enhanced adsorption performance. J. Water Process Eng. 2020, 38, 101651. [Google Scholar] [CrossRef]
- Sharifpour, E.; Ghaedi, M.; Asfaram, A.; Farsadrooh, M.; Dil, E.A.; Javadian, H. Modeling and optimization of ultrasound-assisted high performance adsorption of Basic Fuchsin by starch-capped zinc selenide nanoparticles/AC as a novel composite using response surface methodology. Int. J. Biol. Macromol. 2020, 152, 913–921. [Google Scholar] [CrossRef] [PubMed]
- Sivalingam, S.; Sen, S. Rice husk ash derived nanocrystalline ZSM-5 for highly efficient removal of a toxic textile dye. J. Mater. Res. Technol. 2020, 9, 14853–14864. [Google Scholar] [CrossRef]
- Hamid, S.A.; Shahadat, M.; Ballinger, B.; Azha, S.F.; Ismail, S.; Ali, S.W.; Ahammad, S.Z. Role of clay-based membrane for removal of copper from aqueous solution. J. Saudi Chem. Soc. 2020, 24, 785–798. [Google Scholar] [CrossRef]
- Alotaibi, K.M.; Almethen, A.A.; Beagan, A.M.; Al-Swaidan, H.M.; Ahmad, A.; Bhawani, S.A.; Alswieleh, A.M. Quaternization of Poly (2-diethyl aminoethyl methacrylate) Brush-Grafted Magnetic Mesoporous Nanoparticles Using 2-Iodoethanol for Removing Anionic Dyes. Appl. Sci. 2021, 11, 10451. [Google Scholar] [CrossRef]
- Alswieleh, A.M. Cysteine-and glycine-functionalized mesoporous silica as adsorbents for removal of paracetamol from aqueous solution. Int. J. Environ. Anal. Chem. 2021, 1–12. [Google Scholar] [CrossRef]
- Alswieleh, A.M. Remediation of cationic and anionic dyes from water by histidine modified mesoporous silica. Int. J. Environ. Anal. Chem. 2021, 1–13. [Google Scholar] [CrossRef]
- Beagan, A.; Alotaibi, K.; Almakhlafi, M.; Algarabli, W.; Alajmi, N.; Alanazi, M.; Alwaalah, H.; Alharbi, F.; Alshammari, R.; Alswieleh, A. Amine and sulfonic acid functionalized mesoporous silica as an effective adsorbent for removal of methylene blue from contaminated water. J. King Saud Univ.-Sci. 2022, 34, 101762. [Google Scholar] [CrossRef]
- Almethen, A.A.; Alotaibi, K.M.; Alhumud, H.S.; Alswieleh, A.M. Highly Efficient and Rapid Removal of Methylene Blue from Aqueous Solution Using Folic Acid-Conjugated Dendritic Mesoporous Silica Nanoparticles. Processes 2022, 10, 705. [Google Scholar] [CrossRef]
- Beagan, A.M. Investigating Methylene Blue Removal from Aqueous Solution by Cysteine-Functionalized Mesoporous Silica. J. Chem. 2021, 2021, 8839864. [Google Scholar] [CrossRef]
- Naseem, T.; Baig, M.M.; Warsi, M.F.; Hussain, R.; Agboola, P.O.; Waseem, M. Mesoporous silica prepared via a green route: A comparative study for the removal of crystal violet from wastewater. Mater. Res. Express 2020, 8, 015005. [Google Scholar] [CrossRef]
- Hasan, I.; BinSharfan, I.I.; Khan, R.A.; Alsalme, A. L-Ascorbic Acid-g-Polyaniline Mesoporous Silica Nanocomposite for Efficient Removal of Crystal Violet: A Batch and Fixed Bed Breakthrough Studies. Nanomaterials 2020, 10, 2402. [Google Scholar] [CrossRef] [PubMed]
- Mohan, S.V.; Sailaja, P.; Srimurali, M.; Karthikeyan, J. Color removal of monoazo acid dye from aqueous solution by adsorption and chemical coagulation. Environ. Eng. Policy 1998, 1, 149–154. [Google Scholar] [CrossRef]
- Wong, Y.; Szeto, Y.; Cheung, W.; McKay, G. Adsorption of acid dyes on chitosan—Equilibrium isotherm analyses. Proces. Biochem. 2004, 39, 695–704. [Google Scholar] [CrossRef]
- Muthukumar, M.; Karuppiah, M.T.; Raju, G.B. Electrochemical removal of CI Acid orange 10 from aqueous solutions. Sep. Purif. Technol. 2007, 55, 198–205. [Google Scholar] [CrossRef]
- Alswieleh, A.M. Aspartic Acid-and Glycine-Functionalized Mesoporous Silica as an Effective Adsorbent to Remove Methylene Blue from Contaminated Water. J. Chem. 2022, 2022, 5375815. [Google Scholar] [CrossRef]
- GG, K.D.; Sanyal, B.; Ghosh, S.K. Radiation response studies of acetonitrile solutions of crystal violet and leuco crystal violet. Radiat. Phys. Chem. 2020, 177, 109068. [Google Scholar]
- Panchompoo, J.; Aldous, L.; Baker, M.; Wallace, M.I.; Compton, R.G. One-step synthesis of fluorescein modified nano-carbon for Pd (II) detection via fluorescence quenching. Analyst 2012, 137, 2054–2062. [Google Scholar] [CrossRef]
- Malik, P. Dye removal from wastewater using activated carbon developed from sawdust: Adsorption equilibrium and kinetics. J. Hazard. Mater. 2004, 113, 81–88. [Google Scholar] [CrossRef]
- Hu, L.; Yang, Z.; Wang, Y.; Li, Y.; Fan, D.; Wu, D.; Wei, Q.; Du, B. Facile preparation of water-soluble hyperbranched polyamine functionalized multiwalled carbon nanotubes for high-efficiency organic dye removal from aqueous solution. Sci. Rep. 2017, 7, 3611. [Google Scholar] [CrossRef]
- Varlikli, C.; Bekiari, V.; Kus, M.; Boduroglu, N.; Oner, I.; Lianos, P.; Lyberatos, G.; Icli, S. Adsorption of dyes on Sahara desert sand. J. Hazard. Mater. 2009, 170, 27–34. [Google Scholar] [CrossRef] [PubMed]
- Wu, F.-C.; Tseng, R.-L.; Juang, R.-S. Comparisons of porous and adsorption properties of carbons activated by steam and KOH. J. Colloid Interface Sci. 2005, 283, 49–56. [Google Scholar] [CrossRef] [PubMed]
- Liu, Y.; Xu, L.; Liu, J.; Liu, X.; Chen, C.; Li, G.; Meng, Y. Graphene oxides cross-linked with hyperbranched polyethylenimines: Preparation, characterization and their potential as recyclable and highly efficient adsorption materials for lead (II) ions. Chem. Eng. J. 2016, 285, 698–708. [Google Scholar] [CrossRef] [Green Version]
Publisher’s Note: MDPI stays neutral with regard to jurisdictional claims in published maps and institutional affiliations. |
© 2022 by the author. Licensee MDPI, Basel, Switzerland. This article is an open access article distributed under the terms and conditions of the Creative Commons Attribution (CC BY) license (https://creativecommons.org/licenses/by/4.0/).