Article

Cooling Crystallization with Complex Temperature Profiles on a Quasi-Continuous and Modular Plant

Laboratory of Equipment Design, Department of Biochemical and Chemical Engineering, TU Dortmund University, Emil-Figge-Straße 68, 44227 Dortmund, Germany
*
Author to whom correspondence should be addressed.
Processes 2022, 10(6), 1047; https://doi.org/10.3390/pr10061047
Submission received: 26 April 2022 / Revised: 18 May 2022 / Accepted: 19 May 2022 / Published: 24 May 2022
(This article belongs to the Section Pharmaceutical Processes)

Abstract

:
Volatile markets and increasing demands for quality and fast availability of specialty chemical products have motivated the rise of small-scale, integrated, and modular continuous processing plants. As a significant unit operation used for product isolation and purification, cooling crystallization is part of this trend. Here, the small-scale and integrated quasi-continuous filter belt crystallizer (QCFBC) combines cooling crystallization, solid-liquid separation, and drying on a single apparatus. This contribution shows the general working principle, different operation modes, and possibilities of temperature control with the modular setup. For precise temperature control in cooling crystallization, Peltier elements show promising results in a systematic study of different operation parameters. Sucrose/water was used as a model substance system. The results confirm that seed crystal properties are the most important parameter in crystallization processes. Additionally, an oscillating temperature profile has a narrowing effect on the crystal size distribution (CSD). The integrated, small-scale, and modular setup of the QCFBC offers high degrees of flexibility, process control, and adaptability to cope with future market demands.

Graphical Abstract

1. Introduction

Small-scale continuous processes have become interesting for industrial research as well as production in recent years [1,2]. Benefits of continuous processes over batch techniques such as an increase in efficiency [3], product quality consistency [4,5,6], and decreases in power consumption, human labor, and space requirements [5] are the driving forces for this trend. Additionally, the demand for individual pharmaceutical products [4,6,7] and therefore adaptable [5], modular [4,8], and small scale plants [5] is growing. The paradigm shift from batch processes to continuous processes is part of an overall trend toward process intensification following the strategies of miniaturization, integration, increased process control, and modularization [9]. Especially in industrial (cooling) crystallization, where batch crystallization processes are still predominant [10], the potential of continuous processes and previously named strategies is apparent. Although there is recent research on different small-scale continuous crystallization equipment available, (such as MSMPR (mixed suspension mixed product removal) [11,12], PFC (plug flow crystallizer) [13,14], COBC (continuous oscillatory baffled crystallizer) [15], and CFIC (coiled flow inverter crystallizer) [16,17,18]) [19,20,21,22,23,24,25] the industrial applicability is limited. In particular, the questions arise on dealing with clogged equipment and handling the product suspension after crystallization. An answer to this question is the cooling crystallization on a quasi-continuous filter belt crystallizer QCFBC, which is presented and characterized in this contribution. The concept combines batch and continuous processing and therefore attempts to benefit from both on one device. Batch containers that are opened to the bottom and top are positioned on a specially treated filter belt and moved forward from one functional module to the next in a “quasi-continuous” fashion. The modules positioned below the filter belt are capable of heating, cooling, and filtration. In this specific case, the unit operations cooling crystallization, solid-liquid separation, and drying are combined so that from a product solution and seed crystals fed to the device, a dried filter cake can be obtained at the outlet. Operations that would have been performed in different, spatially separated apparatuses can be carried out without moving intermediate products between them. The first approach in terms of development and commissioning on this can be found in [26,27]. The work presented here is concerned with the cooling crystallization step of the quasi-continuous filter belt crystallizer. The concept mentioned above [26,27] was adopted and equipped with a modular lid including 3D-printed stirrers and sensory equipment. The cooling crystallization of the substance system sucrose/water was investigated in detail with particular attention to the influence of seed crystal size, seed crystal amount, and precise temperature control on the crystallization process and the product properties. Particularly, the dissolution of fines induced by an oscillating temperature profile is investigated and shows promising results as it is feasible to narrow the particle size distribution of the product crystals.

2. Materials and Methods

This chapter deals with the background of the apparatus that is characterized. The working principle and experimental strategy are described here with temperature control strategy, different operation modes, and the development and application of an analytical strategy.

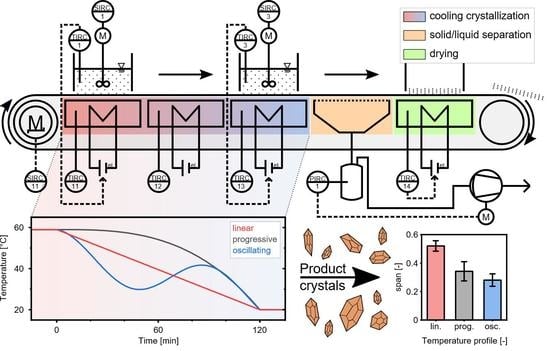
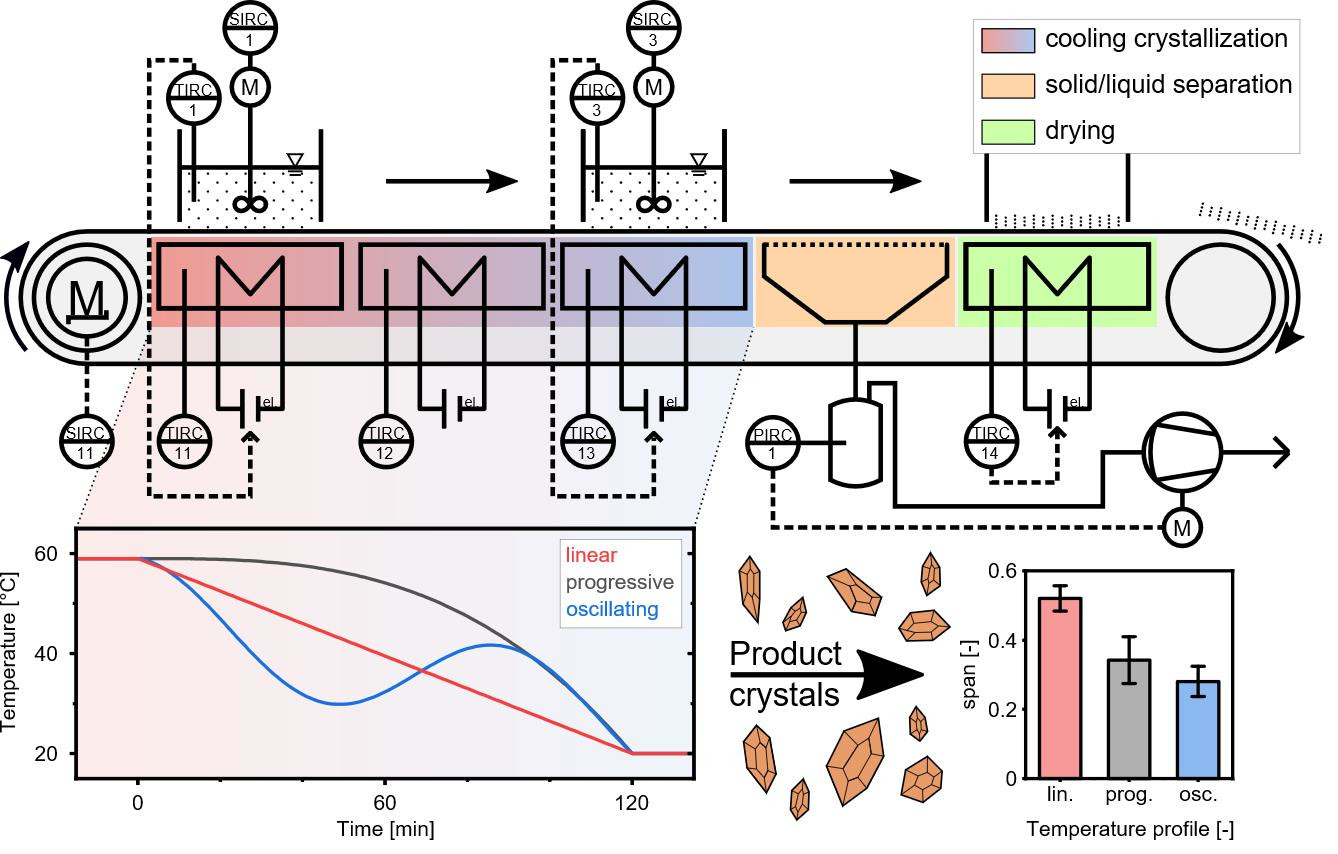
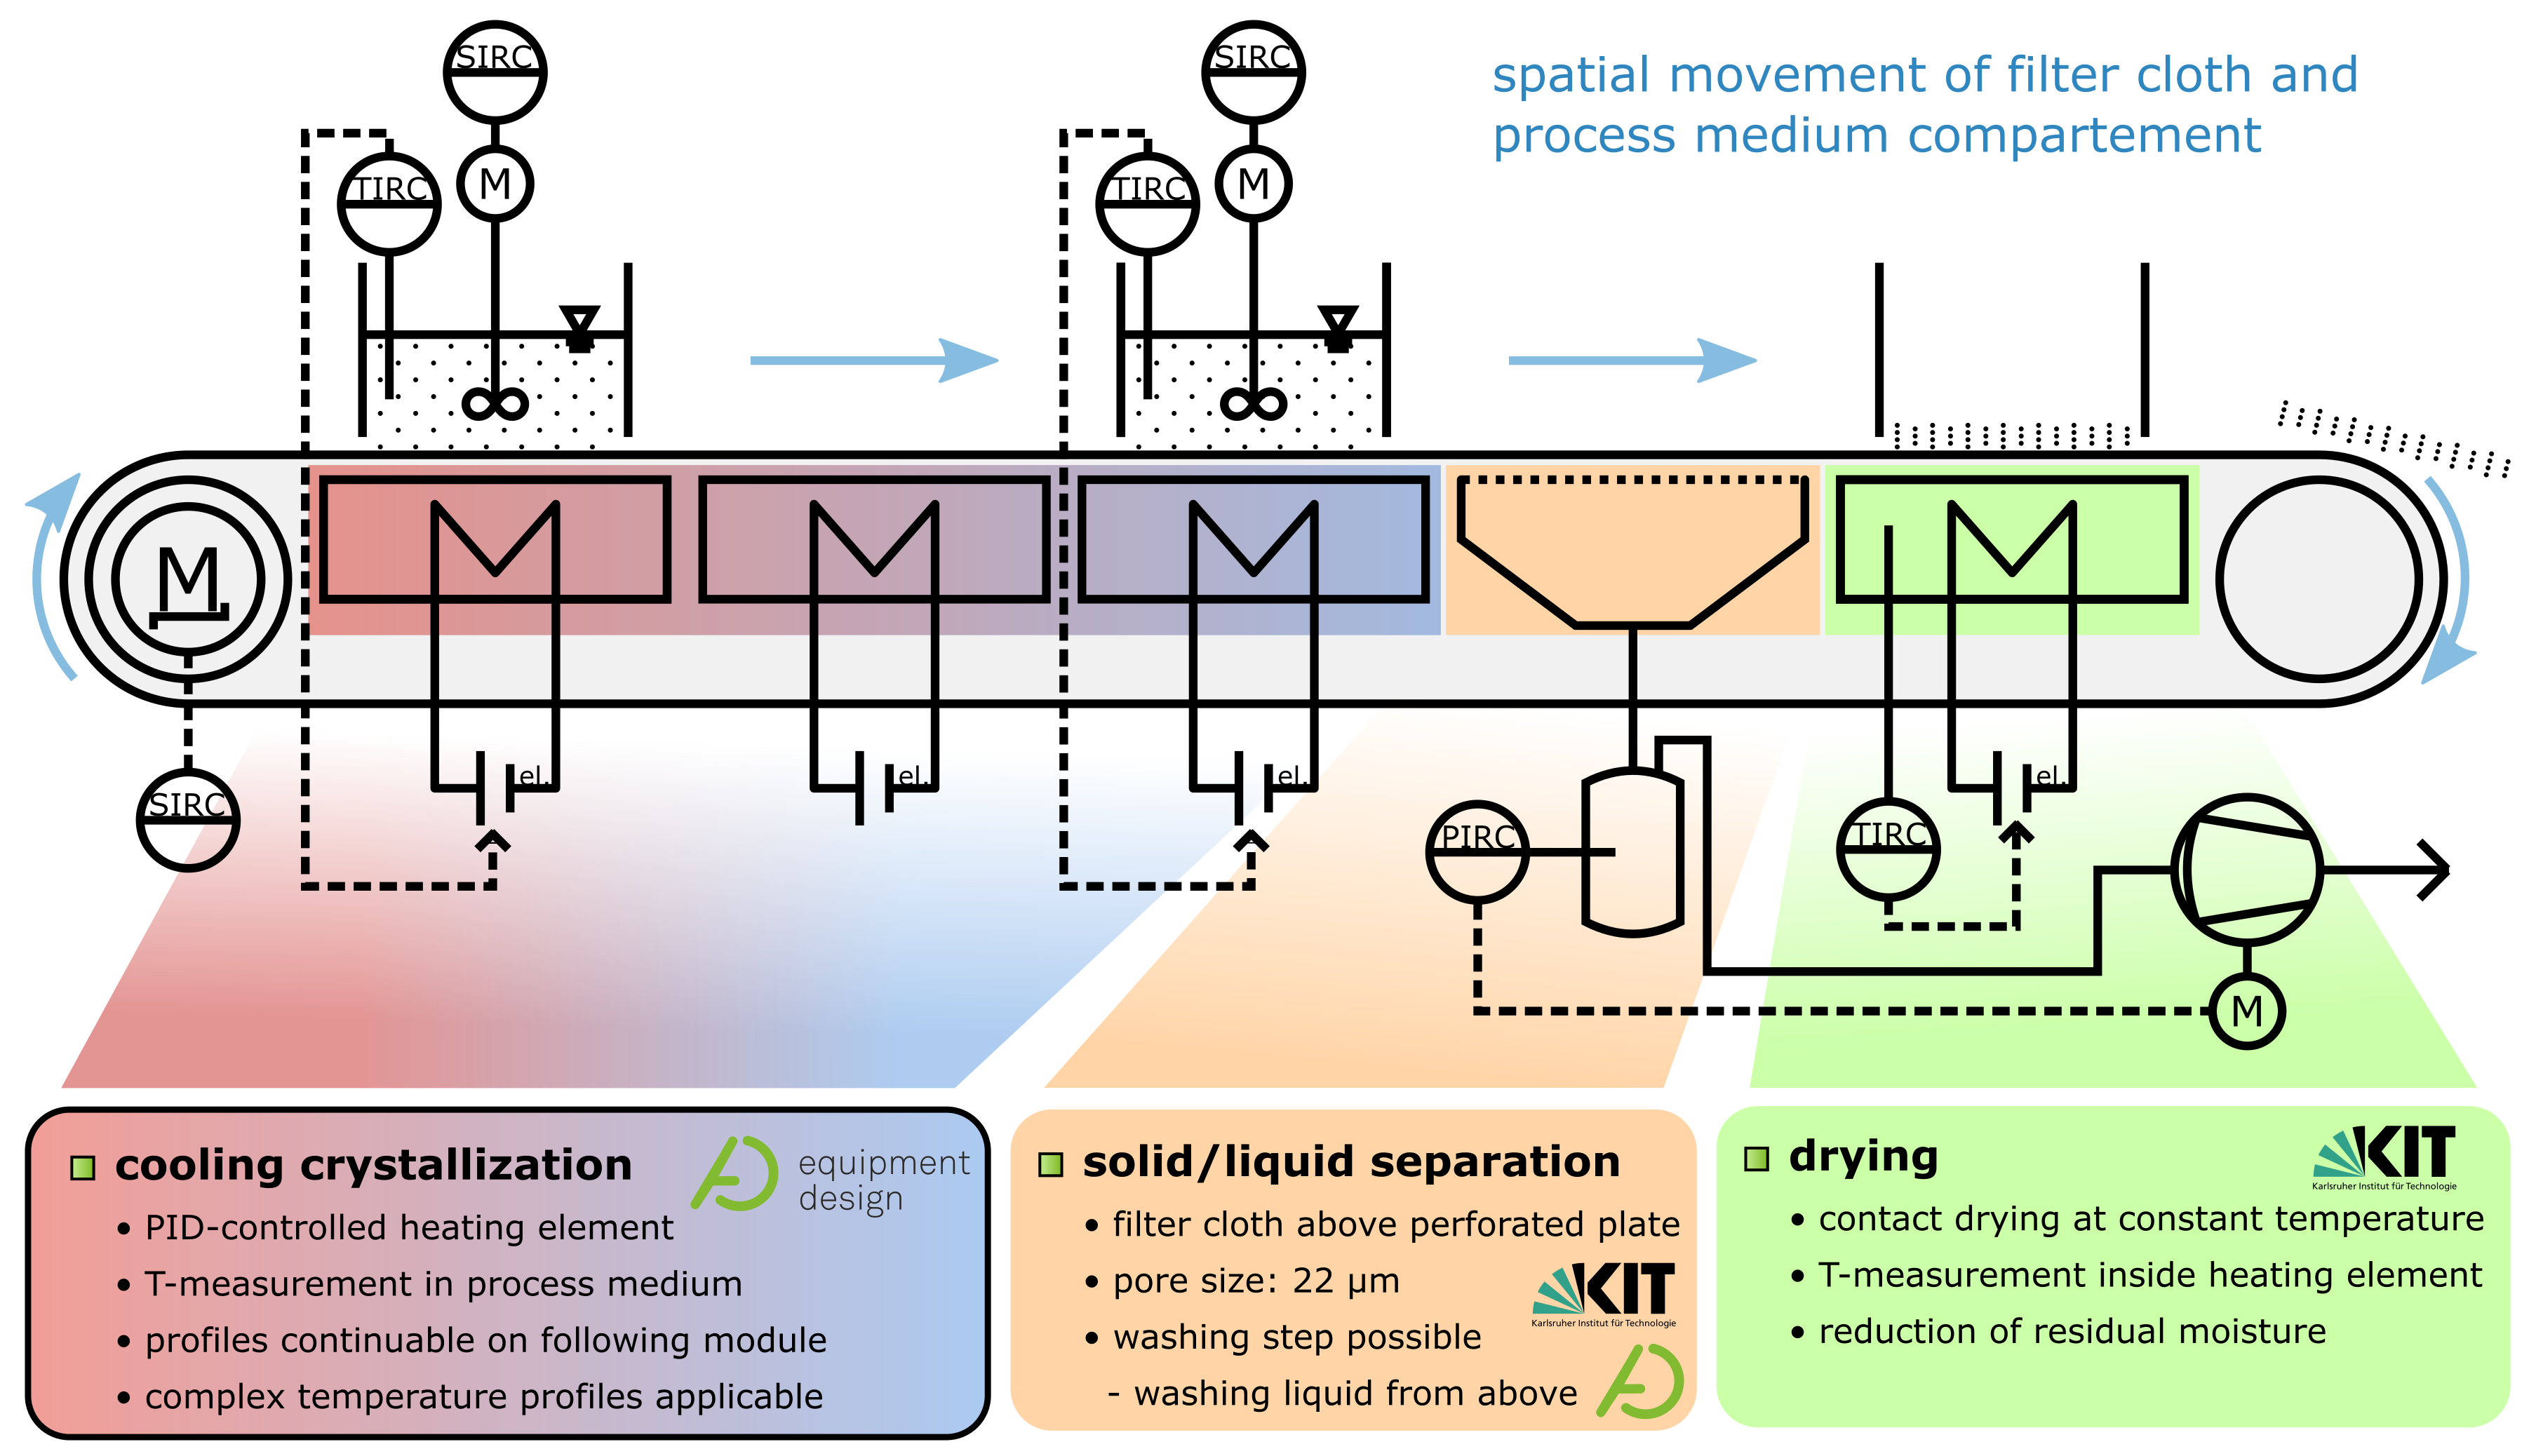
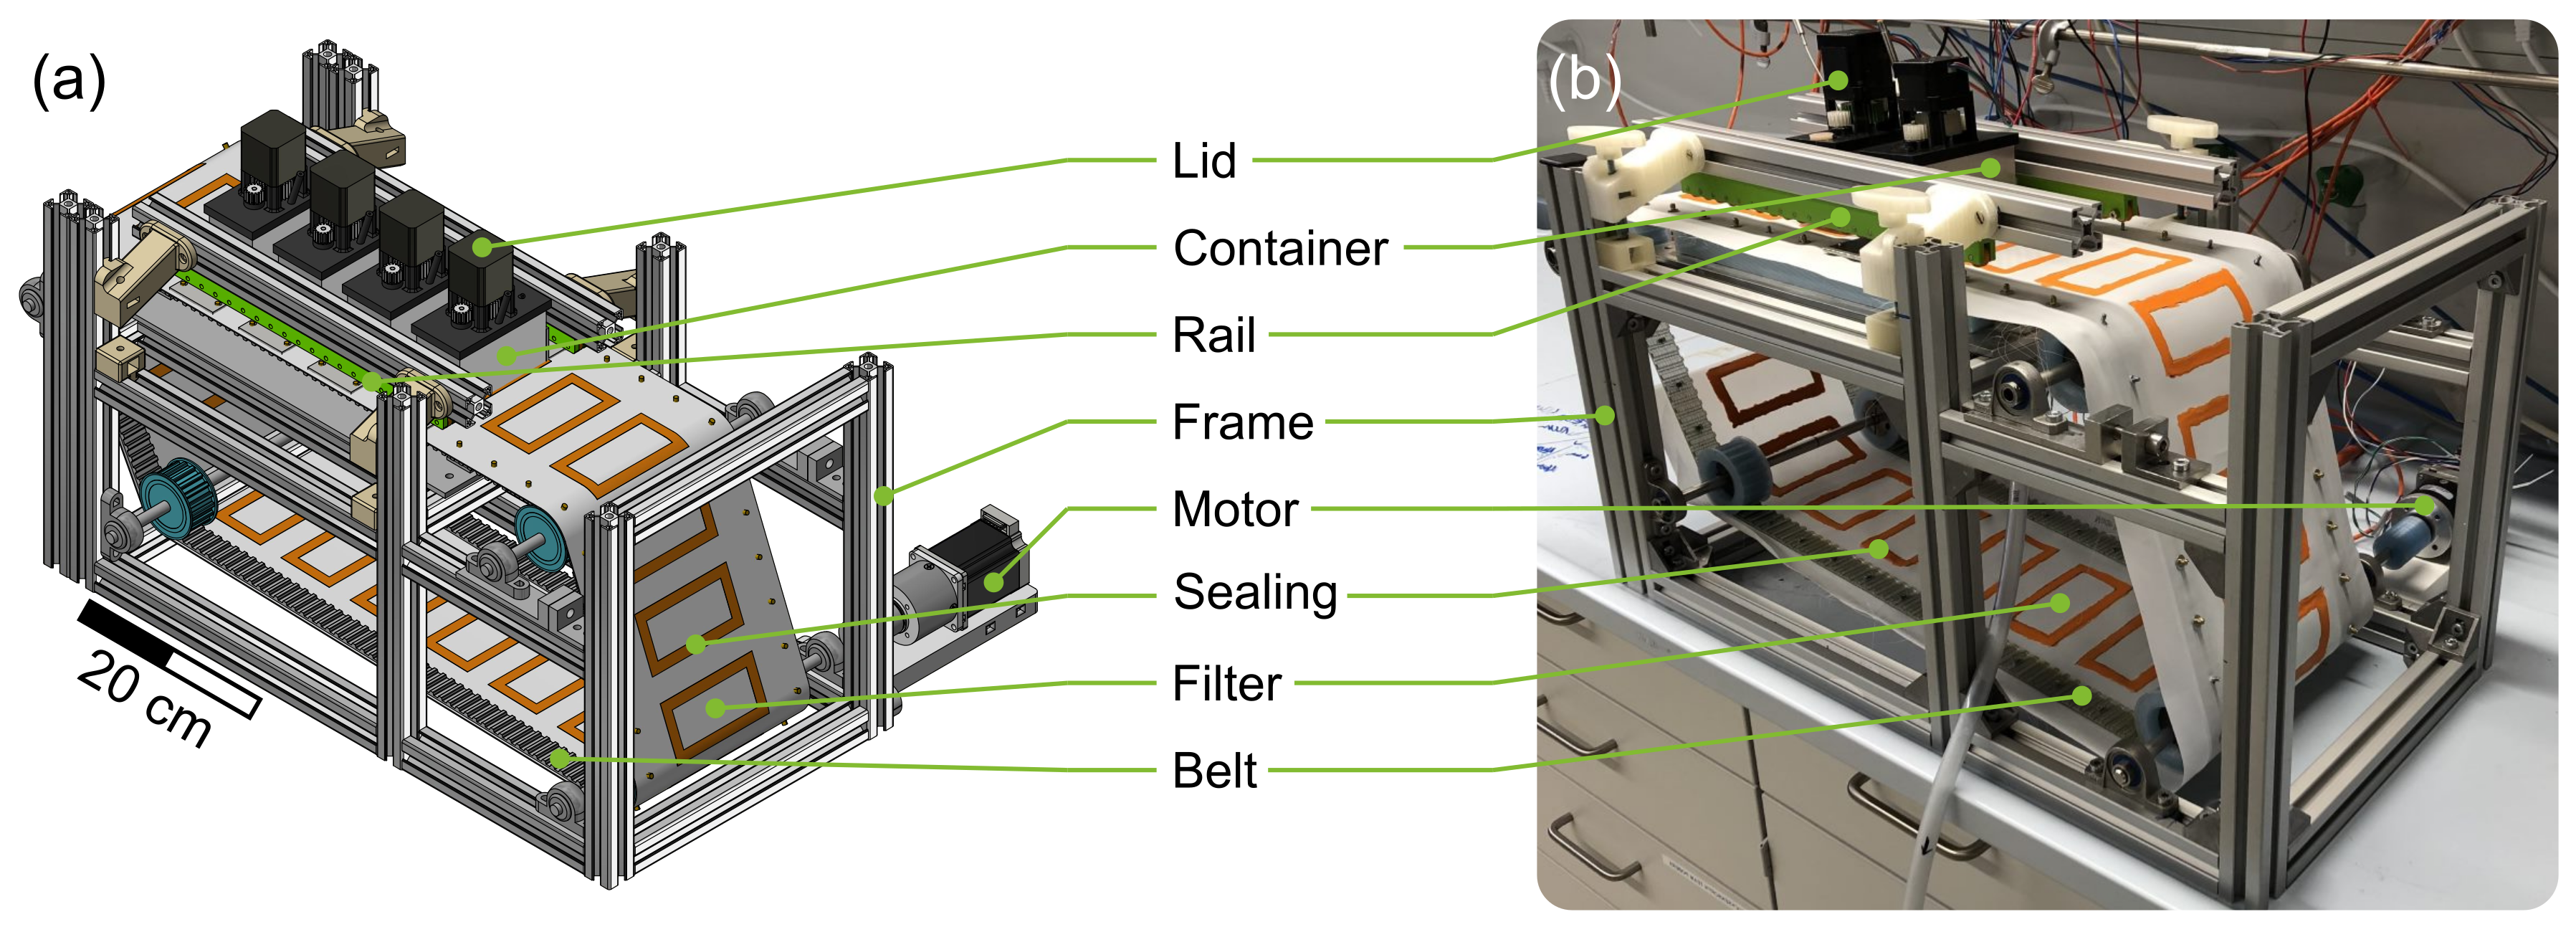
2.1. Quasi Continuous Filter Belt Crystallizer Design

The working principle of the apparatus operated in this work has been described and demonstrated in publications of Löbnitz [27] and Dobler et al. [26]. For this contribution, a modified version of the QCFBC has been custom-built for lab fume hood operation. Both versions are and were operated and investigated within the ENPRO2.0 project VoPa (Vollintegrierte Partikelerzeugung, -wachstum und -abscheidung in einer kontinuierlichen Pilotanlage—Fully integrated particle generation, growth and separation in a continuous pilot plant) and preceding projects. The investigated QCFBC is derived from a horizontal belt filter. The process medium, segmented into individual batch containers, is incrementally moved from one functional unit to the next. In Figure 1, the direction of movement is from left to right with successive operation steps. Process medium and container pass three temperature modules responsible for temperature control. An illustration of this can be found in Video S1. Due to the integrated and modular design, the plant can be individually adjusted (cycle time, residence time, temperature profiles, and drying temperature) for specific requirements to the product properties while minimizing transportation routes and shelf times of intermediate products.
To suitably operate the apparatus, sucrose/water has been selected as a model substance system for process characterization purposes and to stay consistent with results from previous works [26,27].

2.2. Experimental Setup

The basic framework of the plant consists of aluminum profiles (30 mm × 30 mm Bosch Rexroth AG, Lohr am Main, Germany). The functional units (60 mm × 122 mm × 14 mm [L × W × H]) containing the process medium are positioned in a polyethylene (PE) frame and accessible from below. In Figure 2a four containers (aluminum, outer dimensions: 100 mm × 50 mm × 60 mm [L × W × H], 4 mm wall thickness) that are positioned on the modules with the filter belt (SEFAR TETEX® MONO 07-76-SK 022, Sefar AG, Heiden, Switzerland) in between can be observed. Two different sealing strategies were applied simultaneously to prevent leakage of the containing process medium. First, liquid rubber (orange liquid rubber, mibenco GmbH, Karlstein am Main, Germany) was applied to the filter at the position of the containers standing on top of the modules. Second, a silicone seal was applied manually to the bottom of each container. During operation, both seals are in contact. In combination with the rails (green horizontal bars in Figure 2) that apply contact pressure to the containers, leakage is prevented while maintaining the container moveable between the functional units. A stepper motor (ST4118, Nanotec Electronic GmbH & Co. KG, Feldkirchen, Germany) incrementally moves the filter belt and the crystallization containers at the same time with the desired speed to a target position. The smallest increment possible corresponds to the width of a module. An image of the entire setup with preparation container and vacuum pump (PC3001 VARIO p r o , VACUUBRAND GmbH & Co KG, Wertheim, Germany) can be found in the Figure S1. The temperature control module, of which three are consecutively installed in the particle generation section of the plant, can be seen in Figure 3. A modular and 3D-printed lid from acrylonitrile butadiene styrene (ABS, printed on Intamsys Funmat HT pro) is provided for each container. It holds the temperature sensor, stirrer motor (Nema17, Nanotec Electronic GmbH & Co. KG, Feldkirchen, Germany), transmission gears (PLA, printed on Ultimaker S5, gear ratio; 15:31), and two stirrers (6 blades, pitch blade stirrer, 45°, 19 mm outer diameter, 6 mm shaft, 3D-printed, ABS, printed on Ultimaker S5, coated with mibenco liquid rubber). The stirrers are designed according to DIN 28131 [28] for a stirred vessel with an equivalent diameter of D equi = 56.42 mm, which was calculated from a 50 mm × 50 mm square. They are positioned in the centers of the two squares (50 mm × 50 mm). The aluminum housing of the module is hollow and provides space for two Peltier elements (40 mm × 40 mm × 4 mm, TEC1 127 05, Thermonamic Electronics Corp., Ltd., Nanchang, China) and a heat exchanger (aluminum, 40 mm × 80 mm × 12 mm) so that the process medium is separated from the Peltier elements by 6 mm of aluminum. Two Pt100 temperature sensors (Pt-B-100-2, Rössel Messtechnik GmbH, Dresden, Germany) are provided. One is positioned in the aluminum housing module, while the second sensor is immersed in the process medium and held in the middle of the container by the lid (cf. Figure 3). Therefore, both temperatures can be measured, recorded, and used as an input for temperature control. Measurements and process control are executed via the lab automation system LabManager® with the corresponding software LabVision® (HiTec Zang GmbH, Herzogenrath, Germany).
The model substance system sucrose (Südzucker AG, Mannheim, Germany) with deionized water (<10 µS · cm 1 ) as solvent was prepared according to the correlation for the saturation line from Vavrinecz [29] with T as temperature in °C:
w * [ g s u c c g s o l ] = 64.47 + 8.222 · 10 2 · T + 1.6169 · 10 2 · T 2 1.558 · 10 6 · T 2 4.63 · 10 8 · T 4 , T in C
Solutions were prepared overnight and kept at 10 K above the desired saturation temperature in a 1 L double-jacketed, stirred, and temperature-controlled (ministat 125, Huber Kältemaschinenbau AG, Offenburg, Germany) storage glass tank. For experiments that required seed crystals, sucrose was dry pestled and sieved (Test Sieve Retsch, RETSCH GmbH, Haan, Germany) to obtain a defined size fraction. Here, sieves with 63 µm, 90 µm, 125 µm, 180 µm mesh sizes were used, and three different sieve fractions were received.

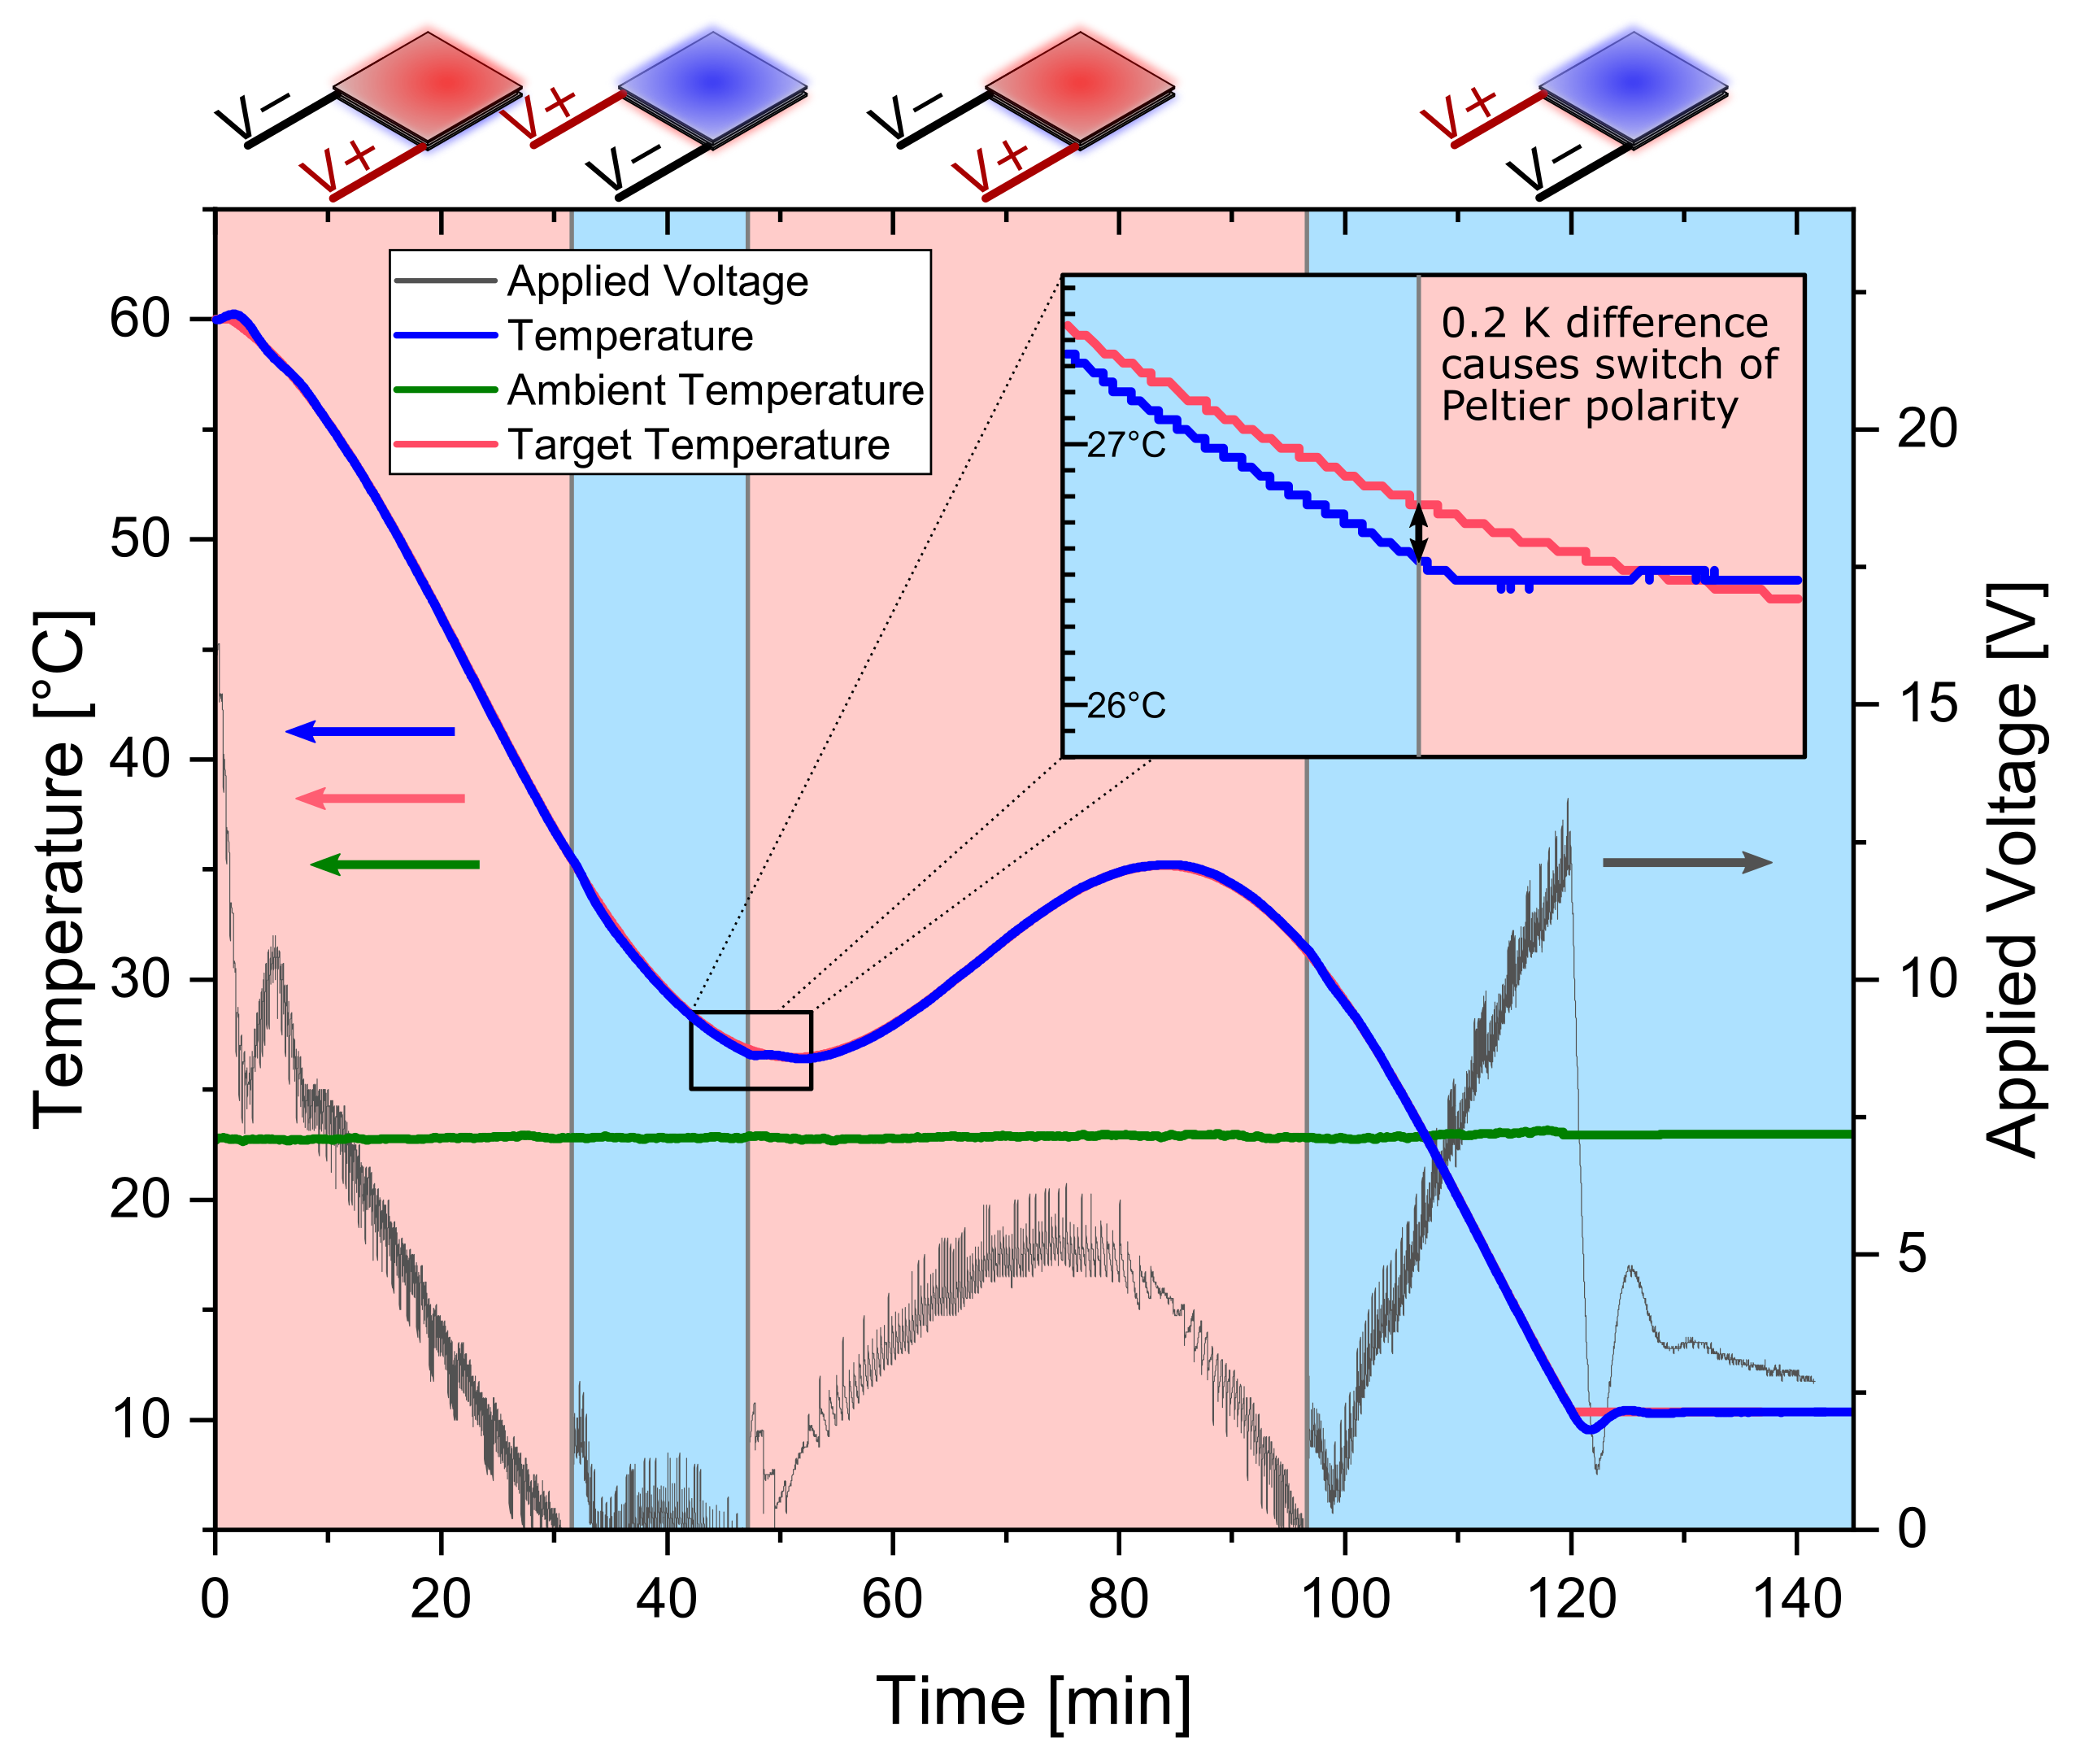
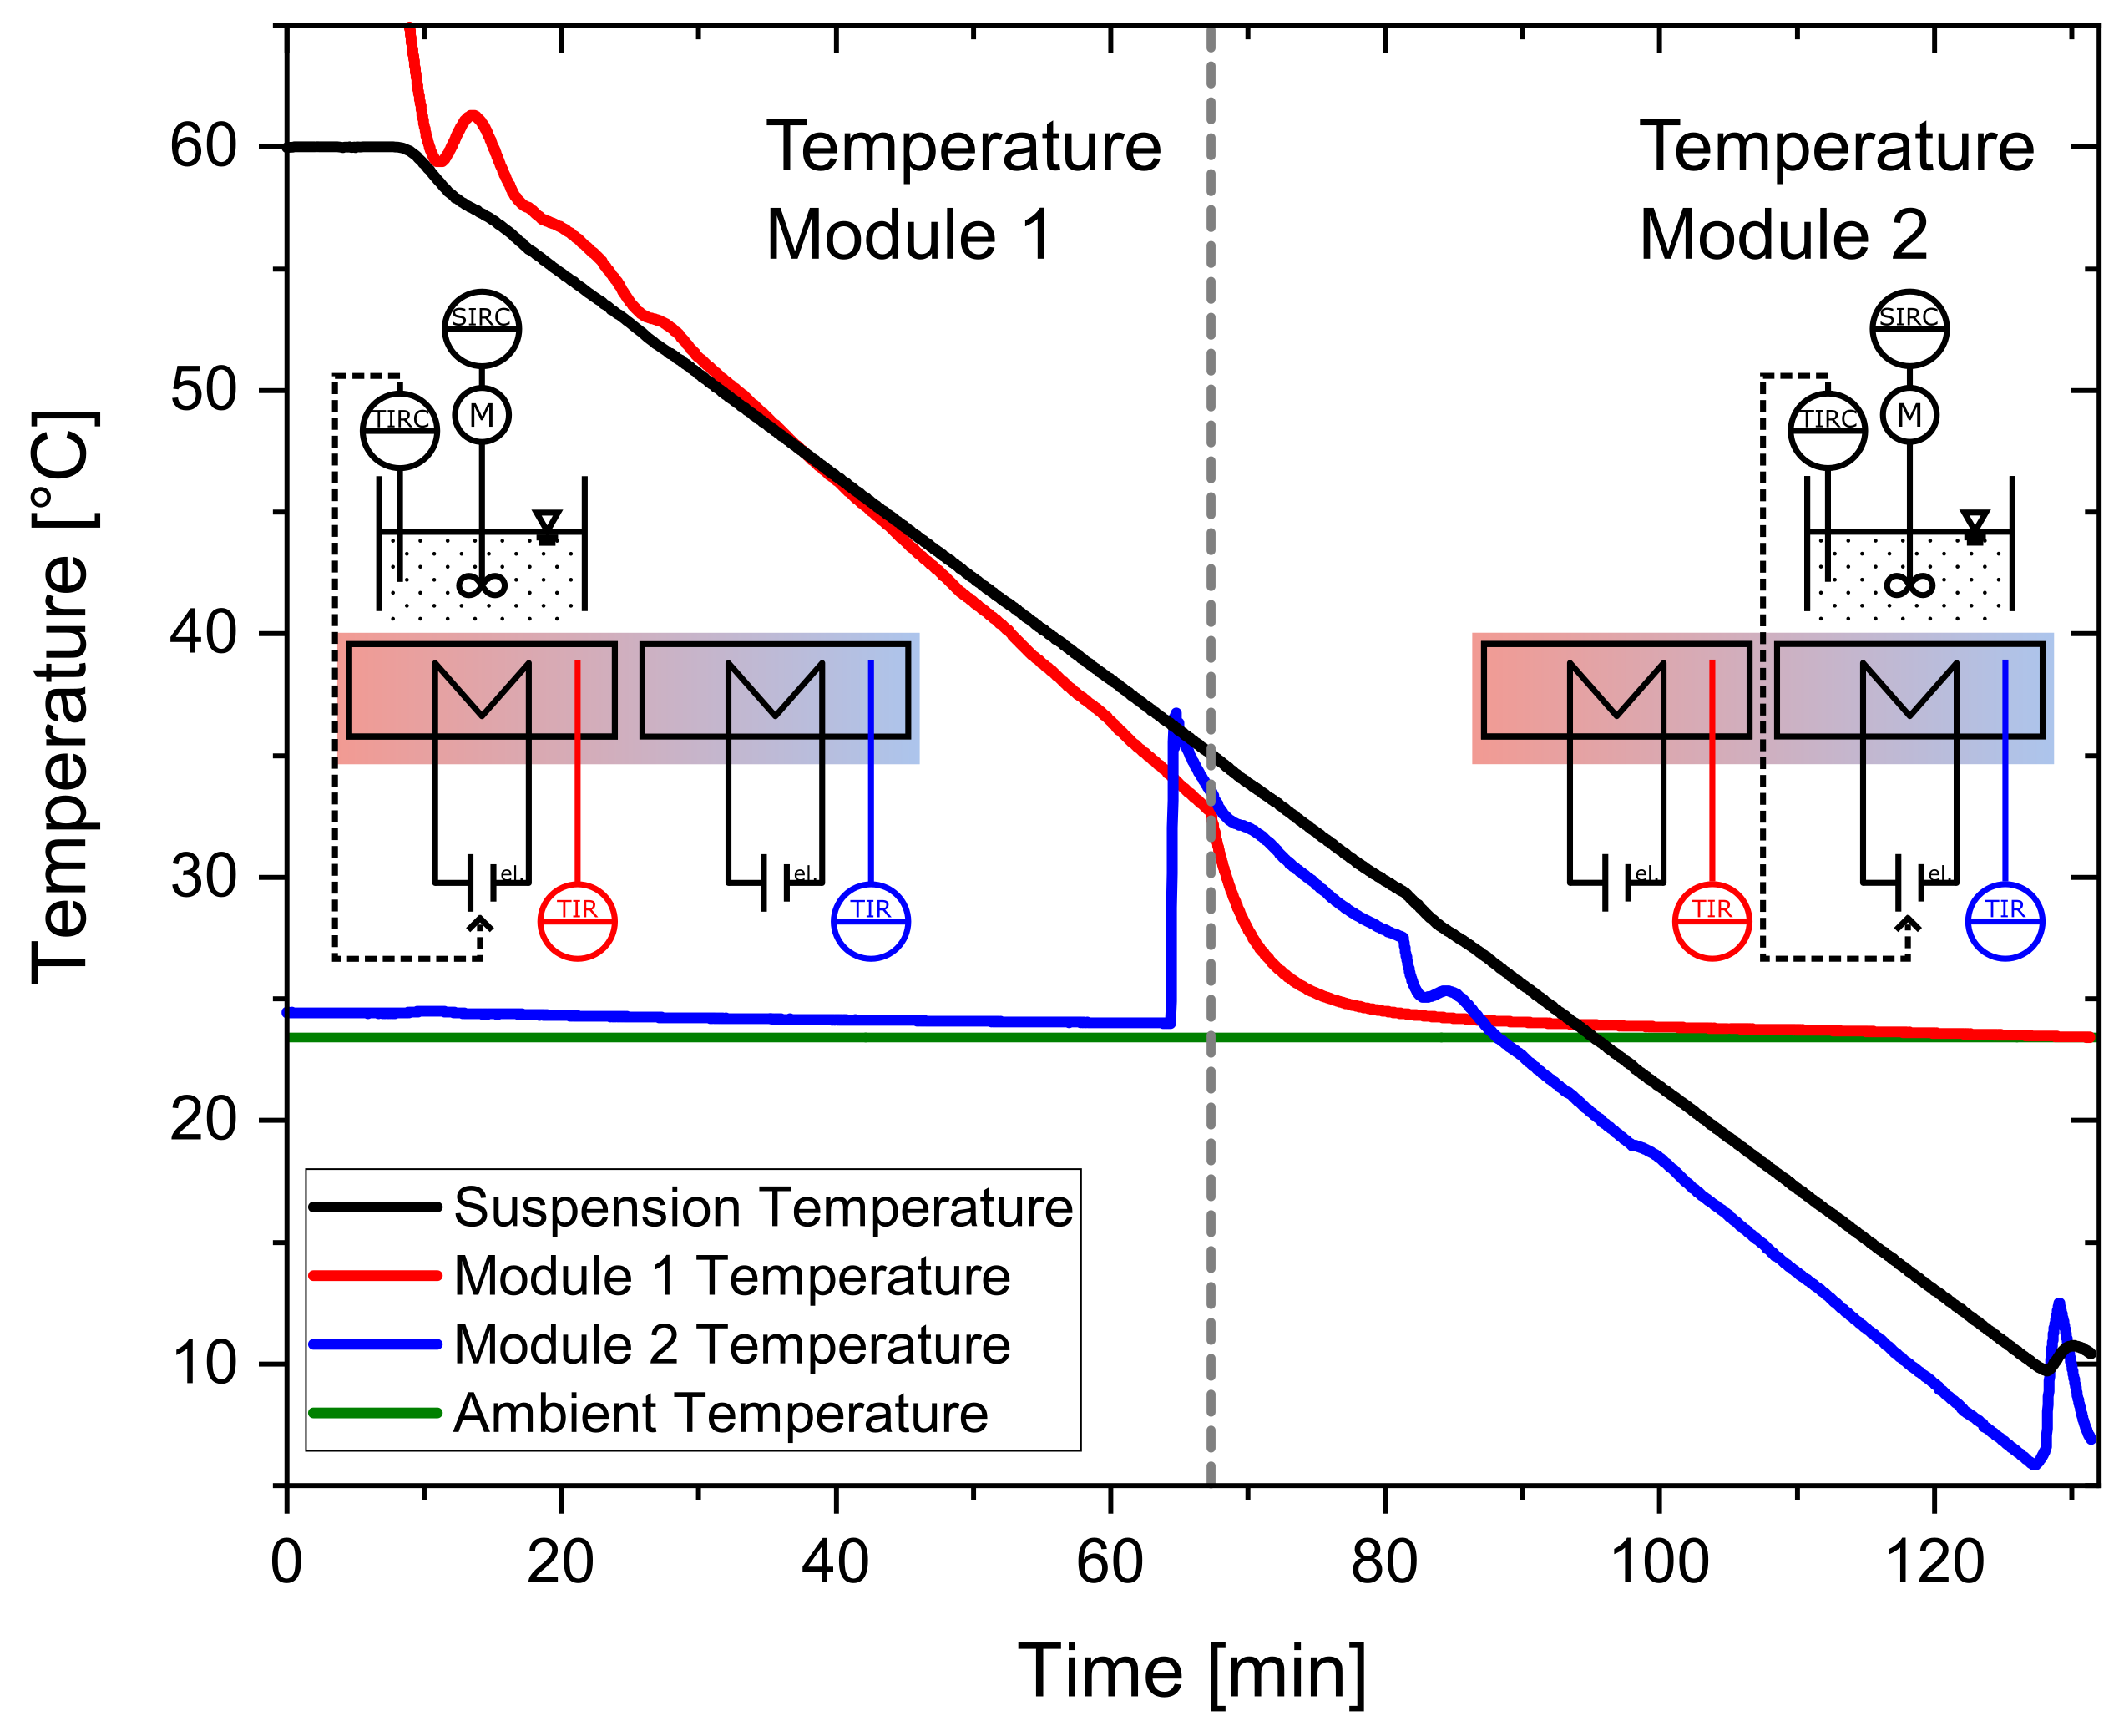
2.3. Temperature Control

The temperature control modules are the first functional units passed by the process medium. These can either control the temperature of the module or the temperature of the process medium by Peltier elements.

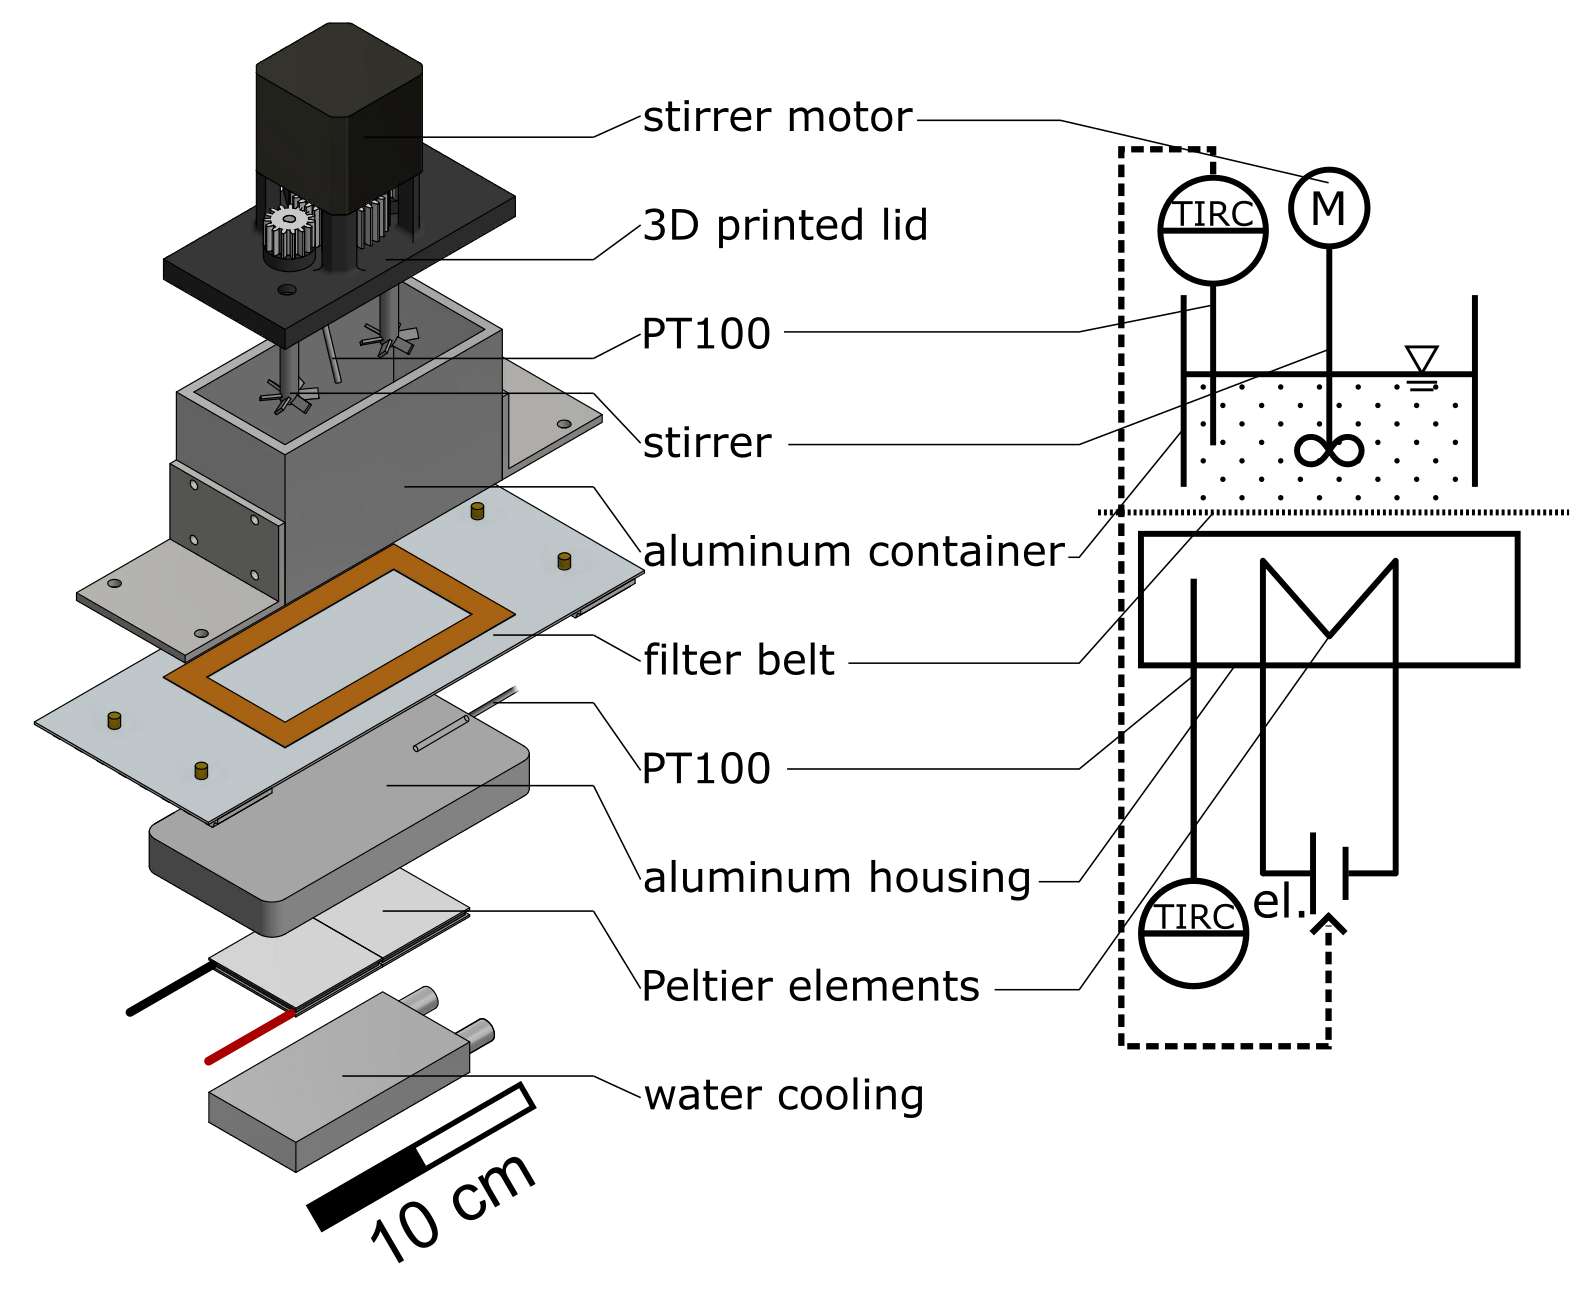
2.3.1. Peltier Elements

Peltier elements are thermoelectric components made from two different semiconductors between a ceramic sandwich. A temperature gradient between the two sides of the element is created upon applying an electrical current. Therefore, it can act as an electric heat pump. Switching the polarity of the applied electrical current, the direction of the heat pump changes. Hence, the Peltier element can be used to either supply or withdraw heat from a system simply by changing the polarity of the electrical power supply. Heating and cooling capabilities can be found in Figure S2. For the control of the temperature in the suspension, temperature profiles were programmed into the LabManager®. A block diagram of the PID controller responsible for controlling the output voltage of the power supply is depicted in Figure S3. Two separate PID controllers, one for heating and one for cooling, are used. According to the switch conditions, either one of them is active. The control loop actively decides whether heat has to be supplied or drawn from the suspension to follow the desired temperature profile. It is switched between heating and cooling whenever a temperature difference between actual and target temperature exceeds a limit of 0.2 K. As an example, this has been plotted for an oscillating temperature profile in Figure 4.
For the temperature profiles investigated in this work, there would only be one temperature module necessary. Looking at an increased throughput and an integrated operation with a parallel operation of several containers; however, the process containers need to be moved from one functional module to the next (e.g., from crystallization to filtration). Therefore, temperature profiles need to be continued on the subsequent temperature module. This is illustrated in Figure 5. Here the temperatures of the suspension (black) and the temperatures of Module 1 (red) and Module 2 (blue) are plotted. The programmed temperature profile of the solution is linear from 60 °C to 10 °C within 120 min. At 60 min, the container changes its position from the first module (Module 1) to the subsequent one (Module 2). Five minutes before the scheduled locomotion of the container, Module 2 starts to heat up to the temperature of Module 1. At 60 min, the actuator of the controller changes from Module 1 to Module 2, so that the occupied module is supplied with controlled electrical power. As it can be observed in Figure 5, it is possible to continue the linear temperature profile on Module 2. Therefore, for the precise continuation of the temperature profile in this operation mode, every second module of the plant can be occupied when looking at a continuous operation.

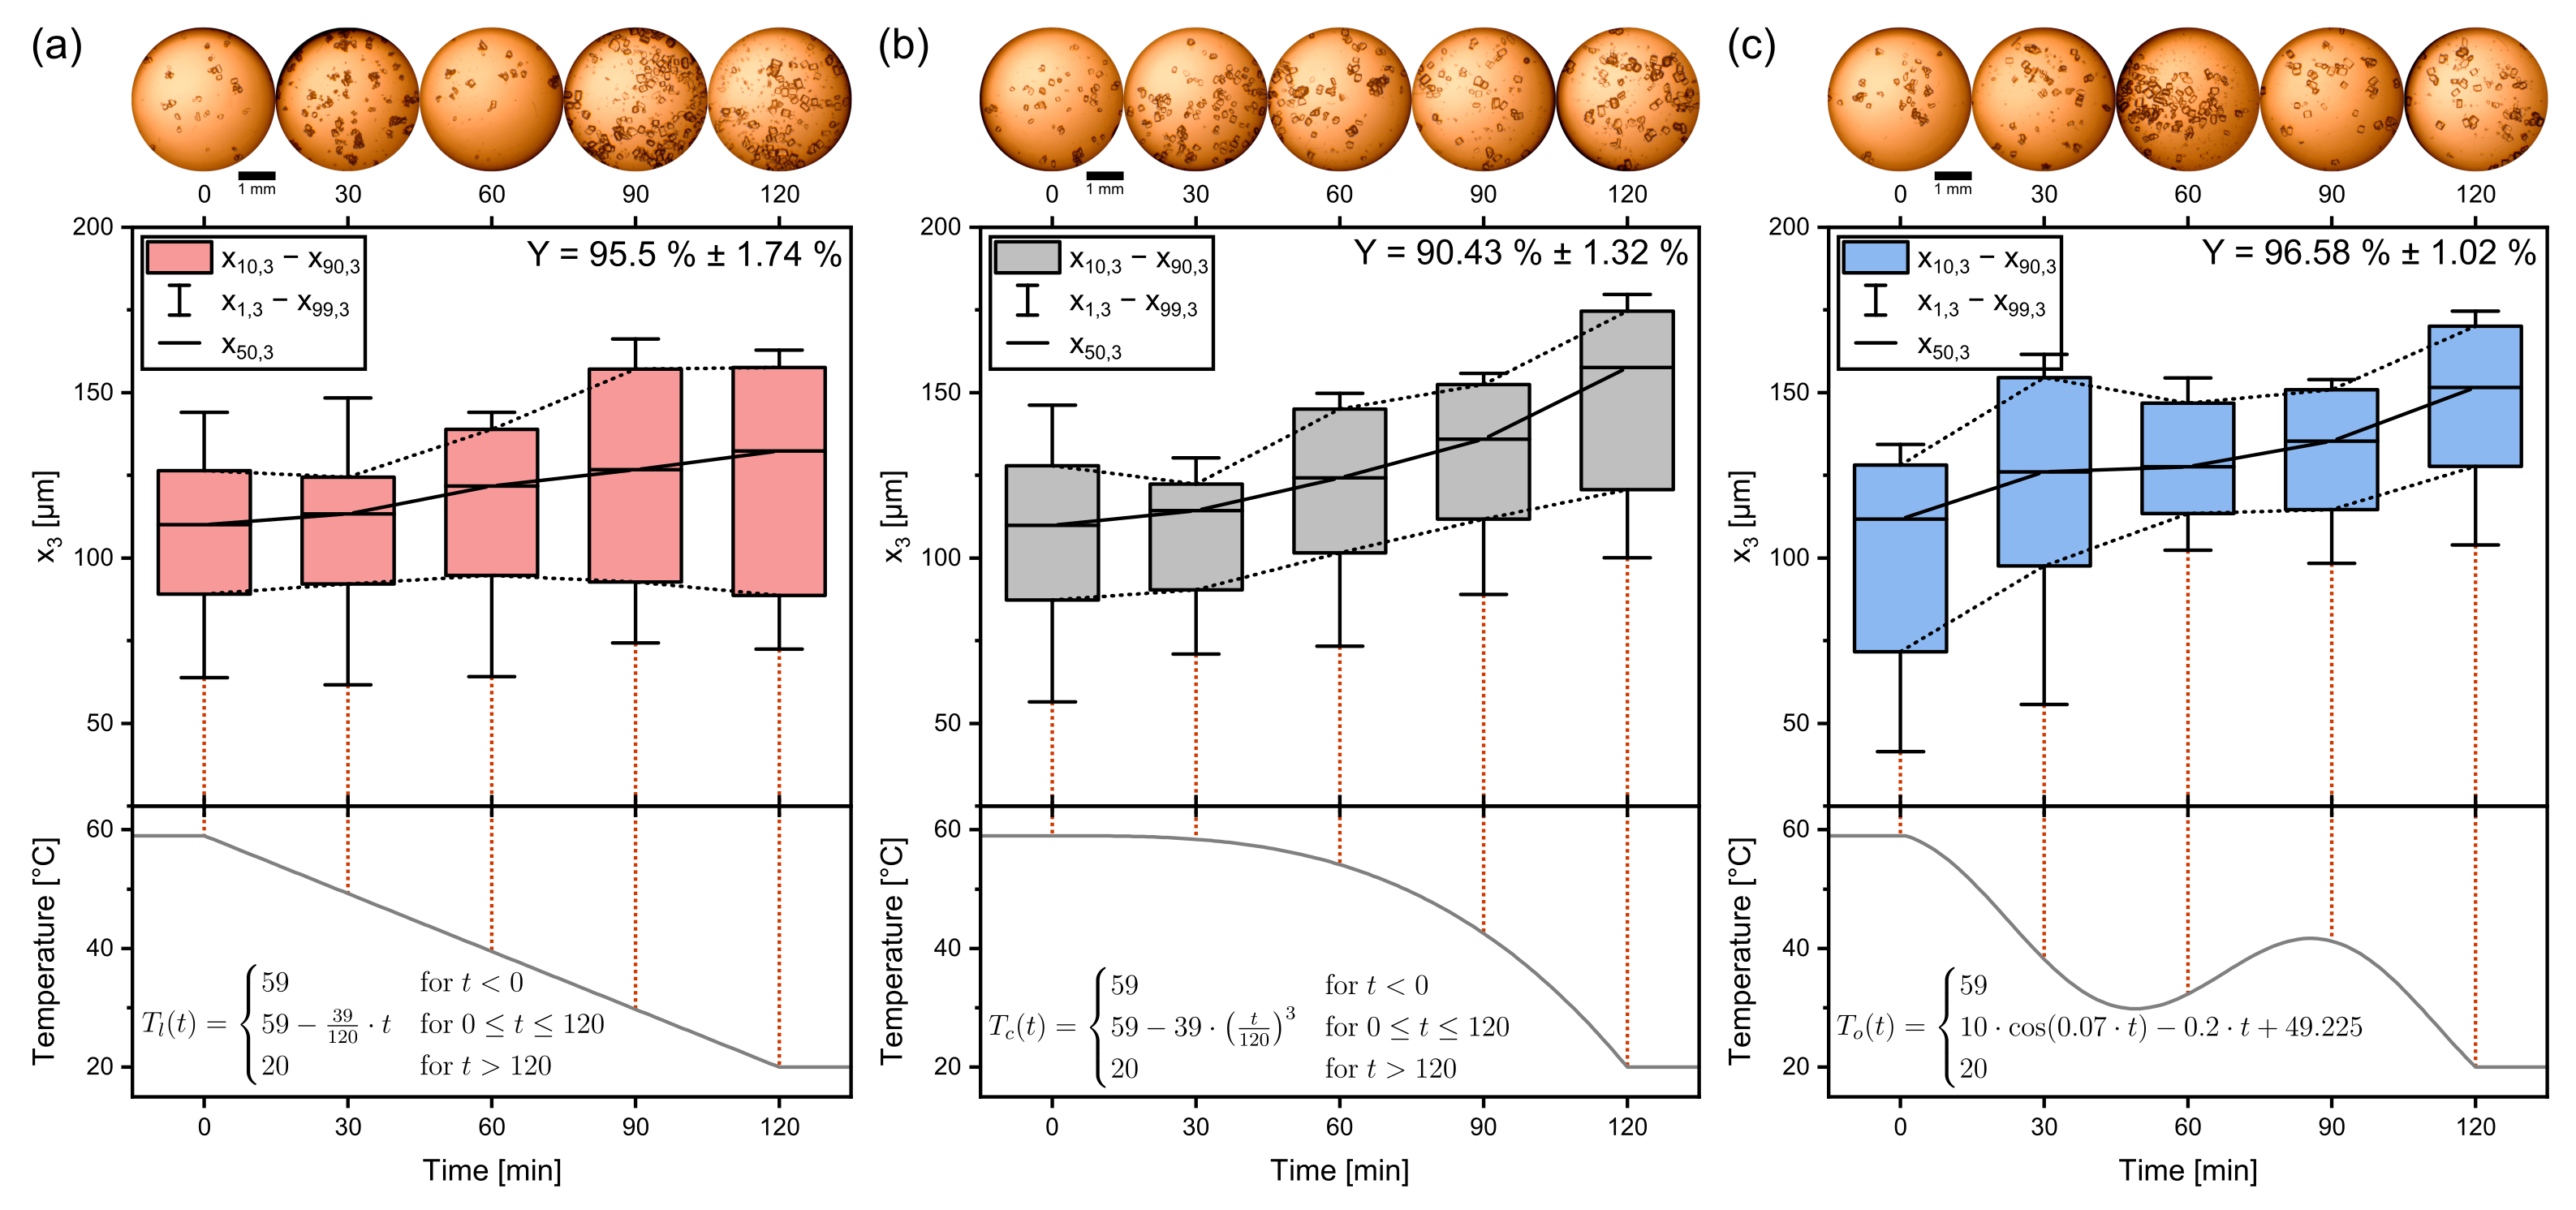
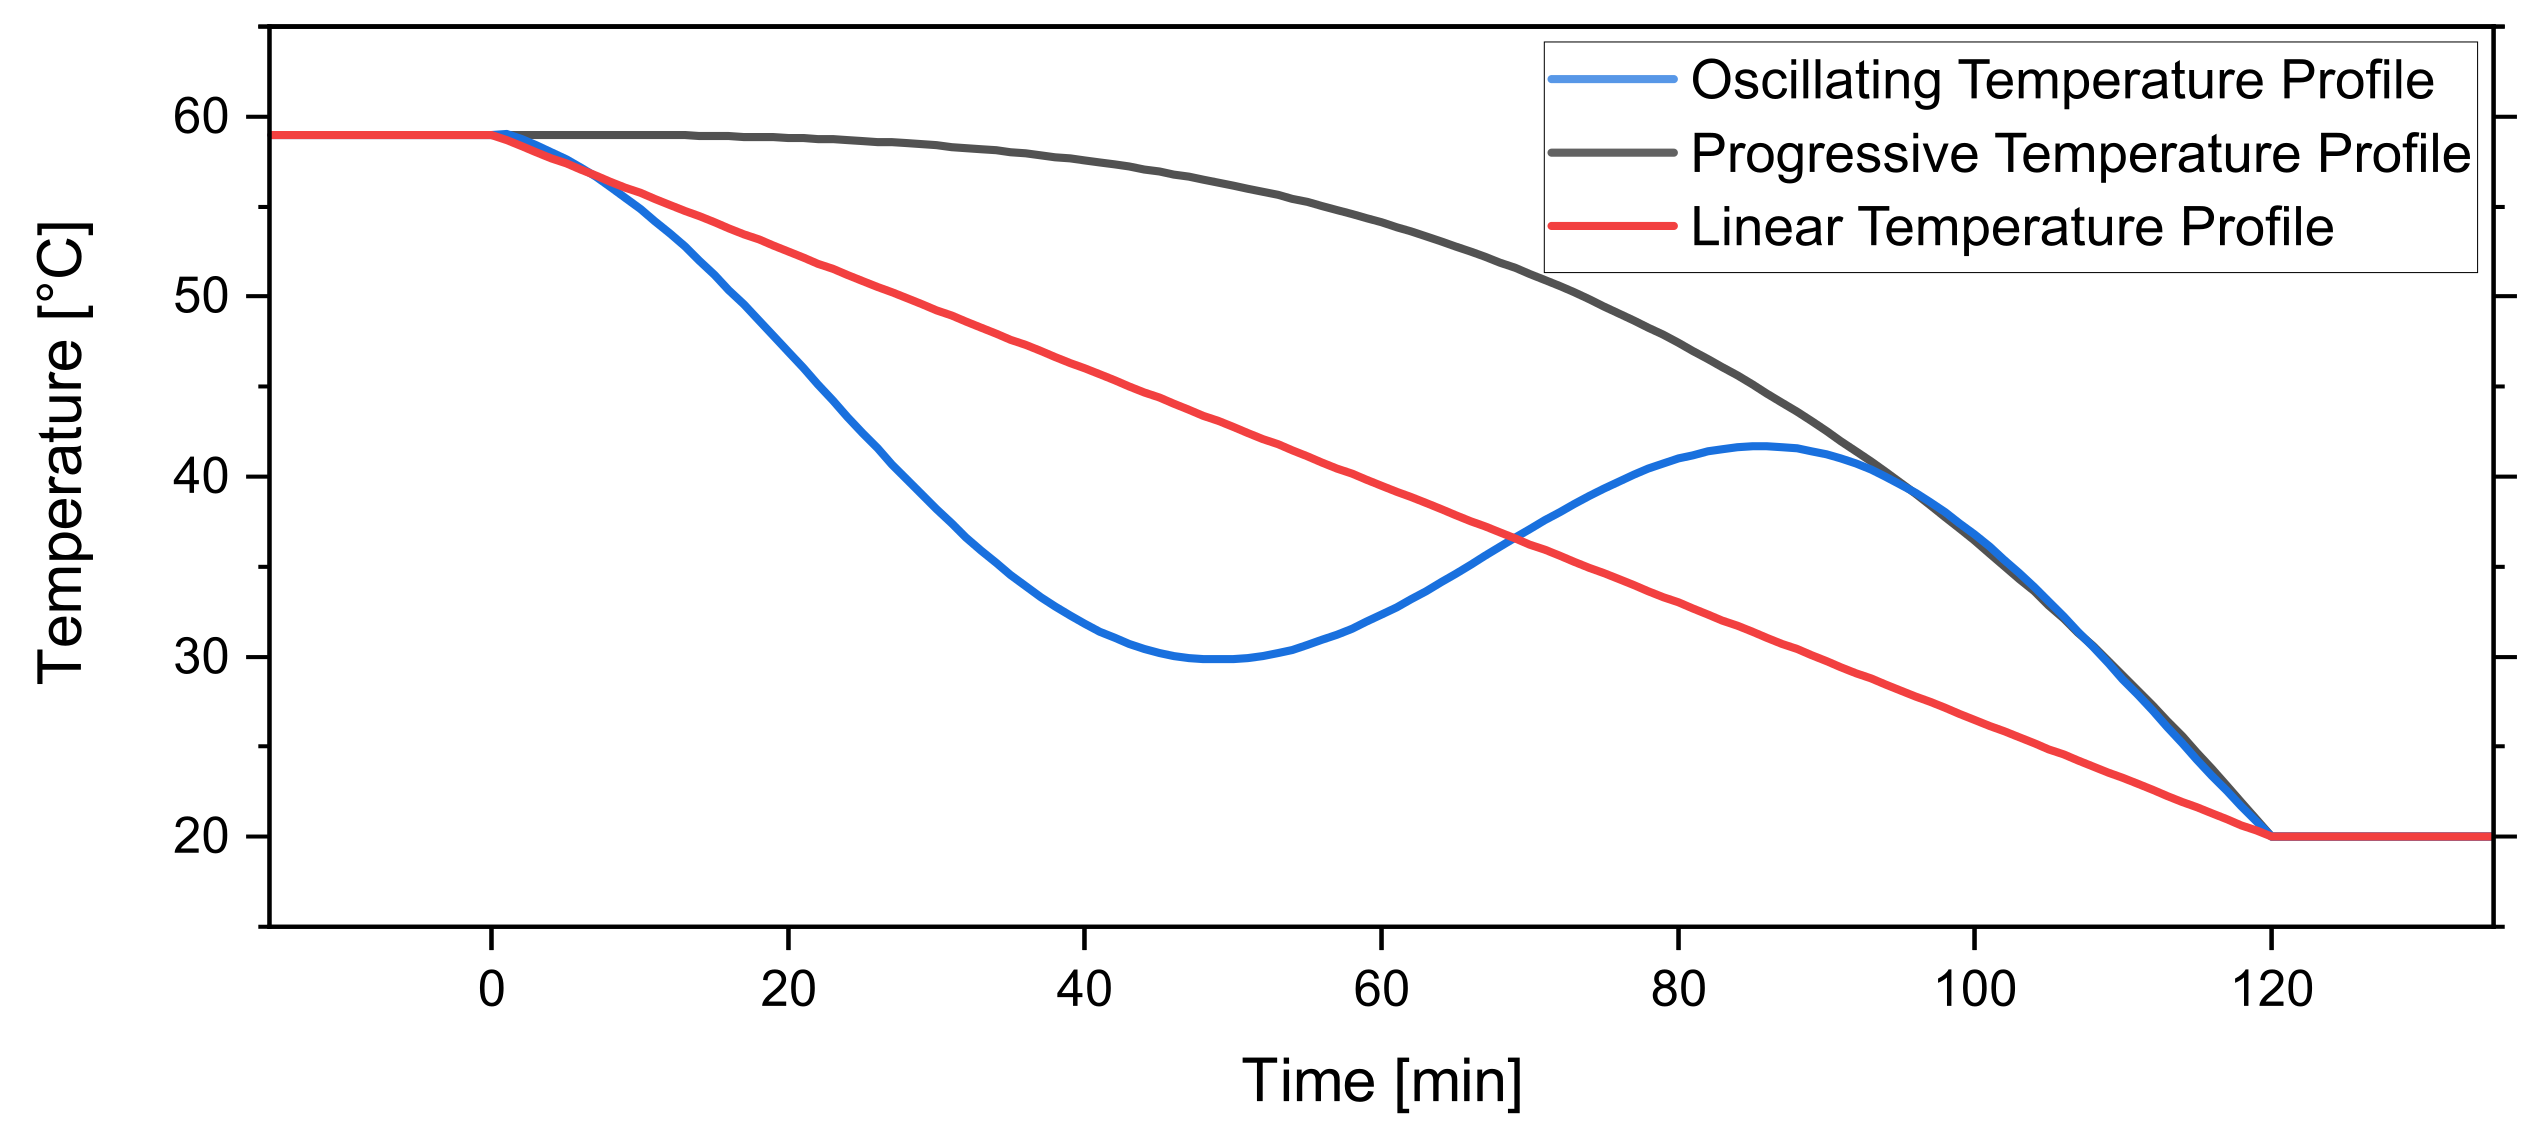
2.3.2. Temperature Profiles

As a commonly implemented temperature profile the linear decrease T l ( t ) (Equation (2)) from T start to T end (in °C) during the process time t process (in min) with t (in min) is used. This is a widely used cooling strategy and makes comparisons between different crystallization equipment easy:
T l ( t ) = T start , if t < 0 T start ( T start T end ) · t t process , if 0 t t process T end , if t > t process
The second temperature profile is the “progressive” or “cubic” profile T p ( t ) (Equation (3)). As the increase in available crystal surface area during a crystallization process increases the supersaturation of the solution can be decreased faster [30,31,32]:
T p ( t ) = T start , if t < 0 T start ( T start T end ) · t t process 3 , if 0 t t process T end , if t > t process
The third temperature is the oscillating profile T o ( t ) (Equation (4)). As temperature cycling is a promising strategy to increase the product quality by resolution of fines in the suspension; therefore, narrowing the distribution width [33,34,35,36], the oscillating profile was implemented.
T o ( t ) = T start , if t < 0 A · cos 8.4 · t t process B · t t process + C , if 0 t t process T end , if t > t process
where:
A = 10 B = 0.834 · T start T end 5.611 C = 0.834 · T start
By increasing the temperature of the system to reach an unsaturated state, fine crystals can resolve in the solution. The dissolved crystal mass can then go towards the growth of the remaining crystals in the subsequent cooling period. Figure 6 shows the graph of the three profiles.
Studies of natural or uncontrolled cooling were not performed because such crystallizations often result in a broad product crystal size distribution. The growth of existing seed crystals then competes with the formation of nuclei, which arise because the supersaturation surpasses the metastable limit [21].

2.3.3. Experimental Procedure

For the preparation of the experiments, 300 mL of sucrose solution (saturated at 60 °C) were prepared and kept at 70 °C overnight. This way, a solution for 2–3 experiments on the following day was prepared. 100 g (100.022 g ± 0.032 g) of the sucrose solution was transferred to a preheated beaker and poured into the processing compartment positioned on the first temperature module. The container lid with stirrers and temperature sensor was then positioned on top of the container. The stirrers were turned on (400 rpm), and the temperature of the solution was set to 59 °C (1 K below saturation) to reach a slight supersaturation not to dissolve the seed crystals. To ensure homogeneous distribution of seed crystals in the suspension 90 s before starting the temperature profile, seed crystals were manually added to the suspension via a funnel using a dedicated hole in the container lid. The seed crystal mass m SC was calculated according to:
ω SC = m SC E C M max ,
with the seed crystal fraction ω SC and the maximum excess crystal mass E C M max according to:
E C M max = ( X s , start X s , end , theo . ) · m ML · x aq
This arises from the mass of the mother liquor m ML , the initial loading X s , start , the theoretical final loading in thermodynamic equilibrium X s , end , theo . , and the water content x aq . E C M max is the maximum crystal mass that is achievable in a cooling crystallization driven by the respecting temperature gradient. Within the scope of this work, seed crystal fractions ( ω SC ) of 0.0125 g · g E C M 1 , 0.025 g · g E C M 1 , and 0.05 g · g E C M 1 were investigated.
During the crystallization process, five samples of 0.25 mL suspension were taken with a 1 mL single-use pipette (VWR International, Radnor, PA, USA) through the hole in the container lid. Samples were taken with equidistant time intervals with sample 1 at 0 min and sample 5 at t process . The samples were then prepared for analysis and analyzed for the sample’s crystal size distribution (CSD). After the container passes all three temperature modules, it is positioned on the filtration module to separate the mother liquor from the product crystals. The mass of the filter cake is then further considered to calculate process yields.

2.3.4. Analytic

To analyze the samples mentioned above for their CSD, the sedimentation method with the LUMi Reader® PSA 453 (LUM GmbH, Berlin, Germany) was used. The standard operating procedures (SOP) for the same device [17,37] were adapted to the sucrose/water system by using ethanol as the washing liquid and liquid phase during the sedimentation analysis. Sucorse has a low solubility in ethanol [38]. In [17,37] samples were taken at the process’s end, and the product crystals were analyzed in the sample solution. However, in this work, the viscosity of the solution at the end of the crystallization process was too high for proper analysis (viscosity sat. sucrose at 20 °C: 207.77 mPa · s) [39]. Crystals took too long to sediment for accurate analysis by the LUMiReader®. Therefore, a washing device and corresponding strategy were developed and validated for three relevant crystal sieve size distributions. Details can be found in Chapter S5.
As the filter belt crystallizer features an integrated filtration step, it is suitable to use the generated filter cake to determine the yield of each experiment gravimetrically. For this purpose, the filter cake is weighted (XA 205 Dual Range, Mettler Toldeo, Columbus, OH, USA) after filtration and after drying. Drying has been performed in a vacuum oven (Memmert VO400, Memmert GmbH & Co. KG, Schwabach, Germany) at 60 °C and 650 mbar. Drying was considered complete as soon as the mass of the filter cake changed by less than 0.001 g over 3 days but after 14 days at the earliest. The sucrose still dissolved in the mother liquor after filtration m succ , ML is calculated under the assumption that it is saturated:
m succ , ML = m evap . · X s , end , theo .
From the evaporated water m evap . and the loading X s , end , theo . sucrose mass coming from the mother liquor can be calculated. The mass of product crystals m crys . can then be calculated with the mass of the seed crystals m SC and the mass of the dry filter cake m FC .
m crys . = m FC m SC m succ , ML
Finally, the relative yield Y can be calculated according to
Y = m crys . E C M max · 100 %
Yields have been calculated for each experiment separately. Standard deviations are calculated from triple experiments.

3. Results and Discussion

The next chapter deals with the results of the characterization in terms of a parameter study. Here the direct operation mode will be considered. A comparison between direct and indirect operation modes can be found in Chapter S4. It should be noted that the color-coding throughout this chapter is consistent, and one color corresponds to one triplet of experiments. Crystal images can be found in Figure S7.

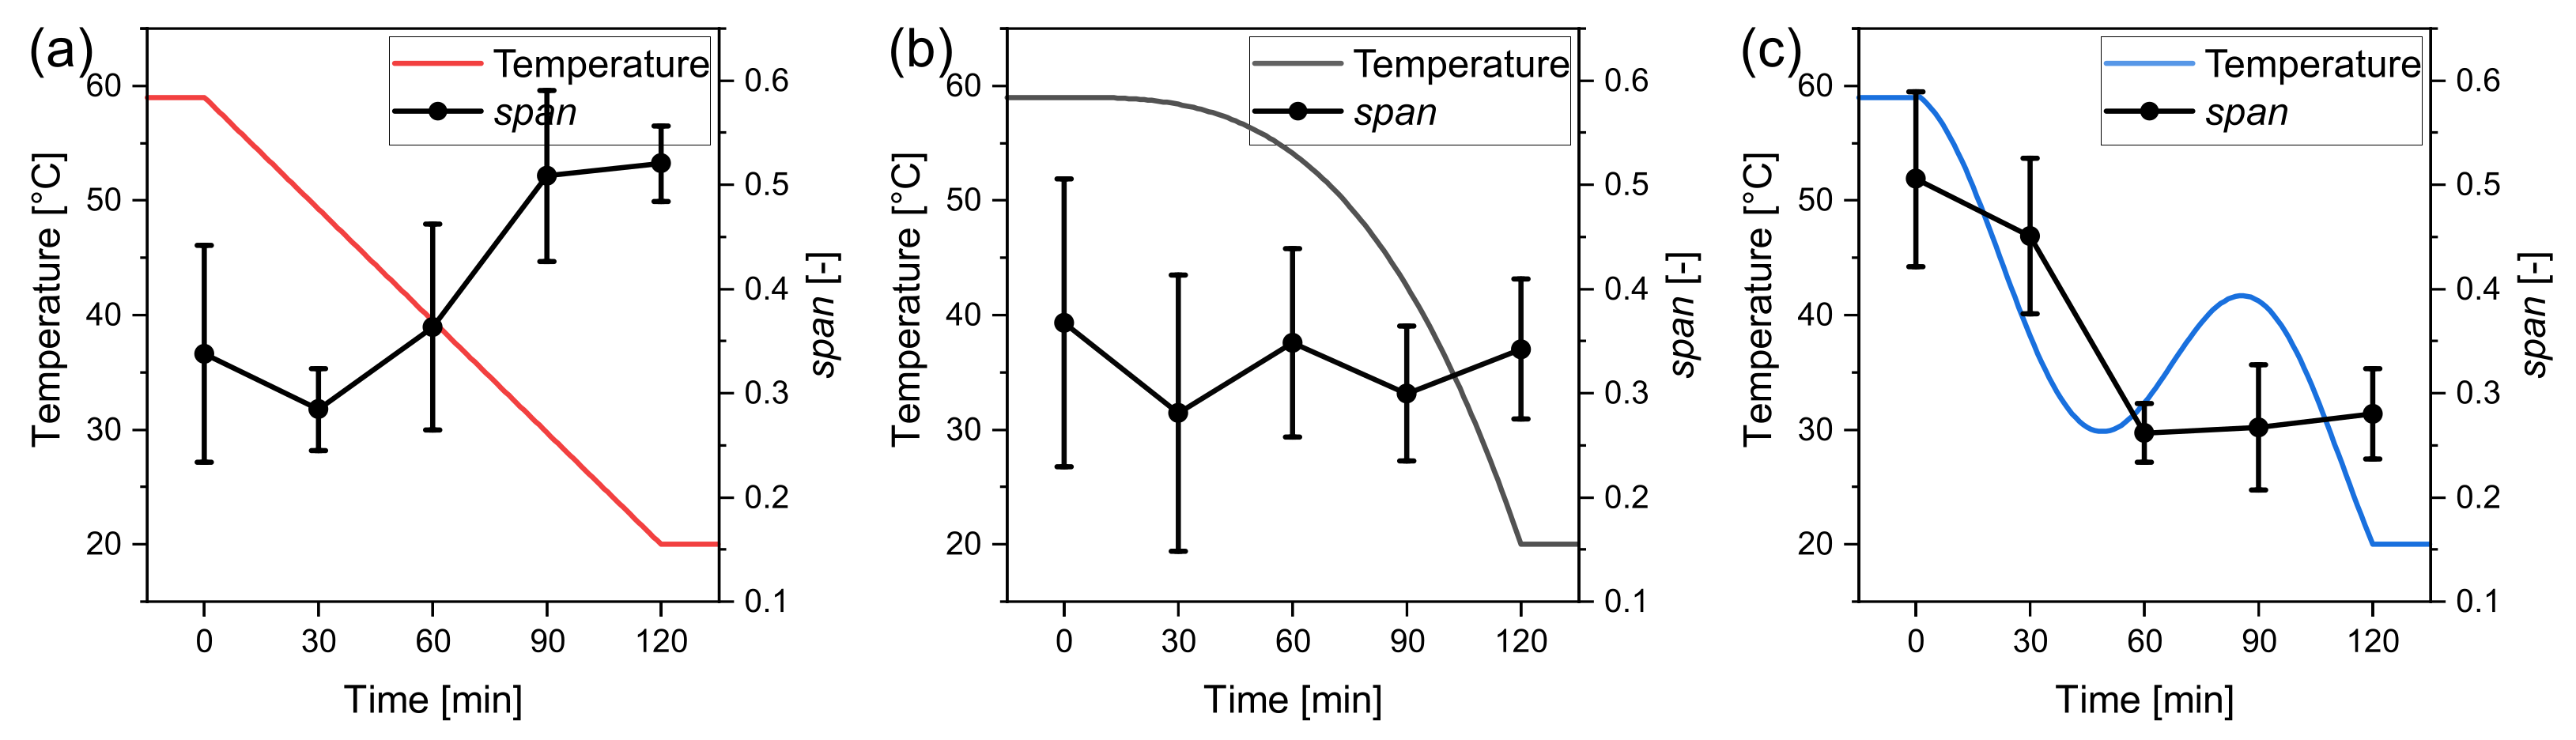
3.1. Temperature Profiles
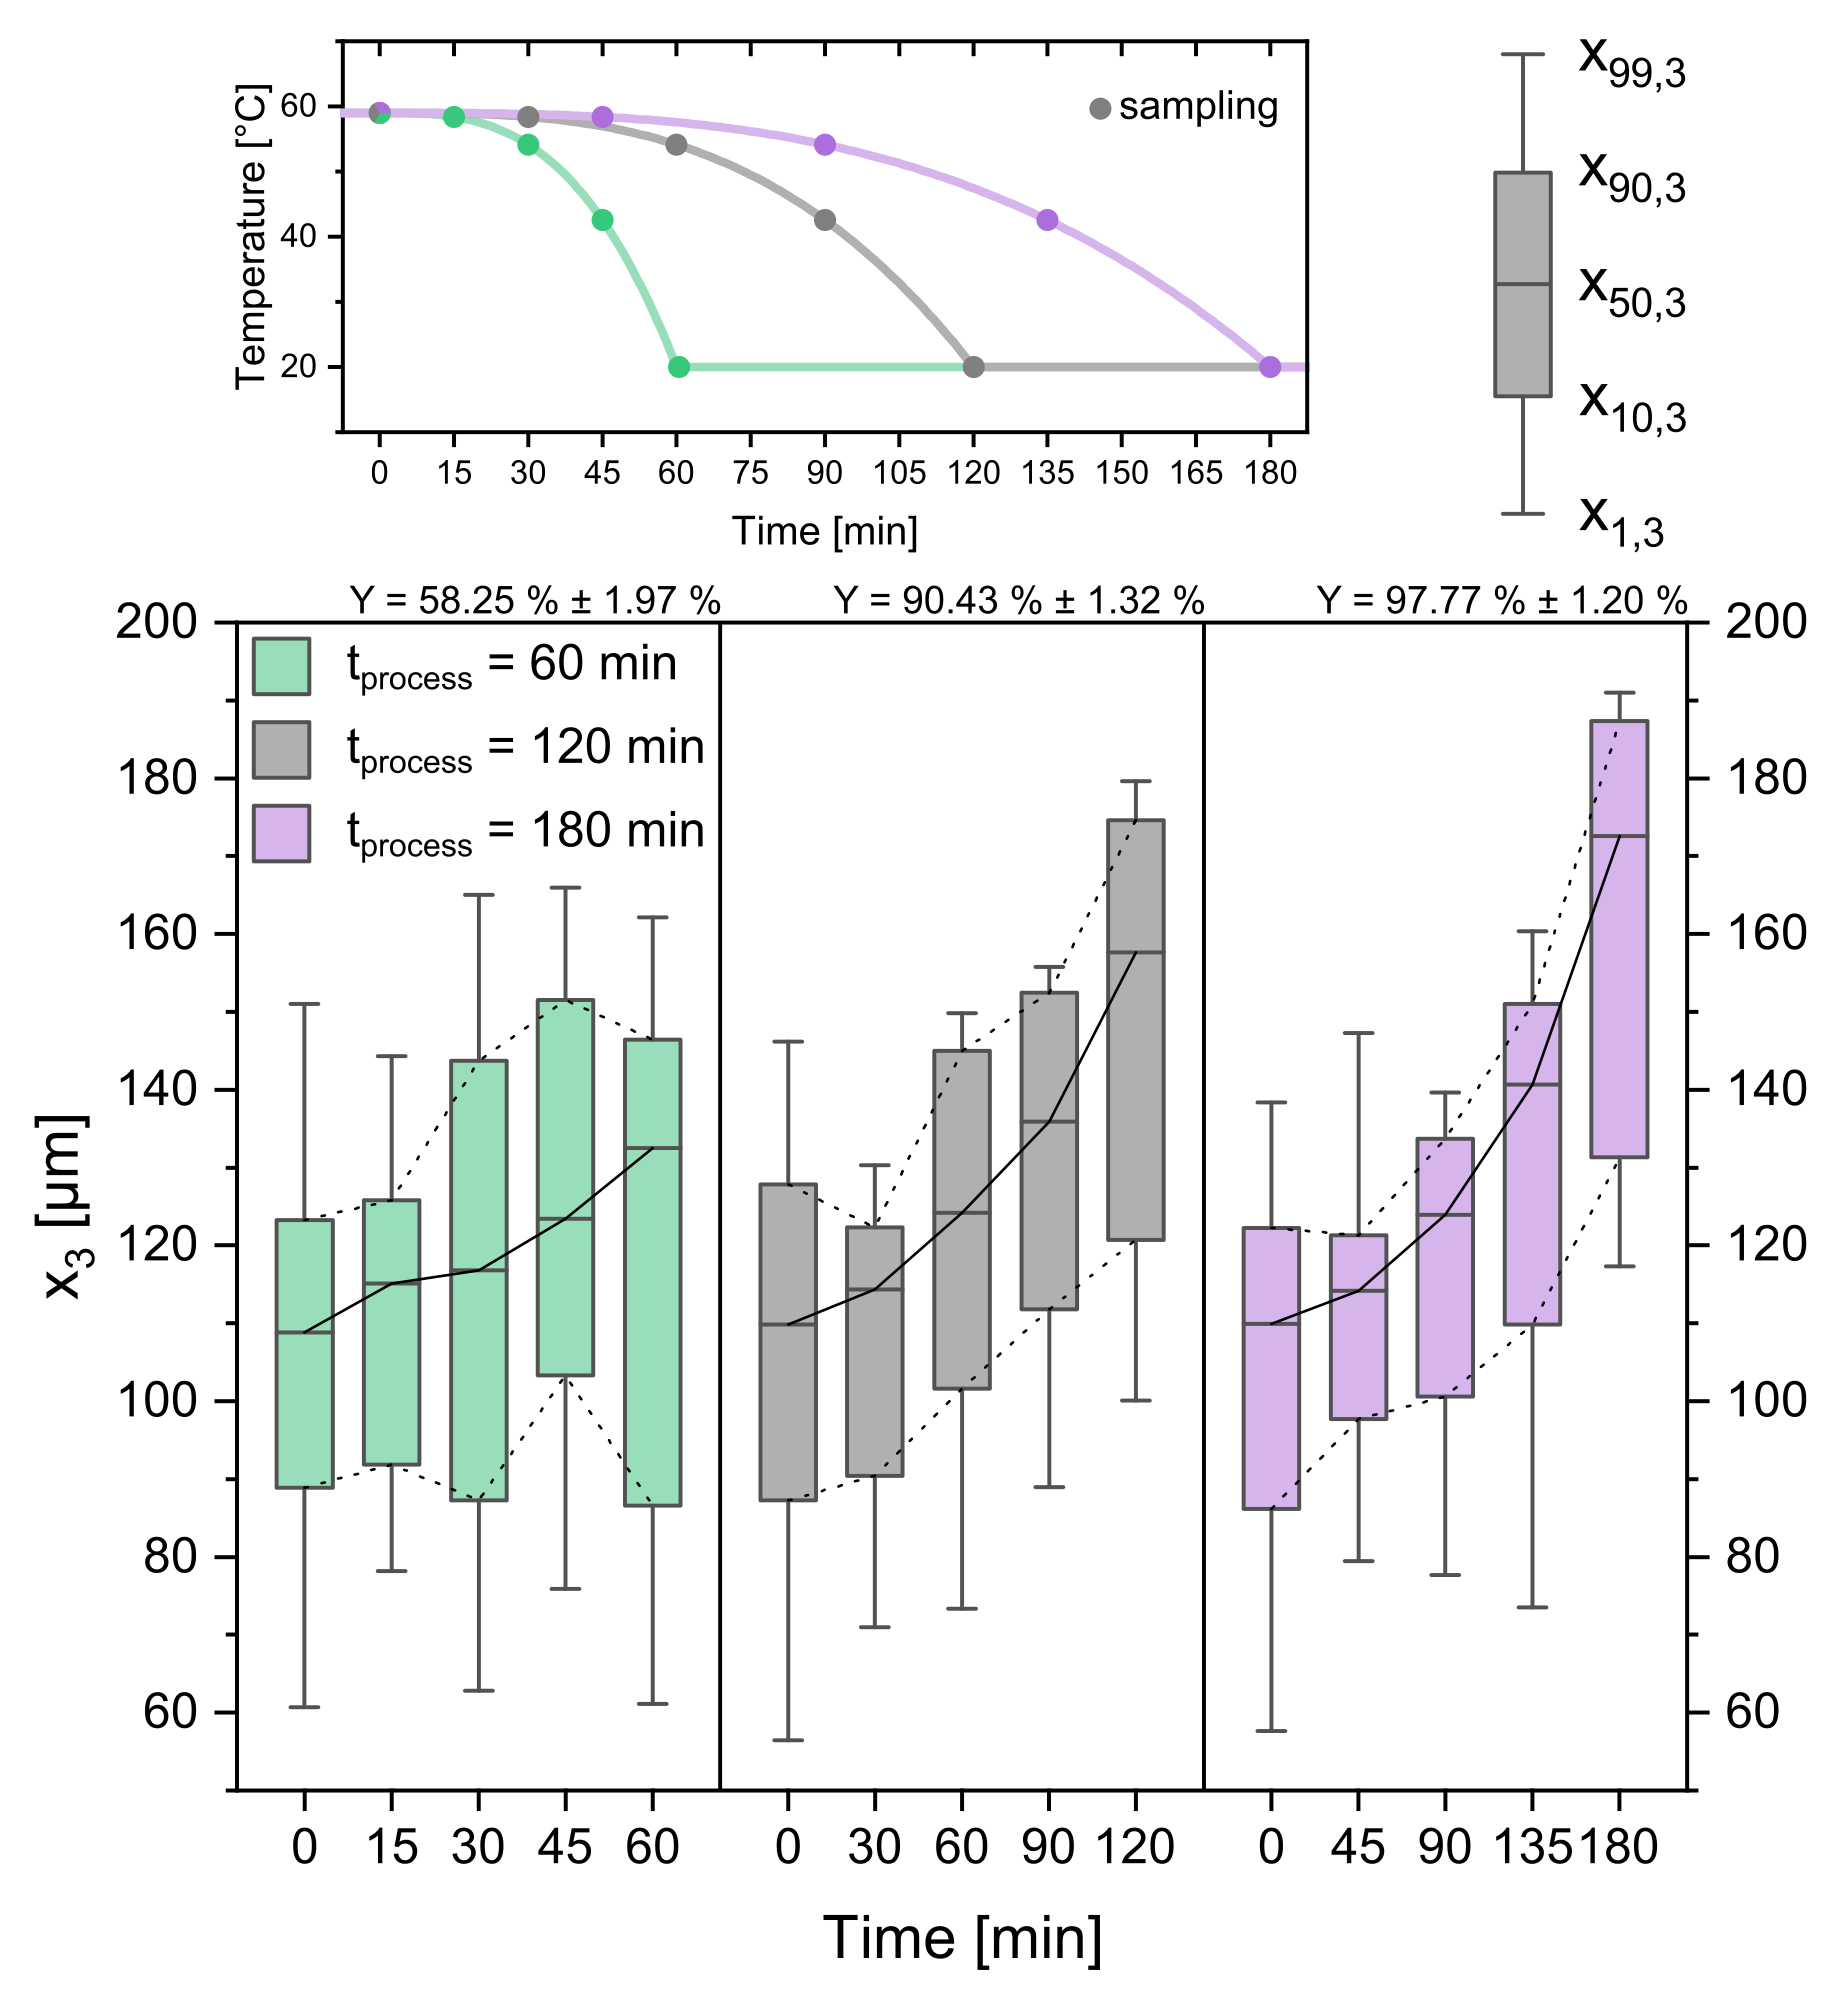
In the following, the results of different characterization experiments will be presented. Starting from the designated “standard” conditions (temperature profile: progressive cooling, process time t process = 120 min, seed crystal amount ω SC = 0.025 g · g E C M 1 , seed sieve size: 90–125 µm) each parameter is individually varied to a “higher” and “lower” level except for the T-profiles, which are varied regarding the cooling strategy. All experiments have been performed as triplets and average values of the respecting quantiles are shown. Raw data and standard deviations can be found in Table S1.
The already introduced linear profile is compared to a progressive and oscillating temperature profile. The standard experimental conditions shown in Table 1. Despite the same temperature difference all three profiles are covering, the difference in product properties is prominent and will be discussed in the following (Figure 7). As it has been mentioned before, the linear profile features a constant growth rate. For the calculation, a shortcut method with regard to the median size of the CSD has been used:
G i = x 50 , 3 , i + 1 x 50 , 3 , i t i + 1 t i
The linear temperature profile in Figure 7a features crystals with a linear growth rate, while at the same time, I Q R 90 , 10 becomes larger. The interquantile range, an indicator for the width of the distribution, is here defined as
I Q R 90 , 10 = x 90 x 10
In this case, it indicates that the solution’s supersaturation is decreased by the growth of the seed crystals and spontaneous nucleation caused by the system surpassing the metastable zone.
The progressive temperature profile can be observed in Figure 7b. Approximated for spherical crystals, the available crystal area grows in a quadratic way relative to the crystal diameter (A∼d2). Therefore, supersaturations can be decreased faster toward the end of the crystallization process, and the cooling rate can be increased without having to fear the buildup of supersaturation and increased nucleation. With increasing cooling rate, also the crystal growth rate increases, so that product crystals are significantly bigger than the product crystals of the linear profile ( x 50 , 3 , l = 132.4 µm ± 0.86 µm < x 50 , 3 , p = 157.6 µm ± 2.03 µm). Also striking is the fact that the fines are growing too, shifting the complete distribution to bigger values of x i , 3 instead of only the median. Here, x 1 , 3 , x 10 , 3 , x 90 , 3 , and x 99 , 3 are growing at about the same extent as x 50 which confirms that the convex profile is beneficial for product crystal uniformity. It can be concluded that the excess crystal mass contributes to crystal growth for the progressive profile more than for the linear profile. The opposite is the case for nucleation, which is less prominent for T p ( t ) .
For the oscillating profile, the median crystal size is stagnant between 30 min and 60 min, where the minimum turning point of the temperature profile is located. This can be observed in Figure 7c. The temperature swing causes big crystals to decrease in size, while small crystals dissolve, as seen when comparing the CSD of 30 min and 60 min. The subsequent cooling period causes the crystals to grow to their final median size x 50 , 3 = 151.57 µm ± 2.69 µm. This is close to the size of the product crystals of the progressive profile. This underlines the CSD narrowing characteristic that has been reported frequently [33,34,35,36].
It is noteworthy that although starting with the broadest CSD of seed crystals, the product crystals of the oscillating profile have the narrowest distribution among the three compared experimental sets. This becomes apparent in particular when looking at the s p a n of the distribution,
s p a n = x 90 x 10 x 50 ,
for the three temperature profiles. These are separately plotted in Figure 8 with the respective temperature profiles. Here the effects of the temperature profile on the distribution width can be discussed more distinctively. The s p a n for the linear profile increases from about 0.3 to above 0.5, highlighting that the supersaturation caused nucleation. The s p a n for the progressive profile fluctuates around 0.3 and thus stays almost constant, indicating that the distribution does not broaden significantly. It is assumed that the supersaturation stayed almost constant. A decrease in the s p a n can be noticed for the oscillating profile after the temperature swing that caused the dissolution of the fine grain. The seed crystal size distributions were measured individually for each experiment right after the seeding procedure. Therefore seed crystals are not the same but stem from the same population. This can explain the deviation of the starting point of the s p a n for the different settings. The oscillating profile achieved the highest yield with 96.58% ± 1.02%. Although the progressive temperature profile produces the largest product crystals, the lowest yield with Y = 90.43% ± 1.32% has been achieved. This is most likely due to the higher cooling rate at the end of the profile, where the supersaturation is high and cannot be decreased accordingly anymore.
On the apparatus from [26,27] a progressive, digressive, and liner temperature profile have been compared for s p a n and x 50 . The comparison of the median for the linear and progressive profile yields the same trend with bigger crystals for the progressive profile. An increased s p a n for the progressive temperature profile in comparison to the linear profile according to [26] cannot be reported. In the experiments presented here, the progressive temperature profile that is characterized by a slow increase of supersaturation, based on the available crystal surface, yields bigger crystals than the linear profile.

3.2. Process Time

As it has been shown in the previous chapter, the temperature profile has a significant influence on the product crystal size and distribution. Thus, also the influence of the processing time t process , which stretches and compresses the temperature profile, is investigated. The CSDs displayed as boxplots can be seen in Figure 9. The short process time of 60 min yields a CSD with the evaluated quantiles in the same range as the linear profile with a processing time of 120 min. The yield Y is smaller, with a value of 58.25% ± 1.97%. Along with the constant growth rate for the 60 min profile comes the constant increase of I Q R 90 , 10 and generation of fines, which were not observed for the other profiles. As one can see from t process = 120 min and t process = 180 min, increasing the operation time has a benefit on the product crystal size ( x 50 , 3 , 120 min = 157.60 µm ± 2.03 µm, x 50 , 3 , 180 min = 172.59 µm ± 1.51 µm) as well as the yield Y 120 min = 90.43% ± 1.32%, Y 180 min = 97.77% ± 1.20%). Existing crystals have more time to grow and decrease the level of final supersaturation. As before, high cooling rates led to promoted nucleation additionally to crystal growth. Although the 180 min profile yields the largest product crystals and yield, the average growth rate (0.344 µm · min 1 ± 0.024 µm · min 1 ) is lower than the average growth rate of the 120 min profile (0.400 µm · min 1 ± 0.018 µm · min 1 ). This invites to a trade-off discussion, where it is to be considered whether the difference in product crystal size ( x 50 , 3 , 180 min = 172.59 µm ± 1.51 µm) and yield ( Y 180 min = 97.77% ± 1.20%) justifies the additional extension of the processing time by 60 min. Depending on the demands for a potential crystalline product, either possibility can make sense.

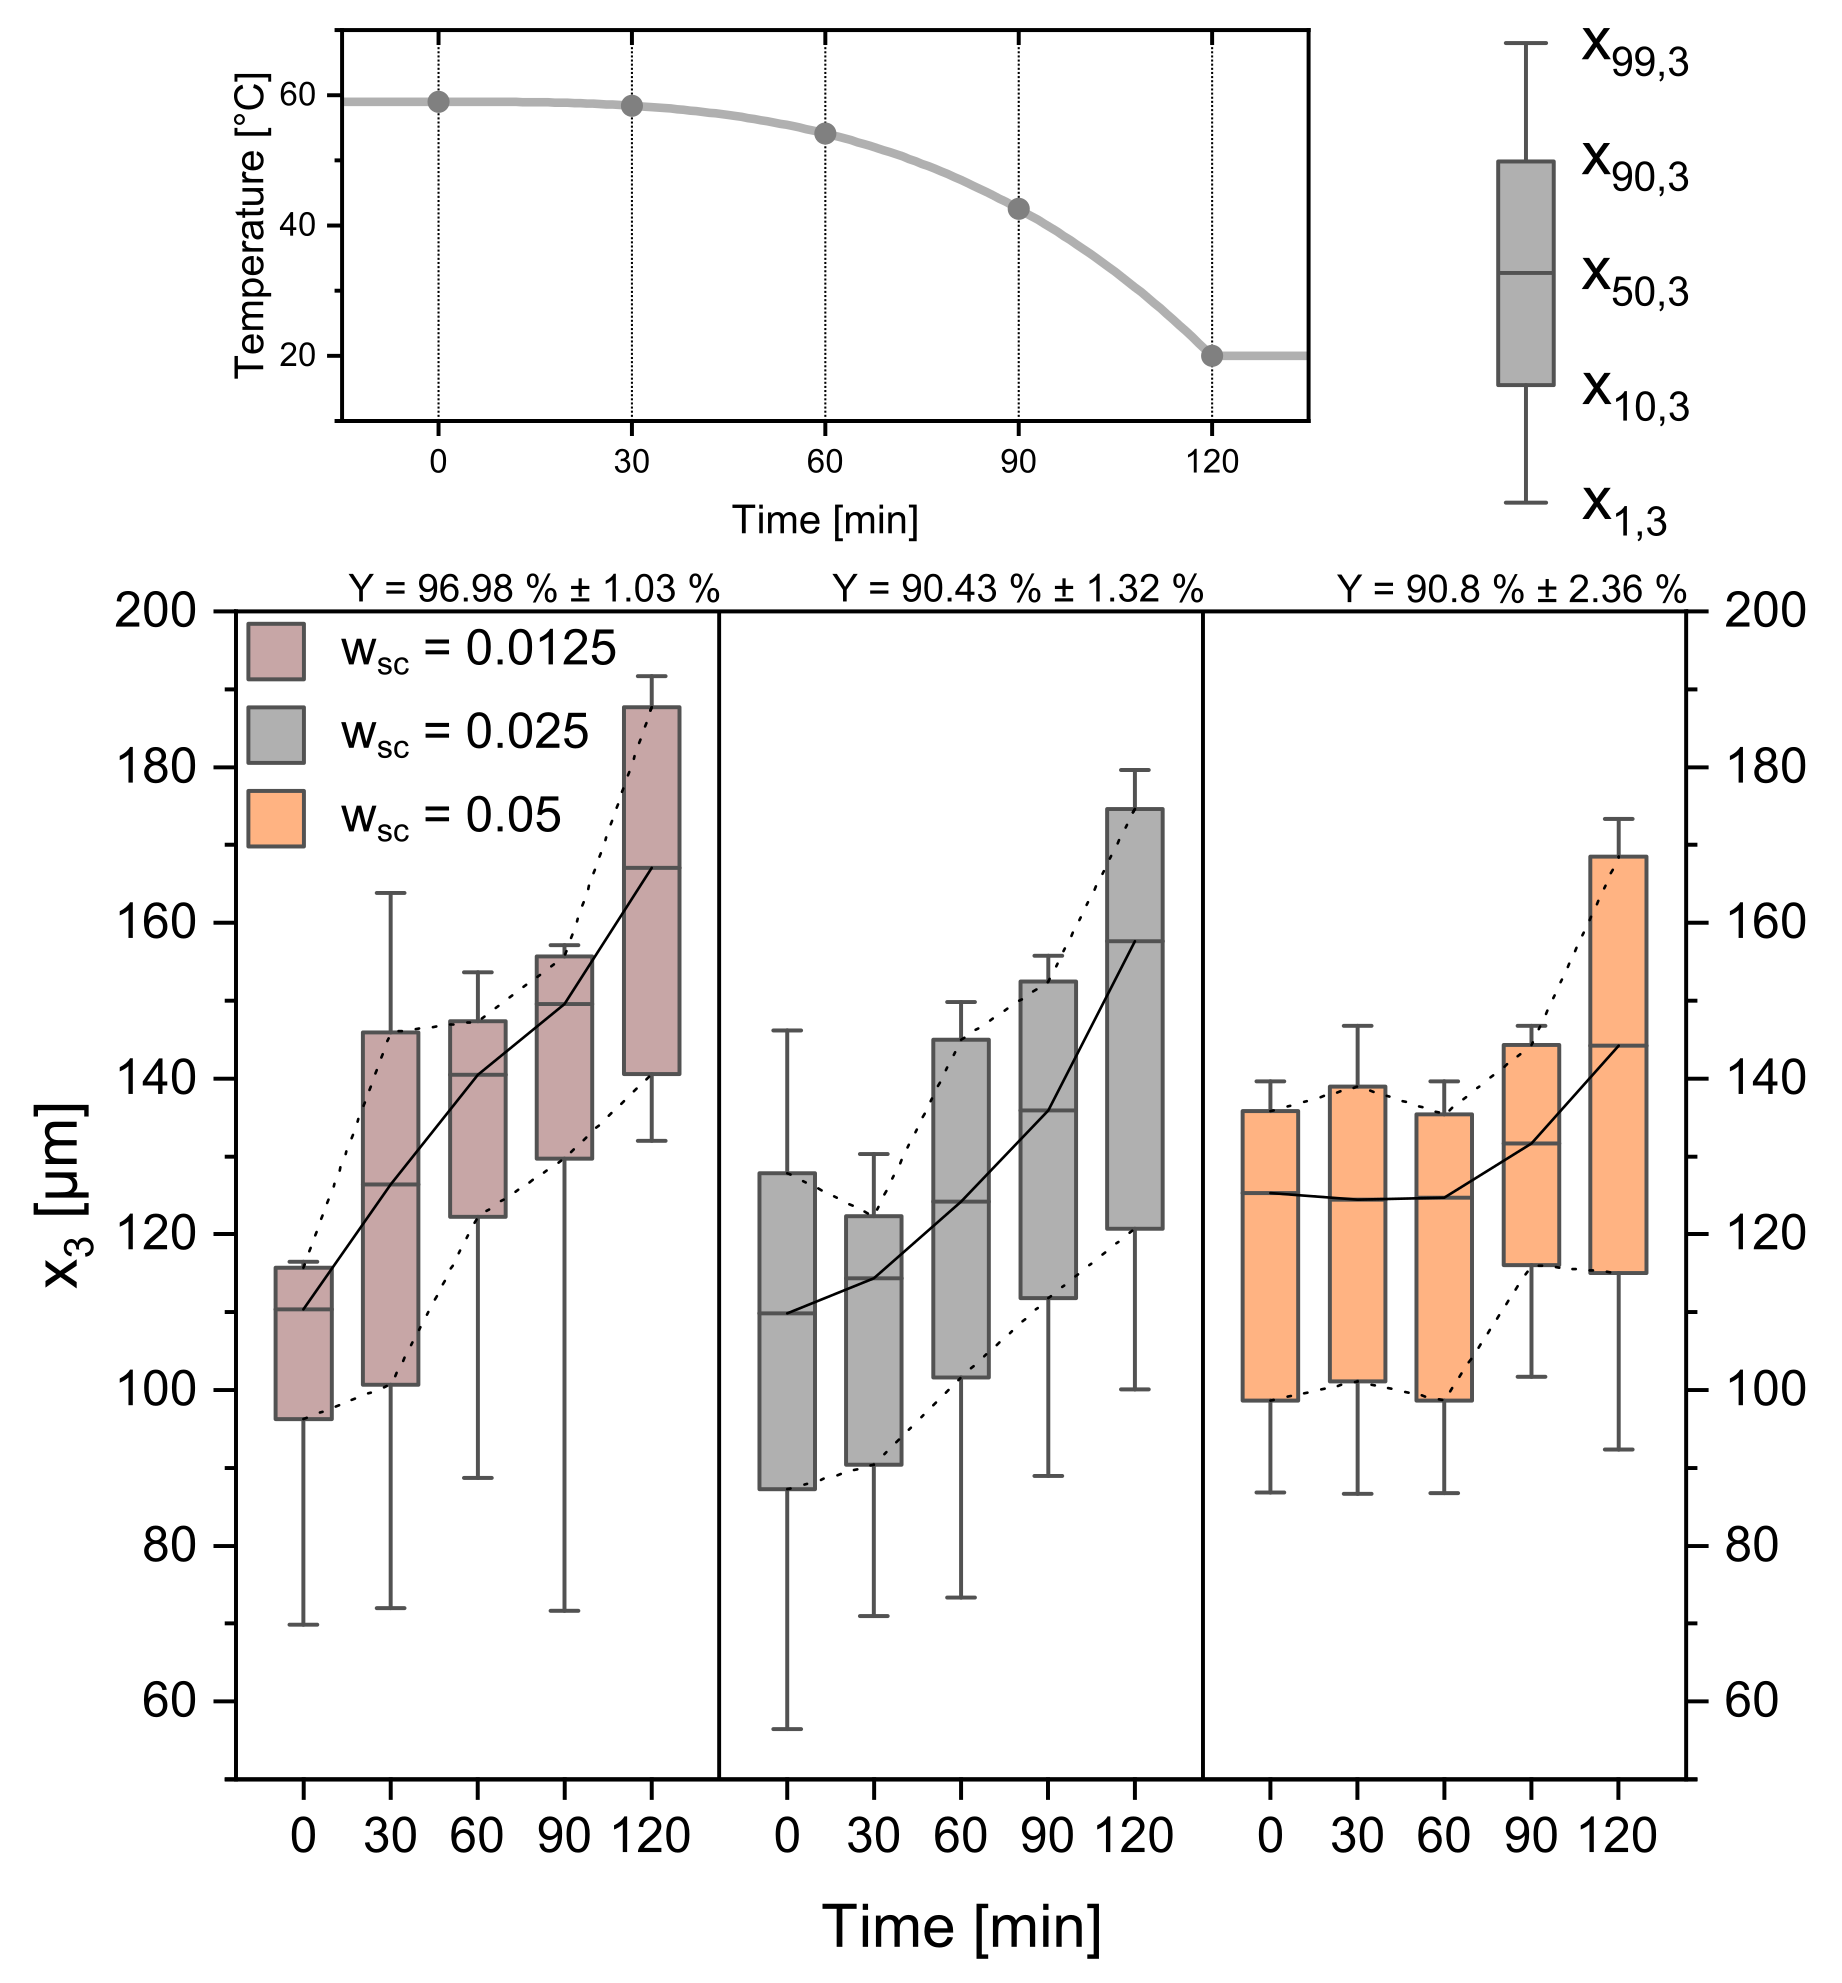
3.3. Seed Crystal Content

One of the most frequent variables used to manipulate crystallization processes is the amount of added seed crystals to the process [40]. With the parameters from Table 1 held constant, the amount of added seeds was varied from 0.025 g · g E C M 1 to 0.0125 g · g E C M 1 and 0.05 g · g E C M 1 . The experimental results are given in Figure 10. The data reveal that the seed crystal amount has a significant influence on the course of the crystallization process and, therefore, on the product crystals. For the 0.05 g · g E C M 1 seed crystals the CSD stays constant for the first 60 min. The temperature profile only provides a Δ T of 4.875 K, while the respecting supersaturation and corresponding ECM, can distribute among a high amount of seed crystals. Crystal growth is therefore not detectable. For the seed crystals with 0.0125 µm · min 1 , the average growth rate over t process is constant and high ( G 0.0125 g · g E C M 1 = 0.461 µm · min 1 ± 0.035 µm · min 1 ). The available crystal surface is lower at the beginning and higher at the end due to the quadratic relation of surface and diameter. This leads to high individual growth and supports spontaneous nucleation at the beginning of the crystallization, which is why smaller seed crystals also lead to higher yields. With changing seed crystal mass, too, the amount of crystals and the available crystal surface changes. Thus, individual crystals have higher average growth rates for lower seed crystal masses. High amounts of seed crystals, in turn, cause a decreased average growth rate ( G 0.05 g · g E C M 1 = 0.296 µm · min 1 ± 0.018 µm · min 1 ) of the individual crystal and therefore a smaller CSD.

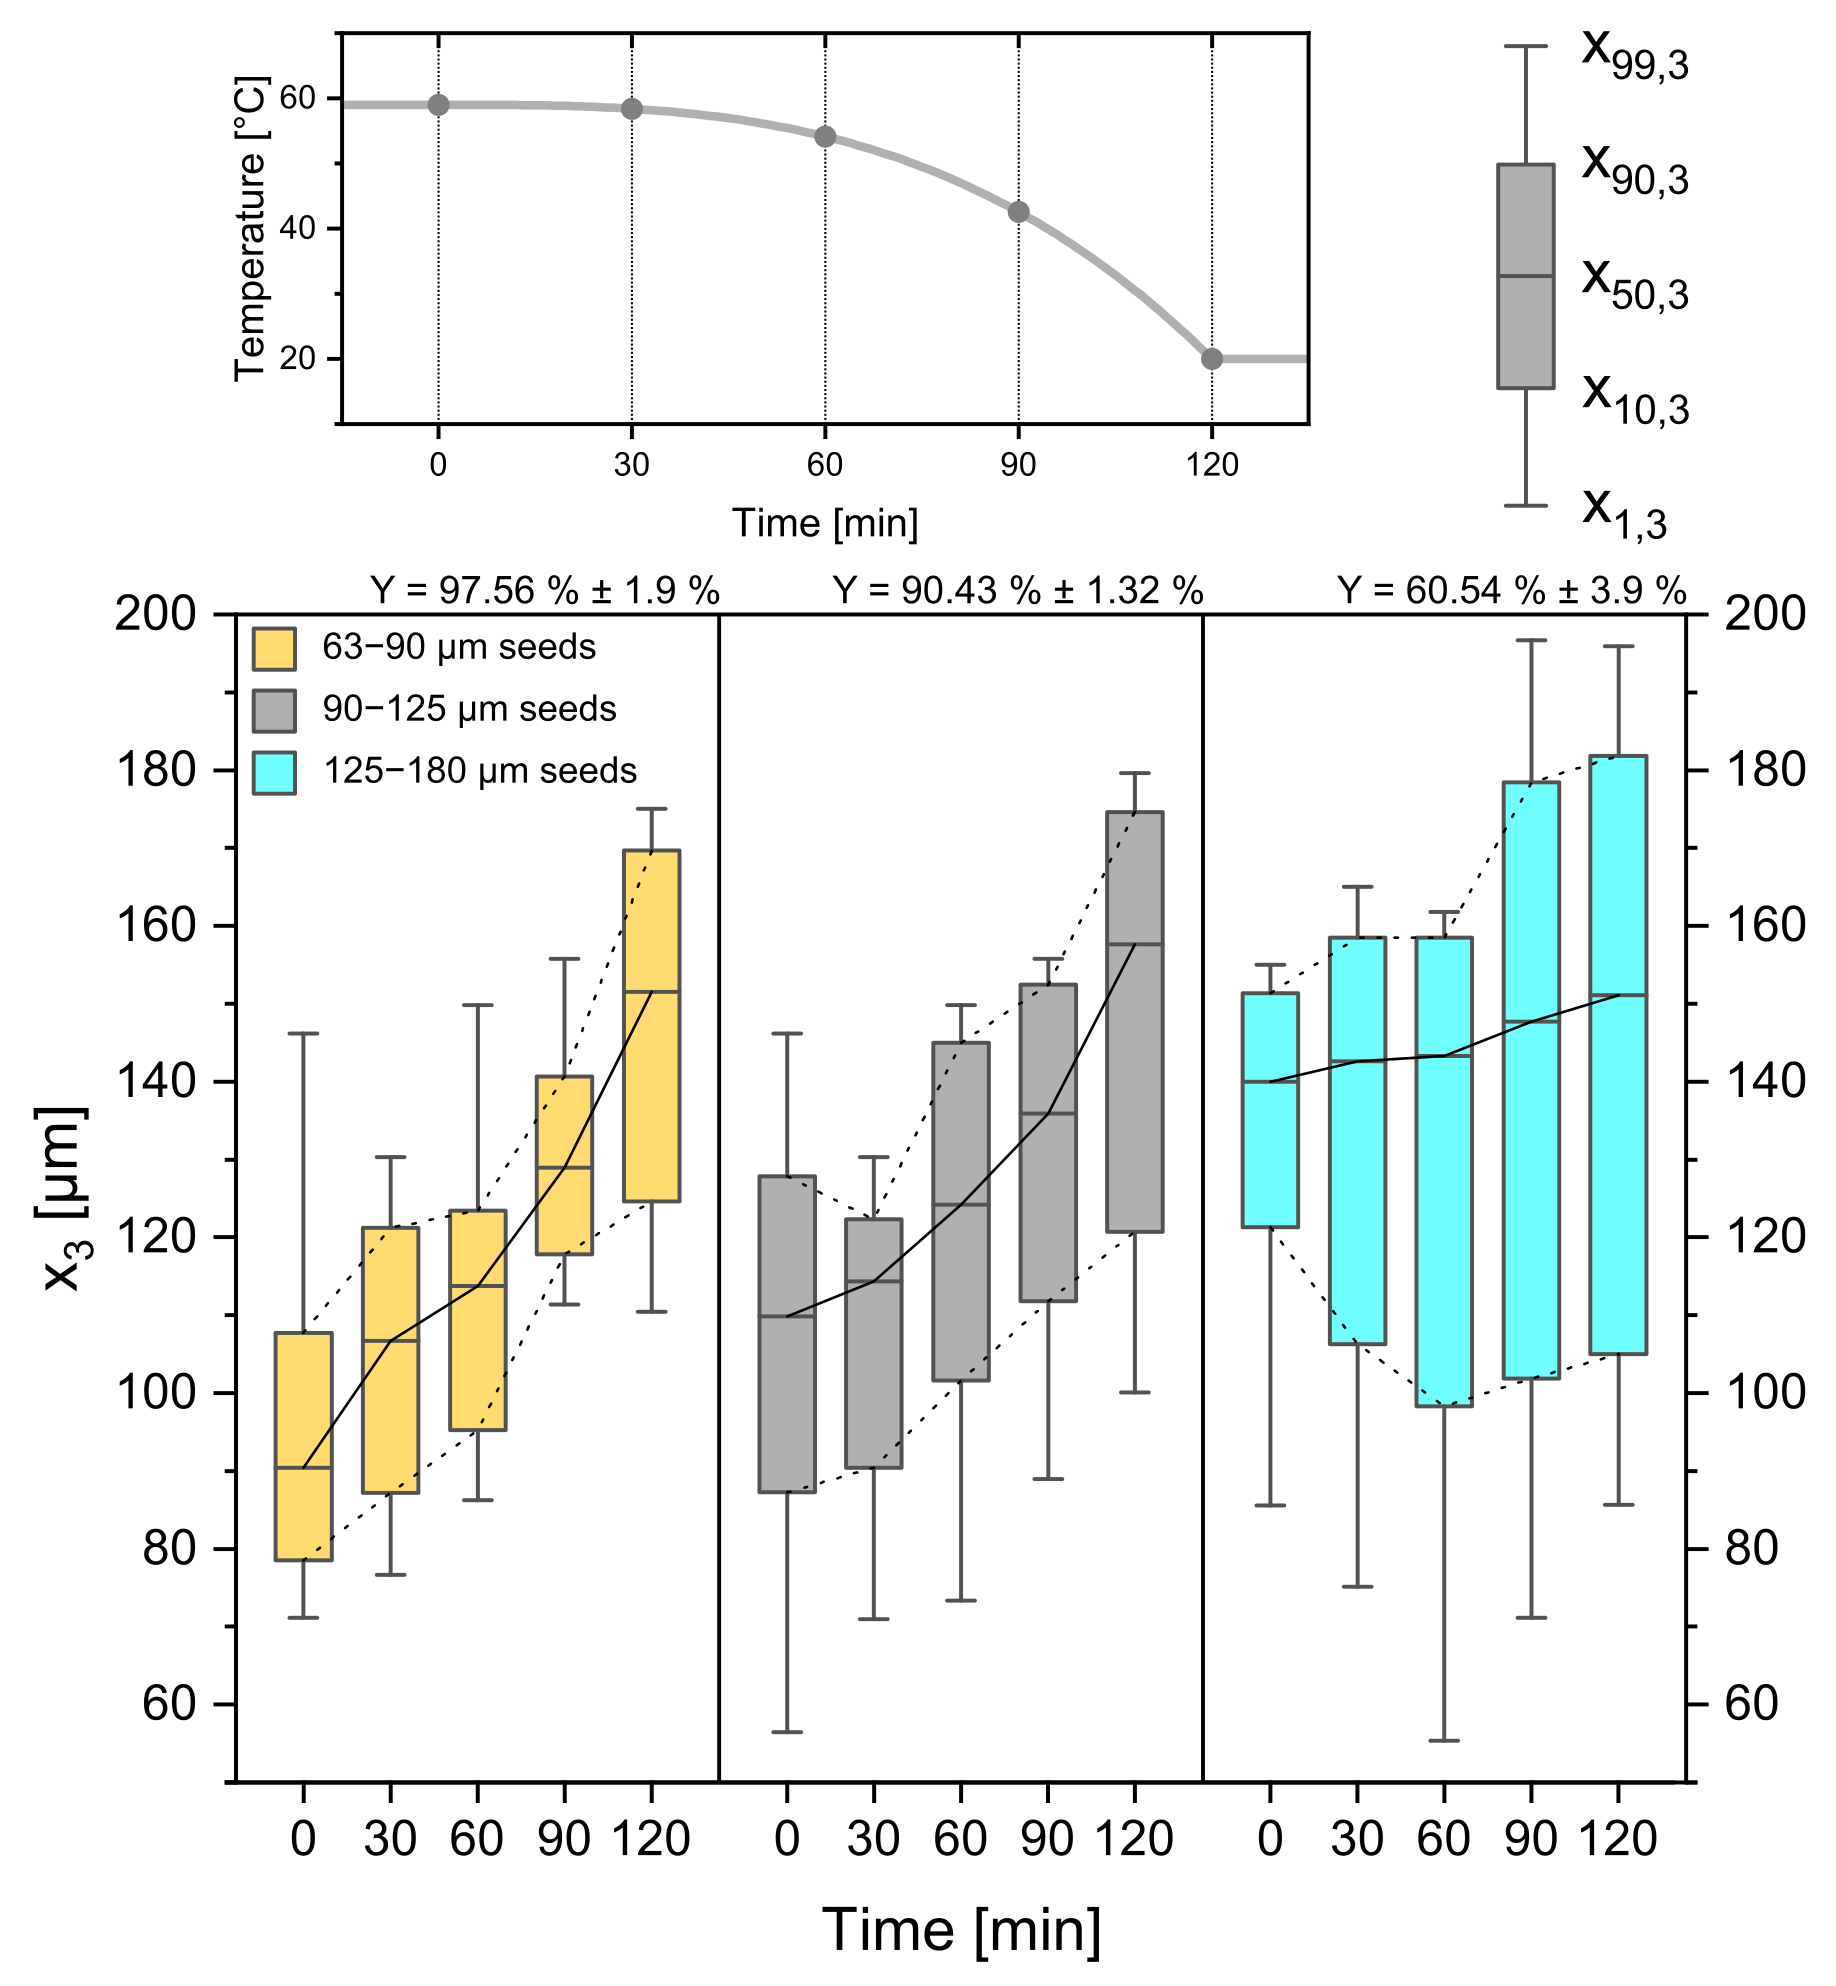
3.4. Seed Crystal Size

As seed crystal properties play a major role in crystallization processes [40], not only the seed crystal amount but also the seed crystal sieve size was investigated. From Figure 11 the difference in seed crystal size can be read from the boxplots at 0 min. They increase from left to right from 63–90 µm to 90–125 µm and 125–180 µm at a constant weight of seed amount.
As stated before, the available crystal surface also plays a major role in the crystallization process because the seed crystal mass stays constant and, therefore, the size, the absolute crystal number, and crystal surface changes. While the smaller seeds grow with a high constant rate ( G 63 90 = 0.545 µm · min 1 ± 0.06 µm · min 1 ) without secondary nucleation, the larger seed sieve fraction (125–180 µm) causes a lower average growth rate ( G 125 180 = 0.094 µm · min 1 ± 0.01 µm · min 1 ) with an increase in I Q R 90 , 10 and a low yield of 60.54% ± 3.9%. These results, in turn, are indicators for secondary nucleation caused by high supersaturation and a limited crystal surface area. Following this logic, the experiments with the smallest seed crystals led to the highest yield of 97.56% ± 1.9%. Despite the difference in seed crystal size all product crystals come out with a median in the same range ( x 50 , 3 , 63 90 = 151.5 µm ± 3.40 µm, x 50 , 3 , 90 125 = 157.60 µm ± 2.03 µm, x 50 , 3 , 125 180 = 151.10 µm ± 1.93 µm).

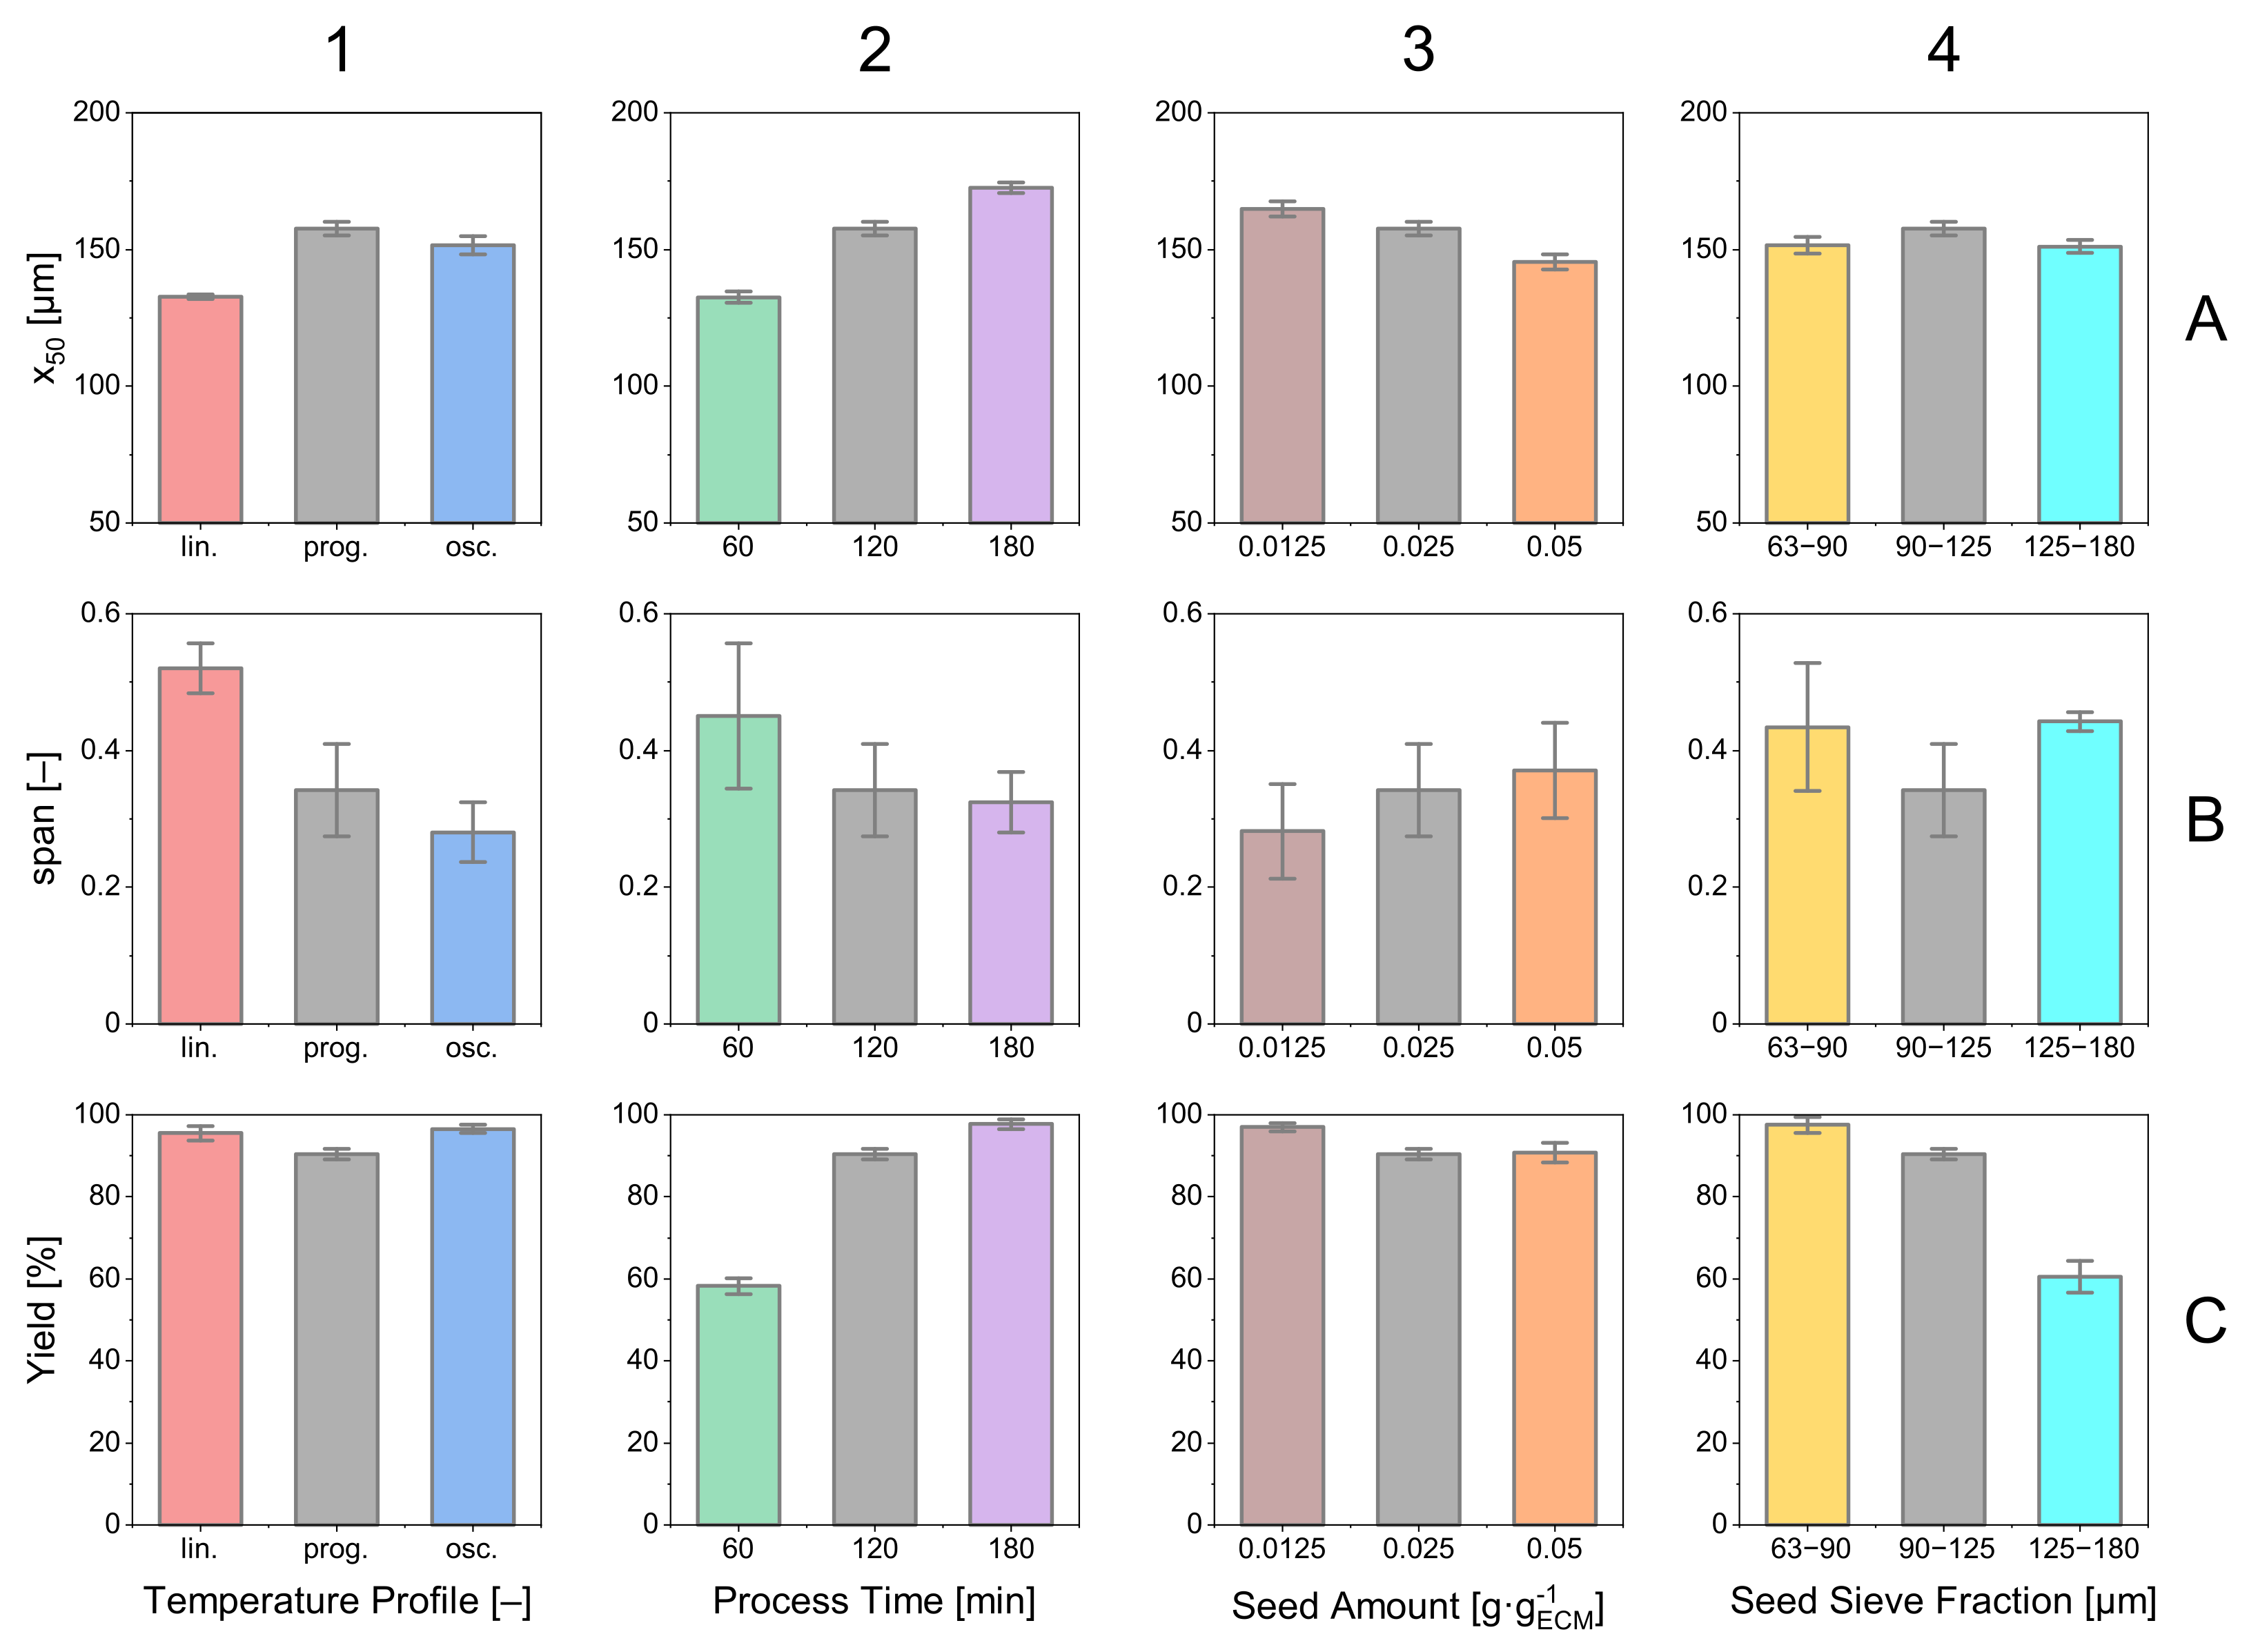
3.5. Parameter Study: Summary

In Figure 12, a selection of relevant product properties is presented for the previously discussed experimental sets. Looking at the different courses of temperature profiles, it is noticed that the yield Y is of the same magnitude for all three profiles (Figure 12(C1)). Regarding s p a n and median, the oscillating temperature profile offers benefits regarding the width of the distribution with the lowest s p a n (B1), and the progressive temperature profile yields the largest median crystals (A1).
The influence of the processing time t process can be observed in column 2. Considering the product properties, a clear tendency is visible. An increase in processing time has a decreasing effect on the span while increasing the median and the process yield. This comes along with an optimization problem having a trade-off between product quality and process time.
The influence of seed amount can be observed in column 3. Due to the limited available crystal surface, the product crystals for a smaller amount of seed crystals become larger. The excess crystal mass induced by the supersaturation is decreased by a lower amount of seed crystals, and the crystals present become larger than with higher amounts of seed crystals. Deviations of the s p a n originate from the difference in the size of the median that is in the denominator, but do not represent a change in I Q R 90 , 10 .
The seed size with the respective effects on the product properties are plotted in column 4. Striking is the low yield (C4) for large seed crystals that can be explained by a limited crystal surface area responsible for decreasing the supersaturation. This can also be observed when looking at the s p a n of the respective experiment (B4). The high supersaturation that did not decrease by the growth of the seed crystals caused nucleation that is responsible for a wide span. Hence, the product crystals came out to be smaller than those with smaller (90–125 µm) seed crystals (A4).

4. Conclusions and Outlook

A novel small-scale quasi-continuous filter belt crystallizer was designed and operated for cooling crystallization, filtration, and drying. In addition to [26], cooling crystallization of sucrose dissolved in water was investigated in detail for different seed crystal sizes, seed crystal amount, process time, and three different temperature profiles. Although temperature control via Peltier elements is quite common for microfluidic applications [41], literature on temperature control in cooling crystallization of comparable dimensions as presented here is scarce. The newly developed temperature module with Peltier elements as the core unit enables precise temperature control with deviations smaller than 0.5 K from the target temperature in the range from 20 °C to 60 °C. The modular setup is supported by a 3D-printed container lid that holds a temperature sensor and two-pitch blade stirrers responsible for suspending the crystals. As the temperature is precisely controlled on the crystallization modules, investigation of the progressive and the oscillating temperature profiles has shown that refraining from the classical linear profile has beneficial effects on the product properties. Particularly the oscillating temperature profile substantially narrows the product size distribution without major drawbacks regarding product size or yield.
With the experimental investigations in this study, a contribution towards the characterization of the cooling crystallization step on a quasi-continuous filter belt crystallizer was made. Overall the apparatus offers attractive features for the small-scale processing of products with highly specific properties. The modular process and apparatus design enable fast and flexible adaptions to possibly necessary process conditions by simply changing the number and order of functional modules. From the current results, two major options should be investigated in the future. First, the long-term operability of the modular approach should be investigated with parallel operation of several containers. Product quality and space-time yield should be optimized with the direct temperature control, in contrast to the indirect temperature control. Second, the presented oscillating temperature profile offers a high potential for manipulating product properties and quality. Investigating the effects of amplitude and frequency of the profile can lead to custom-tailored product properties in cooling crystallization.

Supplementary Materials

The following supporting information can be downloaded at: https://www.mdpi.com/article/10.3390/pr10061047/s1. References [26,27,38,40] are cited in the Supplementary Materials.

Author Contributions

Conceptualization, S.H.; methodology, S.H.; software, B.O. and S.H.; formal analysis, B.O. and S.H.; investigation, B.O. and S.H.; data curation, S.H.; writing—original draft preparation, S.H.; writing—review and editing, B.O. and N.K.; visualization, S.H.; supervision, S.H. and N.K.; project administration, N.K.; funding acquisition, N.K. All authors have read and agreed to the published version of the manuscript.

Funding

This research was funded by the German Federal Ministry of Economic Affairs and Climate Action (BMWK) and the Project Management Jülich (PtJ) as part of the ENPRO2.0 initiative (Ref. no. 03ET1652F).

Institutional Review Board Statement

Not applicable.

Informed Consent Statement

Not applicable.

Data Availability Statement

Not applicable.

Acknowledgments

The authors would like to thank Carsten Schrömges for technical support and Mira Schmalenberg for detailed discussion.

Conflicts of Interest

The authors declare no conflict of interest.

Abbreviations

ABSAcrylonitrile butadiene styrene
CADComputer aided design
CSDCrystal size distribution
ECMExcess crystal mass
EtOHEthanol
IQRInterquantile range
LNDLognormal distribution
PLAPolylactic acid
QCFBCQuasi continuous filter belt crystallizer
Latin Symbols
E C M max max. excess crystal mass [g]
G i crystal growth rate [µm · min 1 ]
I Q R 10 , 90 interquantile range [µm]
m crys . mass of product crystals [g]
m evap . mass of evaporated water [g]
m FC mass of filter cake [g]
m ML mass of mother liquor [g]
m SC seed crystal mass [g]
m succ , ML remaining mother liquor after filtration [g]
ttime [min]
t process total process time [min]
Ttemperature [°C]
T end end temperature of profile [°C]
T i ( t ) temperature profile function [°C]
T start start temperature of profile [°C]
w * saturation concentration [g · g 1 ]
x aq water content [g · g 1 ]
x i crystal diameter [µm]
X s , end , theo . theoretical final loading [g · g 1 ]
X s , start initial loading [g · g 1 ]
Y i relative yield [%]
Greek Symbols
ω SC seed crystal mass fraction [g · g 1 ]

References

  1. Domokos, A.; Nagy, B.; Szilágyi, B.; Marosi, G.; Nagy, Z.K. Integrated Continuous Pharmaceutical Technologies—A Review. Org. Process Res. Dev. 2021, 25, 721–739. [Google Scholar] [CrossRef]
  2. Schaber, S.D.; Gerogiorgis, D.I.; Ramachandran, R.; Evans, J.M.B.; Barton, P.I.; Trout, B.L. Economic Analysis of Integrated Continuous and Batch Pharmaceutical Manufacturing: A Case Study. Ind. Eng. Chem. Res. 2011, 50, 10083–10092. [Google Scholar] [CrossRef] [Green Version]
  3. Melches, C.; Plate, H.; Schürhoff, J.; Buchfink, R. The Steps from Batchwise to Continuous Crystallization for a Fine Chemical: A Case Study. Crystals 2020, 10, 542. [Google Scholar] [CrossRef]
  4. Lier, S.; Paul, S.; Ferdinand, D.; Grünewald, M. Modulare Verfahrenstechnik: Apparateentwicklung für wandlungsfähige Produktionssysteme. Chem. Ing. Tech. 2016, 88, 1444–1454. [Google Scholar] [CrossRef]
  5. Lang, J.; Stenger, F.; Schütte, R. Chemieanlagen der Zukunft-Unikate und/oder Module. Chem. Ing. Tech. 2012, 6, 883–884. [Google Scholar] [CrossRef]
  6. Bieringer, T.; Buchholz, S.; Kockmann, N. Future Production Concepts in the Chemical Industry: Modular-Small-Scale-Continuous. Chem. Eng. Technol. 2013, 36, 900–910. [Google Scholar] [CrossRef]
  7. Lier, S.; Wörsdörfer, D.; Grünewald, M. Wandlungsfähige Produktionskonzepte: Flexibel, Mobil, Dezentral, Modular, Beschleunigt. Chem. Ing. Tech. 2015, 87, 1147–1158. [Google Scholar] [CrossRef]
  8. Baldea, M.; Edgar, T.F.; Stanley, B.L.; Kiss, A.A. Modular manufacturing processes: Status, challenges, and opportunities. AIChE J. 2017, 63, 4262–4272. [Google Scholar] [CrossRef] [Green Version]
  9. Stankiewicz, A.; Moulijn, J.A. Process Intensification. Ind. Eng. Chem. Res. 2002, 41, 1920–1924. [Google Scholar] [CrossRef]
  10. Nagy, Z.K.; El Hagrasy, A.; Litster, J. (Eds.) Continuous Pharmaceutical Processing, 1st ed.; AAPS Advances in the Pharmaceutical Sciences Series; Springer: Cham, Switzerland, 2020; Volume 42. [Google Scholar] [CrossRef]
  11. Wong, S.Y.; Tatusko, A.P.; Trout, B.L.; Myerson, A.S. Development of Continuous Crystallization Processes Using a Single-Stage Mixed-Suspension, Mixed-Product Removal Crystallizer with Recycle. Cryst. Growth Des. 2012, 12, 5701–5707. [Google Scholar] [CrossRef]
  12. Ferguson, S.; Ortner, F.; Quon, J.; Peeva, L.; Livingston, A.; Trout, B.L.; Myerson, A.S. Use of Continuous MSMPR Crystallization with Integrated Nanofiltration Membrane Recycle for Enhanced Yield and Purity in API Crystallization. Cryst. Growth Des. 2014, 14, 617–627. [Google Scholar] [CrossRef]
  13. Ferguson, S.; Morris, G.; Hao, H.; Barrett, M.; Glennon, B. Characterization of the anti-solvent batch, plug flow and MSMPR crystallization of benzoic acid. Chem. Eng. Sci. 2013, 104, 44–54. [Google Scholar] [CrossRef]
  14. Alvarez, A.J.; Myerson, A.S. Continuous Plug Flow Crystallization of Pharmaceutical Compounds. Cryst. Growth Des. 2010, 10, 2219–2228. [Google Scholar] [CrossRef]
  15. Besenhard, M.O.; Neugebauer, P.; Scheibelhofer, O.; Khinast, J.G. Crystal Engineering in Continuous Plug-Flow Crystallizers. Cryst. Growth Des. 2017, 17, 6432–6444. [Google Scholar] [CrossRef] [PubMed]
  16. Schmalenberg, M.; Kreis, S.; Weick, L.K.; Haas, C.; Sallamon, F.; Kockmann, N. Continuous Cooling Crystallization in a Coiled Flow Inverter Crystallizer Technology—Design, Characterization, and Hurdles. Processes 2021, 9, 1537. [Google Scholar] [CrossRef]
  17. Hohmann, L.; Greinert, T.; Mierka, O.; Turek, S.; Schembecker, G.; Bayraktar, E.; Wohlgemuth, K.; Kockmann, N. Analysis of Crystal Size Dispersion Effects in a Continuous Coiled Tubular Crystallizer: Experiments and Modeling. Cryst. Growth Des. 2018, 18, 1459–1473. [Google Scholar] [CrossRef]
  18. Hohmann, L.; Löbnitz, L.; Menke, C.; Santhirakumaran, B.; Stier, P.; Stenger, F.; Dufour, F.; Wiese, G.; zur Horst-Meyer, S.; Kusserow, B.; et al. Continuous Downstream Processing of Amino Acids in a Modular Miniplant. Chem. Eng. Technol. 2018, 41, 1152–1164. [Google Scholar] [CrossRef]
  19. Orehek, J.; Teslić, D.; Likozar, B. Continuous Crystallization Processes in Pharmaceutical Manufacturing: A Review. Org. Process Res. Dev. 2021, 25, 16–42. [Google Scholar] [CrossRef]
  20. Ma, Y.; Wu, S.; Macaringue, E.G.J.; Zhang, T.; Gong, J.; Wang, J. Recent Progress in Continuous Crystallization of Pharmaceutical Products: Precise Preparation and Control. Org. Process Res. Dev. 2020, 24, 1785–1801. [Google Scholar] [CrossRef]
  21. Myerson, A. Handbook of Industrial Crystallization; Butterworth-Heinemann: Oxford, UK, 2002. [Google Scholar]
  22. Wang, T.; Lu, H.; Wang, J.; Xiao, Y.; Zhou, Y.; Bao, Y.; Hao, H. Recent progress of continuous crystallization. J. Ind. Eng. Chem. 2017, 54, 14–29. [Google Scholar] [CrossRef]
  23. Zhang, D.; Xu, S.; Du, S.; Wang, J.; Gong, J. Progress of Pharmaceutical Continuous Crystallization. Engineering 2017, 3, 354–364. [Google Scholar] [CrossRef]
  24. Jiang, M.; Braatz, R.D. Designs of continuous-flow pharmaceutical crystallizers: Developments and practice. Cryst. Eng. Comm 2019, 21, 3534–3551. [Google Scholar] [CrossRef] [Green Version]
  25. Schmalenberg, M.; Mensing, L.; Lindemann, S.; Krell, T.; Kockmann, N. Miniaturized draft tube baffle crystallizer for continuous cooling crystallization. Chem. Eng. Res. Des. 2022, 178, 232–250. [Google Scholar] [CrossRef]
  26. Dobler, T.; Buchheiser, S.; Gleiß, M.; Nirschl, H. Development and Commissioning of a Small-Scale, Modular and Integrated Plant for the Quasi-Continuous Production of Crystalline Particles. Processes 2021, 9, 663. [Google Scholar] [CrossRef]
  27. Löbnitz, L. Auslegung des Separationsprozesses und Entwicklung neuer Verfahrenskonzepte zur Integrierten Produktion und Separation kristalliner Aminosäuren; Karlsruher Institut für Technologie: Karlsruhe, Germany, 2020. [Google Scholar]
  28. Deutsches Institut für Normung. Agitators and Baffles for Agitator Vessels; Types, Terms and Main Dimensions; Deutsches Institut für Normung: Berlin, Germany, 1992. [Google Scholar]
  29. Wilson, A.J.C. Atlas der Zuckerkristalle-Atlas of Sugar Crystals by G. Vavrinecz. Acta Crystallogr. 1966, 20, 152. [Google Scholar] [CrossRef] [Green Version]
  30. Choong, K.L.; Smith, R. Novel strategies for optimization of batch, semi-batch and heating/cooling evaporative crystallization. Chem. Eng. Sci. 2004, 59, 329–343. [Google Scholar] [CrossRef]
  31. Choong, K.L.; Smith, R. Optimization of batch cooling crystallization. Chem. Eng. Sci. 2004, 59, 313–327. [Google Scholar] [CrossRef]
  32. Moscosa-Santillán, M.; Bals, O.; Fauduet, H.; Porte, C.; Delacroix, A. Study of batch crystallization and determination of an alternative temperature-time profile by on-line turbidity analysis—Application to glycine crystallization. Chem. Eng. Sci. 2000, 55, 3759–3770. [Google Scholar] [CrossRef]
  33. Abu Bakar, M.R.; Nagy, Z.K.; Rielly, C.D. Investigation of the Effect of Temperature Cycling on Surface Features of Sulfathiazole Crystals during Seeded Batch Cooling Crystallization. Cryst. Growth Des. 2010, 10, 3892–3900. [Google Scholar] [CrossRef]
  34. Bakar, M.R.A.; Nagy, Z.K.; Rielly, C.D. Seeded Batch Cooling Crystallization with Temperature Cycling for the Control of Size Uniformity and Polymorphic Purity of Sulfathiazole Crystals. Org. Process Res. Dev. 2009, 13, 1343–1356. [Google Scholar] [CrossRef]
  35. Kim, S.; Wei, C.; Kiang, S. Crystallization Process Development of an Active Pharmaceutical Ingredient and Particle Engineering via the Use of Ultrasonics and Temperature Cycling. Org. Process Res. Dev. 2003, 7, 997–1001. [Google Scholar] [CrossRef]
  36. Wu, Z.; Yang, S.; Wu, W. Application of temperature cycling for crystal quality control during crystallization. Cryst. Eng. Comm. 2016, 18, 2222–2238. [Google Scholar] [CrossRef]
  37. Schmalenberg, M.; Sallamon, F.; Haas, C.; Kockmann, N. Temperature-Controlled Minichannel Flow-Cell for Non-Invasive Particle Measurements in Solid-Liquid Flow. In Proceedings of the ASME 2020 18th International Conference on Nanochannels, Microchannels, and Minichannels, Virtual, 13–15 July 2020. [Google Scholar] [CrossRef]
  38. Bouchard, A.; Hofland, G.W.; Witkamp, G.J. Properties of Sugar, Polyol, and Polysaccharide Water–Ethanol Solutions. J. Chem. Eng. Data 2007, 52, 1838–1842. [Google Scholar] [CrossRef]
  39. Schneider, F.; Schliephake, D.; Klimmek, A. Über die Viskosität von Reinen Saccharoselösungen. Zucker 1963, 16, 465–473. [Google Scholar]
  40. Chianese, A. Fines Removal. In Industrial Crystallization Process Monitoring and Control; John Wiley & Sons, Ltd.: Hoboken, NJ, USA, 2012; Chapter 15; pp. 175–184. [Google Scholar] [CrossRef]
  41. Frede, T.A.; Maier, M.C.; Kockmann, N.; Gruber-Woelfler, H. Advances in Continuous Flow Calorimetry. Org. Process Res. Dev. 2022, 26, 267–277. [Google Scholar] [CrossRef]
Figure 1. Simplified Piping and Instrumentation Diagram of the quasi-continuous filter belt crystallizer. Process containers are incrementally moved from left to right, passing each module.
Processes 10 01047 g001
Figure 2. (a) shows a CAD image of the QCFBC. The custom built apparatus can be seen in (b).
Processes 10 01047 g002
Figure 3. Exploded CAD and schematic view of the process medium container positioned on the temperature control module.
Processes 10 01047 g003
Figure 4. Temperature control strategy demonstrated with an oscillating temperature profile and 100 g sucrose solution (saturated at 60 °C). Seeded with 0.025 g · g E C M 1 seeds of 63–90 µm sieve size fraction. The red background indicates that the Peltier elements are in heating. The blue background indicates cooling. The blue line is the actual temperature, the red is the target temperature, respectively. Grey shows the absolute value of the applied voltage to the Peltier elements.
Processes 10 01047 g004
Figure 5. Demonstration of the continuation of a temperature module across two temperature modules. The target profile is linear from 60 °C to 10 °C in 120 min with 100 g sucrose solution (saturated at 60 °C).
Processes 10 01047 g005
Figure 6. Temperature profiles investigated in this work. The linear temperature profile T l ( t ) , progressive temperature profile T p ( t ) , and oscillating temperature profile T o ( t ) .
Processes 10 01047 g006
Figure 7. Boxplots of the crystallization of sucrose for the discussed temperature profiles. (a) shows the linear, (b) the progressive, and (c) the oscillating temperature profile. Yields are indicated in the top right. Quantiles are averages from triple experiments. The temperature profiles are plotted in the bottom panels. Process time t process = 120 min, seed crystal amount ω SC = 0.025 g · g E C M 1 , seed sieve size: 90–125 µm.
Processes 10 01047 g007
Figure 8. Span of the product crystal distributions for the considered temperature profiles (a) linear, (b) progressive, and (c) oscillating. Experimental values are taken from triple experiments.
Processes 10 01047 g008
Figure 9. Boxplots of CSDs for three different process times (cooling rates). The temperature profiles and sampling times can be seen in the top panel. Respecting yields are given above the Boxplots. Please note that the time scale for the Boxplots changes. Progressive profile, seed crystal amount ω SC = 0.025 g · g E C M 1 , seed sieve size: 90–125 µm.
Processes 10 01047 g009
Figure 10. CSDs for three different seed crystal amounts (0.0125 g · g E C M 1 , 0.025 g · g E C M 1 , 0.05 g · g E C M 1 ). The temperature profile and sampling times can be seen in the top panel. Respecting yields are given above the Boxplots. Progressive profile, process time t process = 120 min, seed sieve size: 90–125 µm.
Processes 10 01047 g010
Figure 11. CSDs for three different seed crystal sizes (63–90 µm, 90–125 µm, 125–180 µm). The temperature profile and sampling times can be seen in the top panel. Respecting yields are given above the Boxplots. Progressive profile, process time t process = 120 min, seed crystal amount ω SC = 0.025 g · g E C M 1 .
Processes 10 01047 g011
Figure 12. Relevant product crystal properties (median, s p a n , yield) for the experiments discussed before. Error bars are calculated from triple experiments. The color coding for the diagram is consistent throughout the contribution. One color represents one set (triple) of experiments.
Processes 10 01047 g012
Table 1. Parameters that have been varied throughout the characterization experiments performed in this work.
“Low”“Standard”“High”
temperature profile [-]linearprogressiveoscillating
process time [min]60120180
seed crystal amount [g · g E C M 1 ]0.01250.0250.05
seed sieve size [µm]63–9090–125125–180
Publisher’s Note: MDPI stays neutral with regard to jurisdictional claims in published maps and institutional affiliations.

