Article

Particle Residence Time Distribution in a Concurrent Multiphase Flow Reactor: Experiments and Euler-Lagrange Simulations

by
Laura Unger
1,
Juan Sebastián Gómez Bonilla
1,
Dyrney Araújo dos Santos
2 and
Andreas Bück
1,*
1
Institute of Particle Technology, Friedrich-Alexander-Universität Erlangen-Nürnberg, Cauerstraße 4, 91058 Erlangen, Germany
2
Institute of Chemistry, Federal University of Goiás, Avenida Esperança s/n, Goiania 74690-900, Goiás, Brazil
*
Author to whom correspondence should be addressed.
Processes 2022, 10(5), 996; https://doi.org/10.3390/pr10050996
Submission received: 26 April 2022 / Revised: 12 May 2022 / Accepted: 15 May 2022 / Published: 17 May 2022

Abstract

:
The present work focuses on investigating the residence time behavior of microparticles in a concurrent downer reactor through experiments and numerical simulations. For the numerical simulations, a three-dimensional multiphase model was developed using the Euler-Lagrange approach. The experiments were performed in a 0.8 m-long steel reactor with gravitational particle injection. The effects of different operating conditions, e.g., the sheath gas velocity on the particle residence time distribution were assessed. An increase in the sheath gas flow rate led to a decrease in the peak residence time, although the maximum residence time increased. Regarding the lowest sheath gas flow rate, the particles’ peak residence time was twice as high compared to the peak residence time within the highest flow rate. The particles’ residence time curves presented a broad distribution coinciding with the size distribution of the powder. The numerical results agreed with the experimental data; thus, this study presents a numerical model for predicting the particle residence time behavior in a concurrent downer reactor. Furthermore, the numerical simulations contributed to a better understanding of the particle residence time behavior inside a concurrent downer reactor which is essential for optimizing thermal rounding processes. Dimensionless correlations for the observed effects are developed.

1. Introduction

For many industrial applications, the particle shape of the feedstock is a key factor in the process quality. Depending on the intended application, angular, planar, or spherical particles are preferred. The application of spherical particles is expatiated procedures, where a free-flowing behavior is required, e.g., for additive manufacturing. Conversely, planar structures enhance the reflection of lights and colors, where the main field of application is in the cosmetic or pigment industry.
In general, the feed material production routes define the form of the later product. Thus, cryogenic or wet grinding lead to edgy and irregular-shaped particles that own poor flowability but possess a preferable light reflection [1,2]. The precipitation approach generates spherical-shaped particle structures; however, the range of applicability is limited due to solution properties [3]. Whenever a particular particle shape is required, which cannot be provided by the production route, shaping techniques are usually applied. Those are mainly accomplished using mechanical [4] and thermal rounding [5].
One application that requires proper flowability of the feedstock is additive manufacturing by powder bed fusion. Within the layer-by-layer manufacturing approach, powder materials are the basis for producing complex geometries and customized parts [6,7,8]. The powder is applied layer by layer using either a doctor blade or a roller coater in a sidewards directed movement [9]. Afterward, a laser melts specified areas, which leads to a connection within the layers after solidification. These steps proceed until the part is finished [10,11].
For the described powder application methods, the feedstock material must have good flowability. Otherwise, the surface of the applied layer is non-uniform and possesses a poor packing density, resulting in lower mechanical stability and poor surface finishing of the produced part [12,13,14,15].
One way to improve the flowability is to modify the particle surface and shape via the thermal rounding process. In this case, the feed material is transferred into a partially molten state by a heated gas or a liquid flow. The surface tension of the so formed droplets leads to a spheroidization of the non-spherical object. After the solidification, which is achieved by rapid cooling, the spherical shape is conserved [5,16,17,18]. For the heating process, different heat sources are available, such as plasma devices [19,20,21], flames [22], electron beams [23], and electrical heaters [5]. On the one hand, to ensure proper particle shape modification, the particle residence time needs to be long enough to melt the material sufficiently. On the other hand, the particle residence time should be kept as short as possible to prevent adverse side effects, such as agglomeration of molten particles, thermal decomposition, and further chemical reactions.
Among much other equipment, concurrent downer reactors are suitable for thermal rounding. However, the operating conditions and the geometric factors of the particles have a high impact on the hydrodynamics inside the reactor, and thus on the particle residence time behavior. Thus, the investigation of the particle residence time distribution is of great importance for the design and optimization of the reactors.
Besides experimental analysis, numerical simulations are used to investigate complex systems involving multiphase flow and turbulence. For fluid-particle flow simulation, the Euler-Euler and the Euler-Lagrange approaches are frequently used. In the Euler-Euler approach, implemented through CFD (Computational Fluid Dynamics) technique, both phases are treated as interpenetrating continuously, whereas in the Euler-Lagrange approach the fluid phase is solved in an Eulerian frame of reference (CFD), and the particles are usually tracked using the Discrete Element Method (DEM).
Pawar [24] reported three-dimensional CFD simulations using an Euler-Lagrange approach to determine the hydrodynamic flow regime in a concentric tube airlift reactor. In this case, water and air were considered, respectively, as the Eulerian continuous and the Lagrangian dispersed phases. Two bubble size distributions for the dispersed phase and the respective Sauter diameters have been used to investigate the gas distribution at the reactor’s inlet. According to the authors, the smallest bubble size distribution agreed well with the experimental data.
To improve the enzymatic hydrolysis of cellulose, Li et al. [25] developed a novel industrial scaled quasi plug-flow reactor by optimizing the internal structures of the reactor through CFD simulations.
Yu et al. [26] investigated the effect of the operating conditions, the separator geometry, and the particle properties on the separation efficiency of a biomass pyrolysis downer reactor using an Euler-Euler approach. The numerical results agreed well with the experimental data and revealed details of the hydrodynamic flow regimes around the novel gas-solid separator.
Marandi et al. [27] used a three-dimensional CFD model combined with an Euler-Euler approach to determine the best design of a multi-zone circulating reactor based on the hydrodynamic investigation of polypropylene powders. The effects of the inlet gas velocity on the pressure drop and the solid volume fraction distribution were studied.
The particle velocity distribution and the solids holdup along the axial direction in a downer reactor have been widely investigated in the literature. However, the short contact time and the residence time distribution of the involved phases, especially the solid phase, are rarely assessed.
Gomez et al. [28] investigated the particle residence time distribution in a directly heated downer reactor under different operating conditions, using the Euler-Lagrange approach (CFD-DEM). The mean particle size used in their work was d32 = 87.8 µm. They observed that the temperature did not affect the particle residence time distribution. On the other hand, the mass flow rates of the sheath gas and the aerosol significantly influenced the particle residence time behavior. According to the authors, the mass flow rate of the aerosol showed the highest impact on the particle residence time distribution. Comparison of the numerical results was limited to the residence time of the gas.
Zhang et al. [29] experimentally measured the residence time distribution (RTD) of biomass pyrolysis vapors and catalysts in a V-shaped downer reactor with a length of 1.5 m by using colored catalysts particles (mean diameter of 70 µm) as tracers. They observed asymmetrical residence time distributions with a mean particle residence time between 2.0–3.0 s.
Zhao et al. [30] obtained the particle distribution profiles using fluid catalytic cracking particles (FCC) and electrical capacitance tomography, specifically designed for their computational setup. Wang et al. [31] also used FFC particles and optical fiber probes to investigate the axial distribution of the particle velocity and the solids holdup in a fluidized bed downer reactor with high solids loading.
Deng [32] proposed a one-dimensional model to predict the influence of the superficial gas velocity on the axial flow structure in a downer reactor with a length of 6 m. The comparison between their numerical results and the experimental data by Qi et al. [33] showed good agreement. The authors reported that the variation of the gas velocity led to a formation of an axial flow structure along the reactor’s length.
So far, a combined study comprising experimental and numerical investigations of the particle residence time distribution in a downer reactor has not been reported in the literature. Though Brust et al. [34] and Gomez et al. [28] already accomplished measurements of the residence time, both authors focused on the measurement of the sheath gas behavior. Thus, no investigation of the solid phase has been achieved. Furthermore, investigations regarding the axial fluid-particle flow structure in small downer reactors, e.g., under the length of 1.0 m, are scarce in the literature. Therefore, in this work, a systematic investigation of the axial flow structure and the particle residence time distribution in a 0.8-m-long downer reactor is performed by experiments and numerical simulations using the Euler-Lagrange approach.
The manuscript is structured as follows: In Section 2, materials and methods are presented, introducing the experimental and numerical setup. Section 3 presents and compares experimental and numerical results, and also describes the flow structure using the dimensionless Bodenstein number. The work closes with conclusions and an outlook on future work.

2. Materials and Methods

2.1. Experimental Apparatus and Methods

The experimental apparatus used to investigate the effects of the operating conditions on the axial flow structure and particle residence time distribution is schematically shown in Figure 1. To enhance the understanding of both the initial thermal rounding process and the experimental setup applied in this study, Figure 1 presents a detailed two-dimensional sketch of the experimental setup (left), as well as a concisely three-dimensional visualization of the entire lab-scale plant (right) used in the thermal rounding process.
The downer reactor comprised a cylindrical vessel with a length of 0.8 m and an inner diameter of 0.1 m. A particle injector nozzle (i.e., “Particle injector” in Figure 1), built out of stainless steel, with an inner diameter of 26 mm, and a length of 0.15 m, was used. To prevent a back-mixing of the particles towards the sheath gas injector (i.e., “Gas injector” in Figure 1), a sintered plate with a mesh width of x90,3 = 26 µm was installed at an axial position of 0.05 m above the particle injector nozzle outlet. In addition, this sintered plate also creates a laminar and homogeneously distributed sheath gas flow around the particle injection.
Pre-grounded polypropylene particles (PP) with a Sauter diameter of 76.1 μm and a mass density of 907 kg/m3 were used as tracers. Particle size measurements were performed by a Mastersizer 2000, equipped with a Hydro 2000S module (Malvern). The dried powder sample was suspended in water, and, to increase dispersion stability, a small amount of sodium dodecyl sulfate solution (SDS, 98% (Merck)) was added. The sample dispersions were measured under stirring and ultrasonication.
For all experiments, a total mass of particles of 0.5 g (i.e., 491,357 particles) was directly inserted into the funnel shown in Figure 1, mimicking a Dirac impulse. Table 1 summarizes the configuration parameters used for the particle residence time distribution investigation.
After leaving the injector, the particles were propelled only by the sheath gas from the gas injector. A collecting vessel was placed on a balance at the end of the downer reactor. The balance display was continuously recorded through a video camera to capture the particle weight changes. Based on these recordings, the cumulative residence time curves were obtained and subsequently used to calculate the particle residence time density distributions.
The experiments were performed as follows (motivated by the work of Bachmann et al. [35] for residence time measurements in horizontal fluidized beds): first, the Gas injector was turned on; then, the particles were injected as a Dirac pulse. At the end of the particle flow process, the balance recording was proceeded for an additional 10 s to ensure that all particles leaving the reactor were accounted for.
To obtain an initial estimate of the single particle residence time, the stationary sinking velocity of a single particle was considered. For this calculation, the dominant flow regime must be clarified. The calculation of the corresponding particle Reynolds number (Rep) can be proceeded by either knowing the correct initial particle velocity or through the Archimedes number (Ar). Since, in this work, the initial particle velocity was unknown, the flow regime was determined by the Archimedes number provided by Equation (1), which is defined as the ratio between the buoyancy force to the viscous frictional force:
A r = ρ p ρ f ρ p × g d p 3 ν 2
where ρ p , ρ f , d p , g , and ν are the particle density, the fluid density, the particle Sauter diameter, the gravitational acceleration, and the fluid kinematic viscosity, respectively. Depending on the Archimedes number, the particle Reynolds number Rep can be determined according to Equation (2), where the calculation method depends on the corresponding flow regime:
R e p = { A r / 18 , A r < 9 Laminar   Regime ( A r 13.9 ) 0.71 , 9 < A r < 83,000 Transition   Regime 1.73 A r 0.5 , A r > 83,000 Turbulent   Regime
R e p = | v p | d p ν
In this work, the calculated Archimedes number was Ar = 17.9, and hence the particle Reynolds number was Rep = 1.19. With the knowledge of the particle Reynolds number, the particle velocity was shown to be equal to 0.21 m/s (Equation (3)). The calculated particle residence time concerning the stationary sinking velocity can therefore be calculated according to Equation (4),
τ = L R v p
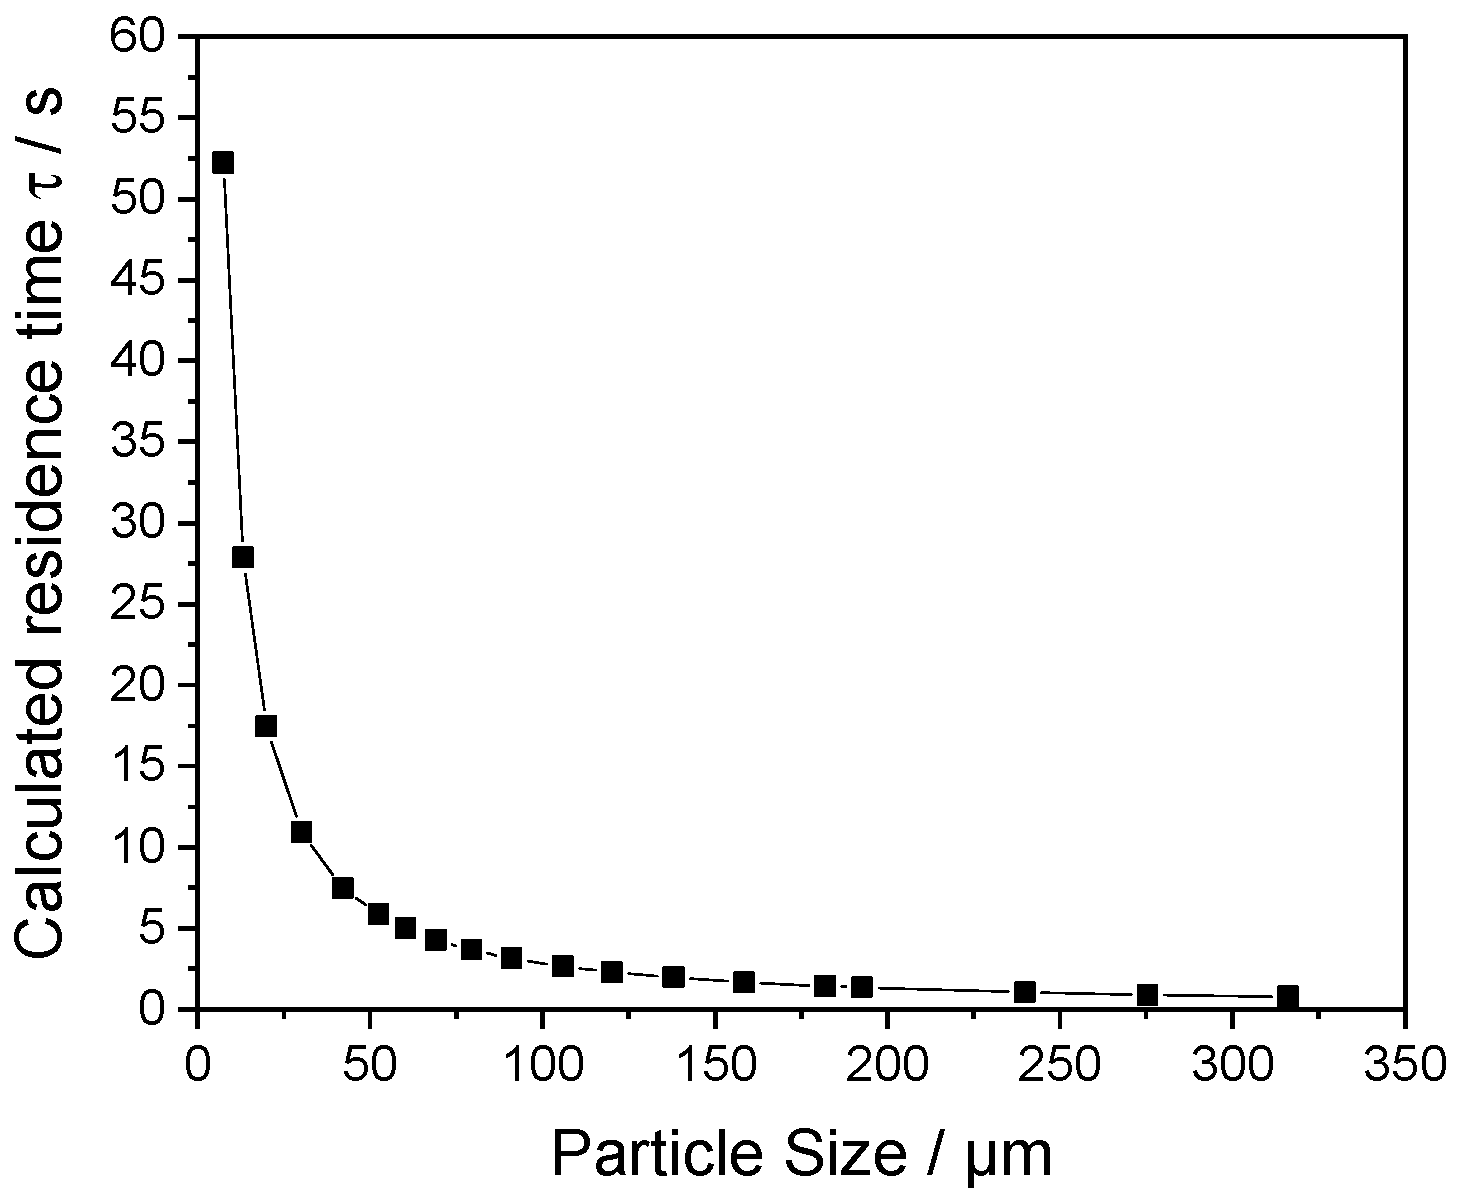
where LR is the length of the downer reactor from the sintered plate until the reactor outlet, i.e., LR = 0.8 m, leading to τ = 3.8   s . This particle residence time is applicable for a single particle with a size of x3,2 = 76.1 µm. Thus, smaller particles possess longer residence times, whereas larger particles have shorter residence times, as illustrated in Figure 2.
The particle sizes considered herein ranged from 7.56 µm to 316.23 µm. Consequently, the calculated single particle residence times for the maximum and the minimum particle size were 0.7 s, and 52.2 s, respectively.

2.2. Operating Conditions for the Analysis of the Particle Residence Time Distribution

Table 2 summarizes the operating conditions used to investigate the particle residence time distribution in a downer reactor. Herein, the volume flow rate of the sheath gas varied from 3.0 to 7.0 Nm3/h, stepped by 1.0. So, the corresponding sheath gas velocity ranged from 0.11 to 0.27 m/s. With respect to the calculated particle sinking velocity of 0.21 m/s, the influence of the sheath gas on the particle residence time is supposed to operate as a supportive force to drag the particles from the top to the bottom of the reactor. Therefore, the expected residence time for a particle under consideration of the supportive force is supposed to be shorter than the calculated residence time, exclusively considering the sinking velocity.
Table 2 provides an overview of the flow regime, pointing out the fluid and solid Reynolds numbers, where the calculation was performed according to Equations (18) and (19). If only the Reynolds number of the fluid is considered, laminar flow is present. For the solid phase, the transition regime is applicable. Within the interaction of the fluid-solid flow, the laminar regime of the fluid phase is affected. Furthermore, the higher the sheath gas flow rate, the greater the supposed impact of the particles. Yet, with an increasing sheath gas flow rate, volatilities in the experimental part are expected.
As the proposed reactor concept was designed for the thermal rounding of polymers, the feasible solids concentration was kept at low rates. This was motivated to avoid collisions between particles, as those collisions would lead to adverse agglomeration phenomenon and thus decrease the process performance and resulting yield. Herein, the cross-sectional average solid flux was 0.32 kg/m2s. So, during the experiment, the volume-based particle concentration, i.e., the ratio of the total particle volume to the reactor volume, was 0.876 × 10⁻⁴, in accordance with the low concentration concept proposed by Brauer [36].
The determination of the residence time distribution can be performed through either the deconvolution of the signals received from both the input and the output or the adaption of the residence time distribution curve E(t) to the output function under consideration of convolution. According to Brust et al. [34], the first method is numerically unstable since the quality of the raw data determines the level of oscillations and may result in abstract mathematical solutions. In this investigation, the convolution method [34] was applied to calculate the particle residence time distribution. To use the convolution method, the knowledge of a representative model function for E(t) is required. For the present tubular downer reactor, the analytical solution of the dispersion model (as with Michelsen et al. [37]) was used. Equation (5) presents the expression used for the residence time distribution curve E(t), whereas Equation (6) defines the Bodenstein number [35].
E ( t ) = 1 2   u π   D a x t × e x p ( ( L u t ) 2   4   D a x t )
B o = u × L D a x ,  
where t is the time, u is the axial flow rate (i.e., the stationary sinking velocity), D a x is the axial dispersion coefficient, and B o is the dimensionless Bodenstein number, i.e., the ratio between the convective mass transport and the diffusive axial mixing. Under an initial set of parameters for the variables t and B o , the particle residence time distribution curve E(t) was calculated. The corresponding output curve was afterward modeled via the convolution method, where the Dirac pulse was used as the input signal. By applying an iterative approach, the convoluted output curve was fitted to the measured data to obtain the axial particle dispersion coefficient.

2.3. Numerical Setup: The Euler-Lagrange Approach

The gas-solid multiphase flow was simulated herein through the Euler-Lagrange approach, where the carrier fluid flow field (continuous phase) is computed in an Eulerian frame of reference, whereas the particles (discrete phase) are continuously injected into the field, and their individual trajectories are tracked until they leave the computational domain.
For the incompressible and isothermal fluid mean flow, the averaged continuity equation and the Reynolds-averaged Navier-Stokes equation (RANS) are given by Equations (7) and (8), respectively. In the present Euler-Lagrange formulation, particles are treated as point sources, and so the fluid volume fraction (carrier phase) tends toward one, i.e., the volume occupied by the discrete phase is remarkably small in the bulk of the flow field.
· ( v f ) = 0
t (   v f ) + · (   v f     v f ) =   1 ρ f p + μ ρ f   · ( v f   ) +   1 ρ f · τ T , ij + g + S i , p
where v f , p, μ, ρ f , g , τ T , ij , and S i , p are the mean fluid velocity vector, the mean pressure, the fluid dynamic viscosity, the fluid density, the gravity acceleration vector, the turbulent Reynolds stresses, and the inter-phase momentum exchange, respectively.
The turbulent Reynolds stresses can be represented by Boussinesq’s hypothesis, in which the turbulent stresses are proportional to mean rates of deformation, as given by Equation (9) in tensor notation.
τ T , ij = 2   μ T S ij 2   3 ρ f k δ i j =   μ T ( v f , i x j + v f , j x i ) 2   3 ρ f k δ i j
where k is the turbulent kinetic energy, Sij is the mean rate of deformation, δij is the Kronecker delta (i.e., δij = 1 if i = j and δij = 0 if ij), and μ T is the turbulent viscosity.
To calculate the turbulent viscosity (µT), the Menter [38] shear stress transport (SST) k-ω model was used. The SST k-ω model is a hybrid turbulent model that applies the standard k-ω model in the vicinity of the wall and the standard k-ε model in the fully turbulent region far from the wall. To couple the two regions, suitable blending functions (i.e., smooth transition) are used. In this case, the turbulent viscosity is given by μ T = ρ f k / ω , and k and ω are calculated from the transport equations given by Equation (10) and Equation (11), respectively.
t ( ρ f   k   ) + · (   ρ f   v f     k   ) = · [ (   μ + μ T σ k   ) k   ] + P k β * ρ f   k ω
t ( ρ f   ω   ) + · ( ρ f   v f   ω   ) = · [ (   μ + μ T σ ω , 1   ) ω   ] + γ 2 ( 2 ρ f S i j . S i j 2 3   ρ f   ω v f , i x j δ i j ) β 2 ρ f   ω 2 + 2 ρ f σ ω , 2 ω k x k ω x k
where k and ω are, respectively, the turbulent kinetic energy and the turbulence frequency, and P k = ( 2 μ T S i j . S i j 2 / 3 ρ f   k v f , i / x j δ i j ) . The revised model constants are [39]: σk = 1.0, σω,1 = 2.0, σω,2 = 1.17, γ2 = 0.44, β2 = 0.083, and β* = 0.09. The relationship between ω and ε is given by ε = k ω , where ε is the turbulent kinetic energy dissipation rate.
Despite the low particle concentration (dilute system), particle-particle collisions were considered [30,40]. The particle-particle and particle-boundary contacts were modeled through the spring-dashpot Hertzian model and a suitable friction model [41]. The maximum interaction distance equals the maximum particle diameter, and the collision resolution has a step width of 1.0. Furthermore, no chemical reactions and temperature effects were considered herein. The particle trajectories are obtained by integrating Newton’s second law (Equation (12)) and the particle velocity (Equation (13)).
m p d v p d t = F d + F gb + j = 1 N c ( F n i j + F t i j ) + F
d x p d t = v p
where mp, v p , x p , F d , F gb , F n i j , F t i j , and F are the particle mass, the particle velocity vector, the particle position vector, the drag force, the gravitational-buoyance forces, the normal contact force, the tangential contact force, and other additional forces, respectively. N c is the total number of particles (j) in contact with the particle (i). For a homogeneous spherical particle, m p = ρ p   π d p 3 / 6 , where ρ p is the apparent particle density and d p is the particle diameter.
In this work, only the contributions from the drag force, the gravitational and buoyance forces, and the contact force (Hertzian contact model given by Equations (16) and (17)) were considered. The gravitational-buoyance forces ( F gb ) are given by Equation (14), whereas the drag force ( F d ) can be represented by Equation (15).
F gb = m p g ( ρ p   ρ f   ) ρ p  
F d = 1 8 C D   ρ f π   d p 2 |   v f v p | (   v f v p )
F n i j = ( k n δ n 3 / 2 η n , j G n ) n
F t i j = ( k t δ t η t , j G c t ) t
where G is the equivalent shear modulus, n and t are the normal and tangential unit vectors between the particles i and j, η is the damping coefficient, k is the stiffness coefficient, and δ is the overlap distance between the involved particles. To model the drag coefficient (CD), the empirical model by Putnam [42], which is suitable for rigid and sparsely distributed spherical particles (i.e., dilute dispersion), was used (Equation (18)), whose relative Reynolds number of the particle ( R e p ) is given by Equation (19).
C D = { 24 R e p ( 1 + 1 6 R e p 2 / 3 )   i f   R e p < 1000 0.424                         i f   R e p   1000
R e p = ρ f d p | v p   v f | μ f
The influence of the dispersed phase on the continuous phase, introduced through the source term S i , p in Equation (8), is defined by Equation (20), where Np and Vk are the total number of particles and the volume of the kth particle, respectively [40].
S i , p = k = 1 N p (   F d + F g b ) k k = 1 N p V k
Since the particle trajectories are computed by the mean fluid flow properties from the Reynolds-averaged Navier-Stokes equation (RANS), the particle turbulent dispersion phenomenon was modeled through the stochastic Discrete Random Walk (DRW) model [43]. In the DRW model, particles are considered to interact with turbulent eddies successively over specific time intervals. The fluctuating velocities are supposed to be functions of the local turbulence kinetic energy (k). Additional details concerning the DRW model can be found in Mofakham and Ahmadi [44].

2.4. Computational Mesh and Numerical and Boundary Conditions

The transient and turbulent Euler-Lagrange simulations were performed through the open-source CFD code OpenFOAM®, version 5.x. For the post-processing, the open-source multi-platform data analysis and visualization software ParaView®, version 5.8.1, was used. The 3D geometry (STL files) and the computational mesh were built through the open-source software Gmsh©, version 4.6.0, and the mesh generation utility snappyHexMesh (OpenFOAM®) [45], respectively.
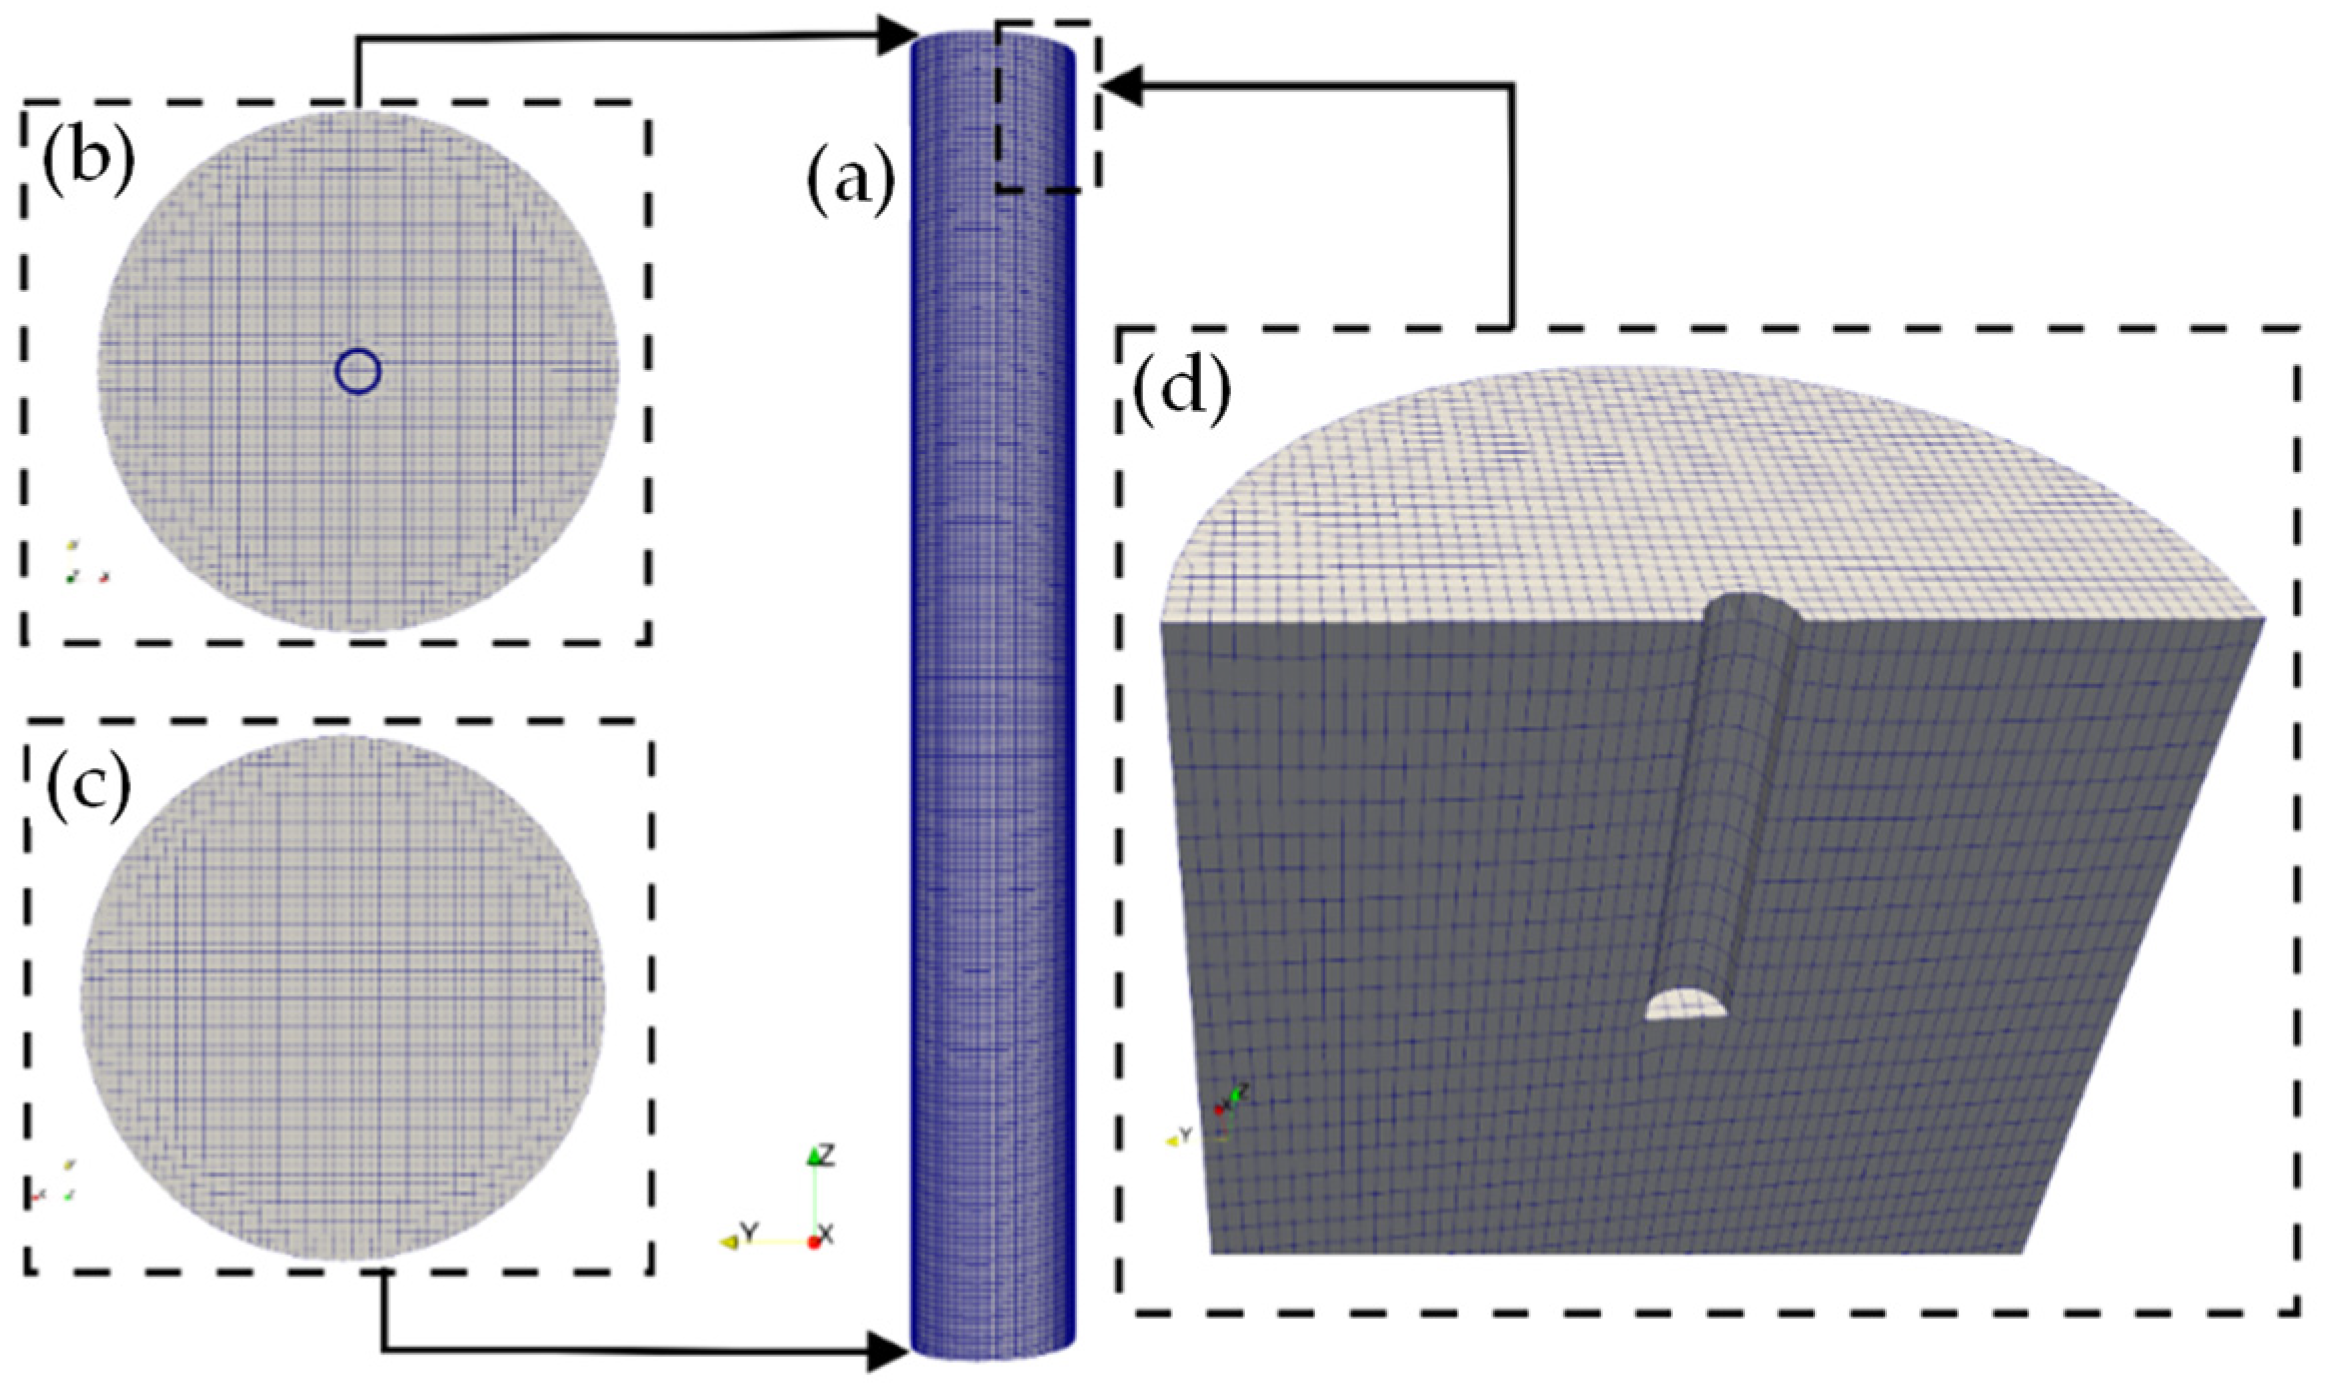
A suitable number of cells for the downer reactor 3D mesh was chosen based on a grid size independence test. In this case, the results of the fluid flow properties from three different meshes comprised of 105,675 (Mesh A), 387,136 (Mesh B), and 623,792 (Mesh C) cells were compared under the same conditions. Since there were no significant differences in the simulated results when refining Mesh B, this one was selected for the current study. Figure 3 shows the hexahedral computational mesh used herein, where the grid lines were aligned with the flow to avoid numerical dispersion.
The main quality parameters of the 3D mesh presented in Figure 3 are as follows: maximum aspect ratio of 6.89; maximum non-orthogonality of 31.62°, a non-orthogonality average of 1.77°, and maximum skewness of 0.61. According to the OpenFOAM® user guide, to ensure that the resulting mesh is of sufficient quality for subsequent calculation, among other quality parameters, the maximum non-orthogonality and the maximum skewness should be less than or equal to 65.0° and 4.0, respectively.
To avoid numerical stability problems during the turbulent gas-particle flow calculation, the first-order and bounded upwind discretized scheme was applied for all divergence terms in the gas phase transport equations. For the Laplacian and gradient terms, a second-order linear scheme was used, whereas for the corresponding unsteady terms (temporal discretization), the Euler scheme, i.e., first-order and bounded implicit scheme, was applied. Adjustable time steps were used for the solid and gas phases with maximum Courant-Friedrich-Levy numbers (CFL) of 0.3 and 5.0, respectively. Table 3 summarizes the main numerical methods and boundary conditions used in all simulations.
In the absence of experimental data, the k and ω values at the inlet were estimated, respectively, by k = 3 ( I | u r e f | ) 2 / 2 and ω = k 0.5 / ( 0.07 C μ 0.25 L ) , where I is the turbulence intensity, L is the hydraulic diameter, u r e f is a reference velocity (e.g., the inlet gas velocity), and C μ is an empirical constant equal to 0.09 [47]. For the downer reactor annular and central inlets, a turbulence intensity I = 0.1 was used.

3. Results and Discussion

3.1. Particle Size Characterization

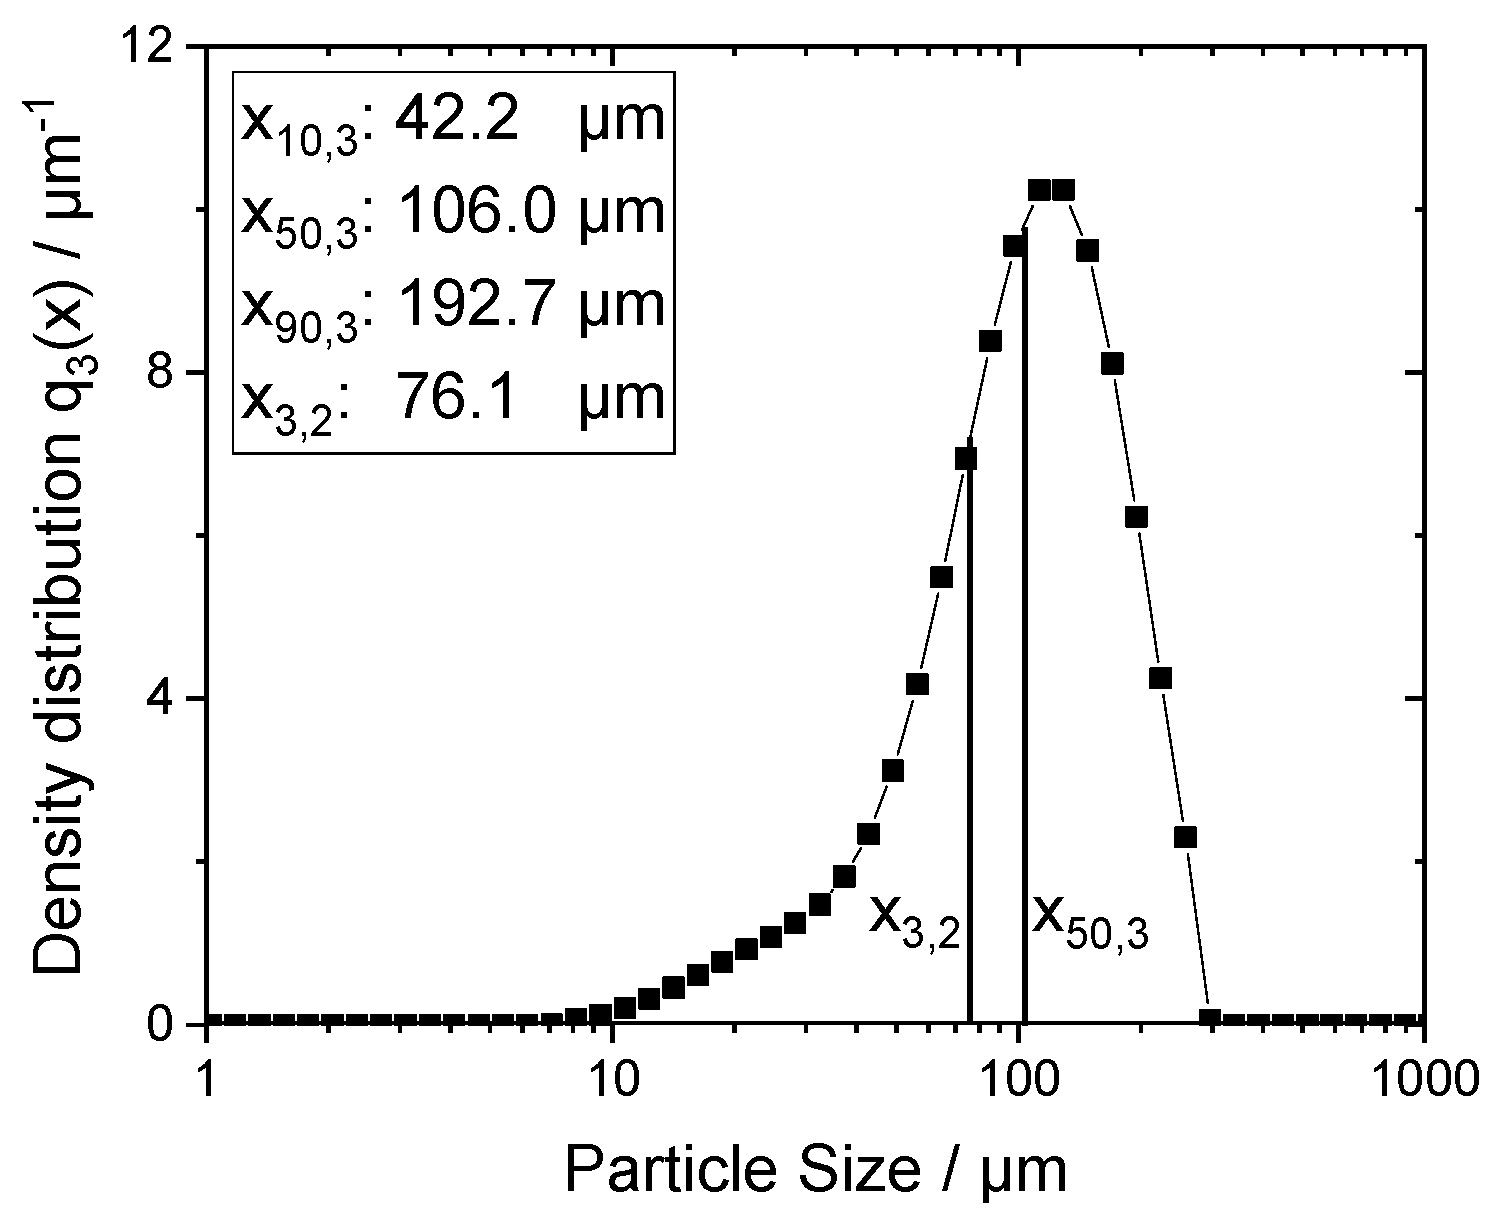
To characterize the particle size, essential for the numerical simulation, the particle size distribution (PSD) of the used polypropylene powder sample is shown in Figure 4.
The feed material has a (volume-based) mean diameter x50,3 = 106.0 µm, and a Sauter diameter x3,2 = 76.1 µm. The particle sizes for x10,3, x50,3, and x90,3 were 42.2, 106.0, and 192.7 µm, respectively. The span of the feed material, (x90,3 − x10,3)/x50,3, was narrow, having a value of 1.42. For the numerical simulation, the volumetric particle size distribution presented in Figure 4 was used.

3.2. Physical Validation of the Proposed Euler-Lagrange Approach against Experimental Data for Different Operating Conditions

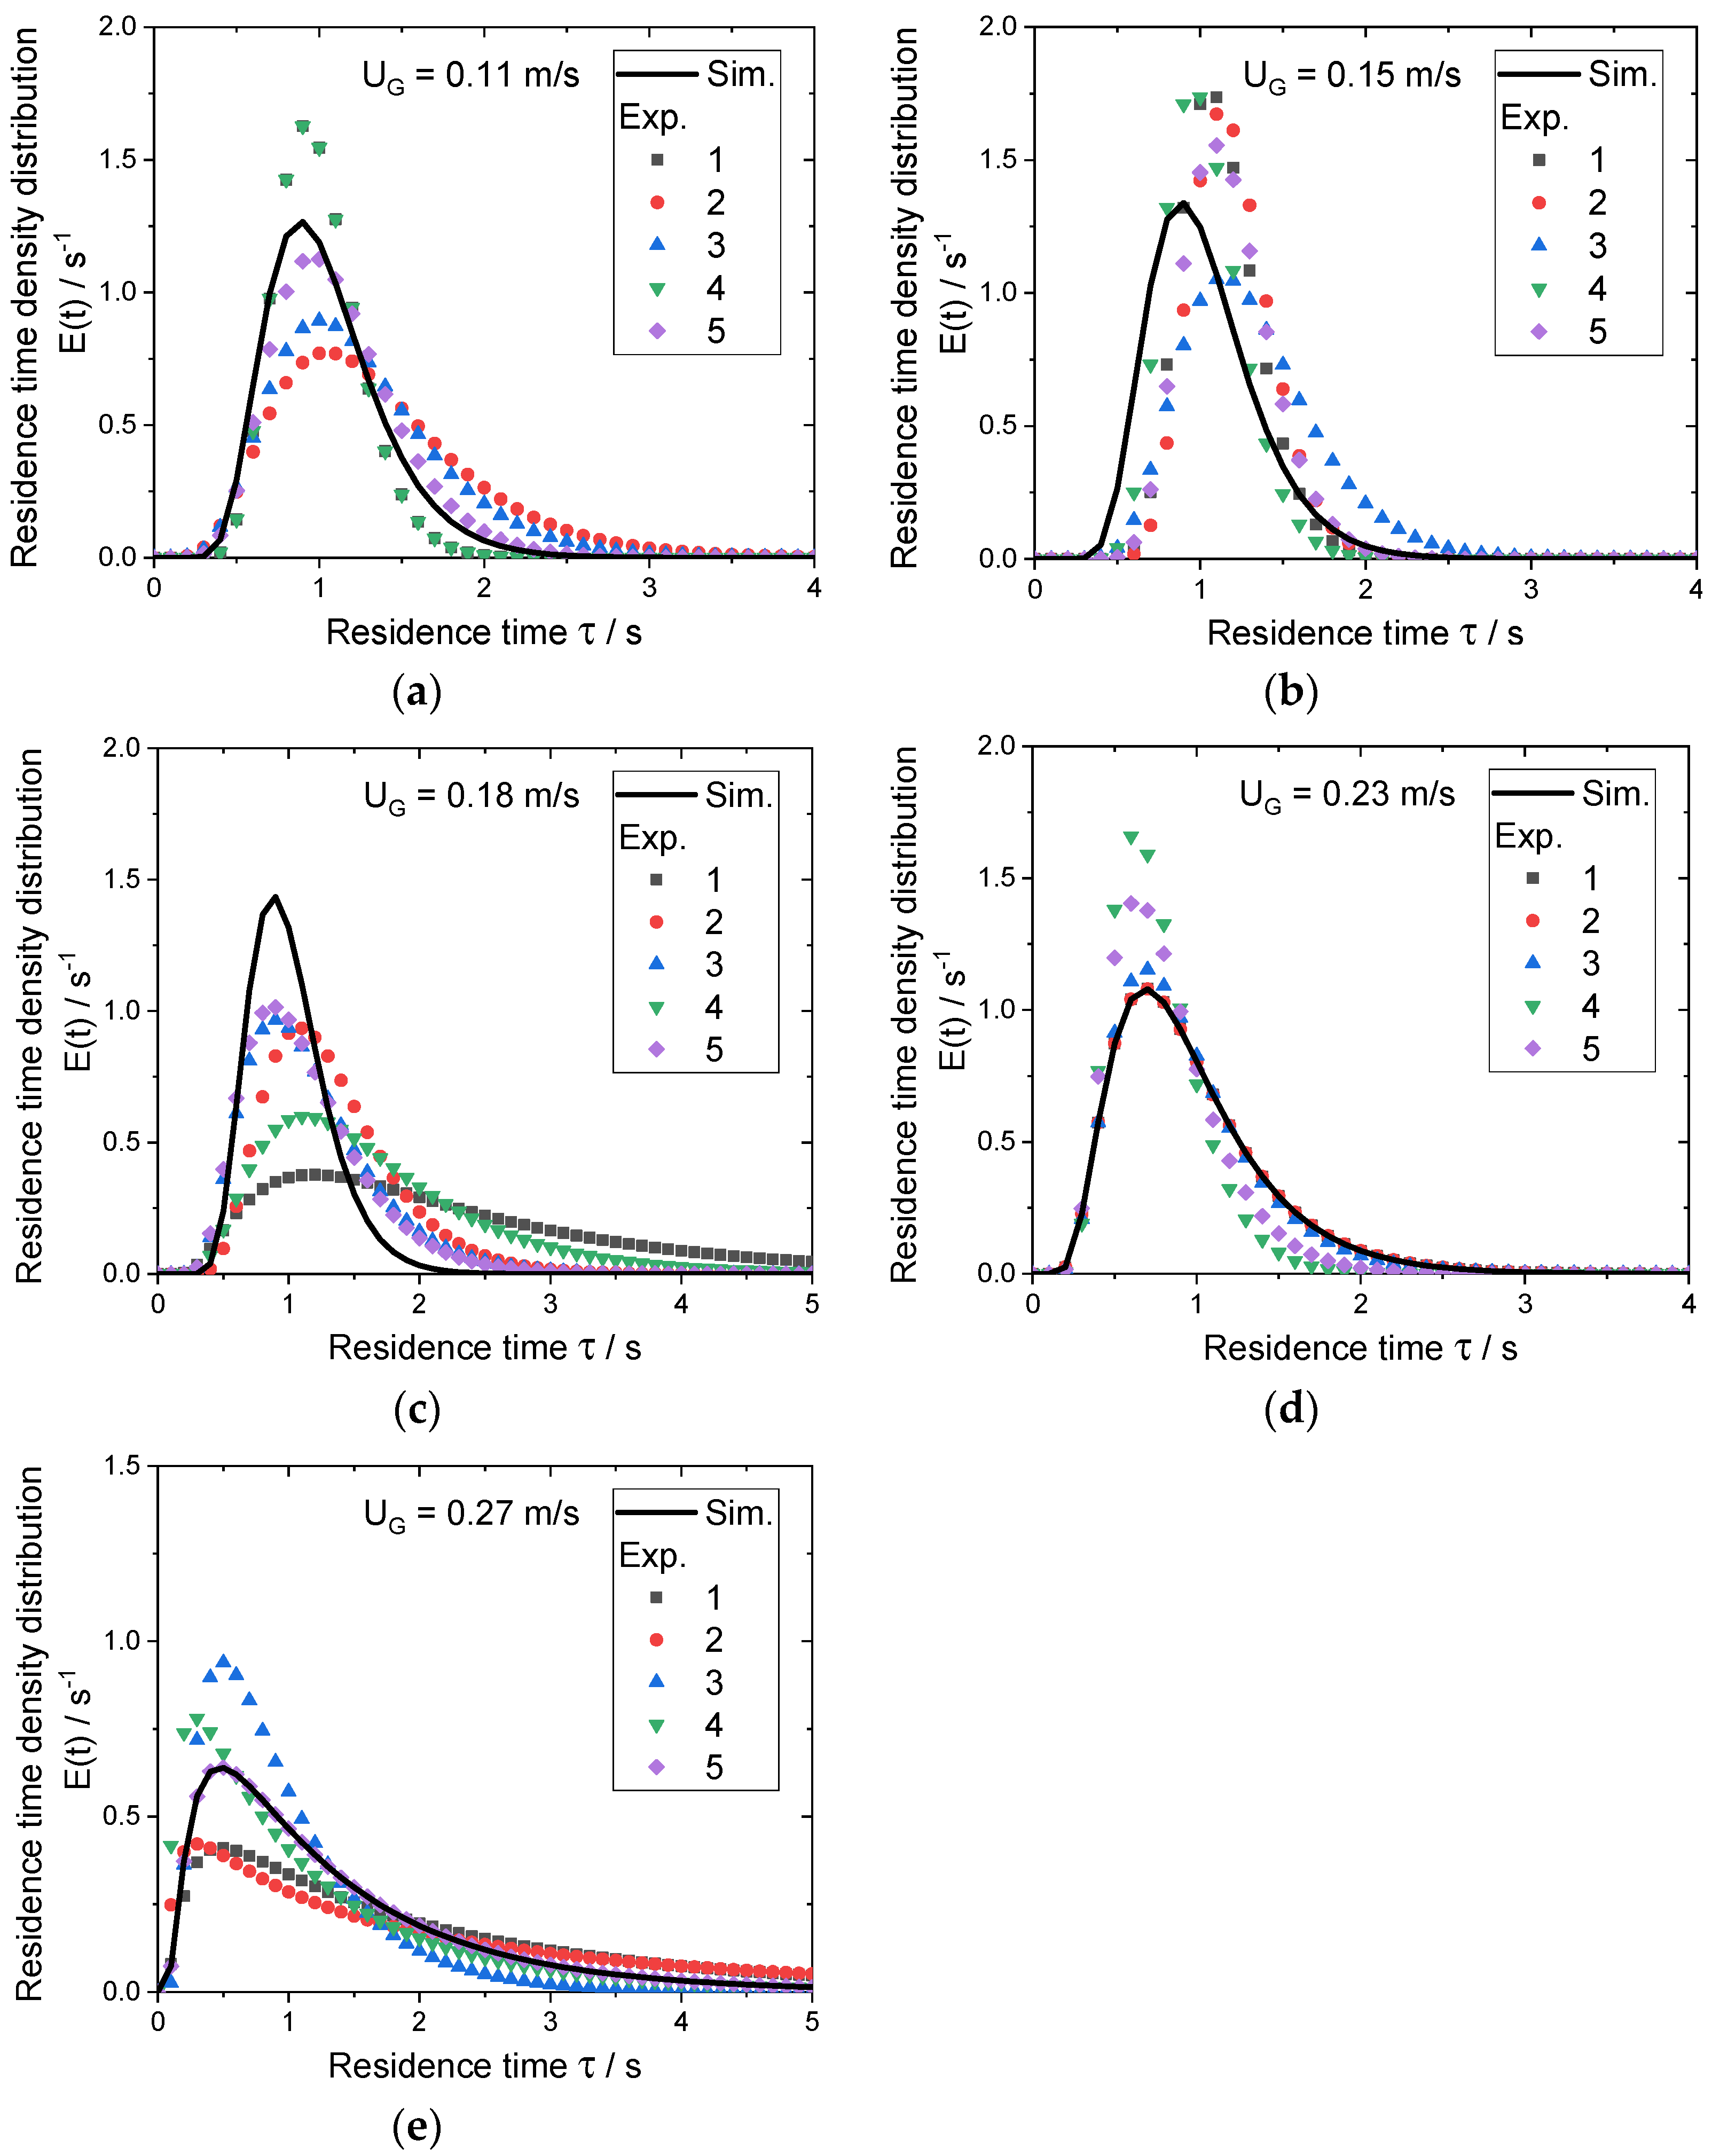
Figure 5 presents the particle residence time density distributions for different values of the sheath gas velocity (UG) concerning the experimental and numerical results.
Each figure displays six graphs where one belongs to the numerical data, and the remaining five present the experimentally determined results. To ensure statistical relevance, the experiments were carried out in repeated intervals. Since the operating conditions varied, e.g., the sample-specific particle size distribution occasionally differs from the one of the master batch, the experimental particle residence time distribution curves present variances. In contrast, the simulation part does not consider these experimental uncertainties. Thus, the numerical and experimental circumstances do not match exactly, wherewith an accurate overlay of the numerical and experimental residence time distribution curves cannot be expected.
Within the experimental determination of the particle residence time, especially for the lower sheath gas velocities of 0.11 to 0.18 m/s, deviations are observable. Since identifying their origin is difficult, implementing the numerical model is challenging. However, for this investigation, the ascertained average was considered for the analysis of the experimental peak and maximum particle residence time displayed in Table 4.
Concerning the observable trend, the numerically determined behavior of the particle residence time density distributions agreed well with the corresponding experimental data. As already mentioned above, for low sheath gas velocities, certain discrepancies regarding the qualitative process flow are distinguishable. The largest variety can be determined in Figure 5c, wherein the graphs for experiments 2, 3, and 5 show a preferable match with the numerical graph. The graphs for experiments 1 and 4 deviate, especially in the broadness of their distribution. The authors propose that this deviation is caused by indifferences regarding undetectable flow effects and variations in the particle size distribution between batches.
The experimental and numerical graphs in Figure 5a,b show good conformity. However, in Figure 5b, the experimental graphs show a minor shift towards longer residence times. The analysis of the residence time density distribution for the sheath gas velocities 0.23 and 0.27 m/s reveals the best fitting agreement of the experimental and numerical values. Thus, with higher velocities, the accuracy of the proposed model is increased. Despite the minor discrepancies, the herein proposed three-dimensional numerical model provides a sufficient base for analyzing particle residence times in a concurrent downer reactor, as the validation against the experimental data proved.
Table 4 summarizes the experimental and numerical particle peak (i.e., τ P e a k ,   E x p , and τ P e a k ,   S i m ), and maximum (i.e., τ E x p , and τ S i m ) residence times for different values of the sheath gas velocity. The residence time for a particle with the size of the Sauter diameter (x3,2 = 76.1 µm), using its stationary sinking velocity of 0.21 m/s, calculated through Equation (4) ( τ C a l c ), is presented in Table 4, as well.
As shown in Table 4, the simulated particle peak residence time decreased from 0.9 to 0.5 s by increasing the sheath gas velocity from 0.11 to 0.27 m/s. The peak τ P e a k ,   E x p shows a similar trend, where the minor shift of Figure 5b and the variation regarding the distributions in Figure 5a are reflected.
As the peak particle residence time is cut into halves, the maximum residence time is doubled concerning the lowest to the highest investigated sheath gas velocity. Thus, the experimental and numerical maximum particle residence times ranged from 2.4 to 4.62 s and 2.4 to 5.0 s.
Regarding the calculated particle residence time ( τ C a l c ), the following observations can be drawn. Since the calculated stationary sinking velocity for a particle with the Sauter diameter was 0.21 m/s, sheath gas velocities below this value tend to have a low impact on the particles. As the sheath gas velocity exceeds the stationary sinking velocity, the impact of the sheath gas on the particles increases. Furthermore, since larger particles own a larger cross-sectional area, the impact of the sheath gas on these particles is strengthened, resulting in significantly shortened peak residence times. On the other hand, an overall broadened residence time density distribution is observable, as the smaller particles experience an opposing interference.
To summarize, the higher the sheath gas velocity, the shorter the peak particle residence time, although the maximum residence time tends to increase significantly. Additionally, it is expected that larger particles are accelerated under the impact of the sheath gas at the center region of the reactor, whereas smaller particles are decelerated and remain near the wall regions where the sheath gas velocity is lower.

3.3. Numerical Analysis of the Fluid-Particle Dynamics in a Downer Reactor under Different Values of the Sheath Gas Velocity

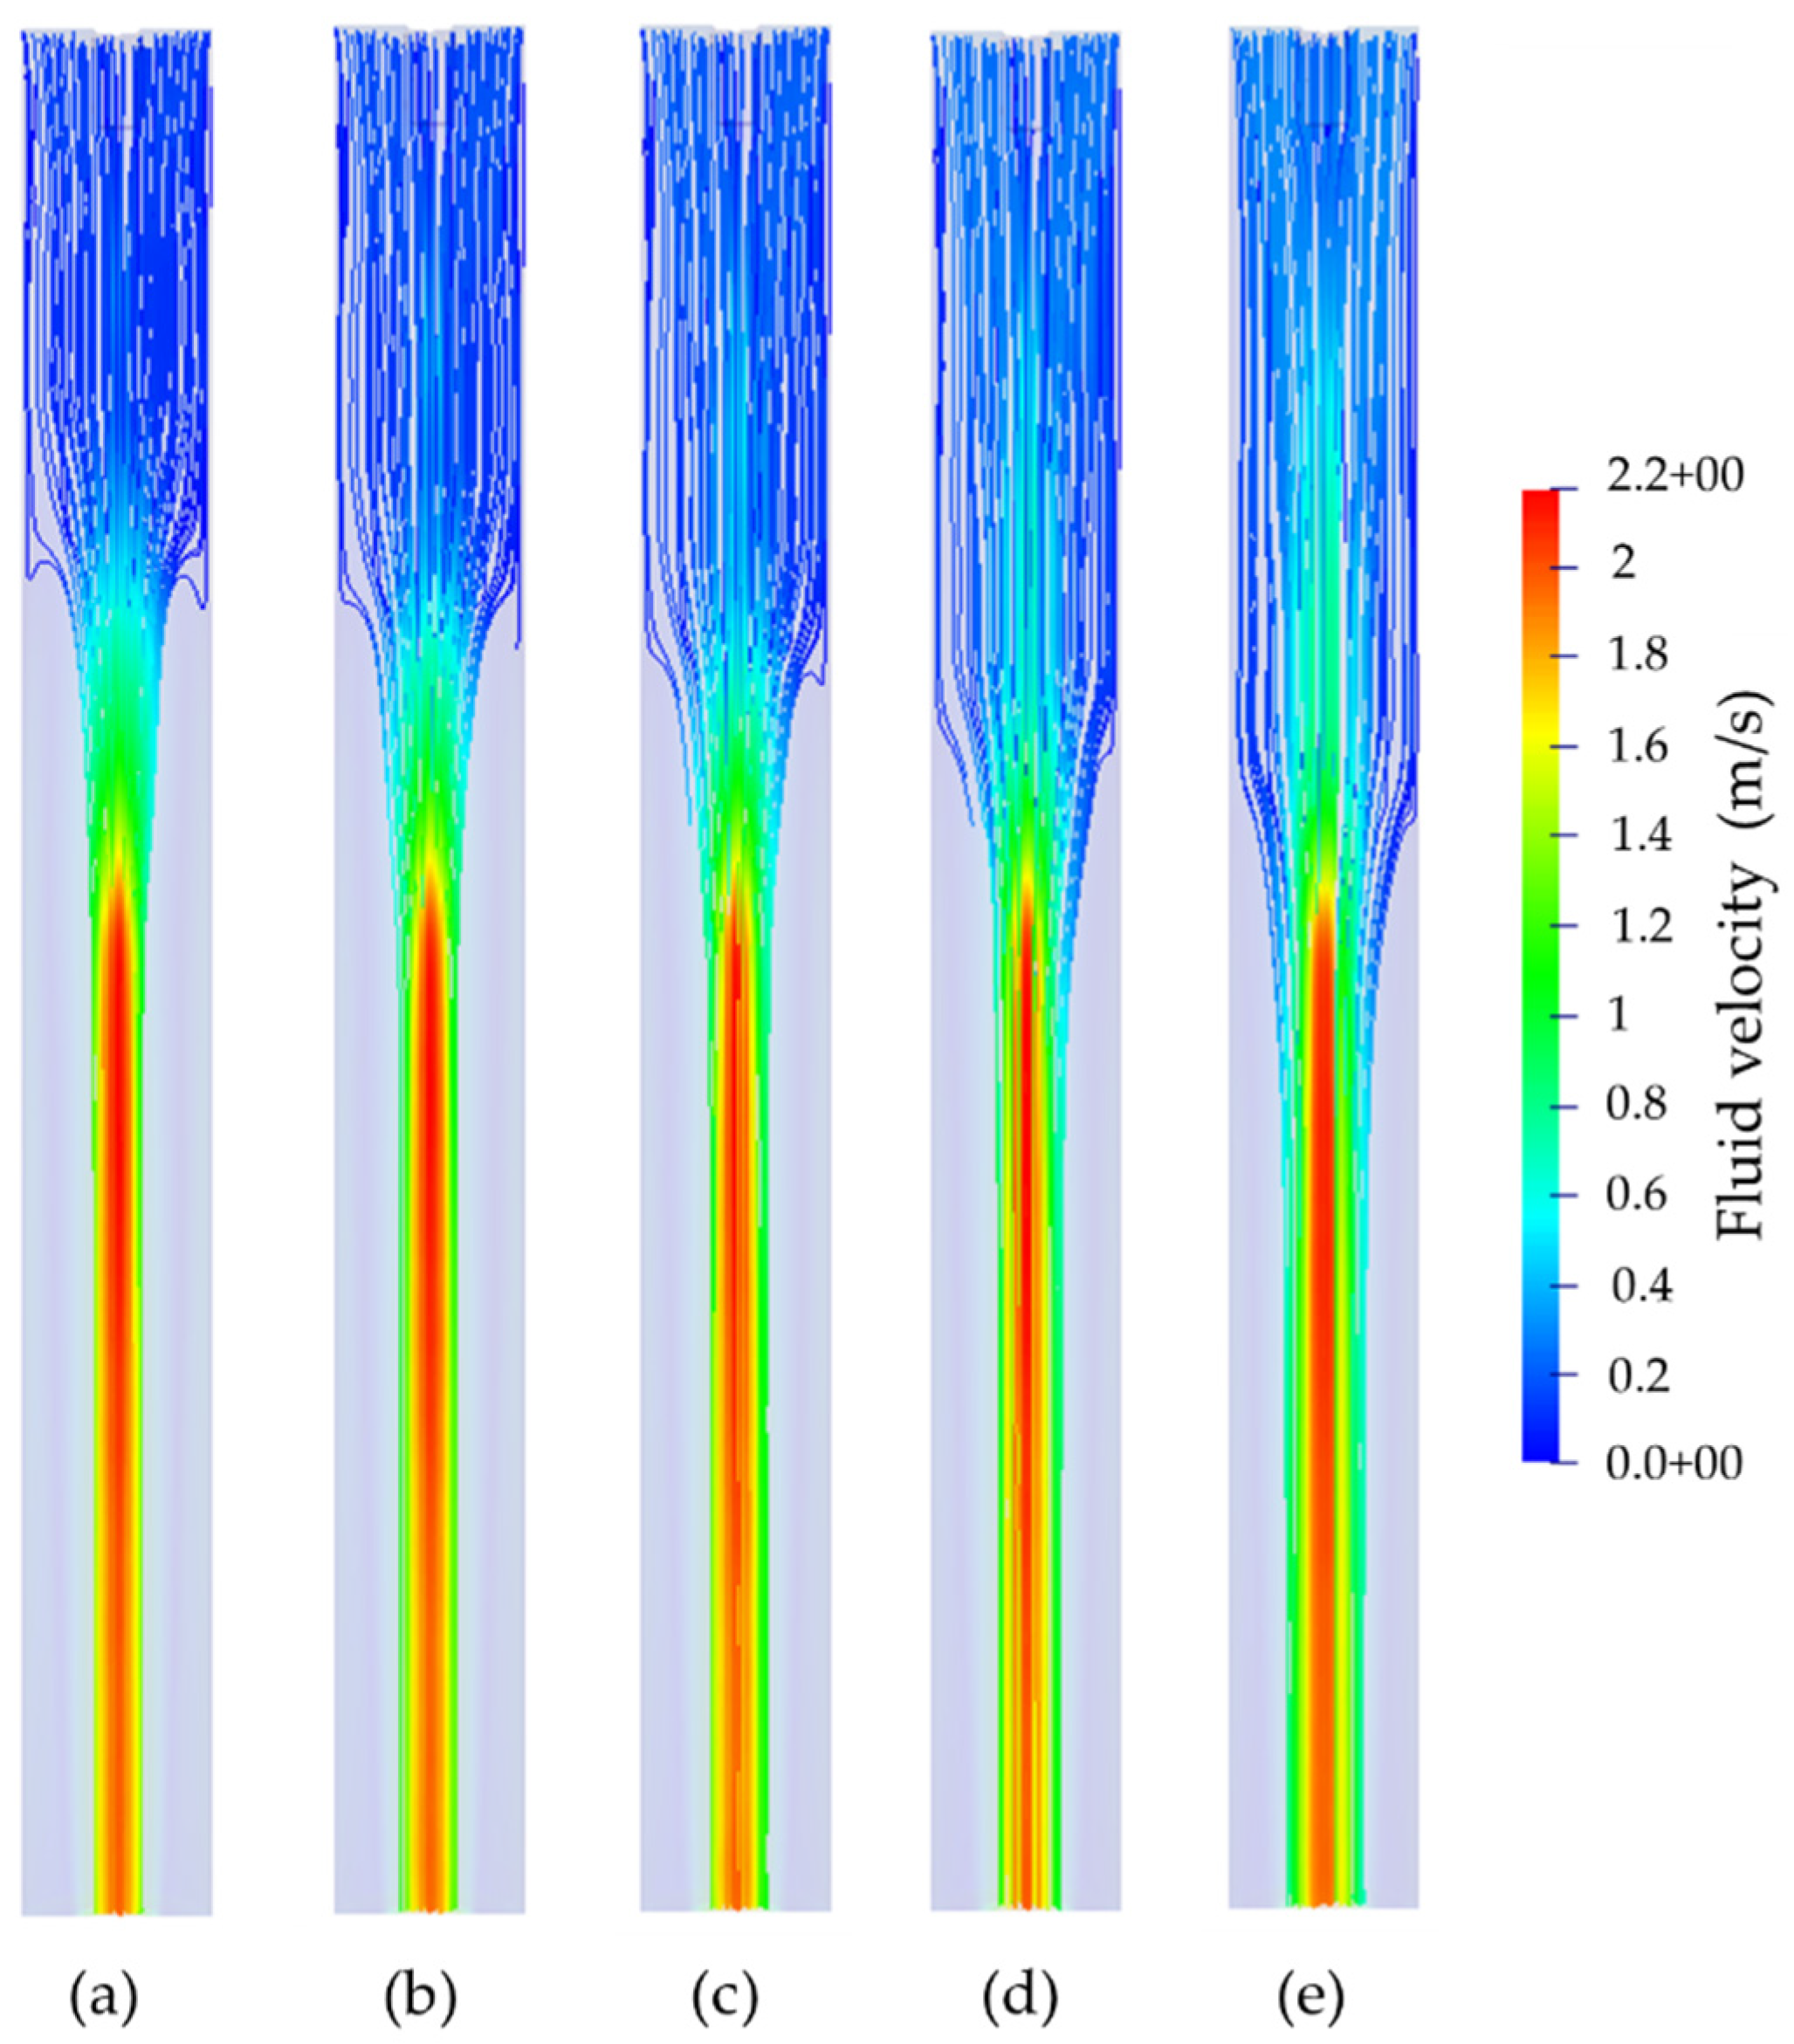
To further evaluate the fluid-particle dynamics inside the reactor, Figure 6 presents the simulated fluid velocity distribution by using streamline functions under different operating conditions. The snapshots were taken at τ = 0.6 s to ensure a reasonable comparison between the particle-fluid behavior under different values of the sheath gas velocity.
As noted in Figure 6, regarding the fluid velocity and the corresponding streamlines, the reactor can be divided into two axial sections. The first axial section ranges from the top of the reactor down to about the particle injector inlet, which is characterized by a laminar flow regime. The second axial section comprises a core-annular flow pattern from the end of the first section to the reactor outlet, where a turbulent fluid-solid flow is observed. The maximum fluid velocity of 2.2 m/s can be observed in the center region of the reactor (second axial section). By increasing the sheath gas velocity, the second axial section decreases, whereas the annular structure width increases. On the other hand, an increment of the first axial section is observed by increasing the sheath gas velocity, indicating that the turbulence induced at the particle inlet is reduced, and the homogenous flow pattern is drawn out across the length of the reactor. The development of the core-annular flow regime can be due to the particle-flow interaction, where the solid phase leads to a large increment in the fluid velocity. However, the higher the sheath gas velocity, the lower the influence of the solid phase on the fluid phase, especially for sheath gas velocities higher than the previously calculated stationary sinking velocity (0.21 m/s).
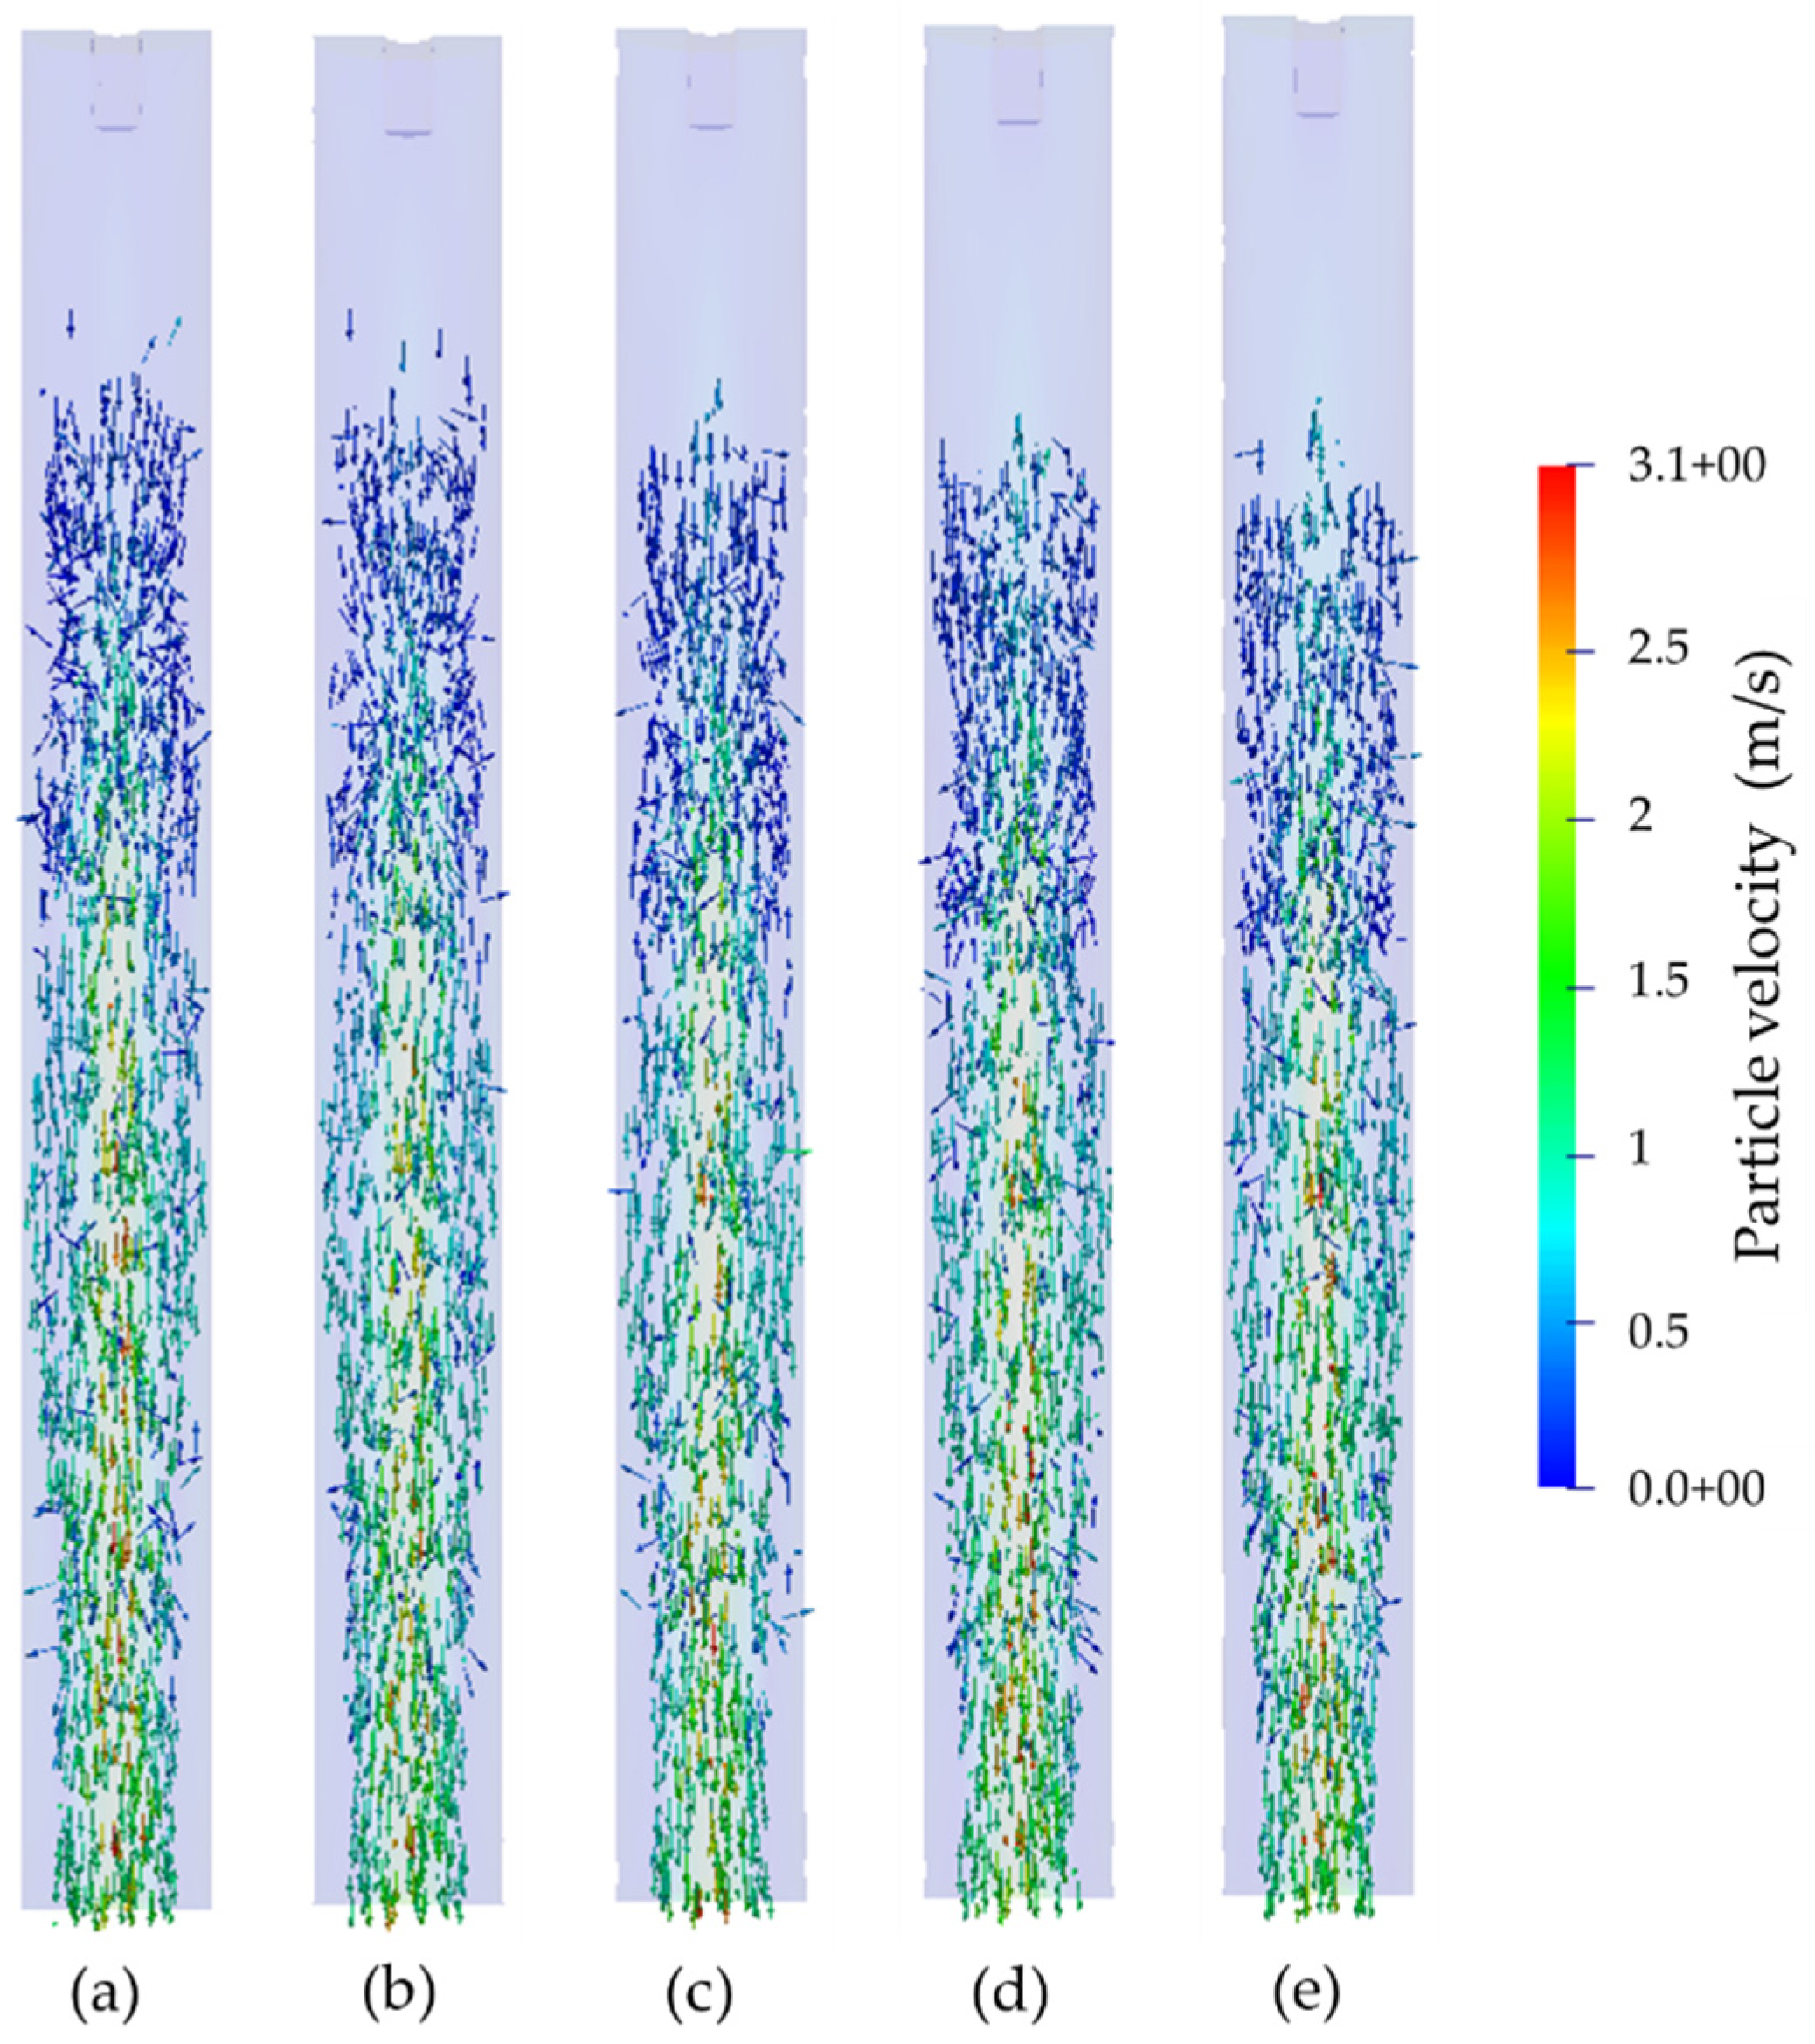
Furthermore, the impact of the fluid-solid interaction on the particle distributions inside the reactor can also be seen in Figure 7, where the particle velocity vector distributions are shown under different values of the sheath gas velocity.
A core-annular structure can also be seen in Figure 7, where the particles have higher velocities. In general, the solid phase developed an elongated drop-shaped structure, with a maximum velocity of 3.1 m/s at the central core region. The maximum solid velocity was higher than the observed maximum fluid velocity (Figure 6).
With increasing the sheath gas velocity, the radial distribution of the solid phase becomes more homogenous, and the flow pattern is compacted (Figure 7). Additionally, with increasing the sheath gas velocity, the acceleration of the solid phase is derived more from the sheath gas than from the gravitational force, leading to a denser flow pattern.
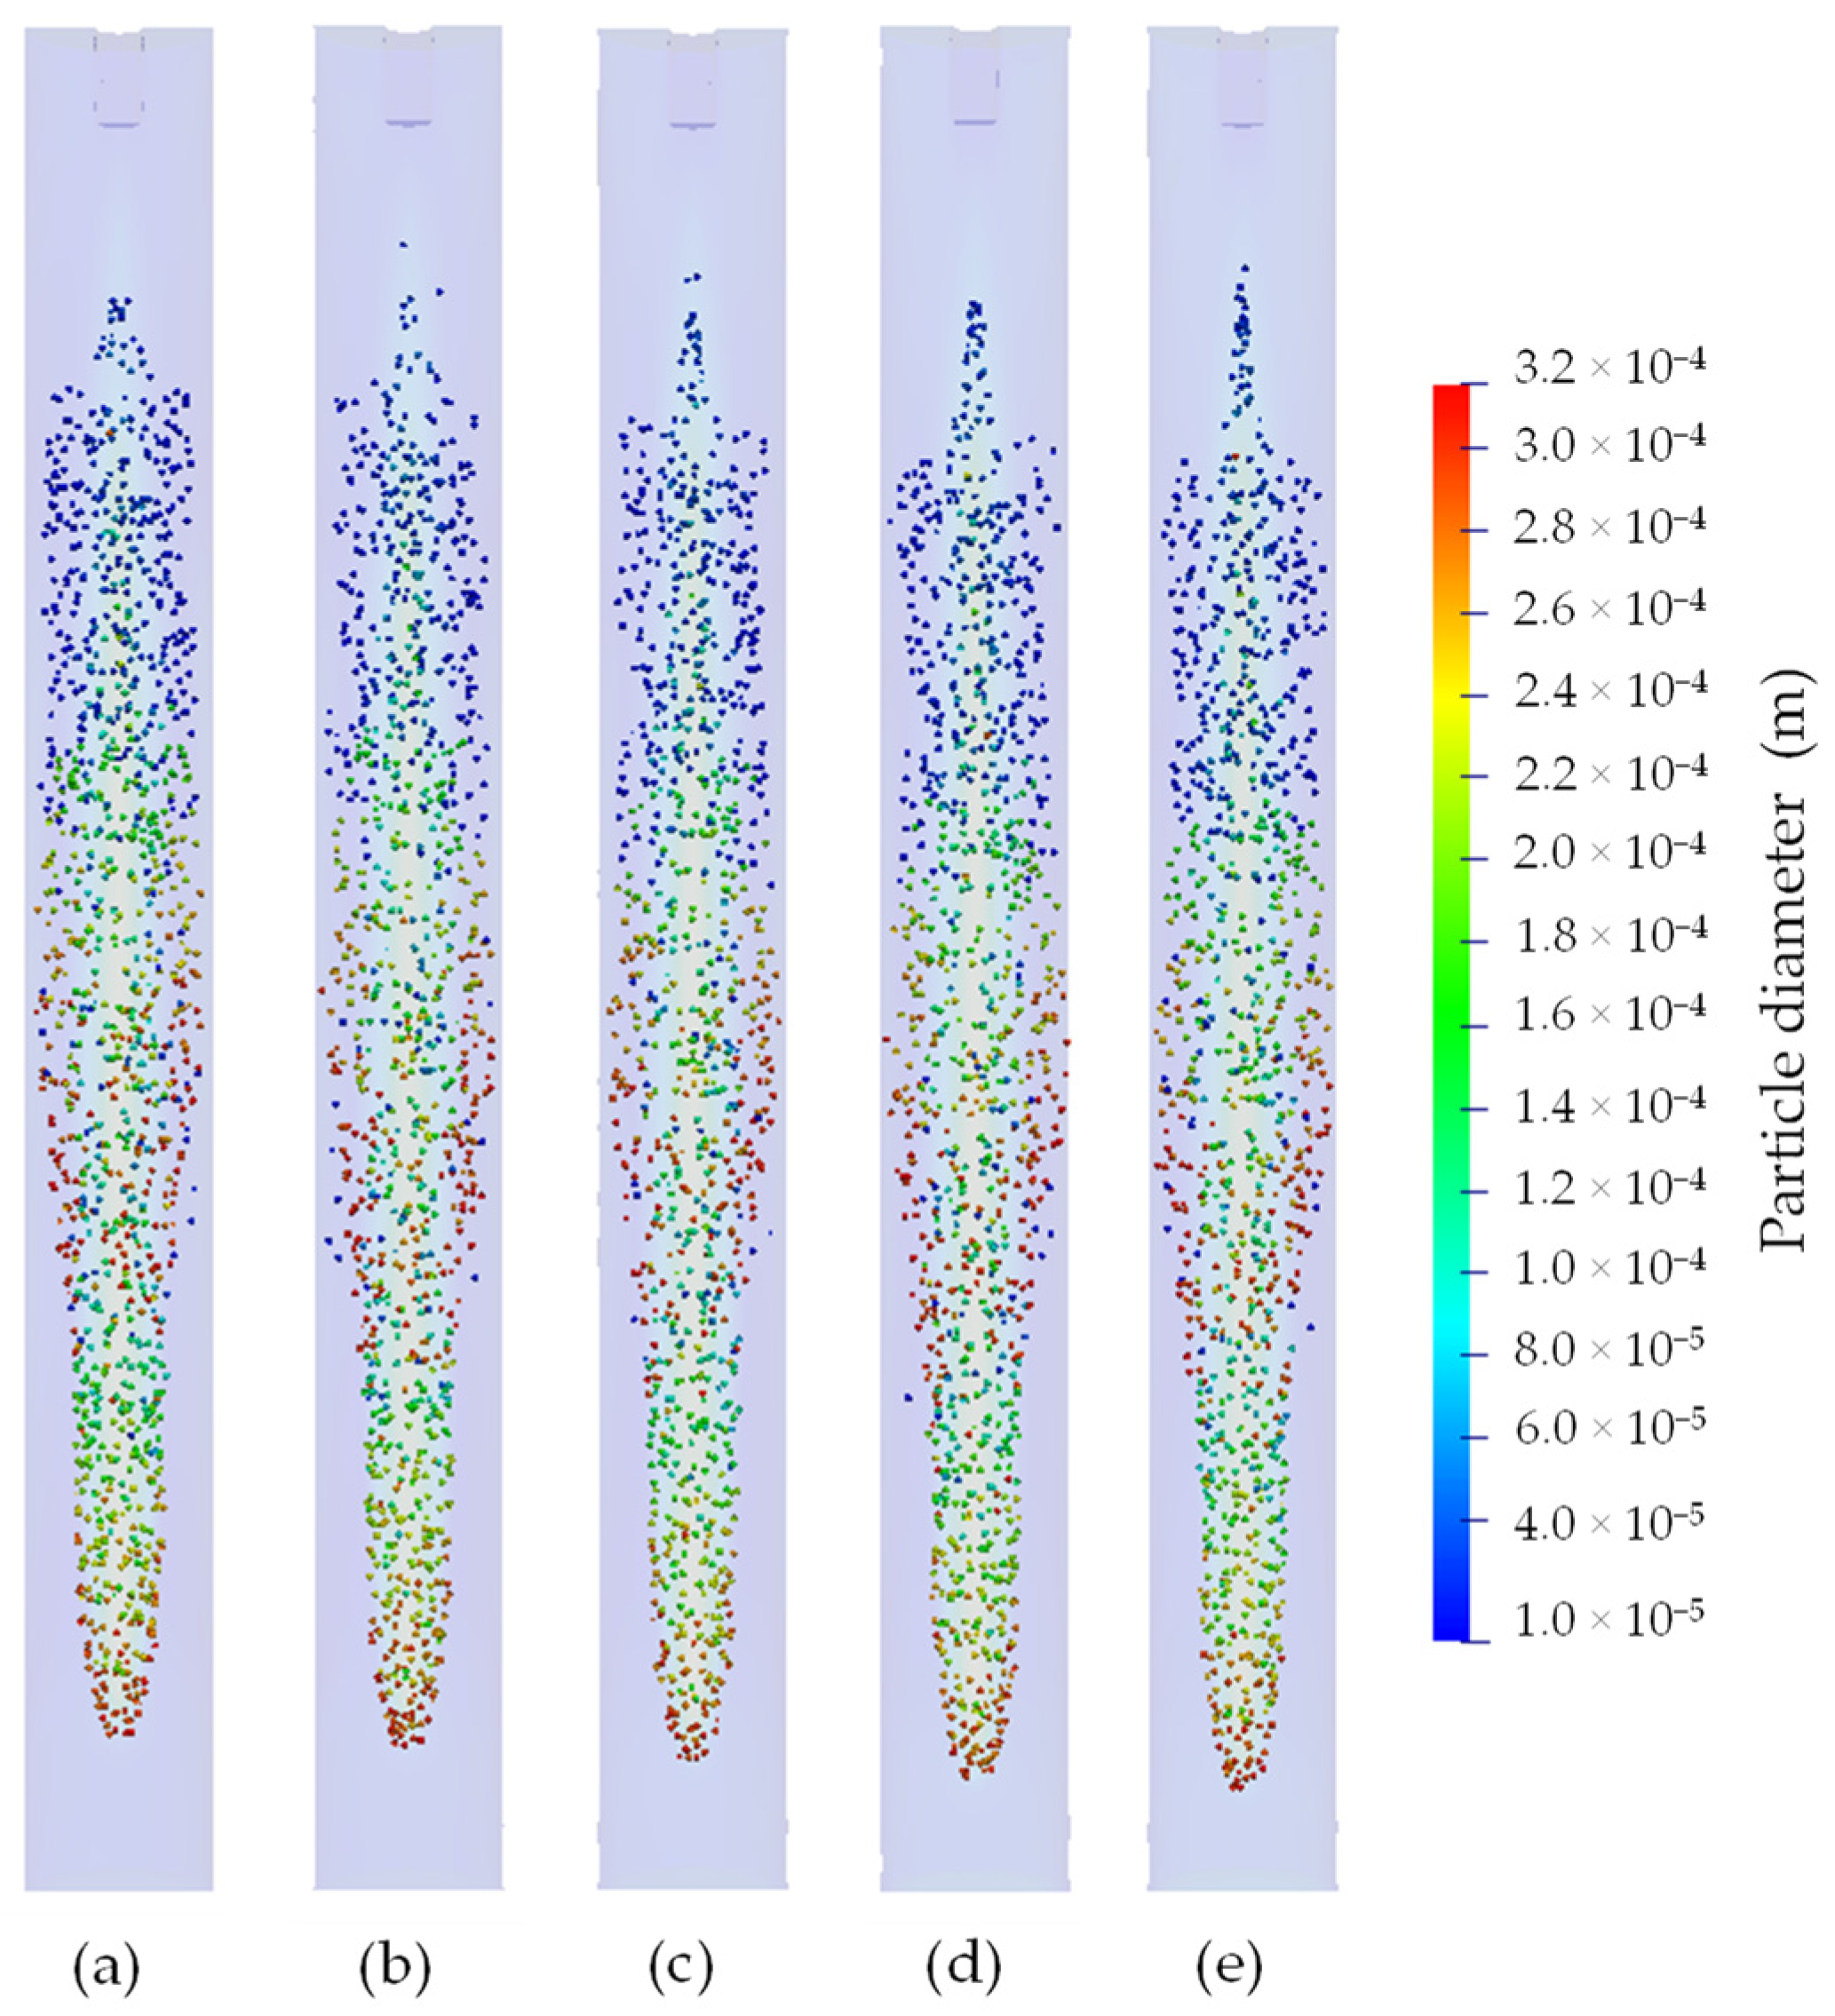
It is noticeable that some particles have a significantly lower velocity, namely those located at the end of the droplet. The particle drop-shaped structure formation can be better observed in Figure 8. In this case, the simulated particle diameter distributions are shown along the downer reactor under different operating conditions.
As shown in Figure 8, smaller particles, with a minimum diameter of 10.0 µm, tended to concentrate at the top of the reactor, comprising the beginning of the drop-shaped particle flow pattern, as well as the beginning of the protrusion near the wall regions. On the other hand, larger particles, with a minimum diameter of 260 µm, were concentrated towards the end of the drop-shaped particle flow pattern. In between, the remaining particles are arranged according to their size factors. No significant effect of the sheath gas velocity on the particle size distribution along the downer reactor was observed. As expected, larger particles result in shorter residence times when compared to smaller particles.

3.4. Analysis of the Fluid-Particle Flow Structure in a Downer Reactor through the Experimental and Numerical Bodenstein Numbers (Bo), Variances ( σ 2 ) , and Axial Dispersion Coefficients ( D a x )

Table 5 shows the experimental and numerical Bodenstein numbers ( B o ), the Variances ( σ 2 ), and the axial dispersion coefficient ( D a x ) under different operating conditions. As the Bodenstein number is defined as the ratio of convective mass transport to dispersive mass transfer, the PFR (Plug Flow Reactor) model is characterized by B o , while for the CSTR (Continuous Stirred-Tank Reactor) model it is B o 0 . Regarding the scattering around a mean value, the variance was used herein to represent the width of the residence time distribution.
The Bodenstein numbers have been calculated using the Variance ( B o = 2 / σ 2 ) . Furthermore, the axial dispersion coefficient results from Equation (6), where u = 0.21 m/s and L = 0.8 m. For the experimental values, the averages are taken into consideration.
The displayed experimental and numerical values for the evaluation parameters of the flow regime reveal a proper agreement, whereby the sheath gas velocity of 0.18 m/s is an exception. As the experimentally determined residence time distributions for the latter present the strongest deviation, this is reflected by the average values for the Variance, Bodenstein number, and axial dispersion coefficient. However, for the calculation of the latter, experiments 1 and 4 were not taken into account as those graphs do not fulfill the basic shape assumption of a Gaussian distribution that is necessary for the calculation of the Variance.
Hence, for low sheath gas velocities (0.11 and 0.15 m/s), an increase in the Bodenstein number is observable, whereas, for the higher ones (0.23 and 0.27 m/s), the Bodenstein numbers decrease. According to the Bodenstein number, for the highest sheath gas velocity back-mixing is observable. Even though the observable effect is not caused by back-mixing, delayed particles arrange according to their sizes. By increasing sheath gas velocity, this effect is enhanced.
The influence of the higher sheath gas velocities on the particles is significant, leading to a broadened residence time distribution proven using the large Variance. The remaining sheath gas velocities present comparable Variances, as their residence time density distribution curves display the preferable Gaussian distribution. However, no back-mixing effects are observable as the axial dispersion coefficient presents values between 0.024 and 0.218.
To confirm that the variance of the residence time distributions is due to the polydisperse particle size and not to back-mixing effects, a further numerical investigation of the residence time was carried out using a monodisperse particle group. For this purpose, the Sauter diameter of the corresponding volumetric distribution was applied. Figure 9 compares the residence time density distributions under a constant sheath gas velocity of 0.27 m/s.
Figure 9 demonstrates the differences in the particle’s residence time density distribution under consideration of varying spectra for the applied particle sizes. Whereas the polydisperse distribution presents an early peak time of τ p e a k , p o l y d i s p e r s e = 0.9 s and a broad Variance with a maximum residence time around τ m a x , p o l y d i s p e r s e = 5.0 s, the monodisperse curve reveals a firmly contoured route with a greater peak time of τ p e a k , m o n o d i s p e r s e = 1.4 s, yet the maximum residence time is reduced to τ m a x , m o n o d i s p e r s e = 2.1 s. Furthermore, the residence time distribution curve of the monodisperse fraction is located in the center of the polydisperse one, confirming the brief residence time of large particles (see Figure 8) and the retarded residence time behavior of particles in the fine fraction x10,0.

4. Conclusions

In this study, experiments and numerical simulations using the Euler-Lagrange approach were successfully used to investigate the particle residence time distribution in a concurrent downer reactor under varying operating conditions. All experiments were carried out at a lab-scale plant. The numerical results showed a satisfactory agreement with the experimental data. The following conclusions were drawn from this work:
  • ▪ the numerical peak particle residence time varied in the range of 0.5–0.9 s, whereas the corresponding experimental data varied in the range of 0.42–1.08 s. The maximum particle residence times were between 2.4–5.0 s for the numerical simulations and 2.4–4.62 s for the experiments. The concurrent downer reactor presented a narrow residence time distribution, thus confirming the characteristic property of these reactors;
  • ▪ the particle residence time density distribution was strongly dependent on the fluid flow rate. With increasing the sheath gas flow rate, the peak particle residence time decreased, whereas the maximum residence time of the particles significantly increased;
  • ▪ it was possible to observe a drop-shaped particle flow pattern formation through the numerical simulations under different values of the sheath gas velocity. According to the numerical results, the distribution of the particles along the reactor length depends on their size. Thus, smaller particles tended to concentrate at the top of the reactor (i.e., at the beginning of the drop-shaped particle flow), resulting in higher residence times, whereas larger particles concentrated towards the end of the drop-shaped particle flow pattern (i.e., near the reactor outlet), which results in lower residence times.
Considering the thermal rounding process for particles in a downer reactor, one of the most important control parameters is the effective residence time of the former feedstock. As the heat transfer is interrelated with the particle residence time, a rather long residence time may lead to undesired agglomeration phenomena, whereas a too short contact time will interfere with the shaping process. Further investigations are now focused on the temperature distribution inside the reactor to optimize the process route of thermal rounding.

Author Contributions

L.U.: Conceptualization, methodology, formal analysis, investigation, writing—original draft, writing—review, and editing. J.S.G.B.: formal analysis, methodology. D.A.d.S.: conceptualization, formal analysis, writing—original draft, writing—review. A.B.: methodology, validation, resources, writing—original draft, writing—review, editing, and project administration. All authors have read and agreed to the published version of the manuscript.

Funding

Support by the Deutsche Forschungsgemeinschaft (DFG, German Research Foundation)—Project-ID 61375930—CRC 814 (Additive Manufacturing), Sub-Project A2 is gratefully acknowledged. We acknowledge financial support from Deutsche Forschungsgemeinschaft and Friedrich-Alexander-Universität Erlangen-Nürnberg within the funding program “Open Access Publication Funding”.

Institutional Review Board Statement

Not applicable.

Informed Consent Statement

Not applicable.

Data Availability Statement

The data presented in this study are available on request from the corresponding author. The data are not publicly available due to confidentiality.

Acknowledgments

The German research foundation (DFG) is acknowledged for funding this study within the framework of the Collaborative Research Center (CRC) 814 “Additive Manufacturing”—Project-ID 61375930—subproject A2.

Conflicts of Interest

The authors declare no conflict of interest. The funders had no role in the design of the study; in the collection, analyses, or interpretation of data; in the writing of the manuscript; or in the decision to publish the results.

Abbreviations

CDdrag coefficient/-
Cμempirical constant for the turbulent model/-
dpparticle diameter/m
ecoefficient of restitution/-
F gb gravitational-buoyance forces/N
F d drag force/N
F n i j normal contact force/N
F t i j tangential contact force/N
g gravity acceleration vector/m/s2
Gequivalent shear modulus/Pa
I turbulence intensity/-
kturbulent kinetic energy/m2/s2
knstiffness/N/m
Lhydraulic diameter/m
LRLength of the reactor/m
mpparticle mass/kg
nunit vector between the involved particles/-
Nptotal number of particles/-
pmean pressure/Pa
P k rate of production of the turbulent kinetic energy/kg/ms3
R e p relative Reynolds number of the particle/-
Si,pinter-phase momentum exchange/m/s2
ttime/s
UGgas velocity/m/s
u r e f reference velocity/m/s
Vkvolume of the kth particle/m3
v f   mean fluid velocity vector/m/s
v p particle velocity vector/m/s
x p particle position vector/m
x10,3tenth percentile of the volumetric distribution sum/µm
X50,3median of the volumetric distribution sum/µm
X90,3ninetieth percentile of the volumetric distribution sum/µm
x3,2Sauter diameter of the particle/µm
Greek Symbols
β*empirical constant for the SST k-ω turbulent model/-
β2empirical constant for the SST k-ω turbulent model/-
γ2empirical constant for the SST k-ω turbulent model/-
δijKronecker delta/-
δnOverlap distance between the involved particles/m
εturbulent kinetic energy dissipation rate/m2/s3
ηdamping coefficient/Ns/m
µfluid dynamic viscosity/Pas
μ T turbulent viscosity/Pas
ρffluid density/kg/m3
ρpparticle density/kg/m3
σkempirical constant for the SST k-ω turbulent model/-
σω,1empirical constant for the SST k-ω turbulent model/-
σω,2empirical constant for the SST k-ω turbulent model/-
τ T , ij turbulent Reynolds stresses/Pa
τ mean particle residence time/s
ωturbulence frequency/1/s

References

  1. Schmidt, J.; Sachs, M.; Fanselow, S.; Zhao, M.; Romeis, S.; Drummer, D.; Wirth, K.-E.; Peukert, W. Optimized polybutylene terephthalate powders for selective laser beam melting. Chem. Eng. Sci. 2016, 156, 1–10. [Google Scholar] [CrossRef]
  2. Wilczek, M.; Bertling, J.; Hintemann, D. Optimised technologies for cryogenic grinding. Int. J. Miner. Processing 2004, 74, 425–434. [Google Scholar] [CrossRef]
  3. Dechet, M.A.; Kloos, S.; Peukert, W.; Schmidt, J. Formation of spherical micron-sized polyamide particles for additive manufacturing via liquid-liquid phase separation. In Proceedings of the 33rd International Conference of the Polymer Processing Society, Cancun, Mexico, 10–14 December 2017. [Google Scholar]
  4. Gai, G.; Yang, Y.; Jin, L.; Zou, X.; Wu, Y. Particle shape modification and related property improvements. Powder Technol. 2008, 183, 115–121. [Google Scholar] [CrossRef]
  5. Gomez Bonilla, J.S.; Dechet, M.A.; Schmidt, J.; Peukert, W.; Bück, A. Thermal rounding of micron-sized polymer particles in a downer reactor: Direct vs. indirect heating. RPJ 2020, 26, 1637–1646. [Google Scholar] [CrossRef]
  6. Hague, R.; Campbell, I.; Dickens, P. Implications on design of rapid manufacturing. Proc. Inst. Mech. Eng. Part C J. Mech. Eng. Sci. 2003, 217, 25–30. [Google Scholar] [CrossRef]
  7. Ligon, S.C.; Liska, R.; Stampfl, J.; Gurr, M.; Mülhaupt, R. Polymers for 3D Printing and Customized Additive Manufacturing. Chem. Rev. 2017, 117, 10212–10290. [Google Scholar] [CrossRef] [Green Version]
  8. Bourell, D.L.; Marcus, H.L.; Barlow, J.W.; Beaman, J.J. Selective laser sintering of metals and ceramics. Int. J. Powder Met. 1992, 28, 369–381. [Google Scholar] [CrossRef]
  9. van der Schueren, B.; Kruth, J.P. Powder deposition in selective metal powder sintering. Rapid Prototyp. J. 1995, 1, 23–31. [Google Scholar] [CrossRef]
  10. Goodridge, R.D.; Tuck, C.J.; Hague, R.J.M. Laser sintering of polyamides and other polymers. Prog. Mater. Sci. 2012, 57, 229–267. [Google Scholar] [CrossRef]
  11. Chatham, C.A.; Long, T.E.; Williams, C.B. A review of the process physics and material screening methods for polymer powder bed fusion additive manufacturing. Prog. Polym. Sci. 2019, 93, 68–95. [Google Scholar] [CrossRef]
  12. Podczeck, F.; Mia, Y. The influence of particle size and shape on the angle of internal friction and the flow factor of unlubricated and lubricated powders. Int. J. Pharm. 1996, 144, 187–194. [Google Scholar] [CrossRef]
  13. Fu, X.; Huck, D.; Makein, L.; Armstrong, B.; Willen, U.; Freeman, T. Effect of particle shape and size on flow properties of lactose powders. Particuology 2012, 10, 203–208. [Google Scholar] [CrossRef]
  14. Ziegelmeier, S.; Christou, P.; Wöllecke, F.; Tuck, C.; Goodridge, R.; Hague, R.; Krampe, E.; Wintermantel, E. An experimental study into the effects of bulk and flow behaviour of laser sintering polymer powders on resulting part properties. J. Mater. Processing Technol. 2015, 215, 239–250. [Google Scholar] [CrossRef]
  15. Schmidt, J.; Sachs, M.; Blümel, C.; Winzer, B.; Toni, F.; Wirth, K.-E.; Peukert, W. A novel process route for the production of spherical LBM polymer powders with small size and good flowability. Powder Technol. 2014, 261, 78–86. [Google Scholar] [CrossRef]
  16. Mys, N.; van de Sande, R.; Verberckmoes, A.; Cardon, L. Processing of Polysulfone to Free Flowing Powder by Mechanical Milling and Spray Drying Techniques for Use in Selective Laser Sintering. Polymers 2016, 8, 150. [Google Scholar] [CrossRef] [Green Version]
  17. Mys, N.; Verberckmoes, A.; Cardon, L. Processing of Syndiotactic Polystyrene to Microspheres for Part Manufacturing through Selective Laser Sintering. Polymers 2016, 8, 383. [Google Scholar] [CrossRef] [Green Version]
  18. Dechet, M.A.; Gómez Bonilla, J.S.; Lanzl, L.; Drummer, D.; Bück, A.; Schmidt, J.; Peukert, W. Spherical Polybutylene Terephthalate (PBT)-Polycarbonate (PC) Blend Particles by Mechanical Alloying and Thermal Rounding. Polymers 2018, 10, 1373. [Google Scholar] [CrossRef] [Green Version]
  19. Bissett, H.; van der Walt, I.J.; Havenga, J.L.; Nel, J.T. Titanium and zirconium metal powder spheroidization by thermal plasma processes. J. S. Afr. Inst. Min. Metall. 2015, 115, 937–942. [Google Scholar] [CrossRef]
  20. Kotlyarov, V.I.; Beshkarev, V.T.; Kartsev, V.E.; Ivanov, V.V.; Gasanov, A.A.; Yuzhakova, E.A.; Samokhin, A.V.; Fadeev, A.A.; Alekseev, N.V.; Sinayskiy, M.A.; et al. Production of spherical powders on the basis of group IV metals for additive manufacturing. Inorg. Mater. Appl. Res. 2017, 8, 452–458. [Google Scholar] [CrossRef]
  21. Tang, J.; Nie, Y.; Lei, Q.; Li, Y. Characteristics and atomization behavior of Ti-6Al-4V powder produced by plasma rotating electrode process. Adv. Powder Technol. 2019, 30, 2330–2337. [Google Scholar] [CrossRef]
  22. Jin, H.; Xu, L.; Hou, S. Preparation of spherical silica powder by oxygen–acetylene flame spheroidization process. J. Mater. Process. Technol. 2010, 210, 81–84. [Google Scholar] [CrossRef]
  23. Murray, J.W.; Simonelli, M.; Speidel, A.; Grant, D.M.; Clare, A.T. Spheroidisation of metal powder by pulsed electron beam irradiation. Powder Technol. 2019, 350, 100–106. [Google Scholar] [CrossRef]
  24. Pawar, S.B. CFD analysis of flow regimes in airlift reactor using Eulerian-Lagrangian approach. Can. J. Chem. Eng. 2017, 95, 420–431. [Google Scholar] [CrossRef]
  25. Li, Y.; Cao, X.; Geng, Z.; Zhang, M. A novel quasi plug-flow reactor design for enzymatic hydrolysis of cellulose using rheology experiment and CFD simulation. Can. J. Chem. Eng. 2018, 96, 770–778. [Google Scholar] [CrossRef]
  26. Yu, X.; Makkawi, Y.; Ocone, R.; Huard, M.; Briens, C.; Berruti, F. A CFD study of biomass pyrolysis in a downer reactor equipped with a novel gas–solid separator—I: Hydrodynamic performance. Fuel Process. Technol. 2014, 126, 366–382. [Google Scholar] [CrossRef] [Green Version]
  27. Marandi, R.; Kamyabi, M.; Mostoufi, N. Hydrodynamic design of multi-zone circulating reactors using CFD. Can. J. Chem. Eng. 2018, 96, 670–678. [Google Scholar] [CrossRef]
  28. Gómez Bonilla, J.S.; Unger, L.; Schmidt, J.; Peukert, W.; Bück, A. Particle Lagrangian CFD Simulation and Experimental Characterization of the Rounding of Polymer Particles in a Downer Reactor with Direct Heating. Processes 2021, 9, 916. [Google Scholar] [CrossRef]
  29. Zhang, Y.; Yi, W.; Fu, P.; Li, Z.; Wang, N.; Tian, C. Numerical simulation and experiment on catalytic upgrading of biomass pyrolysis vapors in V-shaped downer reactors. Bioresour. Technol. 2019, 274, 207–214. [Google Scholar] [CrossRef]
  30. Zhao, T.; Liu, K.; Cui, Y.; Takei, M. Three-dimensional simulation of the particle distribution in a downer using CFD–DEM and comparison with the results of ECT experiments. Adv. Powder Technol. 2010, 21, 630–640. [Google Scholar] [CrossRef]
  31. Wang, C.; Li, C.; Zhu, J. Axial solids flow structure in a high density gas–solids circulating fluidized bed downer. Powder Technol. 2015, 272, 153–164. [Google Scholar] [CrossRef]
  32. Deng, R. Axial flow structure at the varying superficial gas velocity in a downer reactor. Chem. Eng. J. 2004, 99, 5–14. [Google Scholar] [CrossRef]
  33. Qi, C.-M.; Yu, Z.-Q.; Jin, Y.; Bai, D.-R.; Yao, W.-H. Study on the gas-solids cocurrently downflow fluidization (I). J. Chem. Ind. Eng. China (Chin. Ed.) 1990, 41, 273–280. [Google Scholar]
  34. Brust, H.; Wirth, K.-E. Residence Time Behavior of Gas in a Downer Reactor. Ind. Eng. Chem. Res. 2004, 43, 5796–5801. [Google Scholar] [CrossRef]
  35. Bachmann, P.; Bück, A.; Tsotsas, E. Investigation of the residence time behavior of particulate products and correlation for the Bodenstein number in horizontal fluidized beds. Powder Technol. 2016, 301, 1067–1076. [Google Scholar] [CrossRef]
  36. Brauer, H. Grundlagen der Einphasen- und Mehrphasenströmungen; Sauerländer: Aarau, Switzerland, 1971; pp. 364–368. [Google Scholar]
  37. Michelsen, M.L.; Østergaard, K. The use of residence time distribution data for estimation of parameters in the axial dispersion model. Chem. Eng. Sci. 1970, 25, 583–592. [Google Scholar] [CrossRef]
  38. Menter, F.R. Two-equation eddy-viscosity turbulence models for engineering applications. AIAA J. 1994, 32, 1598–1605. [Google Scholar] [CrossRef] [Green Version]
  39. Menter, F.R.; Kuntz, M.; Langtry, R. Ten years of industrial experience with the SST Turbulence model. In Turubulence, Heat and Mass Transfer; Begell House, Inc.: Danbury, CT, USA, 2003. [Google Scholar]
  40. Khare, P.; Wang, S.; Yang, V. Modeling of finite-size droplets and particles in multiphase flows. Chin. J. Aeronaut. 2015, 28, 974–982. [Google Scholar] [CrossRef] [Green Version]
  41. Tsuji, Y.; Tanaka, T.; Ishida, T. Lagrangian numerical simulation of plug flow of cohesionless particles in a horizontal pipe. Powder Technol. 1992, 71, 239–250. [Google Scholar] [CrossRef]
  42. Putnam, A. Integrable form of droplet drag coefficient. Ars J. 1961, 31, 1467–1468. [Google Scholar]
  43. Gosman, A.D.; Ioannides, E. Aspects of Computer Simulation of Liquid-Fueled Combustors. J. Energy 1983, 7, 482–490. [Google Scholar] [CrossRef]
  44. Mofakham, A.A.; Ahmadi, G. On random walk models for simulation of particle-laden turbulent flows. Int. J. Multiph. Flow 2020, 122, 103157. [Google Scholar] [CrossRef]
  45. OpenFOAM: User Guide (v2112). Available online: https://www.openfoam.com/documentation/guides/latest/doc/guide-meshing-snappyhexmesh-meshquality.html (accessed on 8 April 2022).
  46. Barton, I.E. Comparison of SIMPLE- and PISO-type algorithms for transient flows. Int. J. Numer. Meth. Fluids 1998, 26, 459–483. [Google Scholar] [CrossRef]
  47. Versteeg, H.K.; Malalasekera, W. An Introduction to Computational Fluid Dynamics: The Finite Volume Method, 2nd ed.; Pearson Education Ltd.: Harlow, UK, 2007; p. 76. [Google Scholar]
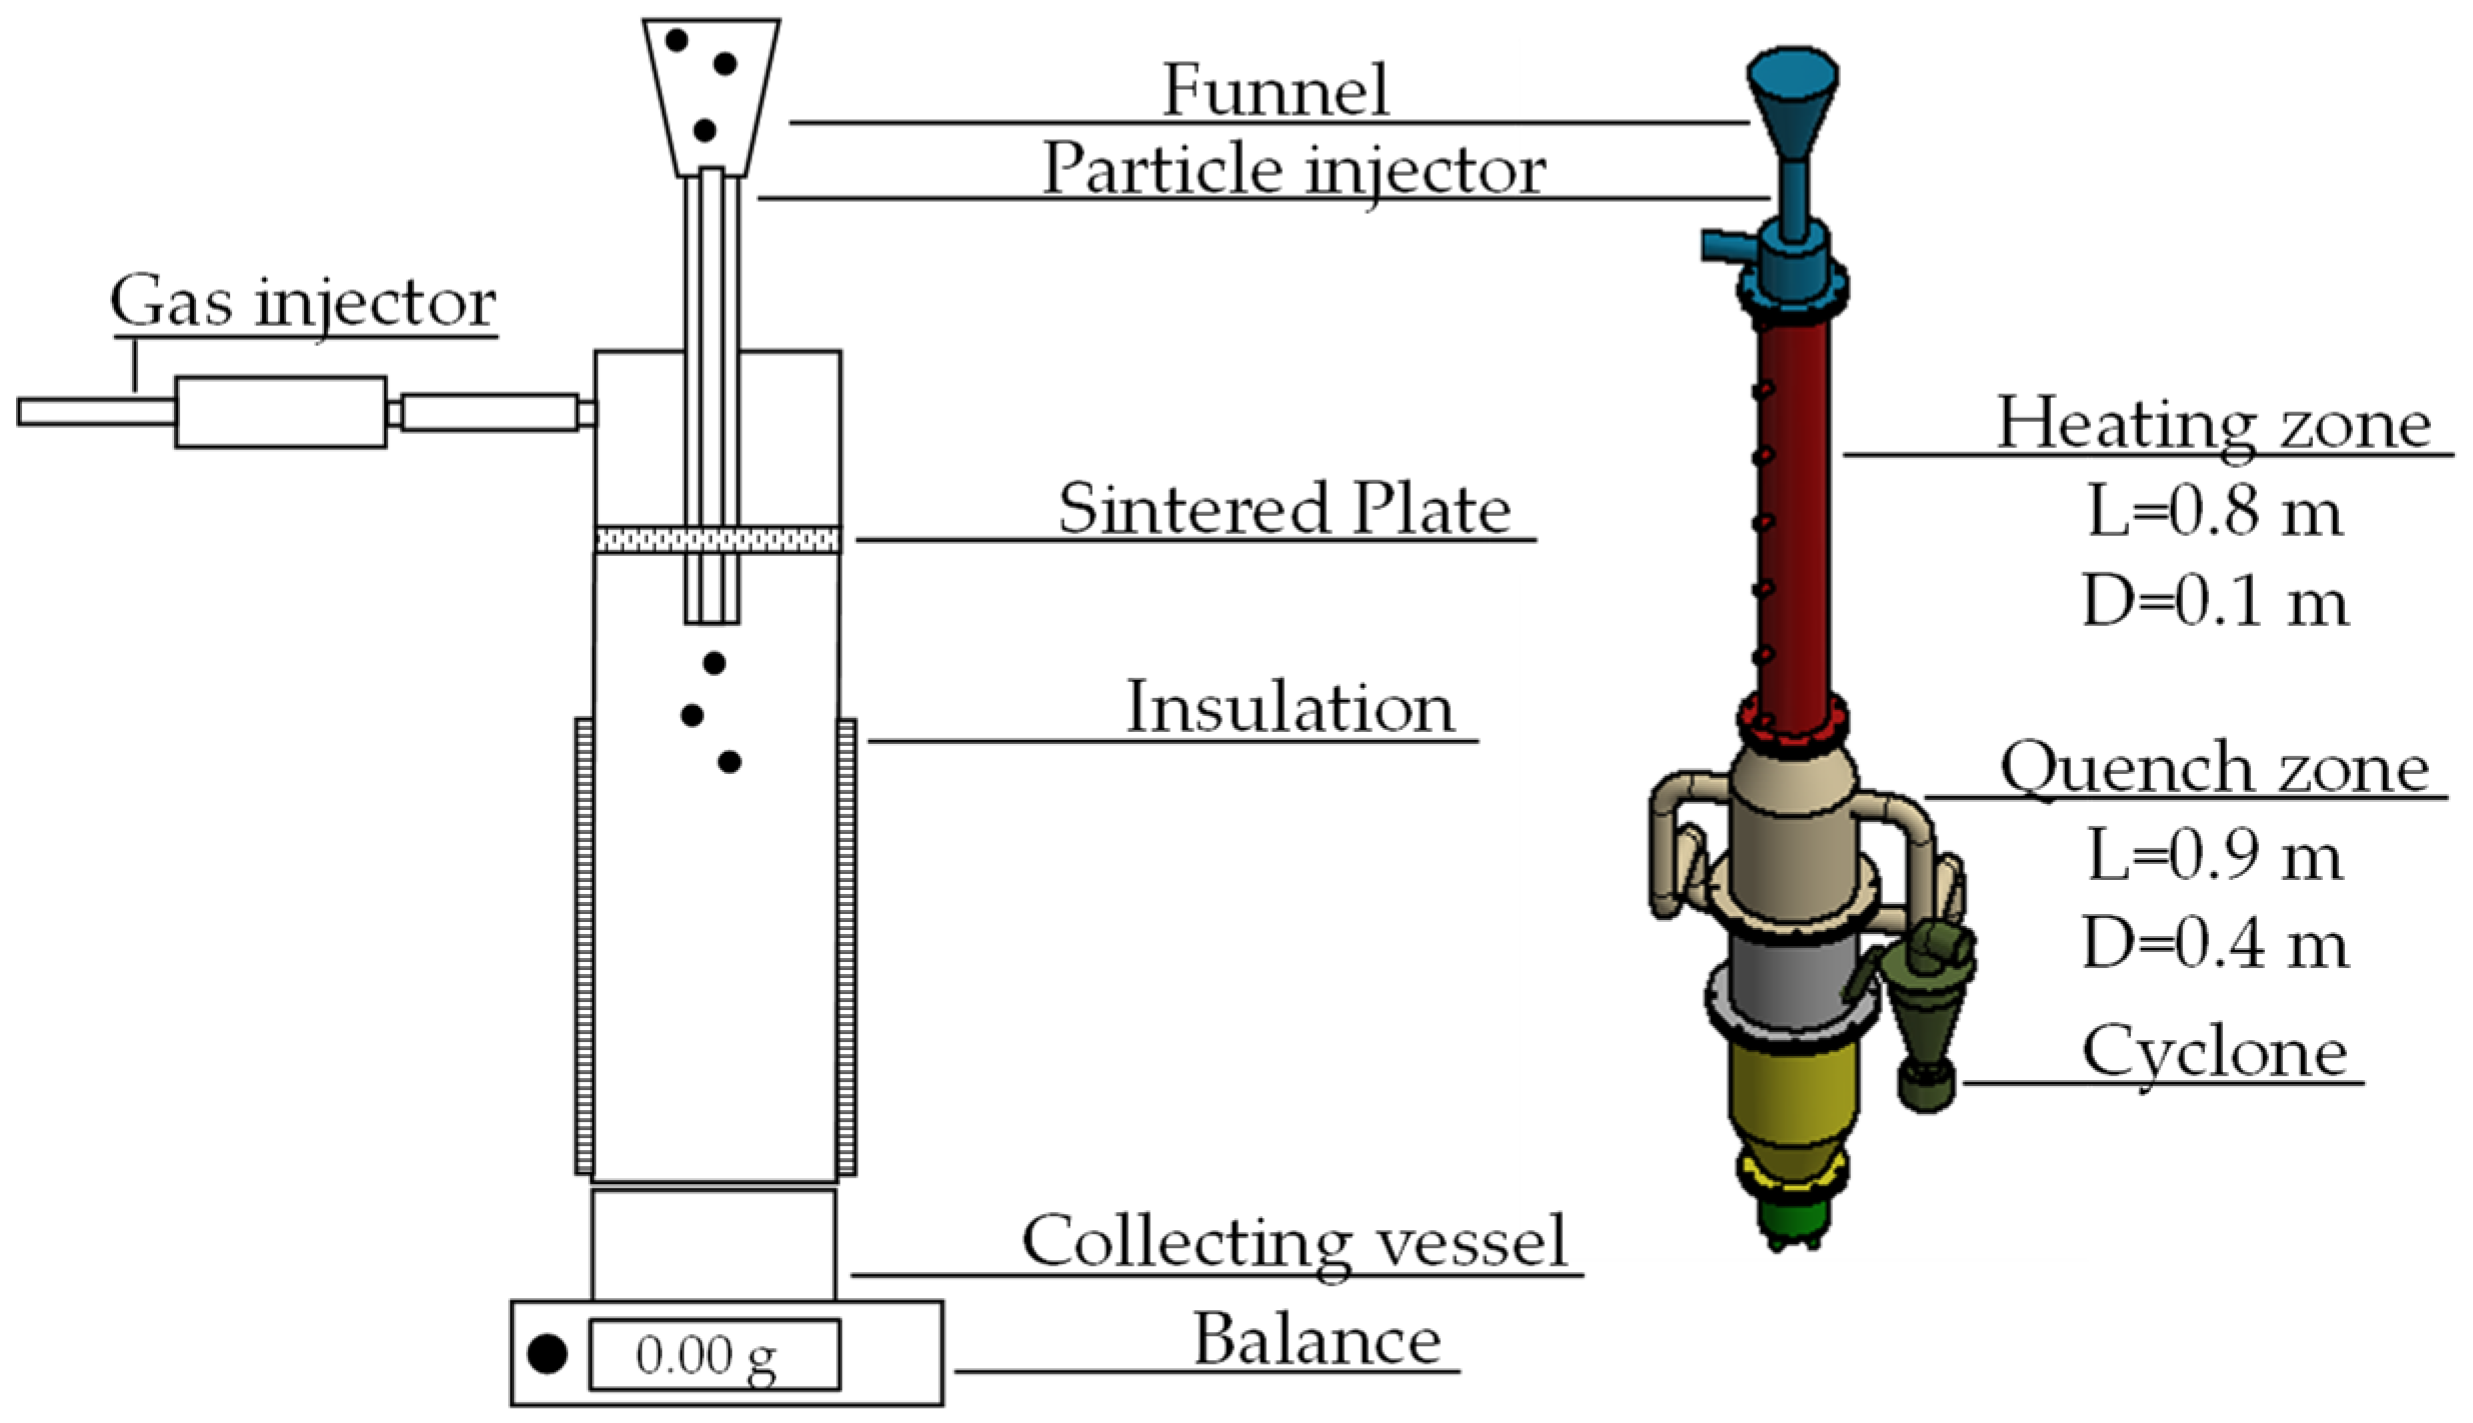
Figure 1. Schematic representation of the experimental apparatus of the downer reactor and an isometric view of the apparatus.
Processes 10 00996 g001
Figure 2. Particle residence time according to the stationary sinking velocity (Equations (1)–(4)) as a function of the particle diameter (reactor length, LR = 0.8 m).
Processes 10 00996 g002
Figure 3. 3D hexahedral computational mesh: (a) downer reactor; (b) upper view of the downer reactor annular and central inlets for N2 and air-particles, respectively; (c) bottom view of the downer reactor outlet; (d) cut-out section of the downer reactor mesh showing details of the annular and central inlets.
Processes 10 00996 g003
Figure 4. Particle size density distribution of PP feed material.
Processes 10 00996 g004
Figure 5. Experimental and numerical particle residence time density distributions under different sheath gas velocities: (a) UG = 0.11 m/s; (b) UG = 0.15 m/s; (c) UG = 0.18 m/s; (d) UG = 0.23 m/s; (e) UG = 0.27 m/s.
Processes 10 00996 g005
Figure 6. Numerical fluid velocity distributions by using streamline functions under different operating conditions: (a) UG = 0.11 m/s; (b) UG = 0.15 m/s; (c) UG = 0.18 m/s; (d) UG = 0.23 m/s; (e) UG = 0.27 m/s.
Processes 10 00996 g006
Figure 7. Numerical particle velocity vector distributions under different operating conditions: (a) UG = 0.11 m/s; (b) UG = 0.15 m/s; (c) UG = 0.18 m/s; (d) UG = 0.23 m/s; (e) UG = 0.27 m/s.
Processes 10 00996 g007
Figure 8. Numerical particle diameter distributions along the downer reactor under different operating conditions: (a) UG = 0.11 m/s; (b) UG = 0.15 m/s; (c) UG = 0.18 m/s; (d) UG = 0.23 m/s; (e) UG = 0.27 m/s.
Processes 10 00996 g008
Figure 9. Numerical particle residence time density distributions under UG = 0.27 m/s for different particle sizes (Polydisperse: Volumetric particle size distribution according to Figure 4; Monodisperse: Sauter diameter of the particle size distribution displayed in Figure 4).
Processes 10 00996 g009
Table 1. Configuration parameters to investigate the particle residence time distribution.
PropertyValue
Diameter of the particle injector/m26 × 10−3
Length of the particle injector, i.e., below the sintered plate/m0.05
Length of the downer reactor from the sintered plate/m0.8
Diameter of the downer reactor/m0.1
Sauter diameter of PP/m76.1 × 10−6
Density of PP/kg/m3907
Table 2. Different operating conditions for the particle residence time investigation.
PropertyValue
Sheath gas volume flow rate—Gas injector/Nm3/h3.0, 4.0, 5.0, 6.0 and 7.0
Sheath gas velocity—Gas injector/m/s0.11, 0.15, 0.18, 0.23 and 0.27
Reynolds number—fluid phase/-616, 1009, 840, 1289, 1513
Reynolds number—solid phase/-1.6, 1.9, 2.2, 2.5, 2.8
Cross sectional solid flux/kg/m2s0.32
Table 3. Numerical methods and boundary conditions for the Euler-Lagrange simulations.
PropertyValue
Discretization method (gas phase):The finite volume method.
Pressure-velocity coupling (gas phase):PIMPLE algorithm, i.e., blend of the SIMPLE and PISO algorithms [46]
Integration scheme (solid phase):Euler scheme.
Wall boundary conditions:gas phase: no-slip condition for the velocity; wall functions for the k and ω turbulent equations.
solid phase: particle stick condition.
Inlet boundary conditions:gas phase: velocity, k, and ω values are specified; null gradient for pressure.
solid phase: injection of particles in the central inlet; particle rebound condition with e = 0.9 for the annular and central inlets (no particle backflow).
Outlet boundary conditions:gas phase: pressure value is specified (atmospheric pressure); null gradients for velocity, k, and ω.
solid phase: particle escape condition.
Convergence criteria:10−6 for all variables
Table 4. Experimental and numerical peak and maximum particle residence times under different operating conditions.
PropertyValue
Sheath gas velocity/m/s0.11 0.150.180.230.27
Maximum   τ E x p /s2.682.44.042.464.62
Maximum   τ S i m /s2.52.52.43.05.0
τ C a l c according to Equation (4)/s3.8
τ P e a k ,       E x p /s0.961.081.040.640.42
τ P e a k ,       S i m /s0.90.90.90.70.5
Table 5. Experimental and numerical Bodenstein numbers ( B o ), variances ( σ 2 ), and axial dispersion coefficient ( D a x ) under different operating conditions.
PropertyValue
Sheath gas velocity/m/s0.110.150.180.230.27
Exp .   B o /-3.4947.0482.6694.4690.775
Sim .   B o /-4.8505.5496.6823.0870.844
Exp .   σ 2 /-0.5720.2840.7490.4472.580
Sim .   σ 2 /-0.4120.3600.2990.6482.369
Exp .   D a x /-0.0480.0240.0630.0370.218
Sim .   D a x /-0.0350.0300.0250.0540.199
Publisher’s Note: MDPI stays neutral with regard to jurisdictional claims in published maps and institutional affiliations.