Abstract
In the present study, imperative parameters including centrifugal force, erosion, streamline, strain rate, and wall shear are evaluated in a cyclone separator. The flaw of the cyclone surface due to erosion is an acute problem in the industry. According to the great importance of the centrifugal force on the separation phenomenon, a comprehensive study is conducted. A computational fluid dynamics (CFD) simulation is realized by applying a Reynolds stress turbulence model (RSM), and particle–air interactions were modeled using a discrete phase model (DPM). The result shows a good agreement between the experimental data and CFD simulation on the tangential velocity and pressure drop. The maximum deviation of the validation process is 6.8%. It is found that the centrifugal force within the cyclone is increased with an enhancement in the inlet velocity. The separation efficiency indicates an increase–decrease treatment in various inlet velocities with inlet velocity up to 16 m⋅s−1 but decreases slightly at a velocity of 20 m⋅s−1. The pressure increases proportionally with inlet velocity. The best performance with the highest separation efficiency (99%) and pressure drop (416 Pa) obtains at the inlet velocity of 16 m⋅s−1 and mass flow rate of 0.01 kg⋅s−1. In addition, the maximum erosion rate was created in the entrance and conical part of the cyclone.
1. Introduction
A cyclone is mostly used in a broad range of processes, from food processing to air pollution control. Simplicity, and low operational and maintenance costs are the advantages of the cyclone separators. A cyclone separator separates the solids from the gas-solid mixture utilizing centrifugal force. Cyclones are used in many processing sections, including cement plants and sawmills for dust removal [1,2].
A cyclone separator usually separates particles bigger than 10 μm. Nevertheless, ordinary cyclones often have lower than 90% separation efficiency unless the particle size is greater than 25 μm [3]. Despite the simple design of the cyclone, the gas stream behavior within the cyclone is very complicated [4]. The centrifugal force created by the swirling flow within the cyclone and drag force governed the particle motion [5].
The works about cyclone separators were classified into three main subjects. These three subjects were studying the cyclone entrance parameters on cyclone performance, effects of cyclone dimensions on velocity fields, pressure drop, separation efficiency, surface roughness effects, and optimization methods to gain the most ideal performance. The flaw of the cyclone surface due to surface erosion is a critical problem in the industry.
In a CFD study, the effect of the inlet velocity and temperature on the cyclone performance was carried out. Four empirical models to predict the pressure drop were reviewed. Moreover, several empirical models were assessed to predict the separation efficiency and pressure drop [6]. A numerical flow calculation of particle-laden cyclone with a large eddy simulation (LES) turbulent model was conducted. Then, the cyclone performance was evaluated. The maximum difference between numerical results and available experimental data was 2%. The capability of the LES turbulent model to simulate the flow inside the cyclone was demonstrated [7].
In the following, some mathematical models were utilized to study the cyclone roughness effect on the cyclone performance. The results indicated that by increasing the surface roughness, separation efficiency and pressure drop were reduced [8,9]. Multi-objective optimization is another fascinating field in association with cyclones. Sun et al. carried out a multi-objective optimization using response surface methodology (RSM)-CFD coupling to modify the cyclone performance by maximizing the separation efficiency and minimizing the pressure drop [10]. Sun and Yoon carried out a multi-objective optimization utilizing a genetic algorithm (GA)-CFD coupling method [11]. A comparative optimization study includes group mesh of data handling, back-propagation neural network, and response surface methodology, and multi-objective were carried out. The object of this study was the development of an optimal predictive model. The authors used pressure drop and separation efficiency to evaluate the cyclone performance [12].
In another work, the performance of the cyclone separator was analyzed with an eccentric vortex finder. In addition, the cyclone performance was optimized [13]. The study of cyclone separators with multi-inlets entrances [14,15,16], novel vortex finders [17,18], also the usage of novel techniques such as non-invasive environment-friendly acoustic emission techniques [19] were carried out in cyclone study. An erosion base numerical study was performed to enhance the lifetime of the heat exchanger. In this study, erosion and solid particle movement of a copper-pipe heat exchanger was simulated. Finally, critical area and damage locations were identified by the simulations [20]. In a recent numerical study, the effects of inlet velocity and mass flow rate on some effective parameters cyclone separators were assessed from the point of durability [21]. Additionally, various aspects of CFD applications in agricultural-related works were conducted in several works [22,23,24,25,26].
Therefore, the lack of comprehensive research about the important factors including centrifugal forces, erosion rate, Euler and Stokes numbers, wall shear, and strain rate is a stimulant of this study. Thus, the main novelties and purposes of this study may be summarized in the following:
- Validation of numerical simulation by comparison of numerical results and experimental data using pressure drop and tangential velocity.
- A thorough compromise between pressure drop and separation efficiency to select the best situation.
- Assessment of centrifugal force in various inlet velocities, and mass flow rates as a mandatory parameter in cyclone analysis.
- A full evaluation of Euler and Stokes number along with streamline contour to identify the flow movement within the cyclone separator.
- Assessment of erosion, strain rate, and wall shear to elucidate their relation with inlet velocity and mass flow rate.
2. Methodology
2.1. Cyclone Geometry
Regarding the importance of the cyclone dimension in the results, the dimensions of the cyclone used in numerical analysis are illustrated in Figure 1. This cyclone is a high separation efficiency Stairmand cyclone with a tangential entrance section. Additionally, the cyclone dimensions are presented in Table 1.
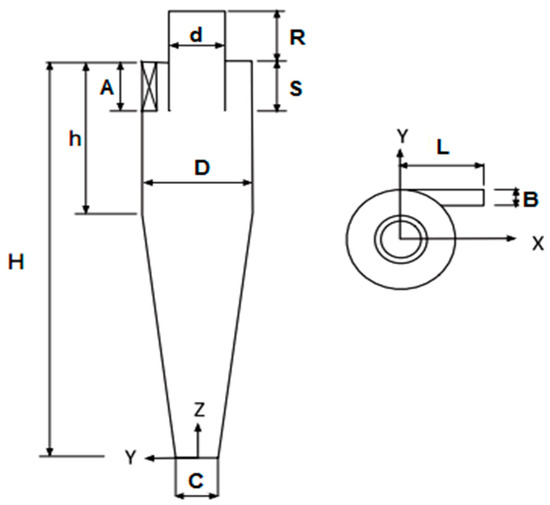
Figure 1.
Dimensions of the cyclone.

Table 1.
Cyclone separator dimensions.
2.2. Euler and Stokes Numbers
In order to avoid the inlet velocity as a characteristics velocity and exchange it by average velocity within the cyclone, the Euler number (Eu) was computed based on vc and the pressure drop ():
Eu is a dimensionless performance parameter. It is worth mentioning that the Euler number is the dimensionless pressure drop. As the Euler number is increased, the power needed by the cyclone separator is enhanced because it should overcome the larger pressure drop.
In a cyclone separator, the particle size at the separation efficiency of 50% is named the cut-size (d50). Cut size usually is reported by Stokes number (St). It revealed the characteristic response time of the fluid divided by the characteristic response time of the particle. The Stokes number depending on d50 is introduced as follows:
where dp is the particle diameter (m), is the gas viscosity (Pa⋅s), (m⋅s−1) is the particle density (kg·m−3), D is the main body diameter (m), and vc is the characteristic velocity (m⋅s−1), which is defined in Equation (3).
where Q is gas flow rate (m3⋅s−1) and D is cyclone body diameter (m). The low Stokes number (less than 1) reveals that the particles are influenced by the fluid. As this amount increases, the dependence of the particles on the fluid decreases.
2.3. Centrifugal Force
Assume a particle that orbits of radius r inside the cyclone, the particle tangential velocity is Ut (m⋅s−1), the radial velocity of the gas is Ur (m·s−1), ρp is particle density (kg⋅m−3), and x is the diameter of the particles (m). The centrifugal force (Fc) acting on the particle moving with a tangential velocity component Ut at radius r is:
In addition, assume that Stokes law applies under these conditions. Then the drag force is given by:
where is the gas viscosity.
Centrifugal force acting on a particle in a cyclone wall is illustrated in Figure 2.
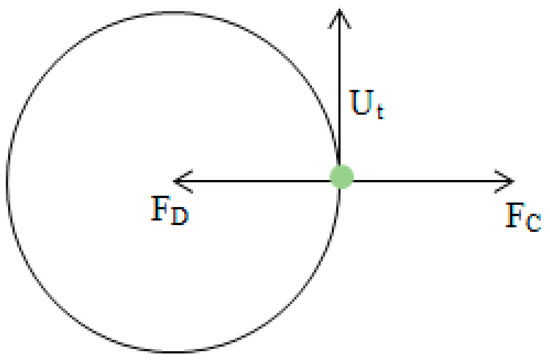
Figure 2.
Centrifugal force acting on a particle in the cyclone wall [27].
The particle movement is basically controlled by the centrifugal force and this factor is one of the momentous parameters in cyclone separators. This is a strong reason for the classification of cyclone separators as centrifugal separators.
According to the importance of the numerical procedure in the numerical calculation and analysis, the equation was prepared in the following.
2.4. Numerical Procedure
In this study, the Reynolds stress model (RSM) was used to model the turbulence of the flow. The RSM is given as follows:
where the left two terms are the local time derivatives of stress and convective transport term, respectively. The stress diffusion is modeled as follows:
The shear production is given by:
The term of pressure strain is presented as follows:
The dissipation term is considered to be isotropic and modeled as follows:
S is the source term.
2.5. Boundary Conditions
An appropriate definition of boundary conditions can guarantee accurate simulation [22]. Three various types of boundary conditions are used in the simulations. These three types include inlet, outlet, and wall boundary conditions. The inlet type is the velocity inlet at the entrance of cyclone. In both outlets at the top and bottom of the cyclone, the pressure outlet was considered as the boundary condition. Additionally, a no-slip wall boundary condition was applied to the walls of the cyclone. Table 2 shows the boundary conditions used in simulations.
Table 2.
Boundary conditions.
The numerical schemes for simulations are presented in Table 3.
Table 3.
Numerical scheme for simulations.
2.6. Discrete Phase Model (DPM)
The discrete phase model is based on modeling the particle–fluid interactions by the Lagrangian approach. The fluid and dispersed phases could exchange momentum, mass, and energy. The allowed volume fraction for dispersed phase in DPM is less than 12% [28]. The equations of particles motion in the Lagrangian approach are presented in the Equations (11)–(13):
where µ is absolute viscosity (Pas) and ρ is gas density (kg⋅m−3), is the drag force, dp is particle diameter (m) and ρp is particle density (kg⋅m−3), Cd is the drag coefficient, upi is particle velocity (m·s−1), ui is gas velocity (m⋅s−1), Rep is the relative Reynolds number and gi is gravitational acceleration in i direction [23]. The solid-phase properties are presented in the Table 4.
Table 4.
Solid-phase properties.
By considering the maximum mass flow rate utilized in the study and calculation of the volume fraction of solids, the volume fraction of the second phase was obtained below 10%. The calculation process is presented as follows:
where is the volume fraction, Vs is the solid (seed) fraction and Vt is the total volume. To obtain the Vf, the volumes of the cyclone (Vt) and solid phase were obtained and then the volume fraction of the stream was calculated. According to the values obtained, the flow within the cyclone was in the dilute phase. Additionally, the discrete phase model (DPM) was used as multiphase phase model in many of the studies mentioned in the manuscript.
2.7. Erosion
The erosion model by Oka et al., (2005) is defined as follows:
where is the material density (kg⋅m−3), is the Vickers number (GPa), is the impact speed of the reference particle (m⋅s−1), is the particle diameter (m), and is the reference diameter (m). The iron Vickers hardness is 150 MPa, and density is 7875 kg⋅m−3. The values of k, k1, k2, k3, n1, n2, V′ and d′ are constant according to Oka’s experiment [29]. The surface of cyclones is strongly affected by collisions of particles with walls creating erosion in eligible sections. Accurate recognition of erosion-eligible sections is beneficial data in the improvement process of cyclone geometry.
2.8. Meshing Process
The 3D computational used in the simulations is presented in Figure 3. The grid refinements were employed in the cyclone vortex core and adjacent to the walls to resolve correctly the reverse vortex flow. Four different mesh numbers, (i.e., 425,700, 612,600, 812,410, and 1,146,100) were utilized in the grid independence test. According to the results, the discrepancy among pressure drops was less than 2.5%, when the grid above 612,600 meshes was used. Therefore, regarding the time considerations, the mesh containing 612,600 cells was applied.
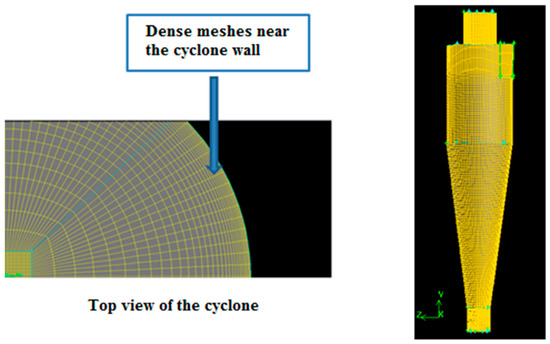
Figure 3.
Meshing of cyclone in gambit.
3. Results and Discussion
3.1. Validation Procedure
The experimental and numerical pressure drops at the barrel section of the cyclone separator are shown in Figure 4 and Figure 5. There is good agreement between numerical and experimental data.
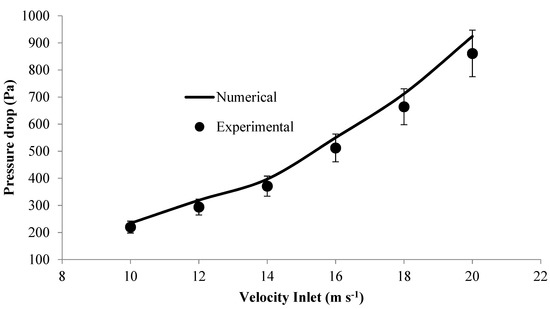
Figure 4.
Validation procedure for pressure drop with error bars of 10%.
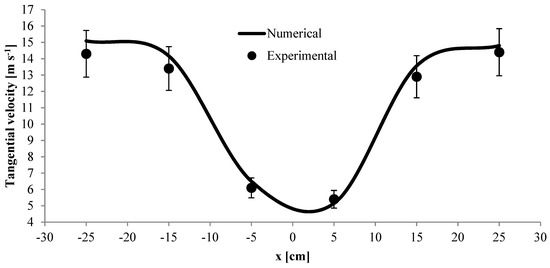
Figure 5.
Validation procedure for tangential velocity with error bars of 10%.
3.2. Cyclone Performance
Given the importance of the cyclone performance, the reciprocal plots of maximum static pressure versus the separation efficiency for various inlet velocities and mass flow rates are presented in Figure 6 and Figure 7.
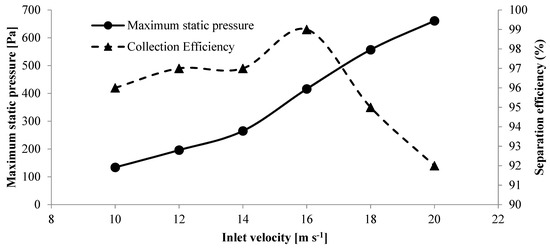
Figure 6.
Maximum static pressure and separation efficiency in various inlet velocities.
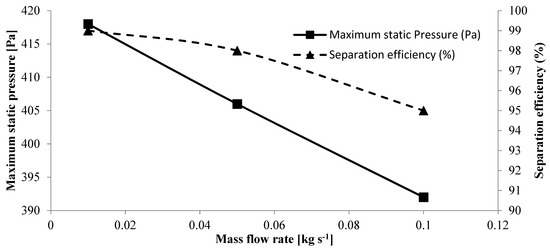
Figure 7.
Maximum static pressure and separation efficiency variations in various mass flow rates.
Zhou et al. [30] reported that the separation efficiency shows an increasing–decreasing behavior with enhancing the inlet velocity. Additionally, Karagoz and Avci [31] and Ji et al. [32] concluded that the maximum static pressure increased with increasing the inlet velocity in hydrocyclones and cyclone separators.
3.3. Centrifugal Force
Centrifugal force is an important parameter that affected the separation process of a cyclone separator. As shown in Figure 8, the centrifugal force in various inlet velocities increased linearly with increasing the inlet velocity. According to simulations and calculations, the centrifugal force was 0.033 N at an inlet velocity of 10 m⋅s−1; meanwhile, it increased to 0.147 N as velocity increased to 20 m⋅s−1. Increasing the value of tangential velocity is the reason for enhancing the centrifugal force value. Tangential velocity is dependent on the inlet velocity.
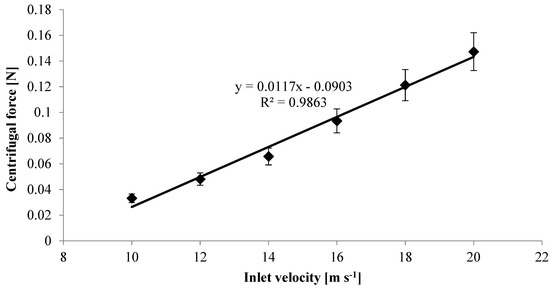
Figure 8.
Centrifugal force acting on a particle in various inlet velocities with error bars of 10%.
In addition, in various mass flow rates, the centrifugal force decreased with increasing the mass flow rate in values of 0.01, 0.05, and 0.1 kg⋅s−1. It is noteworthy that the main reason for the decrease in the values of centrifugal force is the decrease in tangential velocity regarding increasing the mass flow rate. This reduction trend is shown in Figure 9.
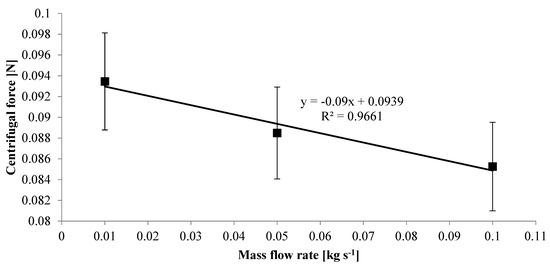
Figure 9.
Centrifugal force acting on a particle in various mass flow rates with error bars of 10%.
3.4. Euler and Stokes Numbers
Regarding Figure 10, variations of the Euler number showed an increasing trend up to inlet velocity of 16 m⋅s−1, and a slight increment occurred at velocities of 18 and 20 m⋅s−1 in comparison with 16 m⋅s−1. This behavior can be explained as follows. The inlet dimensions are the same in all simulations; the pressure drop mainly varies with inlet velocity based on vc = 4q/πD2 (Equation (3)), and the Euler number showed the mentioned treatment. In other words, correct computing of the vc plays an essential role in the Euler number. Meanwhile, considering that the relationship between pressure drop and velocity changes is not linear, this parameter can also be effective in decreasing–increasing changes.
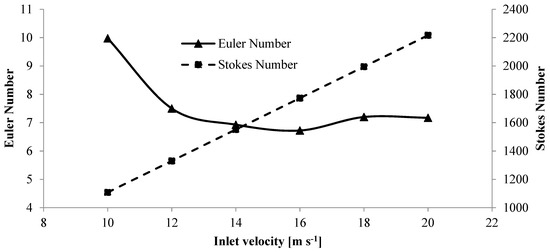
Figure 10.
Euler and Stokes numbers variation in various inlet velocities.
In the following, the Stokes number showed an increasing trend with an increase in the inlet velocity. According to Equation (3), the variation of vc caused changes in the Stokes number values in the different inlet velocities. Because the density, particle diameters, gas viscosity, gravity acceleration, and cylindrical section diameter were the same in all simulations. Additionally, in lower Stokes number (Vin = 16 m·s−1), the particles are more influenced by the flow. On the other hand, in higher Stokes number (Vin = 10 m·s−1) the flow influence on the particles is less than other inlet velocities.
3.5. Streamline
The streamlined contour plots in various inlet velocities are illustrated in Figure 11. For a comprehensive assessment of the streamline inside the cyclone, the streamlines were mounted to tangential velocity contours. The vortex domain was developed by increasing the inlet velocity, especially at inlet velocities of 16, 18, and 20 m⋅s−1. The flow lines represent the flow pattern inside the cyclone.
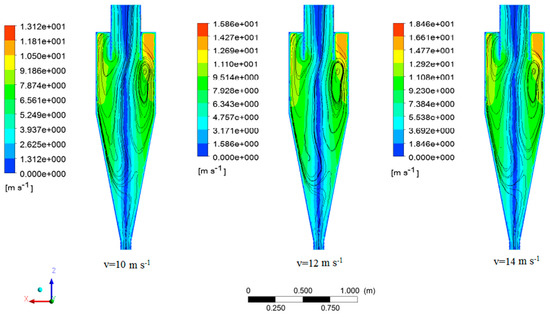
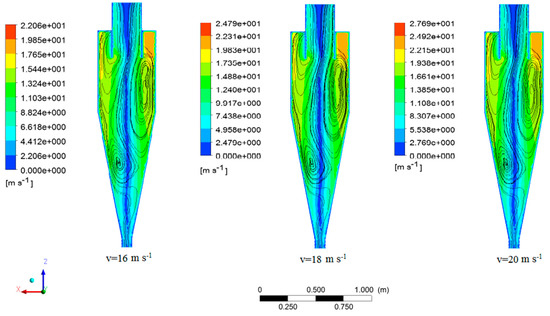
Figure 11.
Streamline contours in various inlet velocities.
The streamline contours indicated a similar trend for all mass flow rate values. Figure 12 shows the vortexes created inside the cyclone. These vortexes have a beneficial factor in identifying the flow within the cyclone. The streamline was mounted on tangential velocity to obtain a deep understanding of the inside flow. The overall pattern of streamline contour plot mounted on tangential velocity is related to cylindrical dipleg, in which the authors studied the shape of the dipleg on the cyclone performance [33].
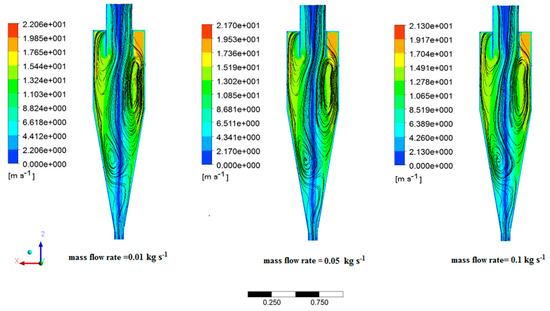
Figure 12.
Streamline contours in various mass flow rates.
3.6. Erosion
Erosion of cyclone surfaces due to the collision of wheat seeds is studied in this section. The erosion of the wheat seeds is studied in six inlet velocities and three mass flow rates. The contours of the erosion rate are shown in Figure 13 and Figure 14. The inlet velocity for the mass flow rate study was assumed 16 m⋅s−1, and the cyclone wall was an iron sheet. The wheat seeds at the inlet of the cyclone have a uniform concentration.
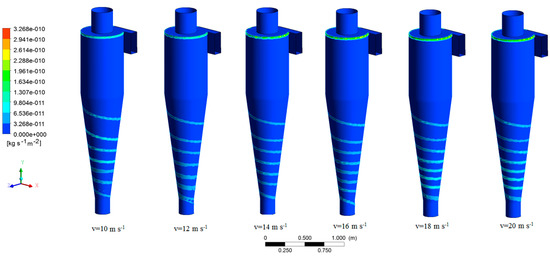
Figure 13.
Erosion contours in various inlet velocities.
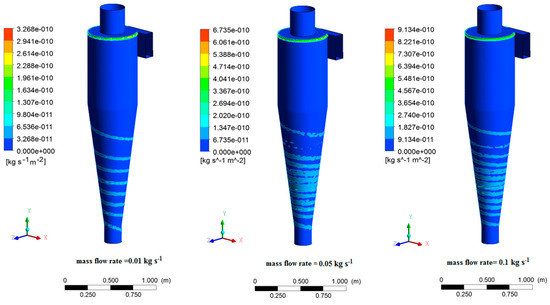
Figure 14.
Erosion contours in various mass flow rates.
The maximum erosion rate appeared in the entrance part of the cyclone. It is noteworthy that the distribution of the erosion on the cyclone wall is analogous to the wheat seeds trajectory. As can be observed in Figure 13, the maximum value for erosion rate is obtained in the high inlet velocities, and trends are compatible with the reports in the Parvaz et al. work [34].
The variations of mass flow rates of wheat seeds have a significant effect on the cyclone erosion rates. Moreover, as the mass flow rate in the cyclone walls rises, the rotational route intensity increases. The maximum erosion was observed in the conical section of the cyclone. Additionally, in all cylindrical areas of the cyclone except for the top section, the erosion is insignificant (Figure 15).
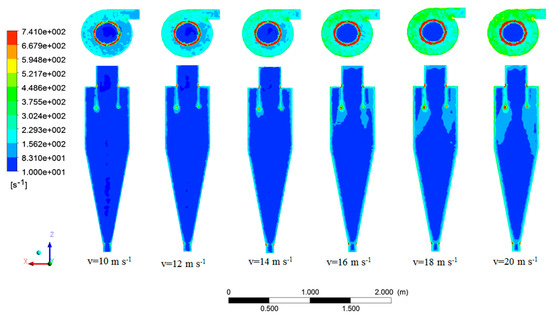
Figure 15.
Strain rate contours in various inlet velocities.
3.7. Strain Rate
Strain rate is the change in strain (deformation) of material over time. Strain rate is a negative factor for cyclone strength and can affect cyclone performance over time. The high values of strain rate occurred in three sections: the vortex finder connection locations to the cyclone body, the bottom edge of the vortex finder, and the bottom throat of the particle outlet. This is due to the strain’s influence on other parts of the cyclone’s inner parts. Strain rate is a structure-related parameter.
Any increase in strain rate reduces the strength of the structure and in the case of a cyclone affects the strength of the cyclone body. In the best case, a cyclone with smaller values in terms of strain rate is better.
The strain rate domain increases by increasing the inlet velocity and extends to the adjacent sections with a gradual process (Figure 15). The main impact of increasing the inlet velocity is on the bottom edge of the vortex finder. This event indicates a significant rise in its range.
In addition, increasing the mass flow rate, raise the strain rate within the cyclone. It indicates more strain changes at a given time. This increase probably is due to the cyclone operating at a higher mass flow rate and higher particle collision. The trend is illustrated in Figure 16. Despite the low values of the strain rate for the cyclone body, in areas with maximum values, it can have destructive effects in the long term.
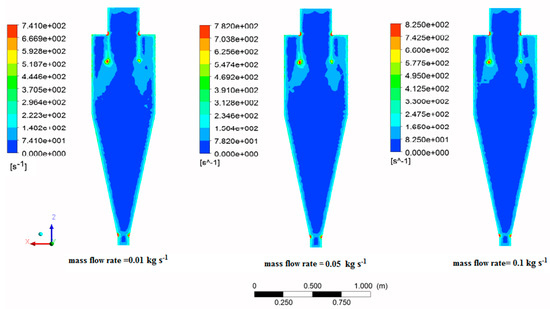
Figure 16.
Strain rate contours in various mass flow rates.
3.8. Wall Shear
The wall shear stress is relative to the free stream velocity, which is influenced by the swirling flow velocity on the cyclone wall. The high value of wall shear could be a negative factor in cyclone structure. The wall shear distribution in the cyclone wall was presented in Figure 17 as a 3D contour in various inlet velocities. The maximum wall shear is obtained at the connection of the entrance section to the cyclone cylinder, where swirl flow was created in this section. To compare the results in various inlet velocities, the rainbow index was fixed by a user-defined range. Sections with high interaction between wall shear and pressure gradient of the vortex are the probable parts of the high instability of the cyclone body.
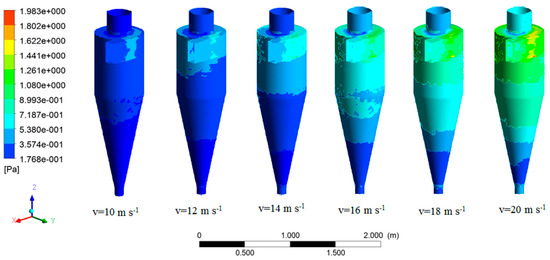
Figure 17.
Wall shear 3D contour in various inlet velocities.
In addition, it can be seen that increasing the mass flow rate has a direct effect on the shear of the wall and reached the maximum value of 1.293 Pa for the mass flow rate of 0.01 kg⋅s−1 and 1.358 Pa for the mass flow rate of 0.1 kg⋅s−1 (Figure 18). The maximum wall shear was created in the inlet section of the cyclone in which the high momentum of flow could be the main reason for this high value. Regarding the swirling motion of flow in the body and conical section, the minimum wall shear was observed in the bottom part of the conical section.
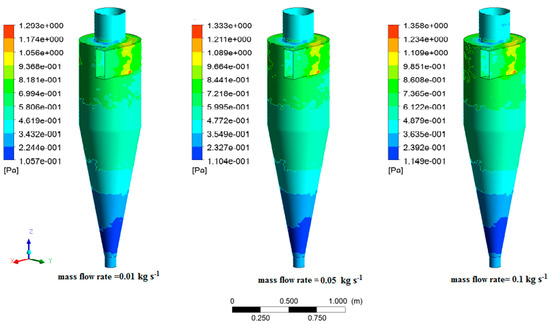
Figure 18.
Wall shear 3D contours in various mass flow rates.
4. Conclusions
In the present study, the effects of flow inlet velocity and mass flow rate on centrifugal force, Euler and Stokes numbers, streamlines, strain rate, and wall shear were evaluated. The notable results and conclusions may be drawn as:
- As a significant result, the centrifugal force applied to wheat particles inside the cyclone was increased by an enhancement in the inlet velocity. Additionally, the variation of the Euler number showed an increasing trend by an enhancement in the inlet velocity. Whereas, the Stokes number showed an increasing trend up to the velocity of 16 m·s−1, and then a slight increase and decrease were shown in this parameter. These momentous results can be used in the operational stages.
- The maximum erosion rate was achieved in the entrance and conical sections of the cyclone. It is noteworthy that the distribution of the erosion on the cyclone wall is analogous to the wheat seeds’ trajectory. Additionally, in Vin = 16 m·s−1 the particles are more influenced by the flow. On the other hand, in Vin = 10 m·s−1 the flow influence on the particles is less than other inlet velocities.
- The strain rate domain was increased by increasing the inlet velocity. Then, it was developed in the adjacent sections in a gradual process. The main impact of increasing the inlet velocity was on the bottom edge of the vortex finder. Additionally, raising the mass flow rate enhanced the strain rate inside the cyclone. It can be argued that this increase was probably due to the cyclone operating at a higher mass flow rate and higher particle collision.
- The maximum wall shear is created at the entrance of the cyclone and the high momentum of flow could be the major cause of it. Additionally, the minimum wall shear was created in the bottom segment of the conical section. The wall shear increased by raising the mass flow rate.
Eventually, it can be concluded that for ranges of inlet velocity and mass flow rate, the Vin = 16 m⋅s−1 and mass flow rate = 0.01 is the best choice to use in the conveying process in wheat conveying cyclone. Additionally, it is worth noting, that the entrance and the conical sections of the cyclone are the critical sections in the view of erosion in a wheat conveying cyclone separator.
Author Contributions
Conceptualization, S.N.D. and G.S.; methodology, S.N.D.; software, A.R.F.; validation, V.R. and V.R.S.; formal analysis, V.R.S.; investigation G.S.; resources, V.R.; data curation, A.R.F. and M.S.; writing—original draft preparation, G.S. and V.R.; writing—review and editing, M.S.; V.R.S. and R.K.; visualization, G.S. All authors have read and agreed to the published version of the manuscript.
Funding
This research received no external funding.
Institutional Review Board Statement
Not applicable.
Informed Consent Statement
Not applicable.
Data Availability Statement
Data sharing is not applicable to this article.
Conflicts of Interest
The authors declare that they have no known competing financial interests or personal relationships that could have appeared to influence the work reported in this paper.
References
- Funk, P.A.; Elsayed, K.; Yeater, K.M.; Holt, G.A.; Whitelock, D.P. Could cyclone performance improve with reduced inlet velocity? Powder Technol. 2015, 280, 211–218. [Google Scholar] [CrossRef][Green Version]
- Rezvanivand Fanayi, A.; Nikbakht, A.M. A CFD study of the effects of feed diameter on the pressure drop in acyclone separator. Int. J. Food Eng. 2015, 11, 71–77. [Google Scholar] [CrossRef]
- Miller, B.G. Clean Coal Engineering Technology; Butterworth-Heinemann: Oxford, UK, 2011; ISBN 9780128113653. [Google Scholar]
- Misiulia, D.; Elsayed, K.; Gustav, A. Geometry optimization of a deswirler for cyclone separator in terms of pressure drop using CFD and artificial neural network. Sep. Purif. Technol. 2017, 158, 10–23. [Google Scholar] [CrossRef]
- Huang, A.; Ito, K.; Fukasawa, T.; Yoshida, H.; Kuo, H.; Fukui, K. Classification performance analysis of a novel cyclone with a slit on the conical part by CFD simulation. Sep. Purif. Technol. 2017, 190, 25–32. [Google Scholar] [CrossRef]
- Gimbun, J.; Chuah, T.G.; Fakhru’l-Razi, A.; Choong, T.S.Y. The influence of temperature and inlet velocity on cyclone pressure drop: A CFD study. Chem. Eng. Process. Process Intensif. 2005, 44, 7–12. [Google Scholar] [CrossRef]
- Shalaby, H.; Wozniak, K.; Wozniak, G. Numerical Calculation of Particle-Laden Cyclone Separator Flow Using Les. Eng. Appl. Comput. Fluid Mech. 2008, 2, 382–392. [Google Scholar] [CrossRef]
- Zhao, B. Prediction of gas-particle separation efficiency for cyclones: A time-of-flight model. Sep. Purif. Technol. 2012, 85, 171–177. [Google Scholar] [CrossRef]
- Wan, G.; Sun, G.; Xue, X.; Shi, M. Solids concentration simulation of different size particles in a cyclone separator. Powder Technol. 2008, 183, 94–104. [Google Scholar] [CrossRef]
- Sun, X.; Kim, S.; Yang, S.D.; Kim, H.S.; Yoon, J.Y. Multi-objective optimization of a Stairmand cyclone separator using response surface methodology and computational fluid dynamics. Powder Technol. 2017, 320, 51–65. [Google Scholar] [CrossRef]
- Sun, X.; Yoon, J.Y. Multi-objective optimization of a gas cyclone separator using genetic algorithm and computational fluid dynamics. Powder Technol. 2018, 325, 347–360. [Google Scholar] [CrossRef]
- Park, D.; Cha, J.; Kim, M.; Go, J.S. Multi-objective optimization and comparison of surrogate models for separation performances of cyclone separator based on CFD, RSM, GMDH-neural network, back propagation-ANN and genetic algorithm. Eng. Appl. Comput. Fluid Mech. 2020, 14, 180–201. [Google Scholar] [CrossRef]
- Brar, L.S.; Elsayed, K. Analysis and optimization of cyclone separators with eccentric vortex finders using large eddy simulation and artificial neural network. Sep. Purif. Technol. 2018, 207, 269–283. [Google Scholar] [CrossRef]
- Le, D.K.; Yoon, J.Y. Numerical investigation on the performance and flow pattern of two novel innovative designs of four-inlet cyclone separator. Chem. Eng. Process Process Intensif. 2020, 150, 107867. [Google Scholar] [CrossRef]
- Lim, J.H.; Park, S.I.; Lee, H.J.; Zahir, M.Z.; Yook, S.J. Performance evaluation of a tangential cyclone separator with additional inlets on the cone section. Powder Technol. 2020, 359, 118–125. [Google Scholar] [CrossRef]
- Nassaj, O.R.; Toghraie, D.; Afrand, M. Effects of multi inlet guide channels on the performance of a cyclone separator. Powder Technol. 2019, 356, 353–372. [Google Scholar] [CrossRef]
- Qiang, L.; Qinggong, W.; Weiwei, X.; Zilin, Z.; Konghao, Z. Experimental and computational analysis of a cyclone separator with a novel vortex finder. Powder Technol. 2020, 360, 398–410. [Google Scholar] [CrossRef]
- Gao, Z.; Wang, J.; Wang, J.; Mao, Y.; Wei, Y. Analysis of the effect of vortex on the flow field of a cylindrical cyclone separator. Sep. Purif. Technol. 2018, 211, 438–447. [Google Scholar] [CrossRef]
- Zhou, Y.; Xu, Z.; Xiao, G.; Hu, X.; Chen, H.; Zhang, R.; Luo, X.; Wang, J.; Yang, Y. Monitoring the hydrodynamics and critical variation of separation efficiency of cyclone separator via acoustic emission technique with multiple analysis methods. Powder Technol. 2020, 373, 174–183. [Google Scholar] [CrossRef]
- Gao, W.; Li, J.; Li, Y.; Kong, L. Numerical identification of critical erosion prone areas in tube heat exchangers. Eng. Appl. Comput. Fluid Mech. 2020, 14, 1429–1444. [Google Scholar] [CrossRef]
- Dizajyekan, S.N.; Shahgholi, G.; Fanaei, A.R.; Rostampour, V.; Sharabiani, V.R.; Szymanek, M.; Marczuk, A. A Comprehensive CFD Assessmeant of Wheat Flow in Wheat Experimental Data. Processes 2022, 10, 1. [Google Scholar] [CrossRef]
- Rezvanivand Fanaei, A.; Nikbakht, A.M.; Hassanpour, A. A computational-experimental investigation of thermal vapor compressor as an energy saving tool for the crystallization of sugar in a sugar processing plant. J. Food Process Eng. 2021, 44, e13727. [Google Scholar] [CrossRef]
- Mohammadzadeh, P.; Shahgholi, G.; Fanaei, A.R.; Rostampour, V. Assessment of larvae killing pneumatic conveying system elbow: Screening the pressure drop and numerical simulation. J. Food Process Eng. 2021, 11, e13868. [Google Scholar] [CrossRef]
- Zobeiri, M.; Rostampour, V.; Rezvanivand-fanaei, A.; Nikbakht, A.M. Comparative performance analysis of innovative separation chamber configurations: Numerical and experimental investigations. Span. J. Agric. Res. 2021, 19, e0206. [Google Scholar] [CrossRef]
- Mohammadzadeh, P.; Shahgholi, G.; Rezvanivand Fanaei, A.; Rostampour, V. The effect of pipe development length on flow characteristics in a larvae killing system: Screening the dilute phase by CFD. J. Food Process Eng. 2022, 1, e14035. [Google Scholar] [CrossRef]
- Rezvanivand fanaei, A.; Hasanpour, A.; Nikbakht, A.M. Study of The Vapor Thermo-Compressor to Reduce Energy Consumption in the Sugar Production Line using Computational Fluid Dynamics. J. Agric. Mach. 2020, 10, 241–253. [Google Scholar] [CrossRef]
- Rhodes, M. Introduction to Particle Technology; John Wiley & Sons: Hoboken, NJ, USA, 2008; ISBN 9780470014271. [Google Scholar]
- Inc A. ANSYS FLUENT Theory Guide ANSYS FLUENT Theory Guide. Comput. Commun. 2013, 15317, 373–464. [Google Scholar] [CrossRef]
- Oka, Y.I.; Yoshida, T. Practical estimation of erosion damage caused by solid particle impact: Part 2: Mechanical properties of materials directly associated with erosion damage. In Wear; Elsevier: Amsterdam, The Netherlands, 2005; Volume 259, pp. 102–109. [Google Scholar]
- Zhou, F.; Sun, G.; Zhang, Y.; Ci, H.; Wei, Q. Experimental and CFD study on the effects of surface roughness on cyclone performance. Sep. Purif. Technol. 2018, 193, 175–183. [Google Scholar] [CrossRef]
- Karagoz, I.; Avci, A.; Surmen, A.; Sendogan, O. Design and performance evaluation of a new cyclone separator. J. Aerosol Sci. 2013, 59, 57–64. [Google Scholar] [CrossRef]
- Ji, L.; Chen, J.; Kuang, S.; Qi, Z.; Chu, K.; Yu, A.; Chen, J.; Kuang, S.; Qi, Z.; Chu, K.; et al. Prediction of separation performance of hydrocyclones by a PC-based model. Sep. Purif. Technol. 2018, 121, 141–150. [Google Scholar] [CrossRef]
- Parvaz, F.; Hosseini, S.H.; Elsayed, K.; Ahmadi, G. Influence of the dipleg shape on the performance of gas cyclones. Sep. Purif. Technol. 2020, 233, 116000. [Google Scholar] [CrossRef]
- Parvaz, F.; Hosseini, S.H.; Elsayed, K.; Ahmadi, G. Numerical investigation of effects of inner cone on flow field, performance and erosion rate of cyclone separators. Sep. Purif. Technol. 2018, 201, 223–237. [Google Scholar] [CrossRef]
Publisher’s Note: MDPI stays neutral with regard to jurisdictional claims in published maps and institutional affiliations. |
© 2022 by the authors. Licensee MDPI, Basel, Switzerland. This article is an open access article distributed under the terms and conditions of the Creative Commons Attribution (CC BY) license (https://creativecommons.org/licenses/by/4.0/).