Article

Large-Scale Production of Size-Adjusted β-Cell Spheroids in a Fully Controlled Stirred-Tank Reactor

Institute of Bioprocess Engineering and Pharmaceutical Technology, University of Applied Sciences Mittelhessen, Wiesenstrasse 14, 35390 Giessen, Germany
*
Author to whom correspondence should be addressed.
Processes 2022, 10(5), 861; https://doi.org/10.3390/pr10050861
Submission received: 21 March 2022 / Revised: 21 April 2022 / Accepted: 24 April 2022 / Published: 27 April 2022

Abstract

:
For β-cell replacement therapies, one challenge is the manufacturing of enough β-cells (Edmonton protocol for islet transplantation requires 0.5–1 × 10⁶ islet equivalents). To maintain their functionality, β-cells should be manufactured as 3D constructs, known as spheroids. In this study, we investigated whether β-cell spheroid manufacturing can be addressed by a stirred-tank bioreactor (STR) process. STRs are fully controlled bioreactor systems, which allow the establishment of robust, larger-scale manufacturing processes. Using the INS-1 β-cell line as a model for process development, we investigated the dynamic agglomeration of β-cells to determine minimal seeding densities, spheroid strength, and the influence of turbulent shear stress. We established a correlation to exploit shear forces within the turbulent flow regime, in order to generate spheroids of a defined size, and to predict the spheroid size in an STR by using the determined spheroid strength. Finally, we transferred the dynamic agglomeration process from shaking flasks to a fully controlled and monitored STR, and tested the influence of three different stirrer types on spheroid formation. We achieved the shear stress-guided production of up to 22 × 106 ± 2 × 10⁶ viable and functional β-cell spheroids per liter of culture medium, which is sufficient for β-cell therapy applications.

1. Introduction

Diabetes involves the selective autoimmune destruction or dysfunction of insulin-producing β-cells, located within the islets of Langerhans in the pancreas. The large and growing number of patients living with diabetes [1] has generated interest in the promise of β-cell therapy to restore lost β-cell mass [2]. However, β-cells have unique characteristics and must be transplanted as spheroids to be able to exert their full biological activity in the recipient. The β-cell spheroids are living drugs, and proper manufacturing is an important step to bring these therapeutics into clinics. It is difficult to manufacture sufficient β-cell numbers. The total estimated number of β-cells in the human pancreas is ~109 [3], which is the benchmark for the manufacturing process. Islets of Langerhans from deceased donors show a high functionality, but there is a shortage of donor material, the adult β-cells lose their functionality over time, and they cannot be expanded in vitro [4,5]. Induced pluripotent stem cells (iPSCs) can help to address the material shortage, but iPSCs lack functionality compared with native islets and require a complex and laborious differentiation protocol [4,5,6]. Various mouse and rat models have been used for diabetes research, which led to the development of rodent β-cell lines such as RIN (rat), INS-1 (rat) and MIN6 (mouse) [4]. However, the development of human β-cell lines has been hampered by their insufficient functionality and xenotropic viral contamination [5,7,8,9]. Even so, β-cell lines can be expanded in vitro over multiple passages without decreasing in functionality, therefore, β-cell lines serve as good models for diabetes research, and the development of manufacturing protocols for cell therapy [10,11]. The 3D cultivation of β-cell lines as spheroids or agglomerates (these terms are used synonymously) can enhance glucose-dependent insulin secretion, and β-cells cultured as re-aggregated 3D structures (pseudo-islets) show a greater viability, proliferation and functionality than individual cells [12,13]. Such agglomerates facilitate the reconstitution of the native pancreatic microenvironment, including cell–cell interactions, the extracellular matrix (ECM), cell coupling and tight junctions, cell polarization, and changes in gene expression triggered by bioactive molecules and forces acting on the cytoskeleton [14,15,16].
A manufacturing process for cell therapy must produce uniform spheroids in sufficient numbers. As mentioned above, the benchmark for β-cell therapy is to manufacture ~109 cells [3] or 1–3.2 × 10⁶ spheroids, following the cell and islet amount within the human pancreas [15,17]. Although the mean islet size is 140 µm [3], a major portion of islets ranges between 20 and 50 µm (37%) [18], or 10 and 50 µm (60%) [19]. Even though the contribution of the smaller islets to the total islet mass is small, they might be crucial for the outcome of the transplants, as smaller islets are more robust against hypoxic conditions [20]. Ultimately, this results in an increased functionality, as shown for islets < 100 µm in comparison with islets > 250 µm [21,22,23], therefore, we aim to manufacture spheroids between 20 and 100 µm. Small-scale systems, such as microtiter plates, can generate enough spheroids for research purposes, but they are labor-intensive and vulnerable to contamination, they lack process control, and they are difficult to scale up to produce sufficient cell quantities for clinical applications. Some groups address the scale-up issue by using spinner flasks [24,25,26,27] or rotating wall vessel reactors (RWVRs) [22,28], which enable a limited degree of process control and increase the manufacturing scale up to 500 mL. However, these systems achieve improper mixing and have limited possibilities to adjust the spheroid size. Our literature search did not reveal any reports regarding the large-scale (1 L or more) or stirred-tank bioreactor (STR) related expansion of β-cell spheroids, but STR results were found for other cell types (mainly iPSCs). Table 1 summarizes the critical aspects of the dynamic production of spheroids with different cell types in relation to our presented theoretical background (see Supplementary). STRs are fully controlled bioreactor systems, which allow the establishment of robust, larger-scale manufacturing processes. STRs also facilitate the online monitoring and control of process parameters such as O2, pH, temperature, and biomass (the latter by dielectric spectroscopy). STR processes can also be automated and are scalable up to 6000 L (single-use and multi-use systems). Particularly, the scale-up of β-cell manufacturing is a crucial step. When transferring bioprocesses to larger scales, mass transport problems often occur and become process-limiting, which could not be observed or were negligible on a small scale. To avoid process limitations, a correct scale-up strategy is needed, for which the similarity theory provides good service. This theory uses dimensionless numbers (such as the stirrer power number, NP, or the Reynolds number, Re) for the description of a physical–technical behavior of the manufacturing system (e.g., the STR), which is to be maintained constant during the transition to another scale, so that the physical similarity remains [29]. In the context of β-cell spheroid manufacturing, we see STRs as a potent choice of scalable bioreactor systems, as STRs provide geometric similarity (ds/DT, HL/DT, dS/dH,) at different scales, and the development of a turbulent flow, which enables a constant NP and the admissible application of Kolmogorov’s theory of isotropic turbulence (see theoretical background or [30]).
Although we consider the STR as a proper system for β-cell spheroid manufacturing, we must be aware of the fact that the formation of cell agglomerates differs from the formation in static culture systems. Agglomeration in static cultures involves the self-assembly of cells in hanging drops or parabolic wells with cell-repellent surfaces [31]. In contrast, in an STR, the cell agglomeration requires collisions between cells to establish cell–cell connections, facilitated by protein-mediated adhesion forces on the cell surface. Cell agglomeration progresses, until the hydrodynamic forces become too high to support further cell attachments to the spheroid. A steady state is reached when the spheroid strength (the total of all cell adhesion forces within the spheroid) equals the hydrodynamic forces in the culture medium.
Table 1. Overview of dynamic aggregate/spheroid processes with different cell types, applications, bioreactor types, and the respective scalability in accordance with the similarity theory. We evaluated the production scale, the stirrer type (or similar), and consequently determined the flow range based on own calculations regarding the Reynolds number, Re. Additionally, we listed the seeding density, and the size range of the aggregates and yield per batch. Finally, we compared the described agglomeration techniques, depending on the kind of regulating force, the fluid dynamic, and the ability to adjust the aggregate size. We defined the production of spheroids as controlled when the cells aggregate under isotropic conditions, i.e., at Re > 10,000. This leads to a small size distribution of the aggregates and prevents further agglomeration of the spheroids themselves. Moreover, the applied hydrodynamic forces can restrict the size of the formed spheroids. At ratios of dSph/λ < 3, the size restriction is facilitated by surface erosion (for further information, see Supplementary or [30]).
Cell TypeCell NameApplicationBioreactor Type;
Scalability
Production
Scale [mL]
Stirrer TypeReynolds Number Re
[−] and Flow Range **
Seeding Density
[Cells mL−1]
Size Range
[µm]
Yield Agglomeration TechniqueReference
Islets/
β-cell lines
INS-1Bioprocess model for diabetes therapySTR (Infors HT);
scalable
100030-SPB; 45-SPB;
Rushton
Re = 11,000–18,000;
turbulent
5 × 10540–
50
22 × 103 spheroids mL−1;
1.1 × 10³ IEQs mL−1;
22 × 106 spheroids batch−1; 1.1 × 10⁶ IEQs batch−1;
Controlled: isotropic conditions; surface erosion (dSph/λ < 3); narrow size distribution; size restrictedThis study
MIN6Research studies and clinical applicationSpinner flask (ProCulture, Corning); semi-scalableNot specifiedStraight blade paddle impeller *Re = 2300
(d = 40 mm, 60 rpm);
non-turbulent
0.2–0.4 × 105100–400~0.7 × 10⁶ cells mL−1Uncontrolled: non-isotropic; broad size distribution; no size restriction[26]
Primary neonatal porcine pancreatic islet cellsScalable process to expand pancreatic endocrine tissue for cell therapySpinner flask (Corning); semi-scalable100Magnetic stir bars-1.3 × 10⁵Not specified1 × 106 cells mL−1;
1 × 10⁸ cells batch−1
Uncontrolled: non-isotropic; broad size distribution; no size restriction[25]
ESCCyT49Diabetes therapy6-well plates;
not scalable
5.5No stirrerNon-turbulent10 × 105100–200~1000 aggregates mL−1;
~5500 aggregates batch−1
Uncontrolled: non-isotropic; broad size distribution; no size restriction[32]
Royan H5 and H6Bioprocess development for production of aggregatesSpinner flask (Cellspin; Integra Biosciences); semi-scalable100Magnetic pendulums *-2–10 × 105140–2002 × 106 cells mL−1;
2 × 10⁸ cells batch−1
Uncontrolled: non-isotropic; broad size distribution; no size restriction; addition of shear protectant[24]
iPSChCBiPSC2Development of suspension culture for iPSCsSTR (cellferm®, DASGIP AG); scalable10045° 0°, 45°60°, 60°60° impellerRe ≈ 2500
(d = 40 mm, 60 rpm);
Non-turbulent
4–5 × 10550–1502 × 106 cells mL−1;
2 × 10⁸ cells batch−1
Uncontrolled: non-isotropic; broad size distribution; no size restriction[33]
hHSC_1285i_iPS2Development of high-density bioprocessingSTR (DASbox, Eppendorf AG);
scalable
150–500Eight-blade impeller (60° pitched)Re = 1200–2600 (d = 30 mm);
non-turbulent
5 × 10550–4002.9 × 106 cells mL−1;
4.6–14.5 × 10⁸ cells batch−1
Uncontrolled: non-isotropic; broad size distribution; no size restriction[34]
hiPSC1 and hiPSC4Bioprocess development for production of iPSCs aggregatesSpinner flask (Cellspin; Integra Biosciences); semi-scalable100Magnetic pendulums *-2–10 × 105140–2001.8 × 106 cells mL−1;
1.8 × 10⁸ cells batch−1
Uncontrolled: non-isotropic; broad size distribution; no size restriction; addition of shear protectant[24]
Tumor cellsMCF7, BT474, HCC1954, HCC1806, A549, H460, H157, H1650 and HT293D cancer modelsBaffled spinner flasks (Corning® Life Sciences);
semi-scalable
125–500Straight blade paddle impellerRe = 2300–3800
(d = 40 mm, 60–100 rpm);
non-turbulent
2 × 10581–298 (depending on cell type)1000–1500 spheroids mL−1;
0.16–0.63 × 10⁶ spheroids batch−1
Uncontrolled: non-isotropic; broad size distribution; no size restriction[27]
* We assumed the stirrer type and size, based on the product information of the bioreactor system. ** The flow range is based on own calculations regarding the Reynolds number, Re (Re < 10,000 corresponds to non-turbulent and Re > 10,000 to turbulent).
We aim to develop a large-scale STR-based production process for viable and functional β-cell spheroids, allowing the production of large numbers of spheroids within a defined size range of 20 to 100 µm. The term “large-scale” has no precise definition, but we aimed to scale up our process to a working volume of 1 L, which is 100-times higher than the volume of RWVRs, and repeatedly higher than comparable processes with iPSCs (Table 1). We used the INS-1 as our model β-cell line to develop this process. We used shaking flasks as a screening platform to characterize the behavior of INS-1 β-cells in a turbulent flow regime, and to determine the minimal seeding density and spheroid strength. We then used the spheroid strength (equaling the sum of the bonding forces between adjacent cells mediated by membrane proteins [30]) to predict the spheroid size in the STR. Furthermore, we investigated the influence of the stirrer design by testing three stirrer types with different pumping directions (axial, axial/radial and radial), stirrer-swept volumes, and maximum energy dissipation to mean energy dissipation ratios. Finally, we scaled up from the shaking flasks to the STR by keeping the energy dissipation constant.

2. Materials and Methods

2.1. Cells and Culture Medium

We used the rodent β-cell line INS-1 (kindly provided by Sebastian Hauke from European Molecular Biology Laboratory, Heidelberg, Germany), which originated from a Simian virus-induced rat insulinoma. Pre-cultures, prepared in RPMI 1640 medium (Biochrom, Berlin, Germany) and supplemented with 10% (v/v) fetal bovine serum (FBS) and 0.05 M 2-mercaptoethanol (Carl Roth, Karlsruhe, Germany), were incubated at 37 °C in a 5% CO2 atmosphere. The cells were seeded with 5 × 10⁴ cells cm−2 into 25–175 cm2 T-flasks (Sarstedt, Nuembrecht, Germany) and cultured to a confluence of 80–90%. Before passaging, the cells were observed by microscopy to ensure the absence of morphological defects and contamination. The cells were washed once with 0.3 mL cm−2 phosphate-buffered saline (PBS, Biochrom) before detachment with 0.012 mL cm−2 trypsin (Biochrom) for 5–7 min at 37 °C. After detachment, premature agglomeration was avoided by omitting centrifugation. Although the INS-1 cell line was robust, we did not exceed a passage number of 35.

2.2. Static Spheroid Formation

Static 3D cultures as spheroids were generated in 96-well plates (U-bottom) with a cell-repellent surface (Greiner, Kremsmünster, Austria). The INS-1 were seeded at 103 cells per well, where the cells were forced into agglomeration by the parabolic shape. The working volume was 200 µL, and a 50% medium exchange was performed every other day. Daily imaging of the spheroids was used to determine the diameter and circularity, while staining with calcein/ethidium was used to determine the viability. Each experiment was performed in 12-fold biological replicates.

2.3. Shaking Flask Cultivation

Preliminary experiments were carried out in shaking flasks at 37 °C in a 5% CO2 atmosphere. We used 100-mL shaking flasks with a working volume of 20 mL. The shaking flasks had an inner diameter of 0.064 m, and four baffles. For all experiments, we used the same Celltron shaking plate (Infors HT, Bottmingen, Switzerland) with an eccentricity of 2.5 cm and varying rotational frequencies. The cells were inoculated with a seeding density of 5 × 10⁵ cells mL−1. Daily samples were stained with calcein/ethidium to test viability, and an image-based analysis of the particle distribution was carried out as described below.

2.4. Production of Spheroids in a STR

For the large-scale production of β-cell spheroids, we used the Labfors 5 Bioreactor system (Infors HT). The bioreactor tank had an inner diameter of 0.115 m and a dished bottom. The working volume VL was 1 L, resulting in a ratio of liquid height to tank diameter of HL/DT = 1. We used three different stirrer types: a 30° three-segment pitched-blade stirrer (30°-3-SPB), a 45° three-segment pitched-blade stirrer (45°-3-SPB), and a Rushton turbine (Table S1). To achieve a constant mean energy dissipation of ε ¯ = 35 kW kg−1 in each STR run, the stirrer speed for the 30°-3-SPB was 183 rpm, for the 45°-3-SPB it was 141 rpm, and for the Rushton turbine it was 162 rpm. The STR was equipped with process analytical technology, including a temperature probe, a pH probe, a dissolved oxygen (DO) probe, and a dielectric spectroscopy probe (all from Hamilton Germany). During cultivation, the temperature was maintained at 37 °C, the pH was regulated by gassing with CO2 or the addition of 1 M NaOH, and the DO concentration was kept above 40% by discontinuous submersed gassing (sparger). A DO of 100% represents oxygen-saturated culture medium (without cells) at 37 °C, the corresponding stirrer speed, and 100 mL min−1 continuous submersed gassing with air. Every 12 min, the permittivity (correlating with viable biomass) was measured inline at 1000 kHz, combined with a frequency scan of 300–10,000 kHz. The four installed probes, the shaft guide, the sparger, and the pipes for sampling and harvest were used as baffles, and this was sufficient to achieve complete baffling [35]. After the sterilization of the bioreactor, pre-cultured cells in multiple T-175 flasks were harvested, using trypsin. The cells were in the exponential growth phase and not overgrown. As above, we avoided centrifugation to prevent a premature agglomeration. The seeding density in the STR was 5 × 10⁵ cells mL−1. The cells were stained with calcein/ethidium to test their viability, and an image-based analysis of the particle distribution was carried out as described below.

2.5. Calcein/Ethidium Staining to Analyze Particle Count, Size, Circularity, and Areas of Green and Red Particles

We used the LIVE/DEAD Viability/Cytotoxicity Kit (Invitrogen (Waltham, MA, USA), Thermo Fisher Scientific (Waltham, MA, USA)) containing calcein AM and ethidium homodimer 1. Calcein AM is a true live stain that detects intracellular esterase activity, and ethidium homodimer 1 intercalates into DNA to detect dead cells. The cells were stained without washing steps to prevent cell/spheroid loss. After sampling, five technical replicate (100-µL) samples were transferred to flat-bottom 96-well plates. The staining solution was added directly to the sample (final concentration = 2 µM calcein/ethidium) and incubated for 30 min at 37 °C. No washing steps were applied to prevent cell/spheroid loss. The samples were analyzed using a Cytation3 (BioTek Instruments, Winooski, VT, USA). The fluorescent cells and spheroids in entire wells were captured by acquiring multiple images at 10× magnification. The particle count, size, circularity, and areas of green and red particles were determined, using Gen5 v2.07.17 to assess cell viability.

2.6. Particle Size Distribution

Image analysis was restricted to the size range 0–300 µm. To distinguish between single cells and spheroids, we set the threshold to 20 µm. All counts <20 µm were defined as single cells, whereas all counts >20 µm were evaluated as spheroids. The size of the particle distribution was expressed using the Sauter diameter d32 as shown in Equation (1):
d 32 = 6 ·   V S p h   S S p h
where SSph represents the surface of the spheroids. We found that the Sauter diameter d32 described the size distribution of the spheroids very well compared with the mean diameter, median and modus.
We compared the progression of the single cell and spheroid counts of the culture period in addition to the spheroid distribution (20–300 µm) by constructing box plots, showing the median, mean, minimum (1%) and maximum values (99%). The span width of the spheroid distribution within the margin of 1 to 99% was used to compare the width of the particle distributions from different cultures.

2.7. Assessment of Viability

The viability of the whole sample was determined from the respective green Agreen and red Ared areas. Hereby, we discriminated between the areas according to our determined size ranges to determine the viability of the single cells (areas of the size range: 0–20 µm), the spheroids (areas of the size range: 20–300 µm) or the total viability (areas of the size range: 0–300 µm) using the following Equation (2):
V i a = A g r e e n A g r e e n + A r e d 100

2.8. Determination of Growth Rate and Expansion Factor

The size of the viable spheroids was used to determine the volume growth rate µVol of the spheroids. We assumed that the spherical volume of the spheroids increases due to the exponential cell growth within the spheroids, and that the cells are constant in volume. This leads to the correlation shown in Equation (3):
µ V o l = ln ( V S p h , 2 ) ln ( V S p h , 1 ) t 2 t 1
where VSph corresponds to the spheroid volume at time point t.
The resulting volume doubling time tD,Vol can be calculated as shown in Equation (4):
t D , V o l = l n ( 2 ) µ V o l
The volume expansion factor VEx can be expressed as shown in Equation (5):
V E x = V S p h , 2 V S p h , 1 = d S p h , 2 3 d S p h , 1 3

2.9. Assessment of β-Cell Functionality

The glucose-dependent insulin secretion of the β-cell spheroids was measured by exposing the cells to varying glucose concentrations, and measuring the secreted insulin. After sampling, three technical replicates of 500 µL were washed twice with PBS to remove the culture medium and possible insulin residues present in FBS. The cells were then incubated in 500 µL medium lacking FBS, but containing 1.1 mM glucose for 40 min at 37 °C. The supernatant was removed, centrifuged, and stored at −20 °C for analysis (sample for basal insulin secretion). We then added 500 µL of medium lacking FBS, but containing 16.7 mM glucose for 20 min at 37 °C. The supernatant was removed, centrifuged, and stored at −20 °C for analysis (sample for acute insulin secretion). The insulin in the supernatants was analyzed, using a rat insulin ELISA kit (DRG Instruments, Marburg, Germany). The samples were measured in duplicate and evaluated within the ELISA working range, using a four-parameter logistic curve.

2.10. Statistical Analysis

If not stated otherwise, all experiments were performed as three independent runs, and presented as mean value ± standard deviations (STDV). For statistical analysis, the following were applied: (1) two groups: Student’s t-test, (2) for more than two groups: a one-way ANOVA followed by a post-hoc analysis using Bonferroni correction. Intervals of significance were indicated as follows: * p < 0.05, ** p < 0.01, and *** p < 0.001.

3. Results and Discussion

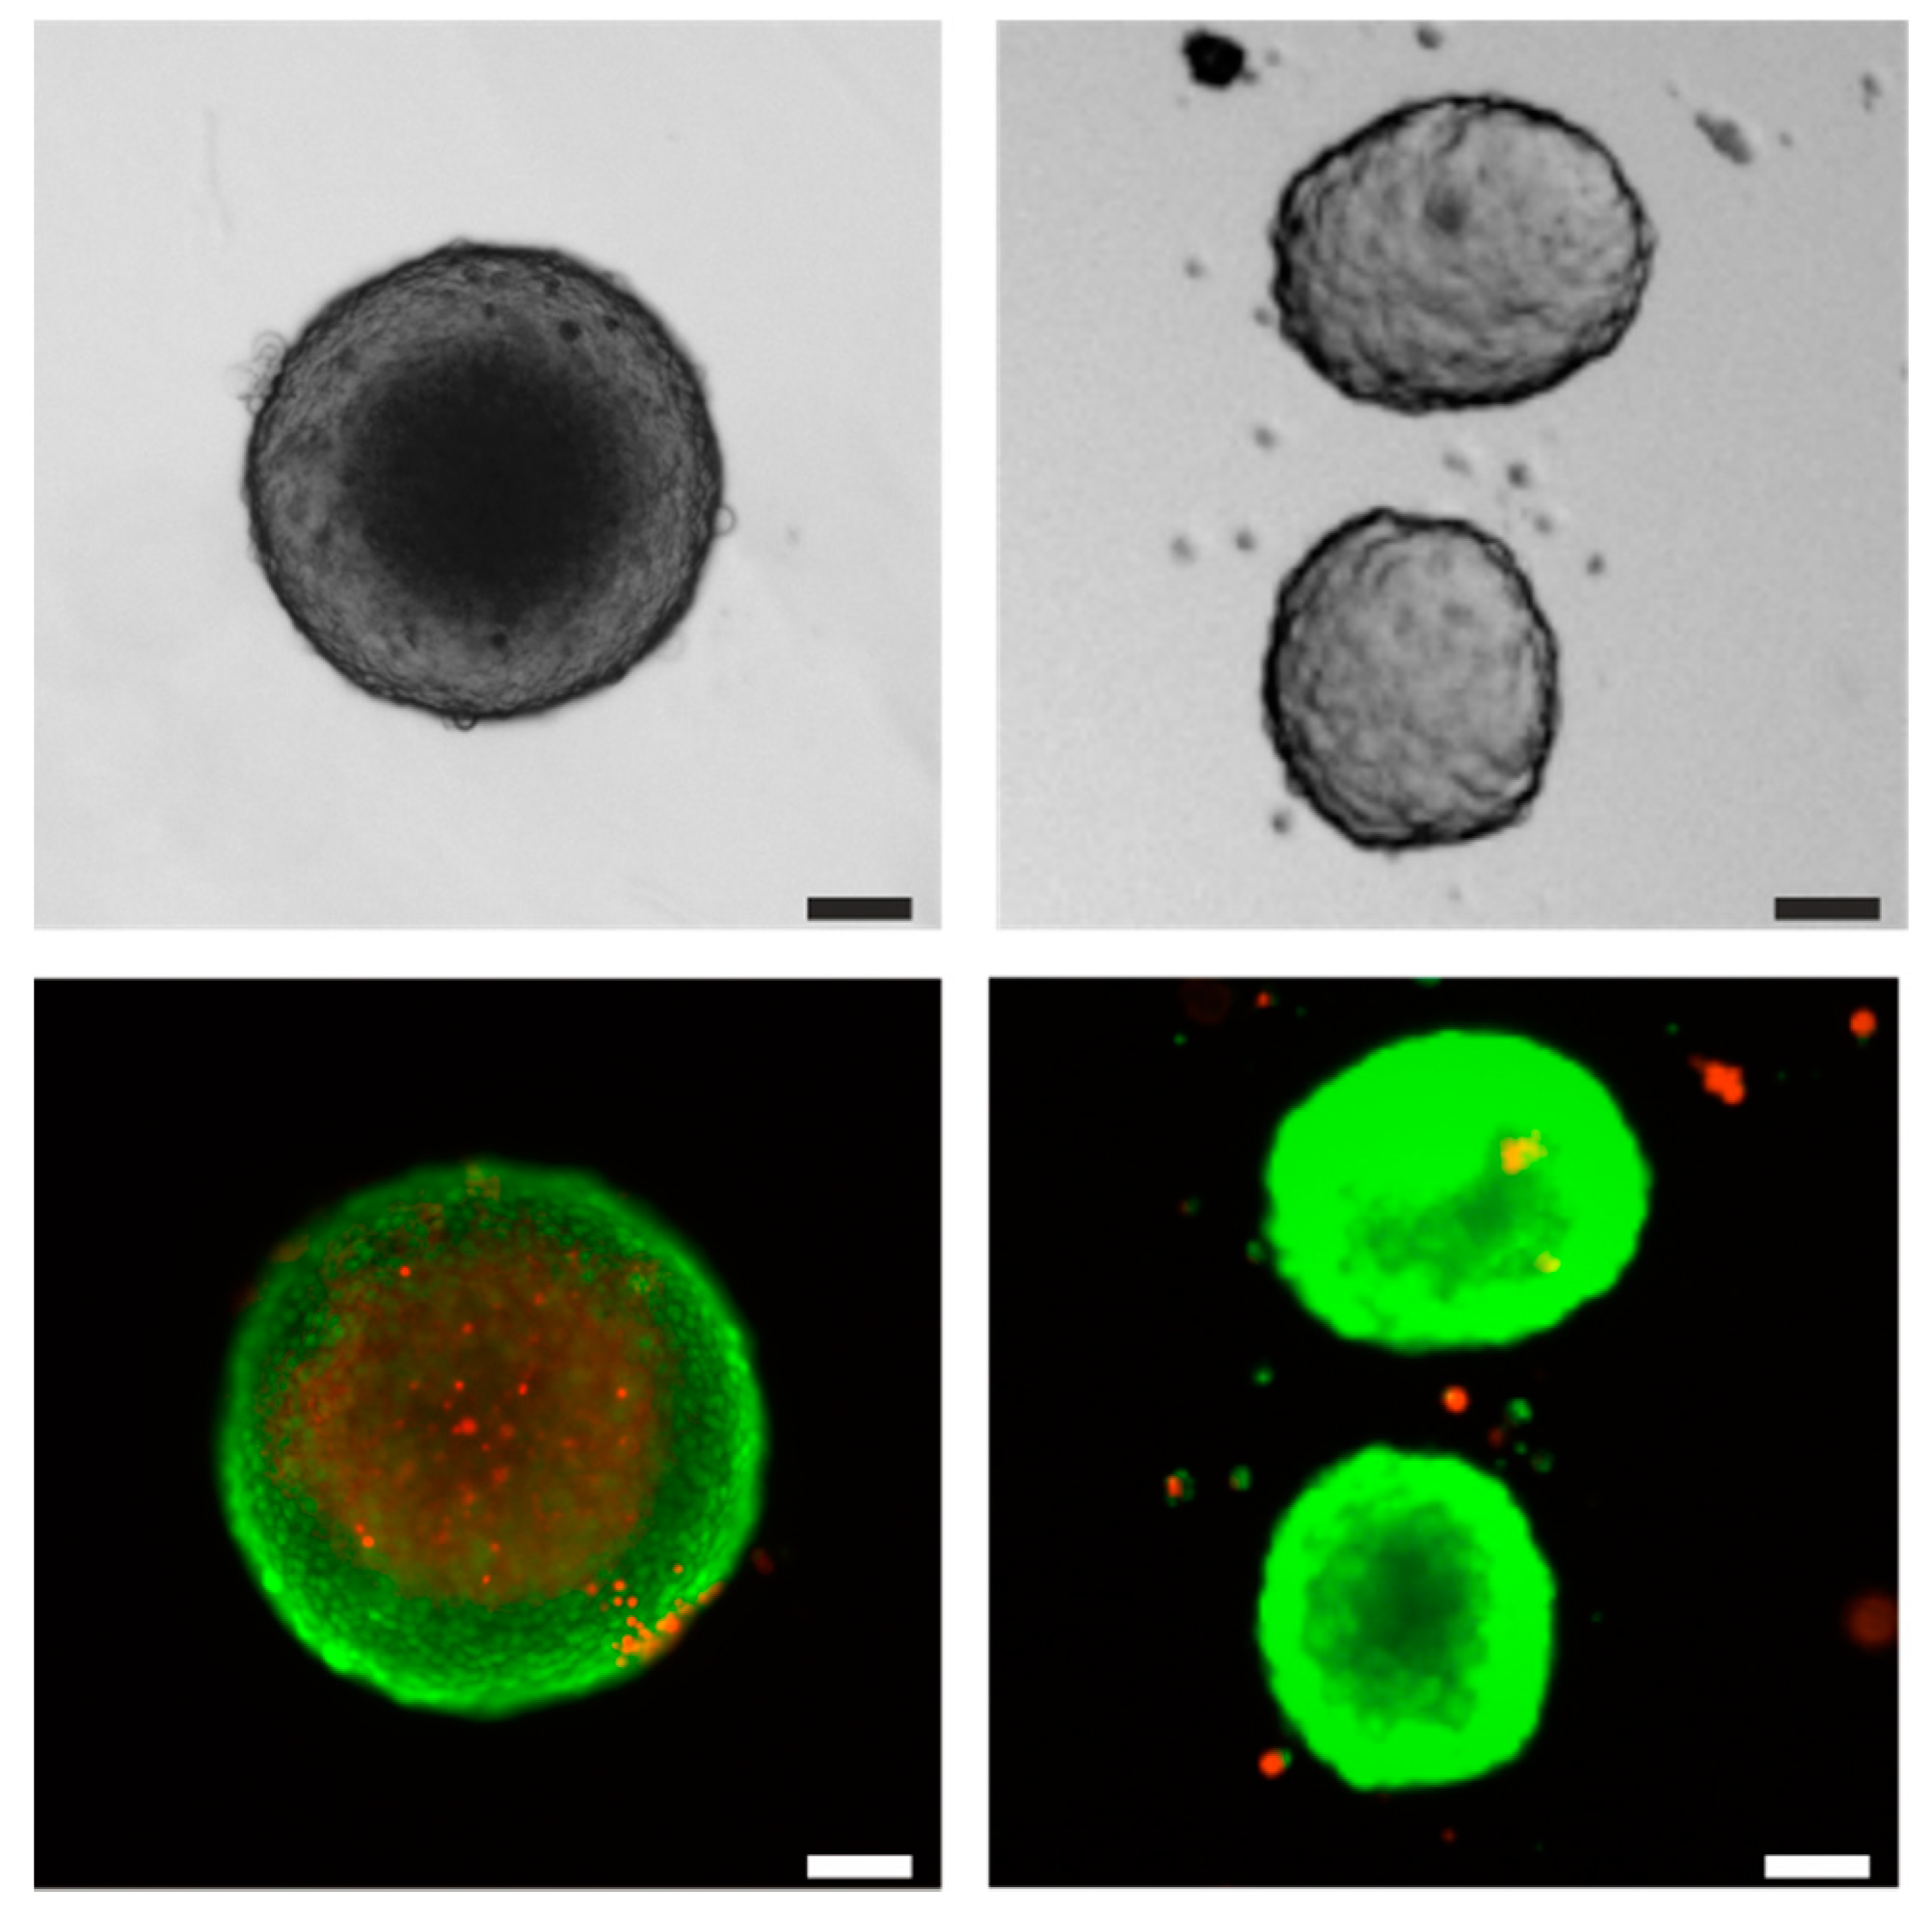
3.1. Differences in Static and Dynamic Formation of INS-1 Spheroids

To gain an initial insight into the differences of the static and the dynamic formation of spheroids, we used cell-repellent 96-well plates as a static system, and baffled shaking flasks as a simple dynamic system, compatible with established models of power consumption [36,37]. Under static conditions, we determined INS-1 agglomerates after 24 h, having 181 ± 3 µm in diameter with a circularity of 0.92 ± 0.05. Under dynamic conditions, we determined the agglomeration of INS-1 cells within 24 h, producing spheroids with a Sauter diameter d32 = 94 ± 12 µm and a circularity of 0.65 ± 0.02 (Figure 1). Dynamic and static spheroid formation occurred at similar rates, but the circularity of the static spheroids was significantly (*** p < 0.001) higher. The volume growth rate µVol of 0.14 ± 0.04 d−1 and tD,Vol = 5.0 ± 1.4 d for dynamic spheroid formation was significantly (** p < 0.01) lower than the corresponding values for static cultures (µVol = 0.327 ± 0.013 d−1, tD,Vol = 2.12 ± 0.08 d). The dynamic growth of spheroids is likely to be restricted by surface erosion, as growing cells in the outer layer are sheared off and/or collide with/adhere to suspended single cells or smaller agglomerates. Spheroids in the size range of 59–269 µm were reported to form after 7 d in shaking cultures of the β-cell line RIN-5F, while maintaining β-cell functionality [38]. The method was not characterized in detail. Based on the information provided, we assume that the cells were not limited by hydrodynamic forces, thus allowing a continuous spheroid growth. Our static spheroids developed a necrotic core and dropped to ~50% viability after 24 h due to mass transfer limitations, whereas the viability of spheroids formed in a dynamic culture was always close to 100% (except some single cells within the spheroids) regardless of their size (up to 200 µm). Similarly, agglomerates of the rodent β-cell line MIN6 were produced after 2 d in static culture dishes and spinner flasks. Although the spheroid concentration remained constant while they grew from 100 to 400 µm, a dense necrotic core formed in the static spheroids (viability ~65%), whereas those in the spinner flasks maintained ~85% viability [26]. The spheroids in the dynamic culture were also characterized by a lower lactate dehydrogenase and caspase activity, and lower detected levels of fragmented DNA, using the TUNEL assay [26].

3.2. Influence of Seeding Density on INS-1 Spheroid Formation in Shaking Flasks

Next, we investigated relevant process parameters such as seeding density, turbulence working range, and spheroid strength in shaking flasks. We tested seeding densities from 1 × 10⁴ to 1 × 10⁶ cells mL1. At values between 1 × 10⁵ and 6 × 10⁵ cells mL−1, we observed a plateau of a spheroid size with a narrow size distribution (d32 = 63 ± 5 µm) and a rapid spheroid formation (within 24 h) and, therefore, defined 1 × 10⁵ to 6 × 10⁵ cells mL−1 as our working range. At values below 1 × 10⁵ cells mL−1, agglomeration was inhibited (d32 = 29 ± 7 µm, ** p < 0.01), whereas values above 6 × 10⁵ cells mL−1 generated larger spheroids (d32 = 82 ± 3 µm, ** p < 0.01) due to further visible agglomeration of the spheroids themselves. The seeding density is not only important for a dynamic spheroid formation, but also affects the functionality of the β-cells, which is dependent on the cell number in each spheroid. For example, when spinner flasks were used to form spheroids from primary neonatal porcine pancreatic islet cells at different seeding densities, low values (6.3 × 10³ and 5 × 10⁴ cells mL1) reduced the number of aggregates, whereas the highest value (1.3 × 10⁵ cells mL1) increased the number of islet-like aggregates containing insulin-positive cells [25]. The positive effect reflected the increase in cell–cell interactions at higher seeding densities. Our chosen working range also matches the values reported for other cell types that grow as spheroids (Table 1), including iPSCs [39,40]. We therefore carried out all subsequent experiments with a seeding density of 5 × 10⁵ cells mL−1.

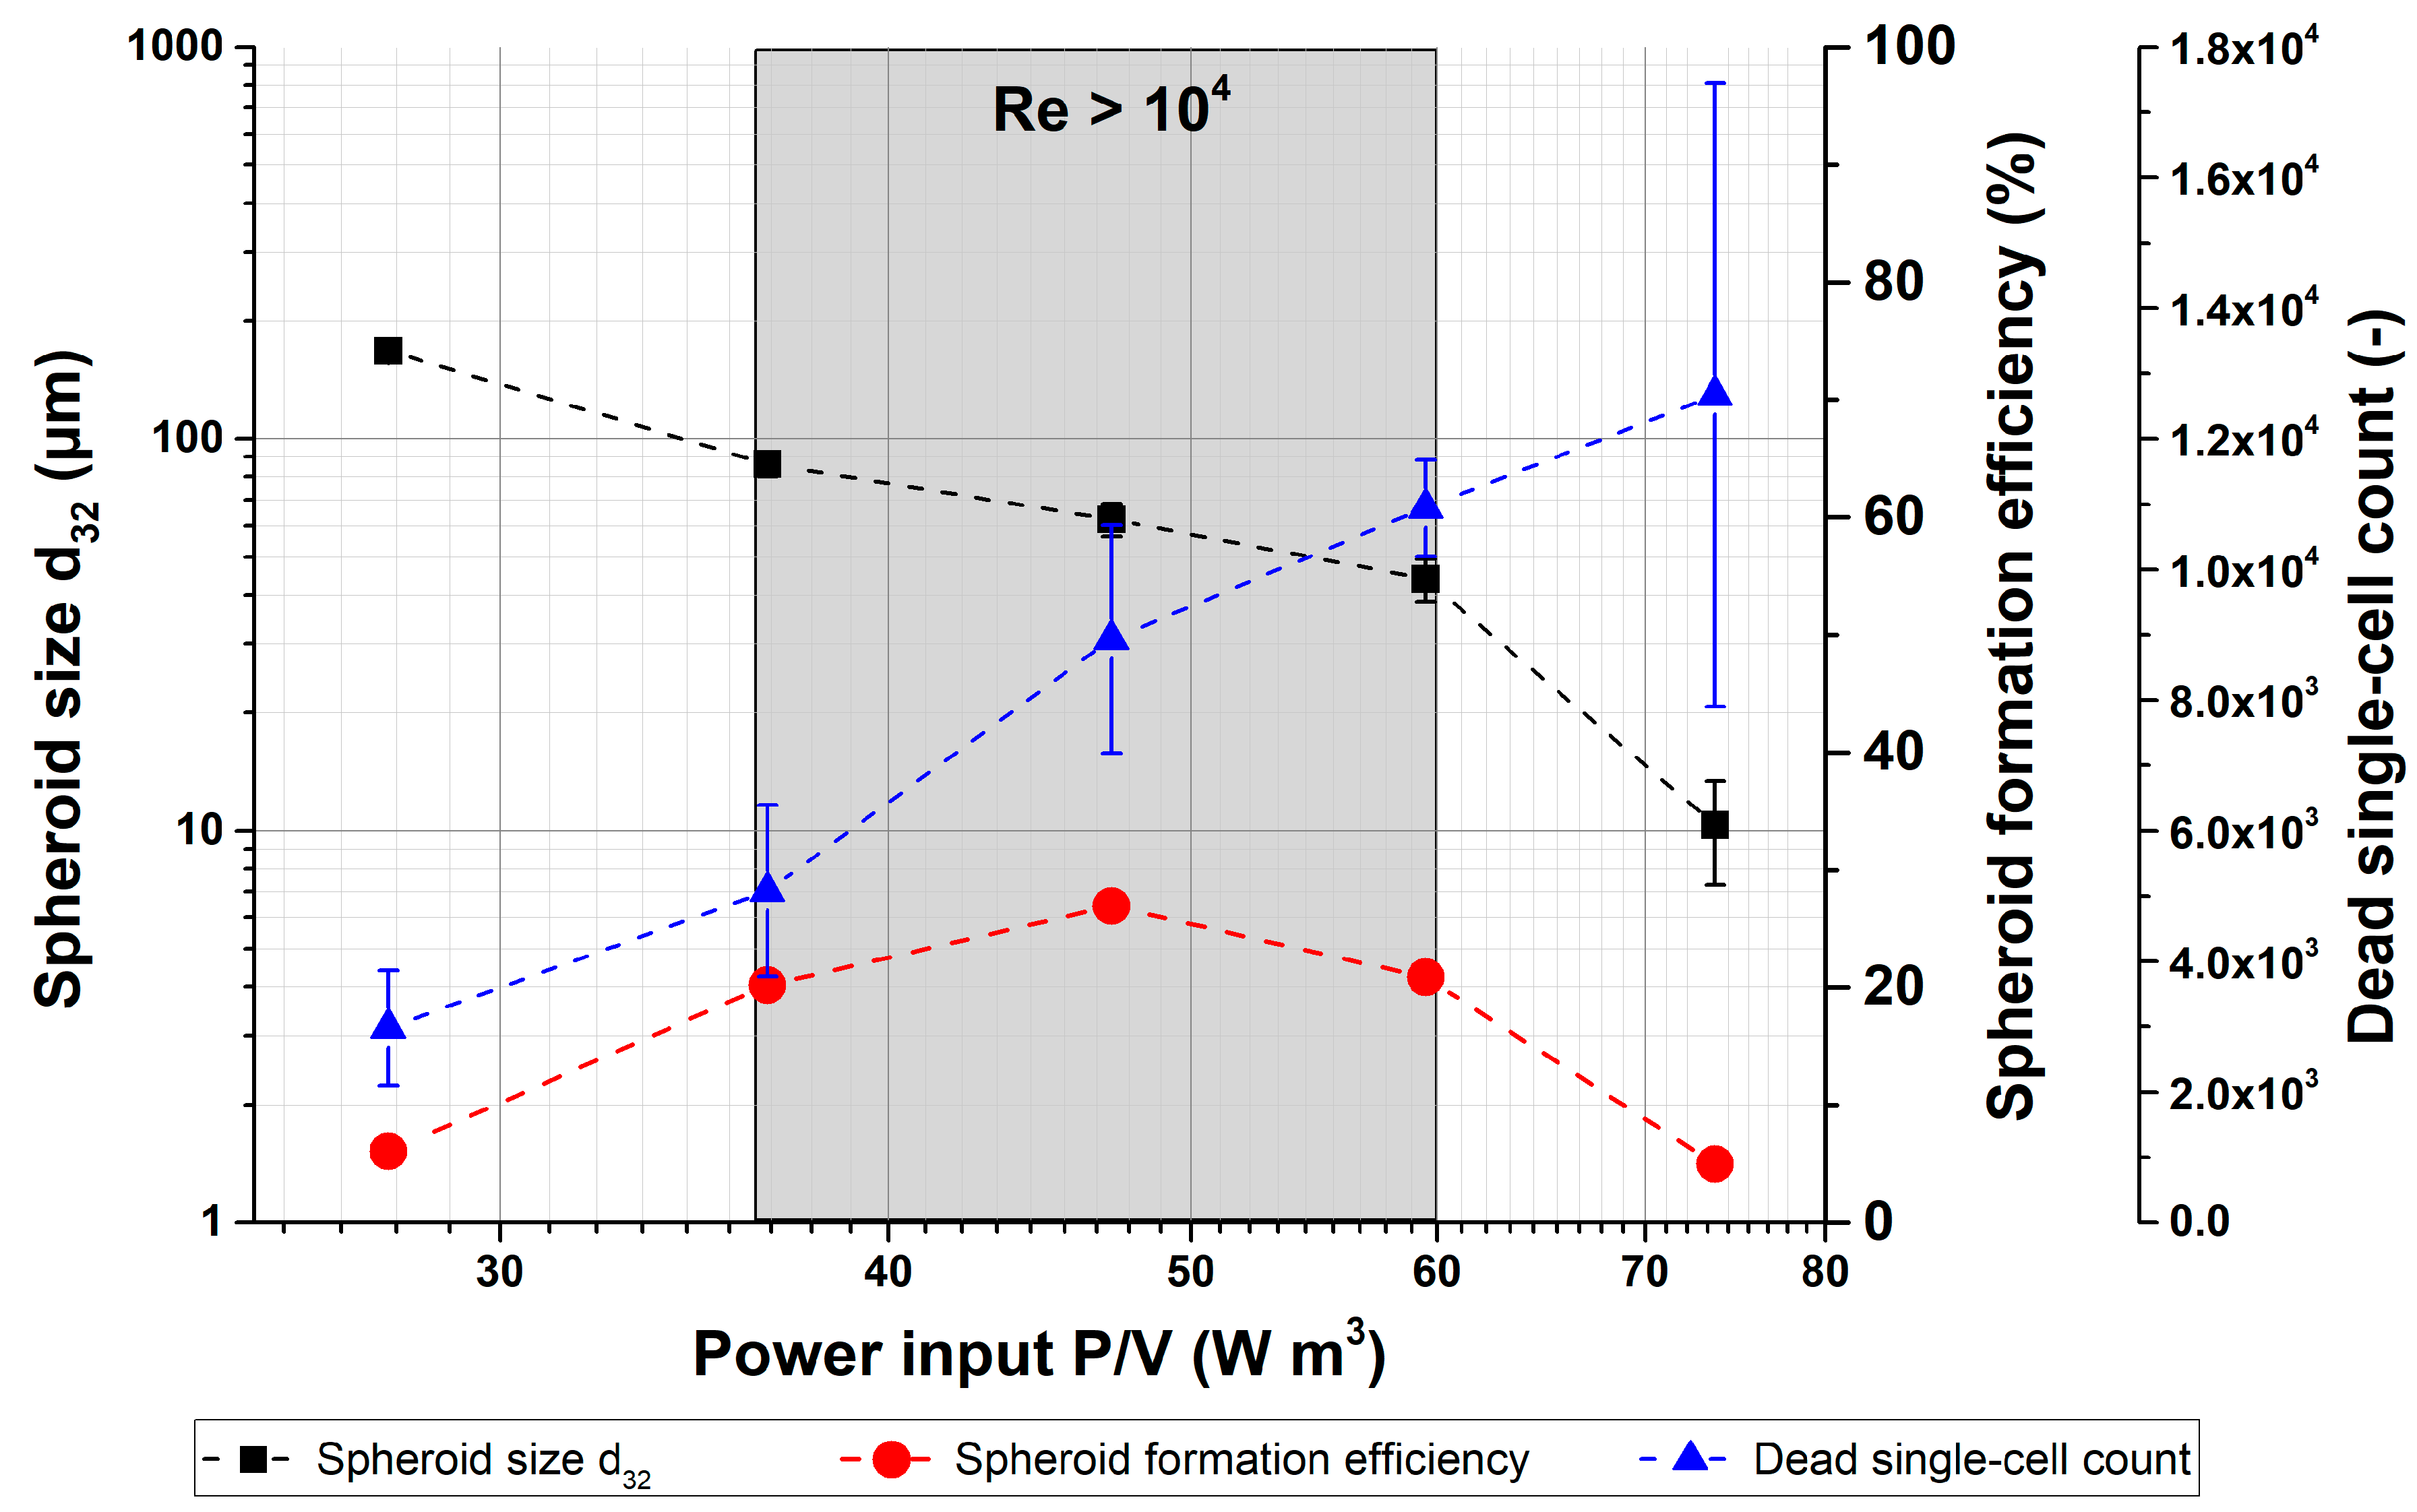
3.3. Influence of Power Input on INS-1 Spheroid Formation in Shaking Flasks

The development of a turbulent flow regime is necessary for the scale-up of the INS-1 spheroid formation process in a STR. Based on earlier models [36,37], we calculated a Reynolds number of Re = 104 (fully developed turbulence) in the shaking flasks at a frequency of 100 rpm. We investigated the spheroid formation at shaking frequencies in the range between 90–130 rpm, and correlated the spheroid size to the power input. We observed a linear decrease in the spheroid size between 100–120 rpm (corresponding to 35–60 W m−3), combined with a narrow span width of the spheroid distribution of 85 ± 28 µm, where we anticipated the turbulent flow regime. Spheroids produced with an increased power input (and thereby increasing hydrodynamic forces) showed the anticipated and significant (** p < 0.01) decrease in size from d32 = 86 ± 6 µm at 100 rpm to d32 = 44 ± 5 µm at 120 rpm (Figure 2). An increasing stirrer speed also reduced the size of hPSCs spheroids [34] and, similar to our results, the viability of the spheroids remained high, although increasing shear forces led to a surface erosion and the loss of cells from the spheroid surface. Therefore, we determined an increasing amount of dead single cells with an increasing power input (35–60 W m−3). In relation to 100 rpm, spheroids produced under non-turbulent conditions (90 rpm, 28 W m−3) were twice as large on average (d32 = 168 ± 4 µm, ** p < 0.01) and were distributed over a broader size range (span width: 232 ± 24 µm), whereas no spheroids were formed at 130 rpm (=74 W m−3) and the size distribution represented the profile of a single-cell suspension (d32 = 10 ± 3 µm, ** p < 0.01). Moreover, the efficiency of spheroid formation, represented as the number of formed spheroids in relation to the total cell number (Figure 2), fell to low values of 6% and 5% at 90 and 130 rpm, respectively. Within the turbulent range (100–120 rpm), the spheroid formation efficiency increased to 27% (110 rpm). These data agreed with the spheroid formation theory discussed in the supplementary, which we adapted from particle systems such as clay, latex, and glass [41,42,43,44,45,46]. Based on the ratio dSph/λ, we concluded that the INS-1 spheroid formation process reached a steady-state diameter that reflected the shear forces of the corresponding eddies acting on the spheroid surface. This assumption is supported by the decreasing spheroid size as the power input increases. The spheroid size is, therefore, limited by the Kolmogorov eddy size, which can also be described as the equilibrium between kinetic energy in the culture medium and the bonding energy of the spheroids.

3.4. Determination of INS-1 Spheroid Strength in Shaking Flasks

The spheroid strength is an essential parameter in our process, so we estimated the value in shaking flask experiments. The spheroid strength is influenced by the strength and number of bonds (Fad) between cells, the size and shape of the cells, and the compaction of the spheroid. The particle analysis and wastewater treatment literature provide multiple approaches to determine spheroid strength [41,44,47,48], which we adapted for the INS-1 spheroids. These methods are based on the relationship between the power input/energy dissipation and the corresponding floc/spheroid diameter, thus distinguishing between agglomerate splitting by tensile forces, and surface erosion due to shear forces. However, we are aware that the agglomeration of non-biological particle systems is enabled by polymers or electrostatic interactions, whereas the agglomeration of cells is also based on the interaction between surface proteins (such as integrins and cadherins) on adjacent cells [49]. This is a highly variable precondition for different cell types and even for the same cell type, because the expression of surface proteins on cells can change during growth, senescence, and differentiation, and can be influenced by cultivation and harvesting methods.
Because there is no standardized procedure to evaluate spheroid strength, we produced spheroids within the turbulent working range under increasing power input, and correlated the steady-state spheroid size (after 24 h) with energy dissipation (Figure 2). We applied the following method [41,50] to describe the steady-state diameter d using Equation (6):
d = C A g g · G γ
where CAgg is the strength of the agglomerate (here, spheroid strength), γ is the stable agglomerate size exponent, and the shear rate G is defined using Equation (7):
G = ϵ ϑ L
We calculated for the exponent γ a value of 2.8 (R2 = 0.99) over the linear region of the equation. The exponent γ provides insight into the agglomeration behavior of the INS-1 spheroids: γ values of ~0.5 indicate fragmentation by tensile forces, whereas γ > 2 suggests surface erosion [50]. This fits to our data shown above that the increasing amount of dead single cells with increasing power input (35–60 W m−3) is the result of surface erosion and the loss of cells from the spheroid surface.
We finally calculated a strength of 325 ± 5 N m2 for the INS-1 spheroids. Our spheroid strength was similar in magnitude to monolayer cells interacting with planar surfaces. Here, the cells also attached to the surface via surface proteins such as integrins, and the sum of Fad corresponded to the attachment strength. A single fibroblast displaying ~2 × 10⁵ integrins on its surface, required a force of 400 N m2 to detach the cell from the surface [51]. Notably, the spheroid strength we calculated was only valid for the first 24 h, and probably increased during cultivation due to the buildup of ECM components, and the rearrangement of cells led to spheroid compaction. The spheroid strength we determined was also only valid for the INS-1 under our specific experimental set-up, as the spheroid strength is highly dependent on the cell type and culture conditions. For example, we observed completely different spheroid strengths when comparing β-cells cultivated in a serum-free and in a serum-supplemented medium.

3.5. INS-1 Spheroid Formation in a Stirred-Tank Bioreactor Using Different Stirrer Types

Our investigations in shaking flasks served as a basis for the 1 L scale production of INS-1 spheroids in a fully controlled and monitored STR. We therefore chose the power input/mean energy dissipation from the shaking flask experiments (35 W m−3), where we achieved a good INS-1 spheroid formation and kept that value constant in the STR process. We then investigated the influence of three different stirrer types. Each stirrer has a specific power number NP that reflects the momentum of resistance, and, therefore, the reinforcement of the power input into the culture medium. Although higher NP values are often associated with greater particle stress, several investigations have shown that the same power input for an axial flow stirrer with a lower NP can cause more particle disintegration [52,53,54,55]. This may reflect the so-called energy dissipation circulation function (EDCF), which describes the particle stress in relation to the particle residence time and frequency within the stirrer-swept volume VS, where the greatest particle stress occurs. Logically, axial pumping stirrers with low NP values must increase the stirrer frequency to achieve the same power input, and this increases particle stress. Furthermore, the trailing vortex behind the stirrer blade is the region with εmax, and is thus responsible for the destructive effects [54]. To investigate these effects, we selected three different stirrer types, varying in NP and VS, based on axial, axial/radial and radial pumping orders (Table S1).
We ran each stirrer type with the same power input/mean energy dissipation. After 24 h, we recorded values of d32 = 94 ± 12 µm for the shaking flask (reference) cultures, d32 = 51.5 ± 1.2 µm for the 30°-3-SPB stirrer, d32 = 40 ± 3 µm for the 45°-3-SPB stirrer, and d32 = 50.6 ± 1.6 µm for the Rushton turbine (Table 2). The spheroid size was significantly (*** p < 0.001) decreased in the STR, while the 30°-3-SPB and Rushton turbine produced a similar spheroid size. Spheroids generated with the 45°-3-SPB were significantly (* p < 0.05) smaller. Although shaking flasks achieve a homogenous energy dissipation, whereas energy dissipation in the STR is heterogeneous due to the power input of the centrally-installed stirrer, the higher value for d32 and the larger span width of the size distribution (Table 2) may reflect the manual manufacturing process and variations in shaking flask geometry. Although we aimed to transfer the energy dissipation from the shaking flasks to the STR to reproduce the results of the shaking flask experiments, we anticipated differences in the steady-state size of the spheroids after 24 h. It was challenging to measure the power input in baffled shaking flasks due to variations in shape, size, and number of baffles, hence the corresponding models may overestimate the energy dissipation. The overestimation of hydrodynamic forces was supported by the significantly (*** p < 0.001) larger d32 and a lower and decreasing single-cell count, given there is less stress on the spheroid surface. Furthermore, there were substantial differences in power input between the shaking flasks and STR. The power input in shaking flasks was reinforced by friction between the culture medium and the vessel wall, and the redirection of the tangential flow into radial flow by the baffles, whereas the power input in STRs was generated by the stirrer. Even so, we found that shaking flasks were suitable for preliminary experiments to guide the manufacture of spheroids, if turbulent conditions were used to generate homogenous stress.
The three stirrer types are compared in Figure 3, which shows the counts for single cells (0–20 µm) and spheroids, in addition to the spheroid size distribution as box plots. The desirable outcome would be low single-cell counts and a high spheroid count, while maintaining a narrow spheroid size distribution. The 30°-3-SPB stirrer achieved a continuous low single-cell count (maximum 60,000 cells mL−1), indicating that most of the cells formed spheroids, which is also reflected by the high spheroid formation efficiency of 60 ± 3% after 1 d (Table 2). The increasing d32, while maintaining a narrow span width of the distribution of 66 ± 7 µm on day 1 to 100 ± 6 µm on day 4, confirmed efficient spheroid growth with low surface erosion, and therefore, few single cells in suspension. In contrast, the 45°-3-SPB stirrer was associated with a high single-cell count (up to 150,000 cells mL−1) throughout the cultivation period, while maintaining a similar span width from 51 ± 5 µm on day 1 to 79 ± 21 µm on day 4. The low spheroid formation efficiency of ~10% and the high single-cell count indicated destructive hydrodynamic forces. The Rushton turbine performance was midway between the other stirrers. The highest d32 was achieved after 24 h, and the hydrodynamic forces prevented further spheroid growth and even reduced the spheroid size while increasing the single-cell count. The span width of the spheroid distribution ranged from 61 ± 2 µm on day 1 to 88 ± 3 µm on day 4. The spheroid formation efficiency was ~35%. Although the increased single-cell count suggested a negative effect, it was a consequence of the surface erosion, and this confirmed our adapted model showing that spheroid formation and size are restricted by surface erosion, as reported for other particles [41]. Although we observed increasing single-cell counts for all three stirrers over time, spheroid growth was not limited in the STR with the 30°-3-SPB stirrer. The overall low single-cell count and high agglomeration efficiency of 60% indicate that the stress caused by hydrodynamic forces was acceptable with this device, in contrast to the size-limiting surface erosion resulting in higher single-cell counts with the 45°-3-SPB stirrer and Rushton turbine.
Given the power numbers NP of the three stirrers, our results support the statement that low NP values (30°-3-SPB) cause less particle stress and encourage spheroid growth, whereas high NP values (Rushton) produce smaller spheroids. This was also confirmed by the higher EDCF of the Rushton turbine (1.6 kW m−3 s−1), compared with the lower value for the 30°-3-SPB stirrer (0.9 kW m−3 s−1). The 45°-3-SPB stirrer had the lowest EDCF (0.6 kW m−3 s−1), reflecting the 33% increase in vs. and, thus, the lowest stirrer frequency (Table S1). Although the stirrer tip speed is often used to describe the hydrodynamic forces during cell cultivation, in our case the stirrer tip speed provided an insufficient correlation. Whereas the Rushton turbine tip speed was 0.46 m s−1, that of the 30°-3-SPB stirrer was 26% higher (0.62 m s−1) and should have generated higher shear forces, which disagrees with our observations (Table 2). The 30°-3-SPB stirrer showed a slightly lower εmax/ ε ¯ ratio of 5 (assuming a more homogenous energy dissipation in the STR) than the 45°-3-SPB stirrer with a value of 6 (Table 2), which may help to explain the latter’s poor performance, although this was nevertheless unexpected. An evaluation of multiple axial flowing stirrers, used to suspend microcarriers for the expansion of anchorage-dependent cells under low shear-stress conditions, resulted in the selection of an elephant ear impeller with a similar design to our 45°-3-SPB device [57]. The large vs. was found to facilitate the establishment of a microcarrier suspension while maintaining low shear rates and collisions between microcarriers (expressed as the turbulent collision severity) compared with axial stirrers with lower vs. and smaller blades to reinforce the power input (such as pitched-blade turbines). The reduced collision rate of this stirrer type could explain the poor performance of the 45°-3-SPB. Further, the angle of the stirrer blades, which affects the suspension efficiency, may also have contributed to our observed results. The 45°-3-SPB stirrer uses different mechanisms to suspend large and fine particles [58] and this could affect the agglomeration process, hence the high single-cell count associated with this stirrer from the start of the process.

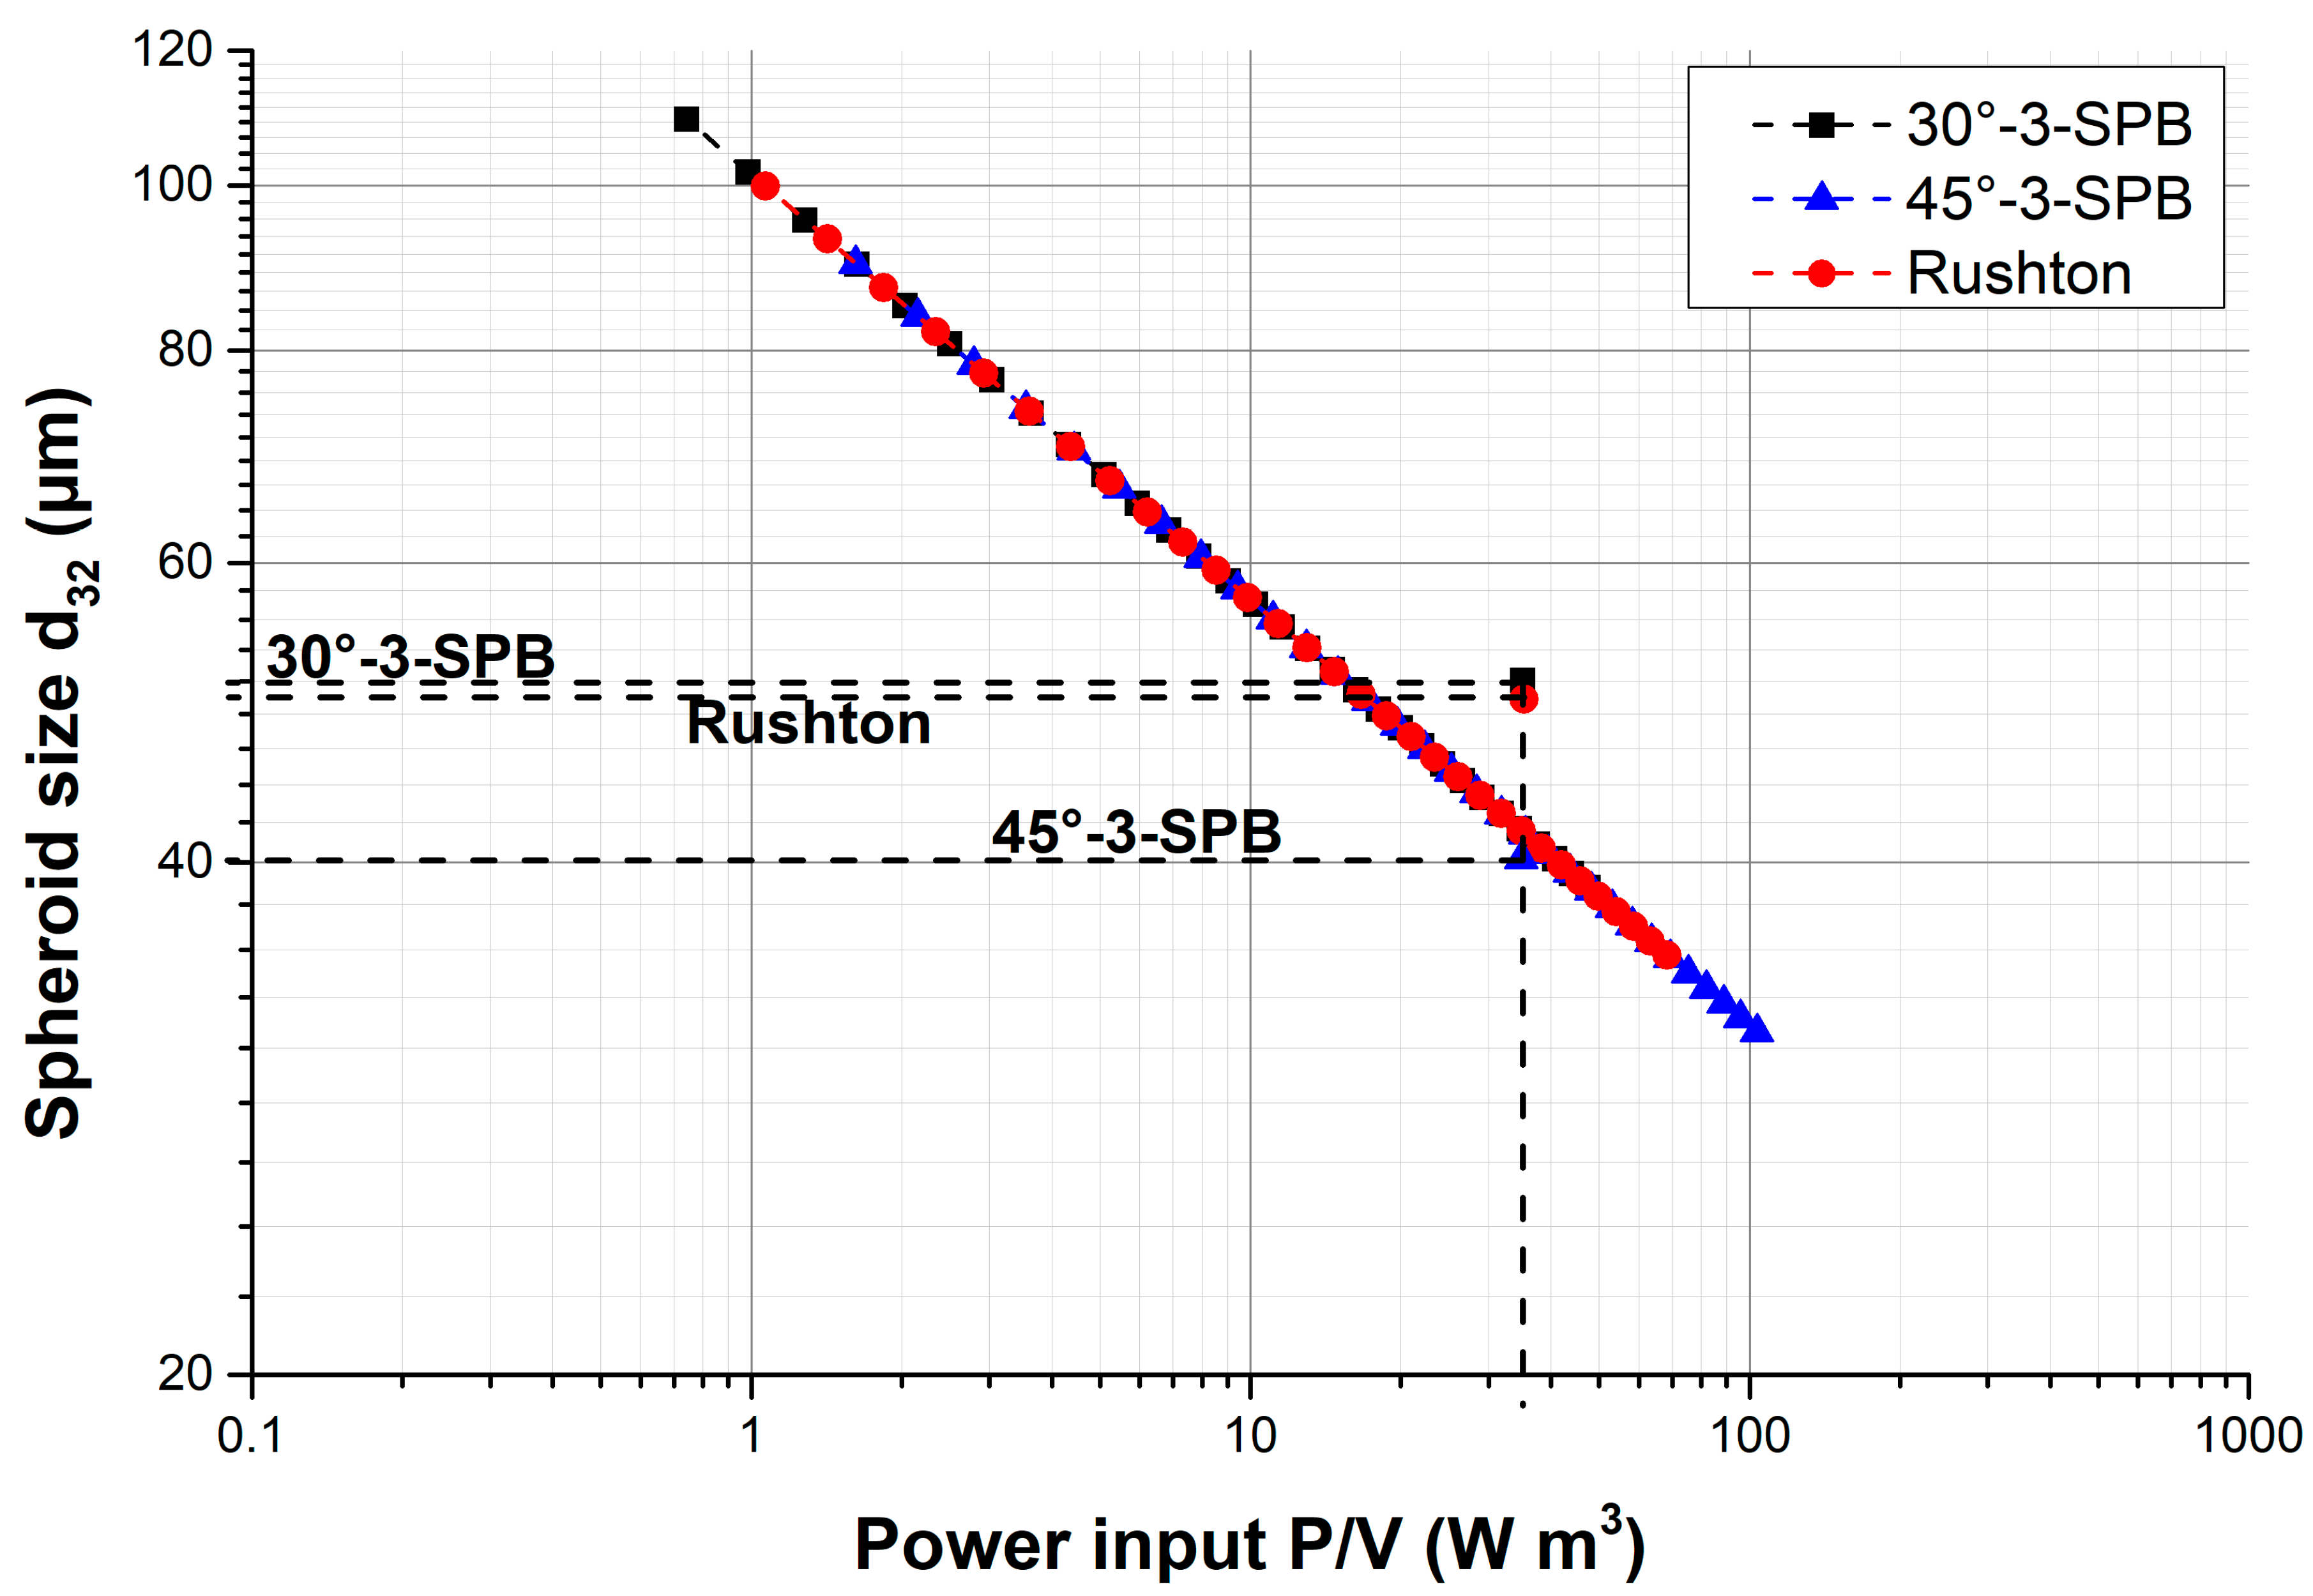
3.6. Correlation between Predicted and Measured INS-1 Spheroid Size in STR

To correlate our experimental data with our theoretical background of the spheroid formation, we calculated the spheroid size in the STR after 24 h using our determined spheroid strength CAgg (from the shaking flasks experiments) in Equation (8) [43]:
d = C A g g l · d c e l l m · ε n
where dcell is the single-cell diameter, ε is the mean energy dissipation, and the exponents are l = 0.5, m = 0 (in the case of surface erosion) and n = 0.25.
Figure 4 shows the calculated spheroid size for each stirrer type in relation to the power input. For the calculations, we assumed that the spheroid strength is constant during the initial 24-h agglomeration phase. Our calculation of the spheroid size in the STR under different power inputs resulted in a good fit for the 45°-3-SPB stirrer, but for the 30°-3-SPB stirrer and Rushton turbine our calculation was off by ~10 µm. This deviation may reflect the different stirrer designs, because the 30°-3-SPB and the Rushton devices showed a similar behavior in terms of particle distribution (reduced single-cell count and higher spheroid formation efficiency) in contrast to the 45°-3-SPB stirrer. Although macroscale eddies are directly affected by the stirrer design and setup (e.g., dS/DT and baffling), eddies in the dissipation range are dependent on the fluid viscosity. However, the design and setup of the stirrer influence the magnitude of the energy level of λ, thus the sensitivity of our model is dependent on the precise characterization and perhaps adaption of the power consumption of the STR/stirrer combination. The same applies for the determination of CAgg. Furthermore, the initial agglomeration process may differ for each stirrer type, and the 45°-3-SPB device could promote the formation of smaller, denser spheroids and, consequently, a different CAgg. Our model, therefore, requires further empirical verification and assessment for robustness. We must still verify that spheroids are really affected by surface erosion (and not by tensile forces) and that similar conditions are found in the STR, to allow precise measurement of the effect.

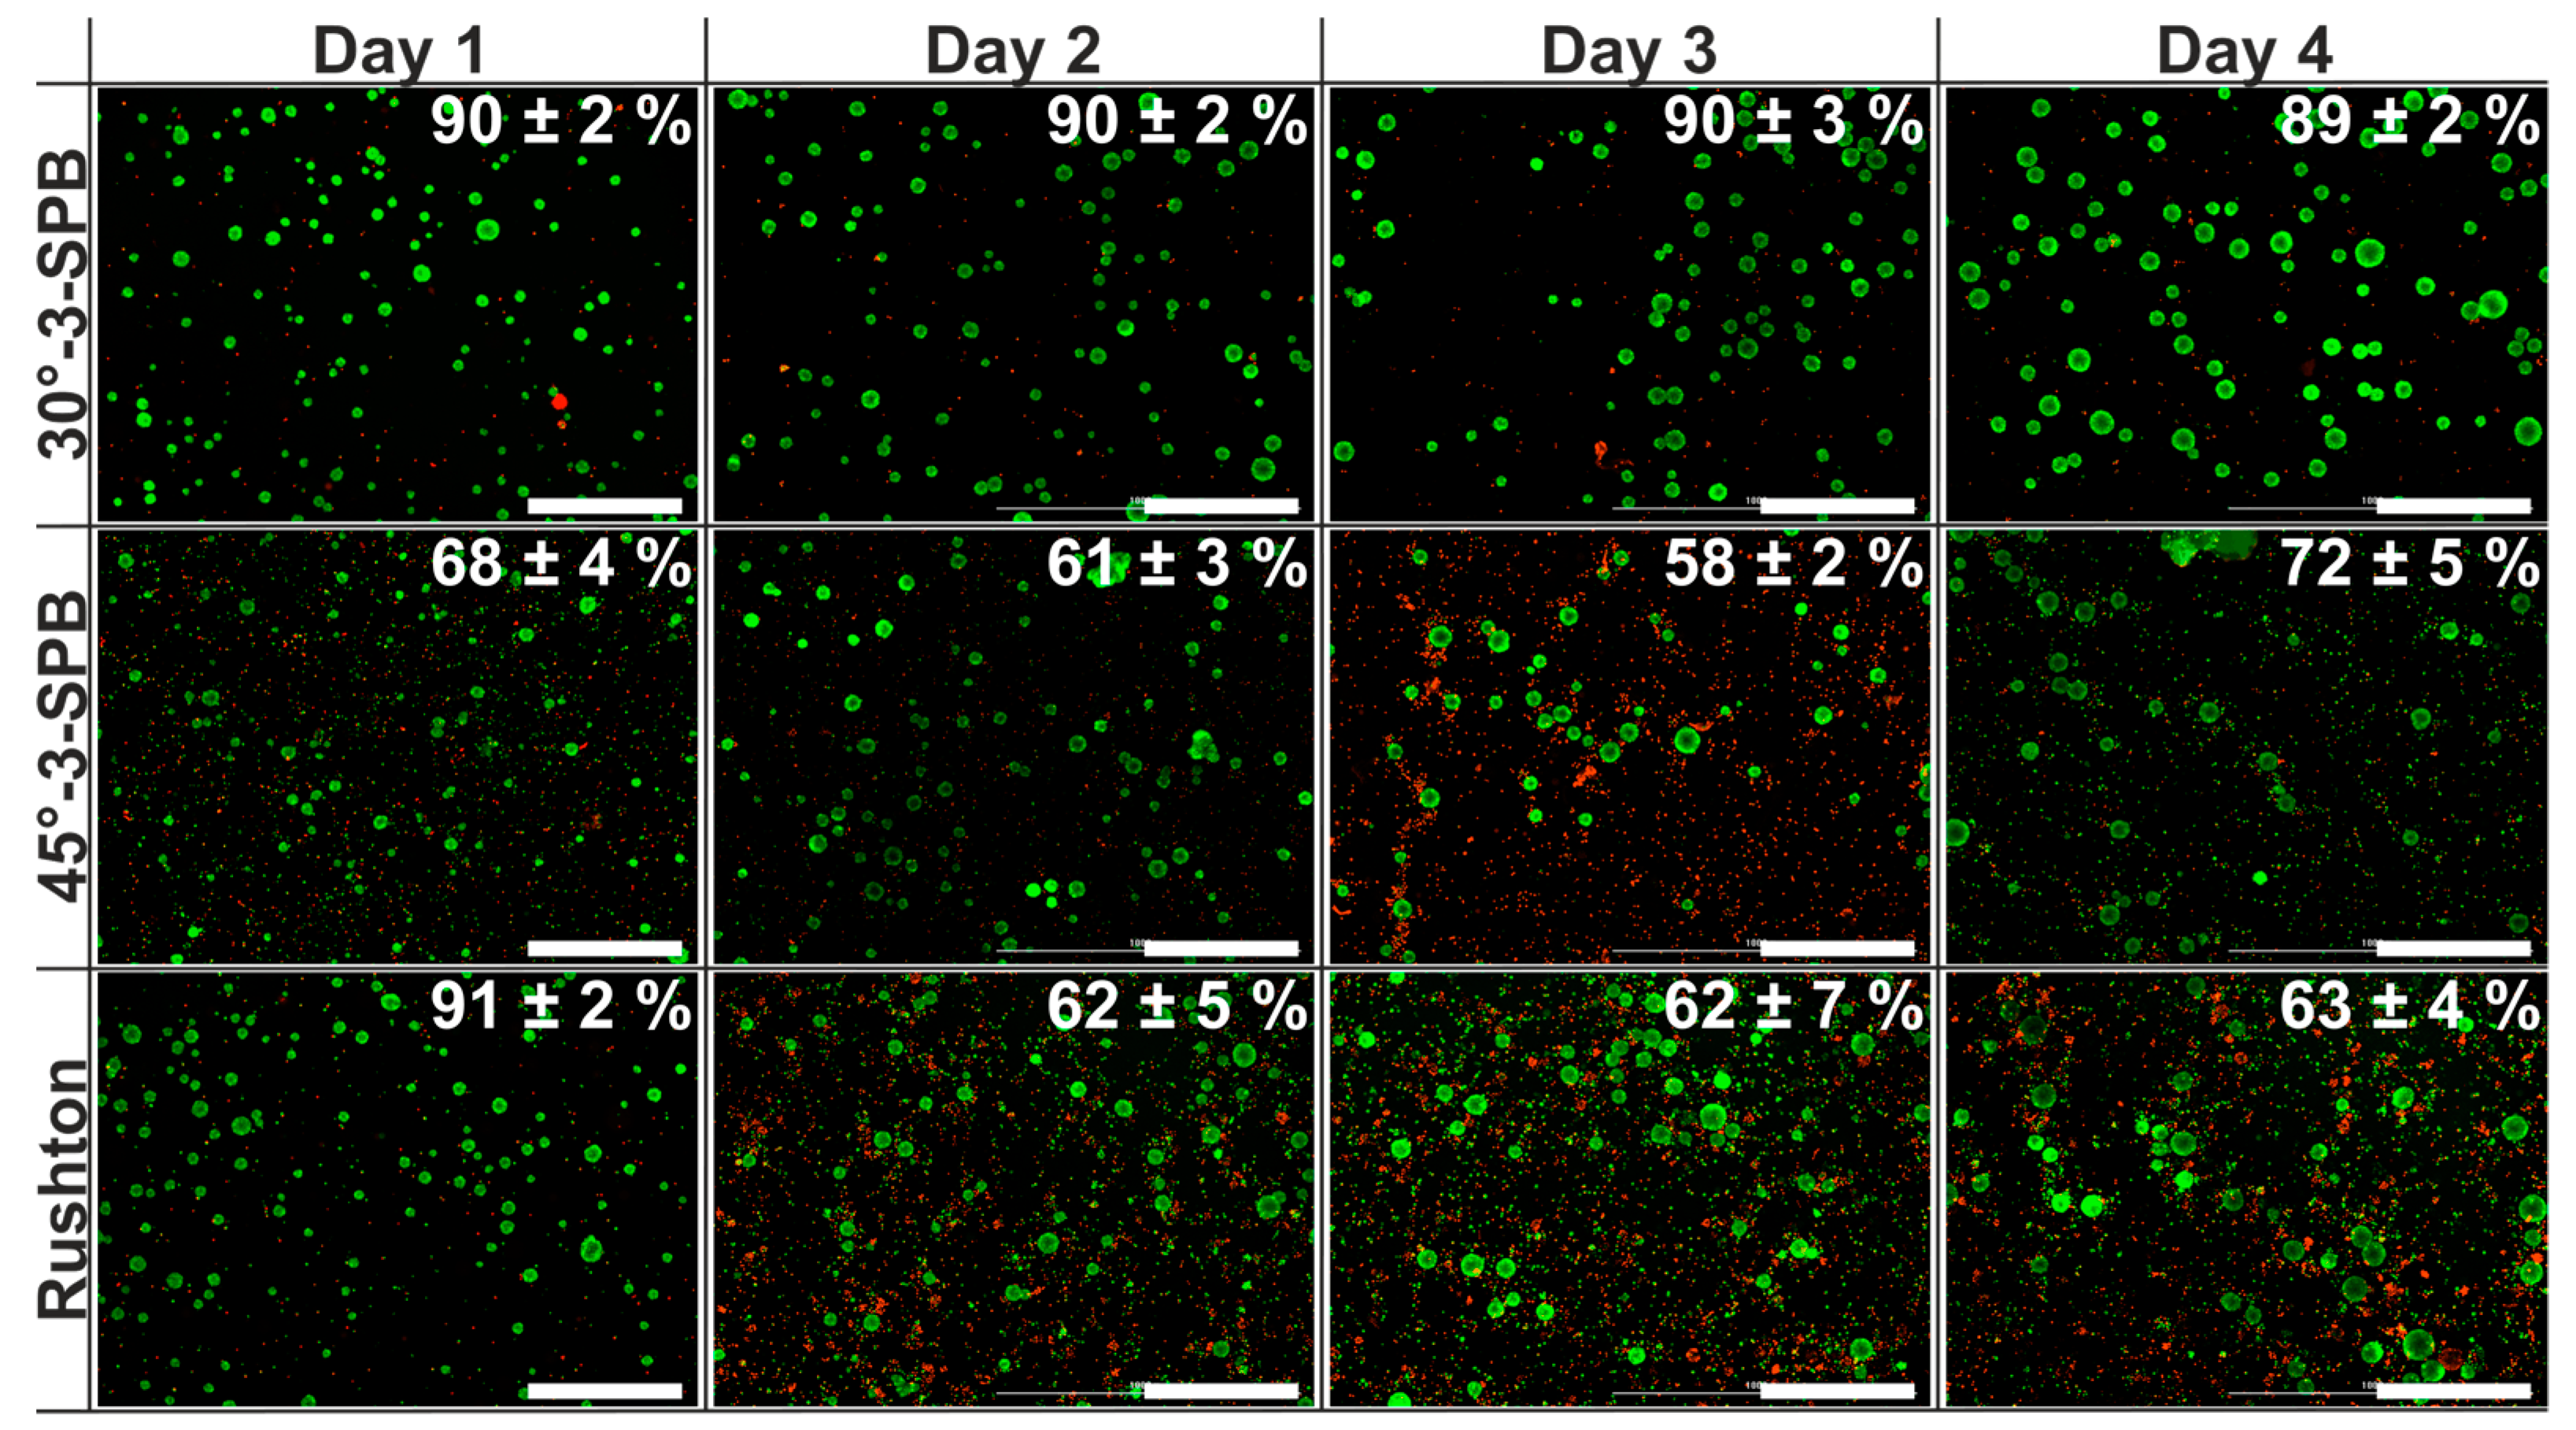
3.7. Growth and Viability of the INS-1 Spheroids Produced in the STR

The three different stirrer types resulted in the production of INS-1 spheroids, but the key objective was to produce viable and functional β-cell spheroids. We therefore evaluated the influence of each stirrer type on spheroid growth and viability for a further insight into INS-1 behavior under dynamic conditions. As described for the shaking flasks, we observed volume expansion either due to the attachment of single cells to the spheroids or cell growth within them. We calculated similar volume-based growth rates µVol and volume doubling times tD,Vol for each stirrer type: 30°-3-SPB µVol = 0.38 ± 0.018 d−1 (tD,Vol = 1.81 ± 0.09 d); 45°-3-SPB µVol= 0.4 ± 0.2 d−1 (tD,Vol = 1.9 ± 1.0 d); and Rushton µVol = 0.27 ± 0.072 d−1 (tD,Vol = 2.7 ± 0.7 d) (Table 3). The volume expansion of the spheroids depends on the culture system and the connected hydrodynamic conditions, as [59] could show that the fold expansion of hPSCs spheroids was highest in spinner flasks, compared with well plates and a ring-shaped culture vessel. Interestingly, the low fold expansion of the ring-shaped culture vessel was associated with a higher cell injury, which is attributed to increased shear forces. We hypothesize that this spheroid growth mainly reflected internal cell growth or an increase in spheroid strength due to compaction and stronger adhesion, thus, the extended buildup of an ECM. If we consider cell division within the spheroids, there should be no increase in size when one cell divides into two daughter cells, but if both daughter cells increase their volume or/and become surrounded by an extended ECM, the spheroid should expand. Other studies conclude an increase in spheroid size by cell divisions within the spheroids [26,34]. If the cells in the spheroid are protected by the ECM, the shear forces acting on the surface would need to be stronger than the force required to dislodge single cells that have adhered to the surface. Therefore, the viability and the count of single cells in the supernatant gives additional information about the performance of each stirrer type (Figure 5). The viability of the spheroids remained close to 100%, whereas we determined an accumulation of dead single cells over the cultivation period. Here, using the 30°-3-SPB stirrer, the continuous low single-cell count during the culture period was also connected to a high total viability (equaling single-cell viability and spheroid viability combined) of 90%. In contrast, high single-cell counts produced by the 45°-3-SPB were connected to low total viabilities down to 58%. In coherence with increasing single-cell counts, the Rushton turbine started with a high total viability of 91%, but revealed a reduction in total viability to 62% after day 2. In agreement with most of the dynamic cultivations, the increased mass transfer prevented the development of a necrotic spheroid core and resulted in an overall high viability of cells within the spheroids [26,33,34,59,60].
We used the STR and stirrer-associated forces to regulate the size of the INS-1 spheroids, whereas others perform the contrary by using a rotational microgravity cell culture system to minimize any mechanical forces, thereby prolonging the shelf-life of primary β-cells [28]. As we conducted our proof-of concept with a β-cell line, we must consider that islet-derived β-cells are more sensitive to environmental changes and the process conditions. Islets cultivated with simulated microgravity maintained their structural integrity, were more potent, and functional for a longer time, whereas islets under static conditions developed necrotic cores, lost their exocrine mantle, and started to disintegrate. This reflected the dependence of β-cells on a sufficient diffusive supply of nutrients to maintain their complex microenvironment and functionality. The total viability of the STR process could be maintained (30°-3-SPB) or decreased (45°-3-SPB and Rushton turbine) over time due to surface erosion, but effective mixing in the STR increased the mass transfer, maintaining the viability of the spheroids close to 100%, despite the major impact of hydrodynamic forces (Figure 5).

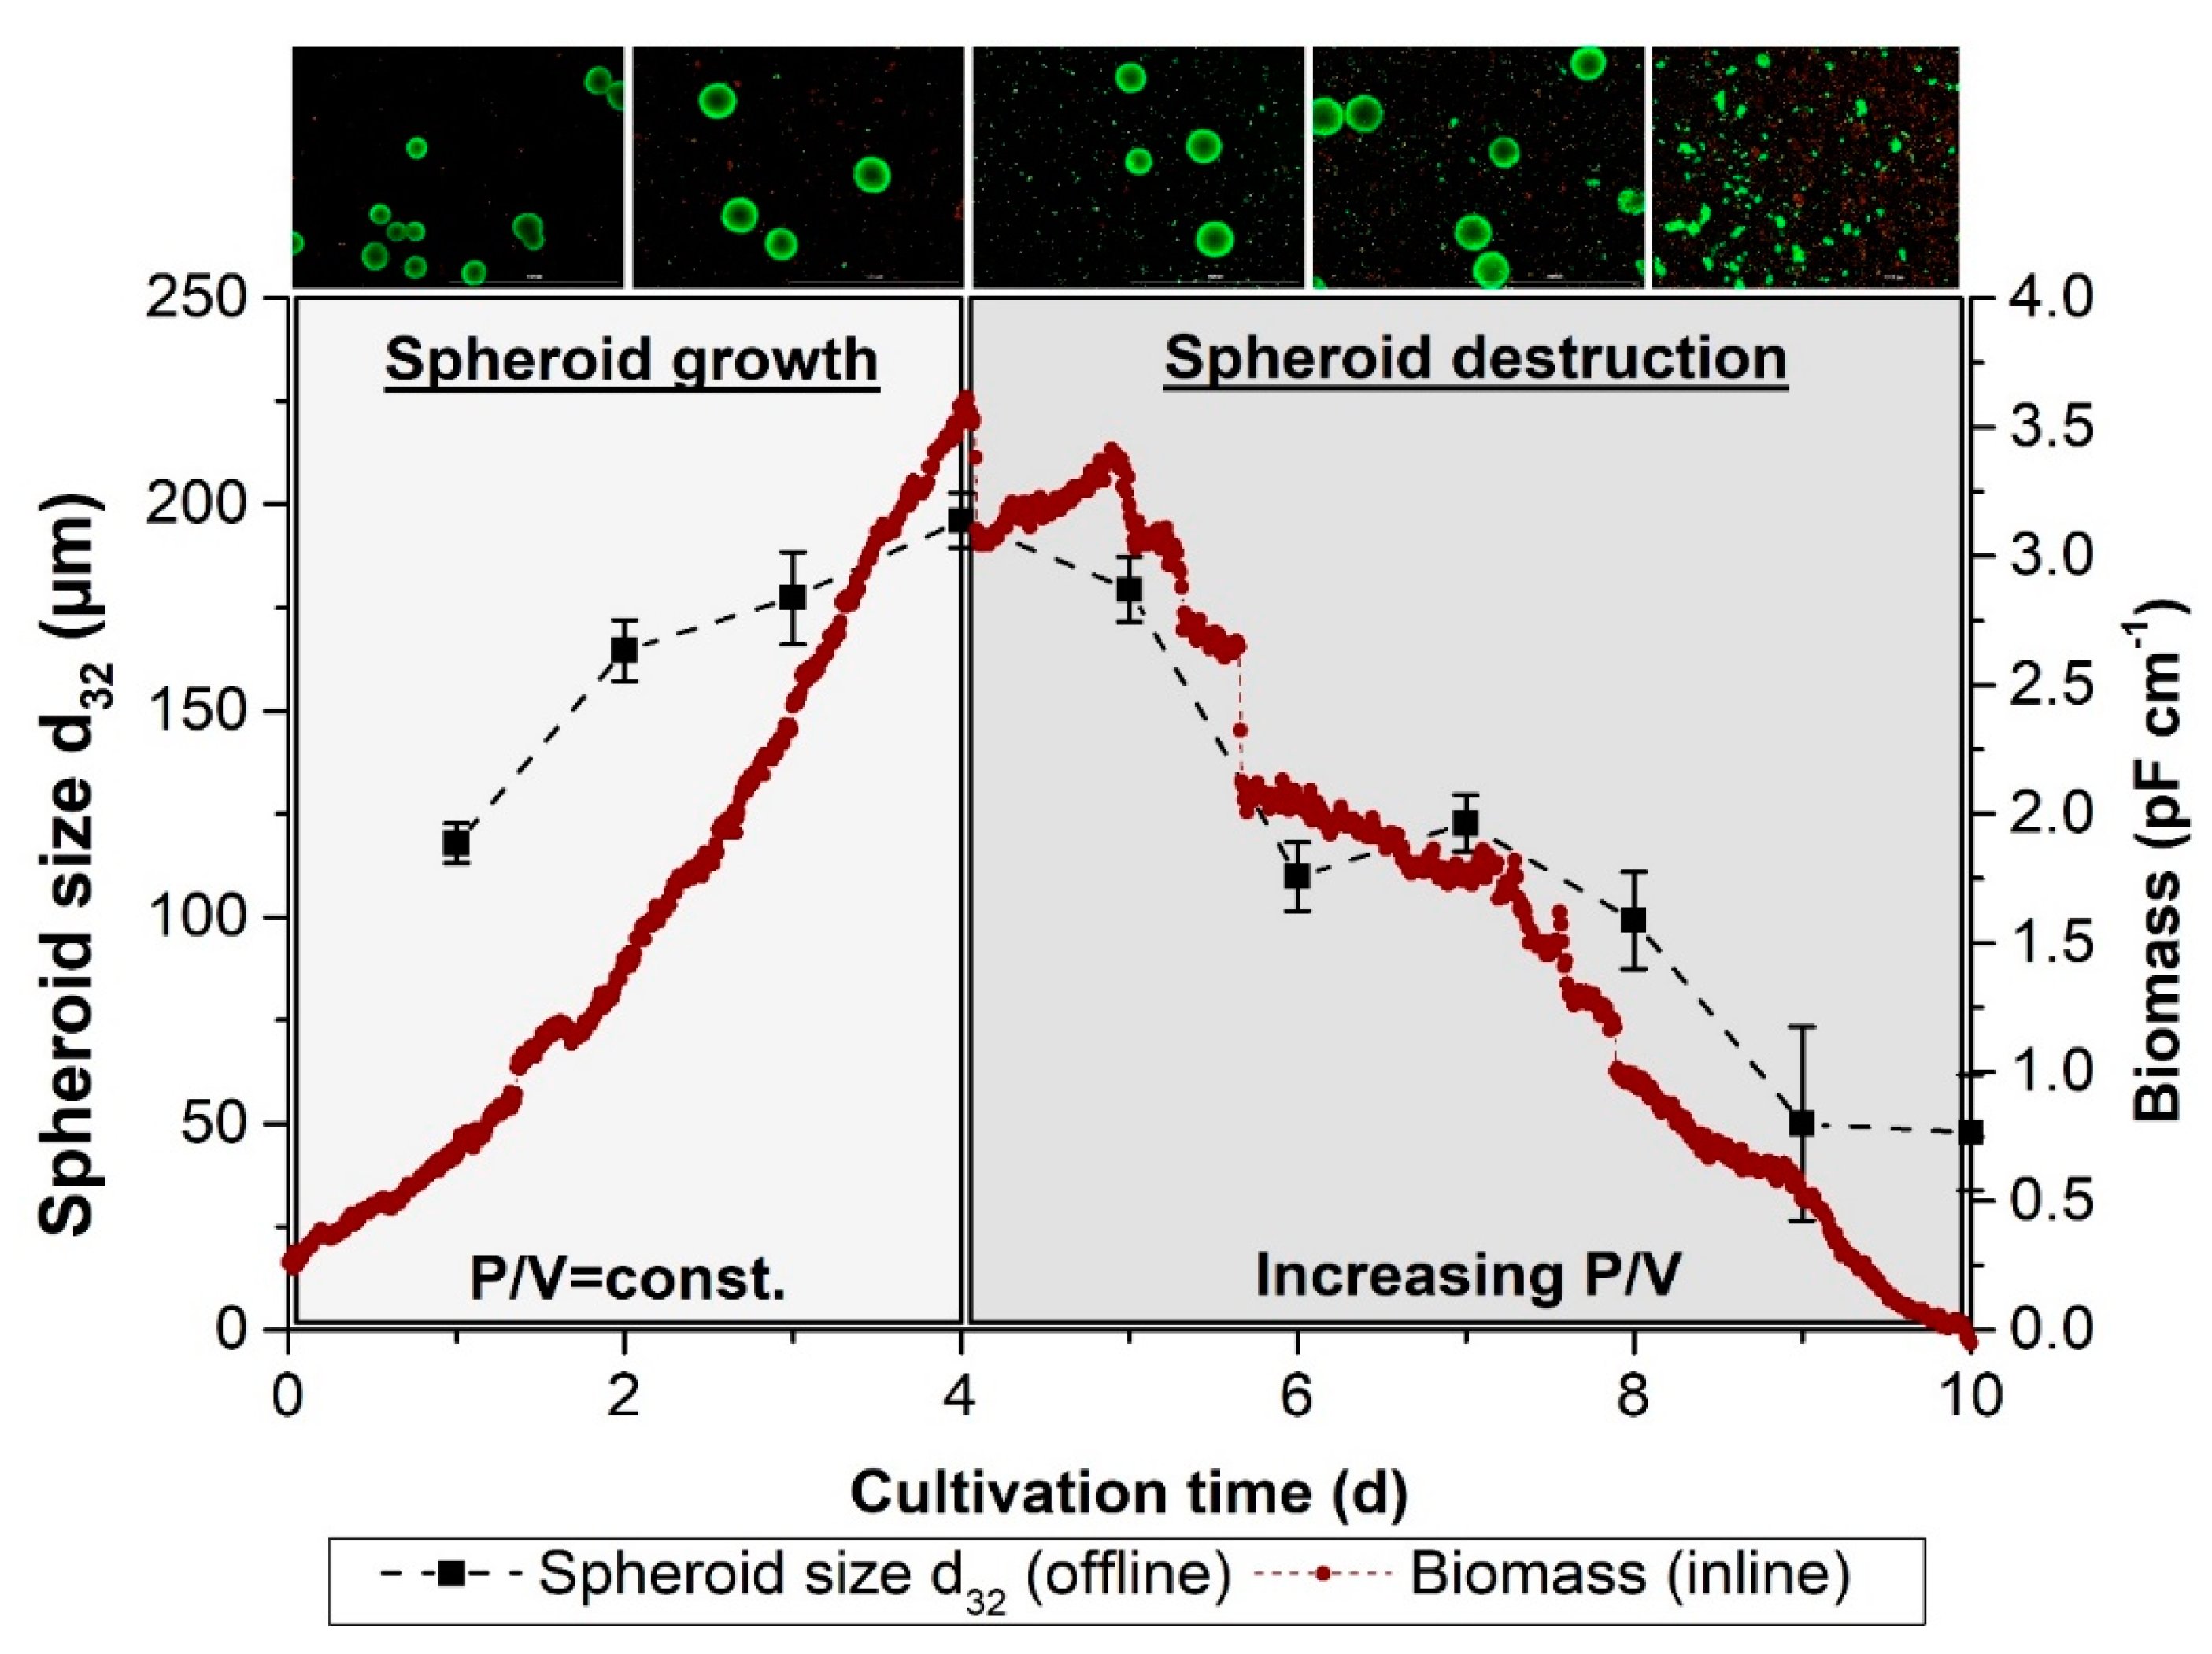
3.8. Online Monitoring of Spheroid Growth and Destruction

The fact that with increasing power input, the spheroids were attacked by surface erosion, was supported by our inline dielectric spectroscopy data (Figure 6). The dielectric spectroscopy probe only detects the viable biomass (dead cells cannot be polarized) and does not distinguish between single cells and cells incorporated into spheroids, which was why we also measured spheroid size offline. Figure 6 shows the biomass signal relative to the offline data. We cultured the INS-1 cells with a low volumetric power input of 5.5 W m−3 (75 rpm) for 4 d, and then increased the P/V stepwise to up to 104 W m−3 (200 rpm) to induce spheroid destruction. Until day 4, we observed the exponential growth of INS-1 cells, which was demonstrated by the rapidly increasing spheroid size (up to d32 = 182 ± 9 µm) and the increasing biomass signal. More importantly, increasing the stirrer speed to 200 rpm reduced the spheroid size and inline biomass signal, and increased the single-cell counts, while maintaining high spheroid viability. This indicated that shear stress, acting on the spheroid surface due to surface erosion (dSph/λ < 3), and causing the disruption of ECM-embedded cells, leads to permanent cell damage, as evidenced by the declining biomass signal. The dielectric spectroscopy was also implemented for the expansion and hepatic differentiation of hiPSC spheroids, and showed a good correlation between offline data and online biomass [61].

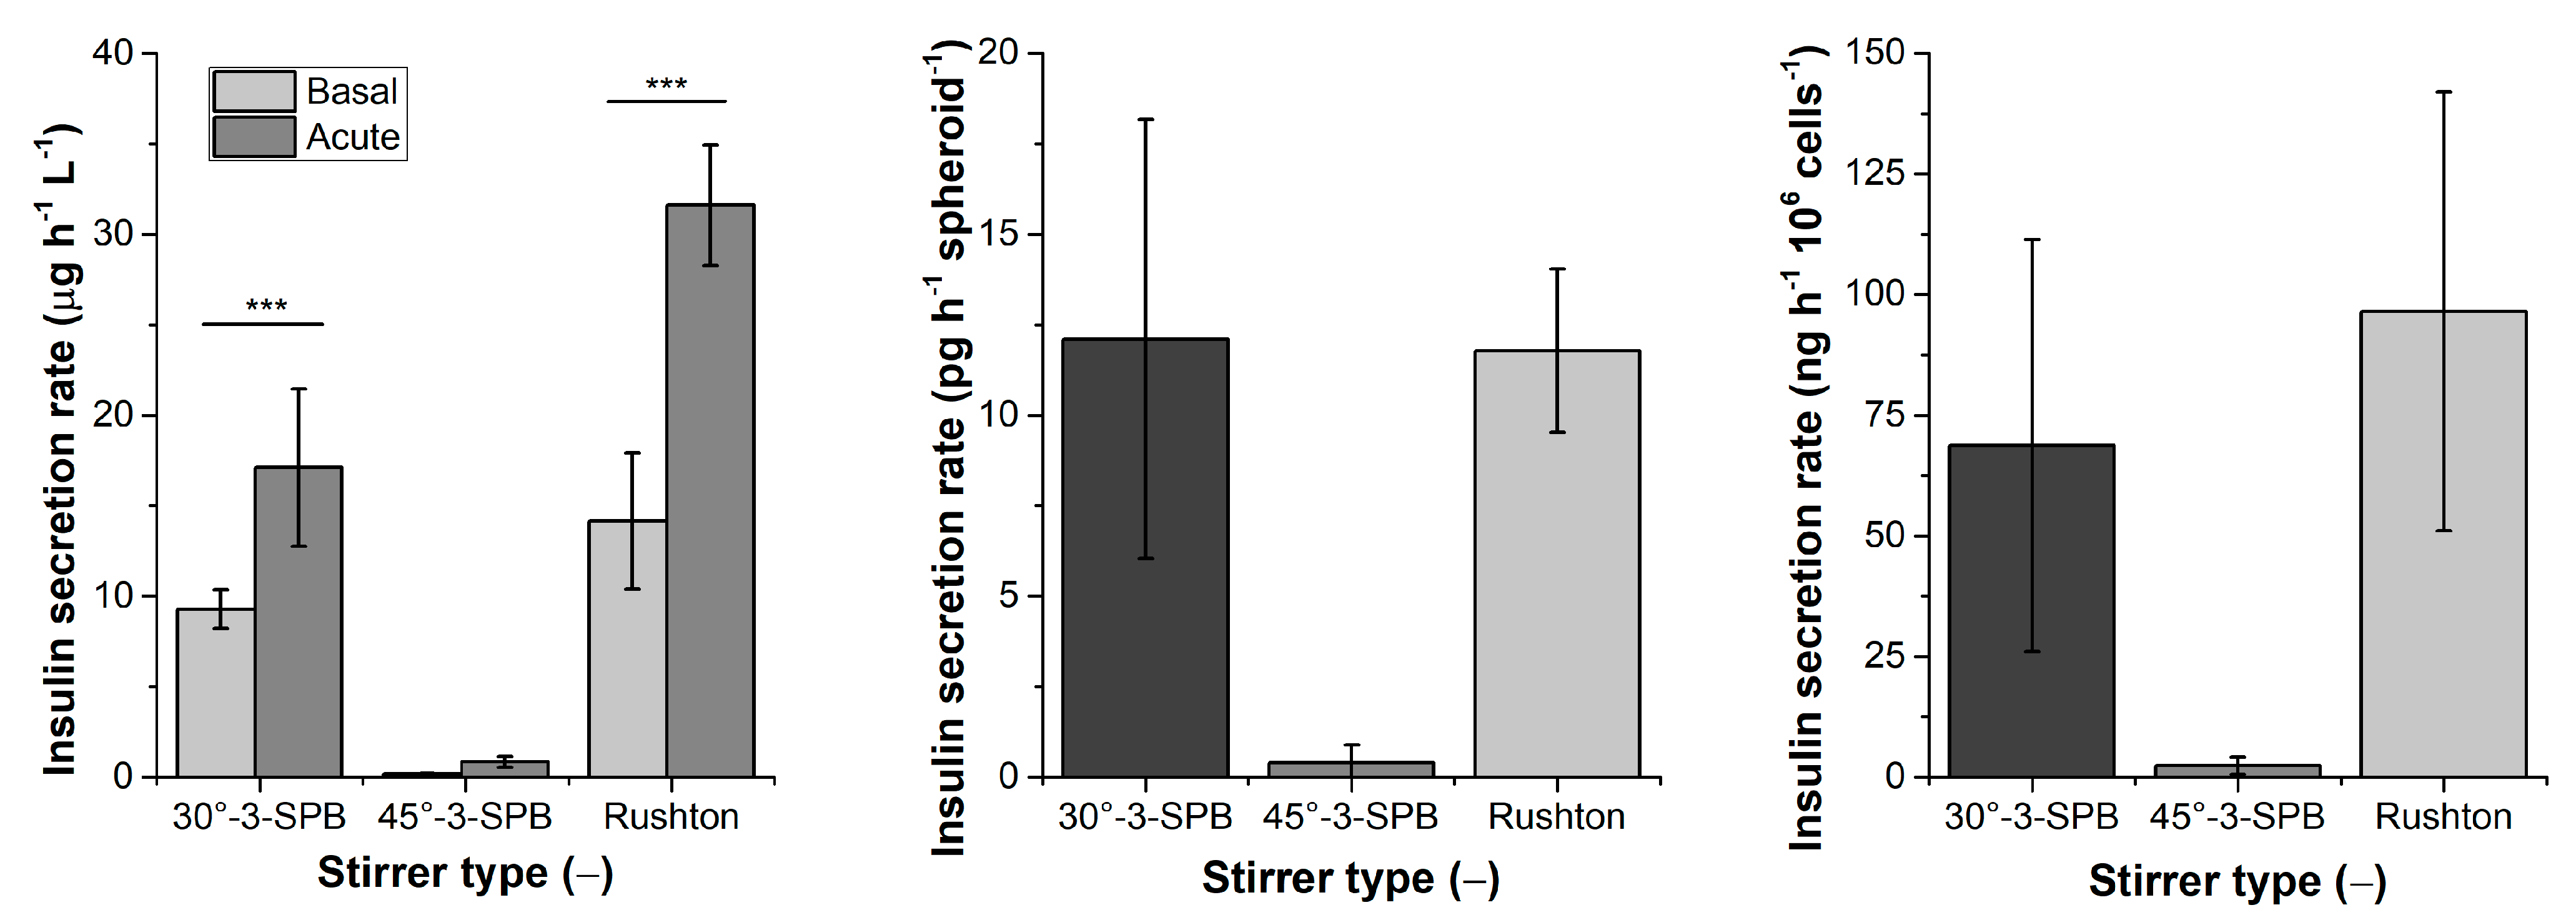
3.9. Glucose-Stimulated Insulin Secretion

For the direct analysis of functionality, we tested the glucose-stimulated insulin secretion of the INS-1 spheroids. The responsiveness of β-cells to varying glucose levels provides more insight into the health of the cells, than the testing of the basal insulin secretion only. Although we observed wide deviations within the samples, reflecting the manual sample preparation method and variation among the spheroids in each sample, the INS-1 spheroids from all STR runs achieved a higher insulin secretion during the acute phase compared with basal secretion (Figure 7). These results supported the particle analysis and viability data. The 30°-3-SPB stirrer and the Rushton turbine promoted an efficient insulin secretion: 17 ± 4 µg h−1 L−1 with a stimulation index (SI) of 2.7 ± 1.0, and 32 ± 3 µg h−1 L−1 with a SI of 3.2 ± 1.2, respectively. The 45°-3-SPB stirrer promoted low levels of insulin secretion: 0.8 ± 0.3 µg h−1 L−1 (SI = 13 ± 7, solely for completeness, not significant). The poor performance of the 45°-3-SPB stirrer aligned with the accumulation of dead single cells (Figure 3), providing evidence of excessive stress. For the insulin secretion rate per spheroid, the 30°-3-SPB stirrer and the Rushton turbine achieved similar rates of 12 ± 6 and 12 ± 2 pg h−1 spheroid1, respectively, compared with the low value of 0.4 ± 0.5 pg h−1 spheroid1 for the 45°-3-SPB device. We used an empirically determined conversion factor to approximate the number of cells contained in a spheroid and, thus, compensated for differences in spheroid size for each stirrer type, as previously recommended (Table 3) [21,62]. The Rushton turbine achieved the highest level of insulin secretion per 106 cells (97 ± 46 ng (h 106 cells)−1), followed by the 30°-3-SPB stirrer (69 ± 43 ng (h 106 cells)−1), and finally the 45°-3-SPB stirrer (2 ± 2 ng (h 106 cells)−1). The insulin profiles of the dynamic cultured INS-1 as spheroids using the 30°-3-SPB and the Rushton stirrer were similar to the insulin secretion of the INS-1 as a monolayer. INS-1, challenged as a monolayer, secreted 47 (basal) and 95 (acute) ng (h 106 cells)−1, which corresponded to SI = 2.1. In contrast, static produced spheroids (in cell-repellent 96-well plates) secreted 0.5 ng (h 106 cells)−1 within the acute phase and thereby secreted much lower insulin amounts.
The reduced functionality of the static cultured spheroids was attributed to a limited mass transport within the spheroids and, consequently, low viabilities. Thereby, the STR-based production of β-cell spheroids restored the insulin secretion of the INS-1 from 2D cultures, while providing highly viable spheroids. The insulin profiles in static cultures only serve as a trend, which also applies to the insulin profiles of INS-1 cells in the literature, where static INS-1 spheroids showed a basal secretion of 20 µg L−1, and an acute secretion of 40 µg L−1, SI = 2 [10]. Static and dynamic spheroid formation vary widely, which may result in the differential compaction of the spheroids (cells per volume), and static spheroids often show necrotic cores, whereas those from dynamic cultures are often completely viable due to a better mass transfer and, thus, a more efficient transport of insulin and glucose. The handling of spheroids also differs: whereas the glucose-stimulated insulin secretion assay can be applied to static cultures with spheroids alone and maybe only to one spheroid per well, the preparation of samples from dynamic cultures incorporates multiple spheroids, varying in size, along with single cells. This indicates the complexity of testing, and highlights the need for further investigation to determine the functionality of β-cells cultured under dynamic conditions.
Our STR-based process produced functional INS-1-cell spheroids with yields of 18 × 106 ± 2 × 10⁶ spheroids L−1 for the 30°-3-SPB stirrer, 14 × 106 ± 4 × 10⁶ spheroids L−1 for the 45°-3-SPB stirrer, and 22 × 106 ± 0.6 × 10⁶ spheroids L−1 for the Rushton turbine (Table 3). By converting the spheroid mass to islet equivalents (IEQ), based on a standard islet of Langerhans’ diameter of 150 µm and standard procedures for the transplantation of whole pancreatic islets [20], we calculated the IEQ counts for the complete STR volume (1 L) of 1.4 × 10⁶ ± 0.6 × 10⁶ for the 30°-3-SPB stirrer, 0.3 × 10⁶ ± 0.2 × 10⁶ for the 45°-3-SPB stirrer, and 1.1 × 10⁶ ± 0.4 × 10⁶ for the Rushton turbine (Table 3). Accordingly, one STR can produce sufficient spheroids for β-cell replacement therapies, given that the Edmonton protocol for islet transplantation requires 0.5–1 × 10⁶ IEQs from up to three donors to achieve a post-transplantation insulin independence [22,63], and exceeds the yield of other culture systems (compare Table 1). Based on the high spheroid formation efficiency, the narrow spheroid distribution in combination with low single-cell counts, high viability and insulin secretion, and sufficient spheroid/IEQ yield, we recommend the 30°-3-SPB for the production of β-cell spheroids on a larger scale. In an earlier study, more than 1000 spheroids in the size range of 100–250 µm were produced from the β-cell line MIN6 [22]. The authors used a clinostat to simulate microgravity, and induced the self-assembly of spheroids, whose size was semi-regulated by adapting the seeding density (higher cell concentrations produced smaller spheroids). The MIN6-derived spheroids secreted more insulin than monolayers, and expressed functionally relevant genes, such as insulin-2, glucokinase, SETD1A, and Kir6.2 at higher levels. The spheroids were also much more therapeutically effective than single cells, following a transplantation in a streptozotocin-induced diabetic mouse model. It is likely that spheroids perform better than single cells, not only because they are functionally superior, but also because single cells injected into the portal vein are too small for retention in the liver and most cells are lost, with their ultimate fate unclear. In contrast, spheroids larger than ~40 µm are more likely to be retained in the liver vessels. Islets < 100 µm in diameter performed better [21] than large spheroids (>250 µm), which showed lower functionality [22], probably reflecting the limited diffusive supply of nutrients, leading to the formation of necrotic cells. This shows the importance of the manufacturing of β-cell spheroids within a defined size range, which can be achieved using our STR setup.

4. Conclusions

We successfully used shaking flasks as a screening platform to determine the key process parameters (e.g., seeding density, spheroid strength) for the spheroid formation, using the β-cell line INS-1 as model. We then transferred the dynamic spheroid formation to a fully-controlled and monitored STR. We determined the mean energy dissipation as a transfer criterion to regulate the size of the spheroids formed under dynamic conditions, and investigated three different stirrer types to evaluate the effect of the stirrer design (and the associated forces). Using the same mean energy dissipation, the 30°-3-SPB stirrer was slightly better than the Rushton turbine in terms of spheroid size distribution, also reducing the dead single-cell count and increasing spheroid formation efficiency and biological performance (higher µVol and viability), while maintaining similar insulin secretion properties. In contrast, the 45°-3-SPB stirrer achieved poor results in all these aspects. We developed an image-based protocol to determine spheroid size and viability, and implemented the inline monitoring of biomass. The resulting spheroids achieved a similar glucose-dependent insulin secretion as standard 2D cultures of INS-1 cells. The large-scale cultivation of INS-1-cells achieved spheroid counts of up to 22 × 106 ± 0.6 × 10⁶, and the corresponding IEQ counts were sufficient for β-cell replacement therapy. Although primary β-cells do not proliferate in culture, the development of human β-cell lines and β-cell-like cells derived from iPSCs is progressing, and robust large-scale production processes are needed for both. Other cell types, such as human mesenchymal stem cells (MSCs), can also benefit from shear-guided spheroid formation in an STR-based manufacturing process. Our STR-based spheroid formation process offers the scalability, process monitoring, and full control required for manufacturing, and allows the regulation of spheroid size while maintaining β-cell functionality.

Supplementary Materials

The following supporting information can be downloaded at: https://www.mdpi.com/article/10.3390/pr10050861/s1, Figure S1: Schematic description of (A): the mechanical power input of the stirrer, the resulting eddy cascade and energy dissipation, followed by the two spheroid stress concepts involving (B) tensile forces, (C) surface erosion, and finally (D) spheroid agglomeration, until the hydrodynamic forces are in balance with the adhesion force Fad; Table S1: Summary of stirrer properties and the resulting bioreactor geometry including the ratios for swept volume VS and working volume VL, stirrer height hS and stirrer diameter dS or tank diameter DT, as well as the bottom clearance CB=hS,bottom/dS (hs,bottom = installation height of stirrer from the bottom). References [11,41,42,43,44,45,46,53,55,56,64,65,66,67] are cited in the supplementary materials.

Author Contributions

F.P. conceived, designed and performed the experiments and wrote the paper. D.S. helped to draft and revise the manuscript, and supervised the research. All authors have read and agreed to the published version of the manuscript.

Funding

The work was funded by the Forschungscampus Mittelhessen (FCHM).

Institutional Review Board Statement

Not applicable.

Informed Consent Statement

Not applicable.

Data Availability Statement

All relevant data are given within the manuscript. The raw data presented in this study are available on request from the corresponding author.

Acknowledgments

We would like to thank Peter Czermak for the opportunity to work at his institute, to use his laboratories, additional funding, all the fruitful scientific discussions, and his input into this work. The authors would like to thank Richard M. Twyman and Catharine Meckel-Oschmann for language editing.

Conflicts of Interest

The authors declare no conflict of interest.

References

  1. International Diabetes Federation. IDF Diabetes Atlas Ninth Edition 2019. 2020. Available online: www.diabetesatlas.org (accessed on 12 April 2021).
  2. Mir-Coll, J.; Moede, T.; Paschen, M.; Neelakandhan, A.; Valladolid-Acebes, I.; Leibiger, B.; Biernath, A.; Ämmälä, C.; Leibiger, I.B.; Yesildag, B.; et al. Human Islet Microtissues as an In Vitro and an In Vivo Model System for Diabetes. Int. J. Mol. Sci. 2021, 22, 1813. [Google Scholar] [CrossRef] [PubMed]
  3. Islam, M.S. The Islets of Langerhans; Springer Netherlands: Dordrecht, The Netherlands, 2010; ISBN 978-90-481-3270-6. [Google Scholar]
  4. Benthuysen, J.R.; Carrano, A.C.; Sander, M. Advances in β cell replacement and regeneration strategies for treating diabetes. J. Clin. Investig. 2016, 126, 3651–3660. [Google Scholar] [CrossRef] [PubMed]
  5. Scharfmann, R.; Didiesheim, M.; Richards, P.; Chandra, V.; Oshima, M.; Albagli, O. Mass production of functional human pancreatic β-cells: Why and how? Diabetes Obes. Metab. 2016, 18 (Suppl. 1), 128–136. [Google Scholar] [CrossRef] [PubMed] [Green Version]
  6. Rezania, A.; Bruin, J.E.; Arora, P.; Rubin, A.; Batushansky, I.; Asadi, A.; O’Dwyer, S.; Quiskamp, N.; Mojibian, M.; Albrecht, T.; et al. Reversal of diabetes with insulin-producing cells derived in vitro from human pluripotent stem cells. Nat. Biotechnol. 2014, 32, 1121–1133. [Google Scholar] [CrossRef] [PubMed]
  7. McCluskey, J.T.; Hamid, M.; Guo-Parke, H.; McClenaghan, N.H.; Gomis, R.; Flatt, P.R. Development and functional characterization of insulin-releasing human pancreatic beta cell lines produced by electrofusion. J. Biol. Chem. 2011, 286, 21982–21992. [Google Scholar] [CrossRef] [PubMed] [Green Version]
  8. Ravassard, P.; Hazhouz, Y.; Pechberty, S.; Bricout-Neveu, E.; Armanet, M.; Czernichow, P.; Scharfmann, R. A genetically engineered human pancreatic β cell line exhibiting glucose-inducible insulin secretion. J. Clin. Investig. 2011, 121, 3589–3597. [Google Scholar] [CrossRef]
  9. Scharfmann, R.; Pechberty, S.; Hazhouz, Y.; von Bülow, M.; Bricout-Neveu, E.; Grenier-Godard, M.; Guez, F.; Rachdi, L.; Lohmann, M.; Czernichow, P.; et al. Development of a conditionally immortalized human pancreatic β cell line. J. Clin. Investig. 2014, 124, 2087–2098. [Google Scholar] [CrossRef] [Green Version]
  10. Ntamo, Y.; Samodien, E.; Burger, J.; Muller, N.; Muller, C.J.F.; Chellan, N. In vitro Characterization of Insulin-Producing β-Cell Spheroids. Front. Cell Dev. Biol. 2020, 8, 623889. [Google Scholar] [CrossRef]
  11. Petry, F.; Weidner, T.; Czermak, P.; Salzig, D. Three-Dimensional Bioreactor Technologies for the Cocultivation of Human Mesenchymal Stem/Stromal Cells and Beta Cells. Stem Cells Int. 2018, 2018, 2547098. [Google Scholar] [CrossRef] [Green Version]
  12. Bernard, A.B.; Lin, C.-C.; Anseth, K.S. A microwell cell culture platform for the aggregation of pancreatic β-cells. Tissue Eng. Part C Methods 2012, 18, 583–592. [Google Scholar] [CrossRef]
  13. Bhang, S.H.; Jung, M.J.; Shin, J.-Y.; La, W.-G.; Hwang, Y.H.; Kim, M.J.; Kim, B.-S.; Lee, D.Y. Mutual effect of subcutaneously transplanted human adipose-derived stem cells and pancreatic islets within fibrin gel. Biomaterials 2013, 34, 7247–7256. [Google Scholar] [CrossRef] [PubMed]
  14. Achilli, T.-M.; Meyer, J.; Morgan, J.R. Advances in the formation, use and understanding of multi-cellular spheroids. Expert Opin. Biol. Ther. 2012, 12, 1347–1360. [Google Scholar] [CrossRef] [PubMed] [Green Version]
  15. Lammert, E.; Thorn, P. The Role of the Islet Niche on Beta Cell Structure and Function. J. Mol. Biol. 2020, 432, 1407–1418. [Google Scholar] [CrossRef] [PubMed]
  16. Petrenko, Y.; Syková, E.; Kubinová, Š. The therapeutic potential of three-dimensional multipotent mesenchymal stromal cell spheroids. Stem Cell Res. Ther. 2017, 8, 94. [Google Scholar] [CrossRef] [Green Version]
  17. Holt, R.I.G.; Cockram, C.S.; Flyvbjerg, A.; Goldstein, B.J. Textbook of Diabetes; Wiley-Blackwell: Oxford, UK, 2010; ISBN 9781444324808. [Google Scholar]
  18. Friberg, A.S.; Brandhorst, H.; Buchwald, P.; Goto, M.; Ricordi, C.; Brandhorst, D.; Korsgren, O. Quantification of the islet product: Presentation of a standardized current good manufacturing practices compliant system with minimal variability. Transplantation 2011, 91, 677–683. [Google Scholar] [CrossRef]
  19. Gmyr, V.; Bonner, C.; Lukowiak, B.; Pawlowski, V.; Dellaleau, N.; Belaich, S.; Aluka, I.; Moermann, E.; Thevenet, J.; Ezzouaoui, R.; et al. Automated digital image analysis of islet cell mass using Nikon’s inverted eclipse Ti microscope and software to improve engraftment may help to advance the therapeutic efficacy and accessibility of islet transplantation across centers. Cell Transplant. 2015, 24, 1–9. [Google Scholar] [CrossRef] [Green Version]
  20. Buchwald, P.; Bernal, A.; Echeverri, F.; Tamayo-Garcia, A.; Linetsky, E.; Ricordi, C. Fully Automated Islet Cell Counter (ICC) for the Assessment of Islet Mass, Purity, and Size Distribution by Digital Image Analysis. Cell Transplant. 2016, 25, 1747–1761. [Google Scholar] [CrossRef] [Green Version]
  21. Huang, H.-H.; Harrington, S.; Stehno-Bittel, L. The Flaws and Future of Islet Volume Measurements. Cell Transplant. 2018, 27, 1017–1026. [Google Scholar] [CrossRef]
  22. Tanaka, H.; Tanaka, S.; Sekine, K.; Kita, S.; Okamura, A.; Takebe, T.; Zheng, Y.-W.; Ueno, Y.; Tanaka, J.; Taniguchi, H. The generation of pancreatic β-cell spheroids in a simulated microgravity culture system. Biomaterials 2013, 34, 5785–5791. [Google Scholar] [CrossRef]
  23. Zuellig, R.A.; Cavallari, G.; Gerber, P.; Tschopp, O.; Spinas, G.A.; Moritz, W.; Lehmann, R. Improved physiological properties of gravity-enforced reassembled rat and human pancreatic pseudo-islets. J. Tissue Eng. Regen. Med. 2017, 11, 109–120. [Google Scholar] [CrossRef]
  24. Abbasalizadeh, S.; Larijani, M.R.; Samadian, A.; Baharvand, H. Bioprocess development for mass production of size-controlled human pluripotent stem cell aggregates in stirred suspension bioreactor. Tissue Eng. Part C Methods 2012, 18, 831–851. [Google Scholar] [CrossRef]
  25. Chawla, M.; Bodnar, C.A.; Sen, A.; Kallos, M.S.; Behie, L.A. Production of islet-like structures from neonatal porcine pancreatic tissue in suspension bioreactors. Biotechnol. Prog. 2006, 22, 561–567. [Google Scholar] [CrossRef]
  26. Lock, L.T.; Laychock, S.G.; Tzanakakis, E.S. Pseudoislets in stirred-suspension culture exhibit enhanced cell survival, propagation and insulin secretion. J. Biotechnol. 2011, 151, 278–286. [Google Scholar] [CrossRef]
  27. Santo, V.E.; Estrada, M.F.; Rebelo, S.P.; Abreu, S.; Silva, I.; Pinto, C.; Veloso, S.C.; Serra, A.T.; Boghaert, E.; Alves, P.M.; et al. Adaptable stirred-tank culture strategies for large scale production of multicellular spheroid-based tumor cell models. J. Biotechnol. 2016, 221, 118–129. [Google Scholar] [CrossRef]
  28. Murray, H.E.; Paget, M.B.; Downing, R. Preservation of glucose responsiveness in human islets maintained in a rotational cell culture system. Mol. Cell. Endocrinol. 2005, 238, 39–49. [Google Scholar] [CrossRef]
  29. Chmiel, H. (Ed.) Bioprozesstechnik; Spektrum Akademischer Verl.: Heidelberg, Germany, 2011; ISBN 9783827424761. [Google Scholar]
  30. Petry, F.; Salzig, D. Impact of Bioreactor Geometry on Mesenchymal Stem Cell Production in Stirred-Tank Bioreactors. Chem. Ing. Tech. 2021, 93, 1537–1554. [Google Scholar] [CrossRef]
  31. Lv, D.; Hu, Z.; Lu, L.; Lu, H.; Xu, X. Three-dimensional cell culture: A powerful tool in tumor research and drug discovery. Oncol. Lett. 2017, 14, 6999–7010. [Google Scholar] [CrossRef] [Green Version]
  32. Schulz, T.C.; Young, H.Y.; Agulnick, A.D.; Babin, M.J.; Baetge, E.E.; Bang, A.G.; Bhoumik, A.; Cepa, I.; Cesario, R.M.; Haakmeester, C.; et al. A scalable system for production of functional pancreatic progenitors from human embryonic stem cells. PLoS ONE 2012, 7, e37004. [Google Scholar] [CrossRef]
  33. Olmer, R.; Lange, A.; Selzer, S.; Kasper, C.; Haverich, A.; Martin, U.; Zweigerdt, R. Suspension culture of human pluripotent stem cells in controlled, stirred bioreactors. Tissue Eng. Part C Methods 2012, 18, 772–784. [Google Scholar] [CrossRef] [Green Version]
  34. Manstein, F.; Ullmann, K.; Kropp, C.; Halloin, C.; Triebert, W.; Franke, A.; Farr, C.-M.; Sahabian, A.; Haase, A.; Breitkreuz, Y.; et al. High density bioprocessing of human pluripotent stem cells by metabolic control and in silico modeling. Stem Cells Transl. Med. 2021, 10, 1063–1080. [Google Scholar] [CrossRef]
  35. Peter, C.P. Auslegung Geschüttelter Bioreaktoren für Hochviskose und Hydromechanisch Empfindliche Fermentationssysteme. Ph.D. Thesis, Rheinisch-Westfälischen Technischen Hochschule Aachen, Aachen, Germany, 2007. [Google Scholar]
  36. Büchs, J.; Maier, U.; Milbradt, C.; Zoels, B. Power consumption in shaking flasks on rotary shaking machines: I. Power consumption measurement in unbaffled flasks at low liquid viscosity. Biotechnol. Bioeng. 2000, 68, 589–593. [Google Scholar] [CrossRef]
  37. Büchs, J.; Maier, U.; Milbradt, C.; Zoels, B. Power consumption in shaking flasks on rotary shaking machines: II. Nondimensional description of specific power consumption and flow regimes in unbaffled flasks at elevated liquid viscosity. Biotechnol. Bioeng. 2000, 68, 594–601. [Google Scholar] [CrossRef]
  38. Joo, D.J.; Kim, J.Y.; Lee, J.I.; Jeong, J.H.; Cho, Y.; Ju, M.K.; Huh, K.H.; Kim, M.S.; Kim, Y.S. Manufacturing of insulin-secreting spheroids with the RIN-5F cell line using a shaking culture method. Transplant. Proc. 2010, 42, 4225–4227. [Google Scholar] [CrossRef] [PubMed]
  39. Cunha, B.; Aguiar, T.; Carvalho, S.B.; Silva, M.M.; Gomes, R.A.; Carrondo, M.J.T.; Gomes-Alves, P.; Peixoto, C.; Serra, M.; Alves, P.M. Bioprocess integration for human mesenchymal stem cells: From up to downstream processing scale-up to cell proteome characterization. J. Biotechnol. 2017, 248, 87–98. [Google Scholar] [CrossRef]
  40. Serra, M.; Brito, C.; Sousa, M.F.Q.; Jensen, J.; Tostões, R.; Clemente, J.; Strehl, R.; Hyllner, J.; Carrondo, M.J.T.; Alves, P.M. Improving expansion of pluripotent human embryonic stem cells in perfused bioreactors through oxygen control. J. Biotechnol. 2010, 148, 208–215. [Google Scholar] [CrossRef]
  41. Jarvis, P.; Jefferson, B.; Gregory, J.; Parsons, S.A. A review of floc strength and breakage. Water Res. 2005, 39, 3121–3137. [Google Scholar] [CrossRef] [Green Version]
  42. KOBAYASHI, M.; Adachi, Y.; OOI, S. Effect of Particle Size on Breakup of Flocs in a Turbulent Flow. Proc. Hydraul. Eng. 2001, 45, 1249–1253. [Google Scholar] [CrossRef] [Green Version]
  43. Mühle, K.; Domasch, K. Stability of particle aggregates in flocculation with polymers. Chem. Eng. Processing Process Intensif. 1991, 29, 1–8. [Google Scholar] [CrossRef]
  44. Oyegbile, B.; Ay, P.; Narra, S. Flocculation kinetics and hydrodynamic interactions in natural and engineered flow systems: A review. Environ. Eng. Res. 2016, 21, 1–14. [Google Scholar] [CrossRef] [Green Version]
  45. Schubert, H.; Mühle, K. The role of turbulence in unit operations of particle technology. Adv. Powder Technol. 1991, 2, 295–306. [Google Scholar] [CrossRef]
  46. Wengeler, R.; Nirschl, H. Turbulent hydrodynamic stress induced dispersion and fragmentation of nanoscale agglomerates. J. Colloid Interface Sci. 2007, 306, 262–273. [Google Scholar] [CrossRef] [PubMed] [Green Version]
  47. Moreira, J.; Cruz, P.E.; Santana, P.C.; Aunins, J.G.; Carrondo, M.J. Formation and disruption of animal cell aggregates in stirred vessels: Mechanisms and kinetic studies. Chem. Eng. Sci. 1995, 50, 2747–2764. [Google Scholar] [CrossRef]
  48. Yeung, A.; Gibbs, A.; Pelton, R. Effect of Shear on the Strength of Polymer-Induced Flocs. J. Colloid Interface Sci. 1997, 196, 113–115. [Google Scholar] [CrossRef]
  49. Sart, S.; Tsai, A.-C.; Li, Y.; Ma, T. Three-dimensional aggregates of mesenchymal stem cells: Cellular mechanisms, biological properties, and applications. Tissue Eng. Part B Rev. 2014, 20, 365–380. [Google Scholar] [CrossRef] [PubMed] [Green Version]
  50. Parker, D. Floc Breakup in Turbulent Flocculation Processes. J. Sanit. Eng. 1972, 98, 79–99. [Google Scholar] [CrossRef]
  51. David, B. Use of hydrodynamic shear stress to analyze cell adhesion. In Principles of Cellular Engineering: Understanding the Biomolecular Interface; King, M.R., Ed.; Elsevier Academic Press: Amsterdam, Boston, 2006; pp. 51–80. ISBN 9780123693921. [Google Scholar]
  52. Böhm, L.; Hohl, L.; Bliatsiou, C.; Kraume, M. Multiphase Stirred Tank Bioreactors—New Geometrical Concepts and Scale-up Approaches. Chem. Ing. Tech. 2019, 91, 1724–1746. [Google Scholar] [CrossRef]
  53. Henzler, H.J. Particle stress in bioreactors. Adv. Biochem. Eng. Biotechnol. 2000, 67, 35–82. [Google Scholar] [CrossRef]
  54. Jüsten, P.; Paul, G.C.; Nienow, A.W.; Thomas, C.R. Dependence of mycelial morphology on impeller type and agitation intensity. Biotechnol. Bioeng. 1996, 52, 672–684. [Google Scholar] [CrossRef]
  55. Langer, G.; Deppe, A. Zum Verständnis der hydrodynamischen Beanspruchung von Partikeln in turbulenten Rührerströmungen. Chem. Ing. Tech. 2000, 72, 31–41. [Google Scholar] [CrossRef]
  56. Wollny, S. Experimentelle und Numerische Untersuchungen zur Partikelbeanspruchung in Gerührten (Bio-)Reaktoren. Doctoral Thesis, Technische Universität Berlin, Berlin, Germany, 2010. [Google Scholar]
  57. Collignon, M.-L.; Delafosse, A.; Crine, M.; Toye, D. Axial impeller selection for anchorage dependent animal cell culture in stirred bioreactors: Methodology based on the impeller comparison at just-suspended speed of rotation. Chem. Eng. Sci. 2010, 65, 5929–5941. [Google Scholar] [CrossRef] [Green Version]
  58. Jirout, T.; Rieger, F. Impeller design for mixing of suspensions. Chem. Eng. Res. Des. 2011, 89, 1144–1151. [Google Scholar] [CrossRef]
  59. Torizal, F.G.; Kim, S.M.; Horiguchi, I.; Inamura, K.; Suzuki, I.; Morimura, T.; Nishikawa, M.; Sakai, Y. Production of homogenous size-controlled human induced pluripotent stem cell aggregates using ring-shaped culture vessel. J. Tissue Eng. Regen. Med. 2022, 16, 254–266. [Google Scholar] [CrossRef] [PubMed]
  60. Kahn-Krell, A.; Pretorius, D.; Ou, J.; Fast, V.G.; Litovsky, S.; Berry, J.; Liu, X.M.; Zhang, J. Bioreactor Suspension Culture: Differentiation and Production of Cardiomyocyte Spheroids From Human Induced Pluripotent Stem Cells. Front. Bioeng. Biotechnol. 2021, 9, 674260. [Google Scholar] [CrossRef]
  61. Isidro, I.A.; Vicente, P.; Pais, D.A.M.; Almeida, J.I.; Domingues, M.; Abecasis, B.; Zapata-Linares, N.; Rodriguez-Madoz, J.R.; Prosper, F.; Aspegren, A.; et al. Online monitoring of hiPSC expansion and hepatic differentiation in 3D culture by dielectric spectroscopy. Biotechnol. Bioeng. 2021, 118, 3610–3617. [Google Scholar] [CrossRef] [PubMed]
  62. Huang, H.-H.; Ramachandran, K.; Stehno-Bittel, L. A replacement for islet equivalents with improved reliability and validity. Acta Diabetol. 2013, 50, 687–696. [Google Scholar] [CrossRef] [PubMed] [Green Version]
  63. Shapiro, A.M.J.; Ricordi, C.; Hering, B.J.; Auchincloss, H.; Lindblad, R.; Robertson, R.P.; Secchi, A.; Brendel, M.D.; Berney, T.; Brennan, D.C.; et al. International trial of the Edmonton protocol for islet transplantation. N. Engl. J. Med. 2006, 355, 1318–1330. [Google Scholar] [CrossRef] [PubMed] [Green Version]
  64. Hewitt, C.J.; Lee, K.; Nienow, A.W.; Thomas, R.J.; Smith, M.; Thomas, C.R. Expansion of human mesenchymal stem cells on microcarriers. Biotechnol. Lett. 2011, 33, 2325–2335. [Google Scholar] [CrossRef] [Green Version]
  65. Pattappa, G.; Heywood, H.K.; de Bruijn, J.D.; Lee, D.A. The metabolism of human mesenchymal stem cells during proliferation and differentiation. J. Cell. Physiol. 2011, 226, 2562–2570. [Google Scholar] [CrossRef]
  66. Heyter, A.; Wollny, S. Einfluss verschiedener Stromstörerausführungen auf die Bewehrung eines mehrstufigen Rührbehälters. Chem. Ing. Tech. 2017, 89, 416–423. [Google Scholar] [CrossRef]
  67. Kraume, M. Mischen und Rühren: Grundlagen und Moderne Verfahren; Wiley-VCH: Weinheim, Germany, 2003; ISBN 3527307095. [Google Scholar]
Figure 1. Comparison of spheroid structures. Left panels show INS-1 spheroids produced in static 96-well plates with cell-repellent surfaces. These spheroids developed a necrotic core, seen as a denser area in the bright field image (upper), and the corresponding red area by live/dead staining (lower). Right panels show highly viable spheroids produced in dynamic shaking flask cultures. Scale bar = 100 µm.
Processes 10 00861 g001
Figure 2. Spheroid size (d32, black squares) from dynamic cultivation in shaking flasks (n = 3, error bars represent STDV). Spheroids produced with a power input lower than the gray highlighted working range (35–60 W m−3; 100–120 rpm) were twice as large, whereas increasing shear forces reduced the steady-state size until agglomeration was prevented at a P/V of ≈75 W m−3 (130 rpm). An increase in power input displaced cells from the spheroid surface, leading to greater numbers of suspended dead singe-cells (blue triangles) in the supernatant. The spheroid formation efficiency (the number of formed spheroids in relation to the total cell number; red dots) supported the turbulent range from 100 to 120 rpm with an increased efficiency above 20%.
Processes 10 00861 g002
Figure 3. Particle counts for the shaking flask cultures (n = 3) and the three different stirrer types (n = 2) during cultivation for 4 d. Left column: single-cell count (blue triangles, size range: 0–20 µm, error bars = STDV) and spheroid count (red circles, size range: 20–300 µm, error bars = STDV). Right column: box plots of the spheroid size distribution showing the median (straight line), mean (square), minimum value 1% (due to our threshold at 20 µm), and maximum value 99%, each as cross.
Processes 10 00861 g003
Figure 4. The relationship between spheroid size and power input. We determined the spheroid strength (CAgg) in shaking flasks to predict the spheroid size in the STR at different power inputs (P/V) after 24 h. The relationship for each stirrer type shows the anticipated characteristic of a declining spheroid size with increasing P/V. With a constant P/V of 35 W m−3 (vertical dashed line), the measured spheroid size (horizontal dashed lines) for the 45°-3-SPB stirrer (blue triangle) fit the predicted spheroid size, whereas the 30°-3-SPB stirrer (black square) and the Rushton turbine (red circle) were offset by ~10 µm from the predicted value.
Processes 10 00861 g004
Figure 5. Analysis of the total viability of the STR process with each stirrer type over the culture period of 4 d (n = 2). Live/dead staining revealed high viabilities for the spheroids, whereas increasing amounts of dead single cells decreased the total viability, shown as mean ± STDV. The scale bar represents 500 µm.
Processes 10 00861 g005
Figure 6. Representative spheroid production in an STR with the 45°-3-SPB stirrer. Dielectric spectroscopy showed an increase in biomass (red line) during the first 4 d of cultivation with a constant power input per volume (P/V). As dielectric spectroscopy only measures the volume of viable cells and does not distinguish between suspended individual cells and cells within spheroids, we also plotted the spheroid growth measured offline (black squares and dashed line; mean of 5 technical replicates, error bars = STDV). Upper lane: live/dead images of progressing spheroid growth and destruction. Increasing the P/V led to the disruption of the spheroids, resulting in single cells and smaller agglomerates, which were permanently affected by the hydrodynamic forces, clearly indicated by the decreasing biomass signal and the offline measurement.
Processes 10 00861 g006
Figure 7. The functionality of β-cell spheroids determined using a glucose tolerance test. Left panel: the significant (*** <0.001, Student’s t-test) increased secretion of insulin during the acute phase, compared with basal secretion, showed that β-cells produced with a 30°-3-SPB stirrer and a Rushton turbine responded to varying glucose concentrations. The insulin profiles of the β-cell spheroids generated with a 45°-3-SPB are only presented for completeness, but were not considered for discussion. Middle panel: the insulin secretion rate per spheroid. Right panel: we used a conversion factor to approximate the number of β-cells contained in a spheroid, to compensate for spheroid size differences. For each stirrer type (n = 2), three technical replicates of the glucose tolerance test were performed (error bars = STDV).
Processes 10 00861 g007
Table 2. Overview of relevant stirrer properties such as the power number NP, energy dissipation circulation function (EDCF), stirrer tip speed, and the ratio of maximum energy dissipation to the mean ε m a x ε ¯ (calculated by [56]). Further, we summarized important particle parameters such as the Sauter diameter d32, the spheroid formation efficiency, and the span width of the spheroid distribution from 1 to 99% after 24 h.
Stirrer TypeNp [−]d32 [µm]Spheroid Formation Efficiency [%]Span Width of Distribution [µm]EDCF [kW m−3 s−1]Stirrer Tip Speed [m s−1]εmax/ ε ¯ [−]
Shaking flask-94 ± 127.7 ± 1.4134 ± 11---
30°-3-SPB1.151.5 ± 1.260 ± 366 ± 70.90.625
45°-3-SPB2.440 ± 38.7 ± 1.451 ± 60.60.496
Rushton4.050.6 ± 1.633 ± 261 ± 31.60.4613
Table 3. Overview of relevant biological properties of the spheroids produced with each stirrer type, such as the volume-based growth rate µVol, and the corresponding minimal time for doubling the volume tD,Vol, the acute insulin secretion, and the insulin stimulation index SI (except for the 45°-3-SPB, due to poor performance). Further, we added the yield of spheroids YSpheroids, IEQs YIEQs, and cells Ycells for each 1-L process.
Stirrer TypeµVol
[d−1]
tD,Vol
[d]
Acute Insulin
Secretion
[µg h−1 L−1]
SI [−]YSpheroids
[Spheroids L−1]
YIEQs
[IEQs L−1]
Ycells
[Cells L−1]
30°-3-SPB0.38 ± 0.0181.81 ± 0.0932 ± 33.2 ± 1.218 × 10⁶ ± 2 × 1061.4 × 106 ± 0.6 × 10⁶ 2 × 10⁸ ± 0.1 × 10⁸
45°-3-SPB0.4 ± 0.21.9 ± 1.0--14 × 106 ± 4 × 1060.3 × 106 ± 0.2 × 1060.8 × 108 ± 0.4 × 10⁸
Rushton0.27 ± 0.072.7 ± 0.717 ± 42.7 ± 1.022 × 10⁶ ± 0.6 × 1061.1 × 106 ± 0.4 × 1062.2 × 108 ± 0.2 × 10⁸
Publisher’s Note: MDPI stays neutral with regard to jurisdictional claims in published maps and institutional affiliations.

