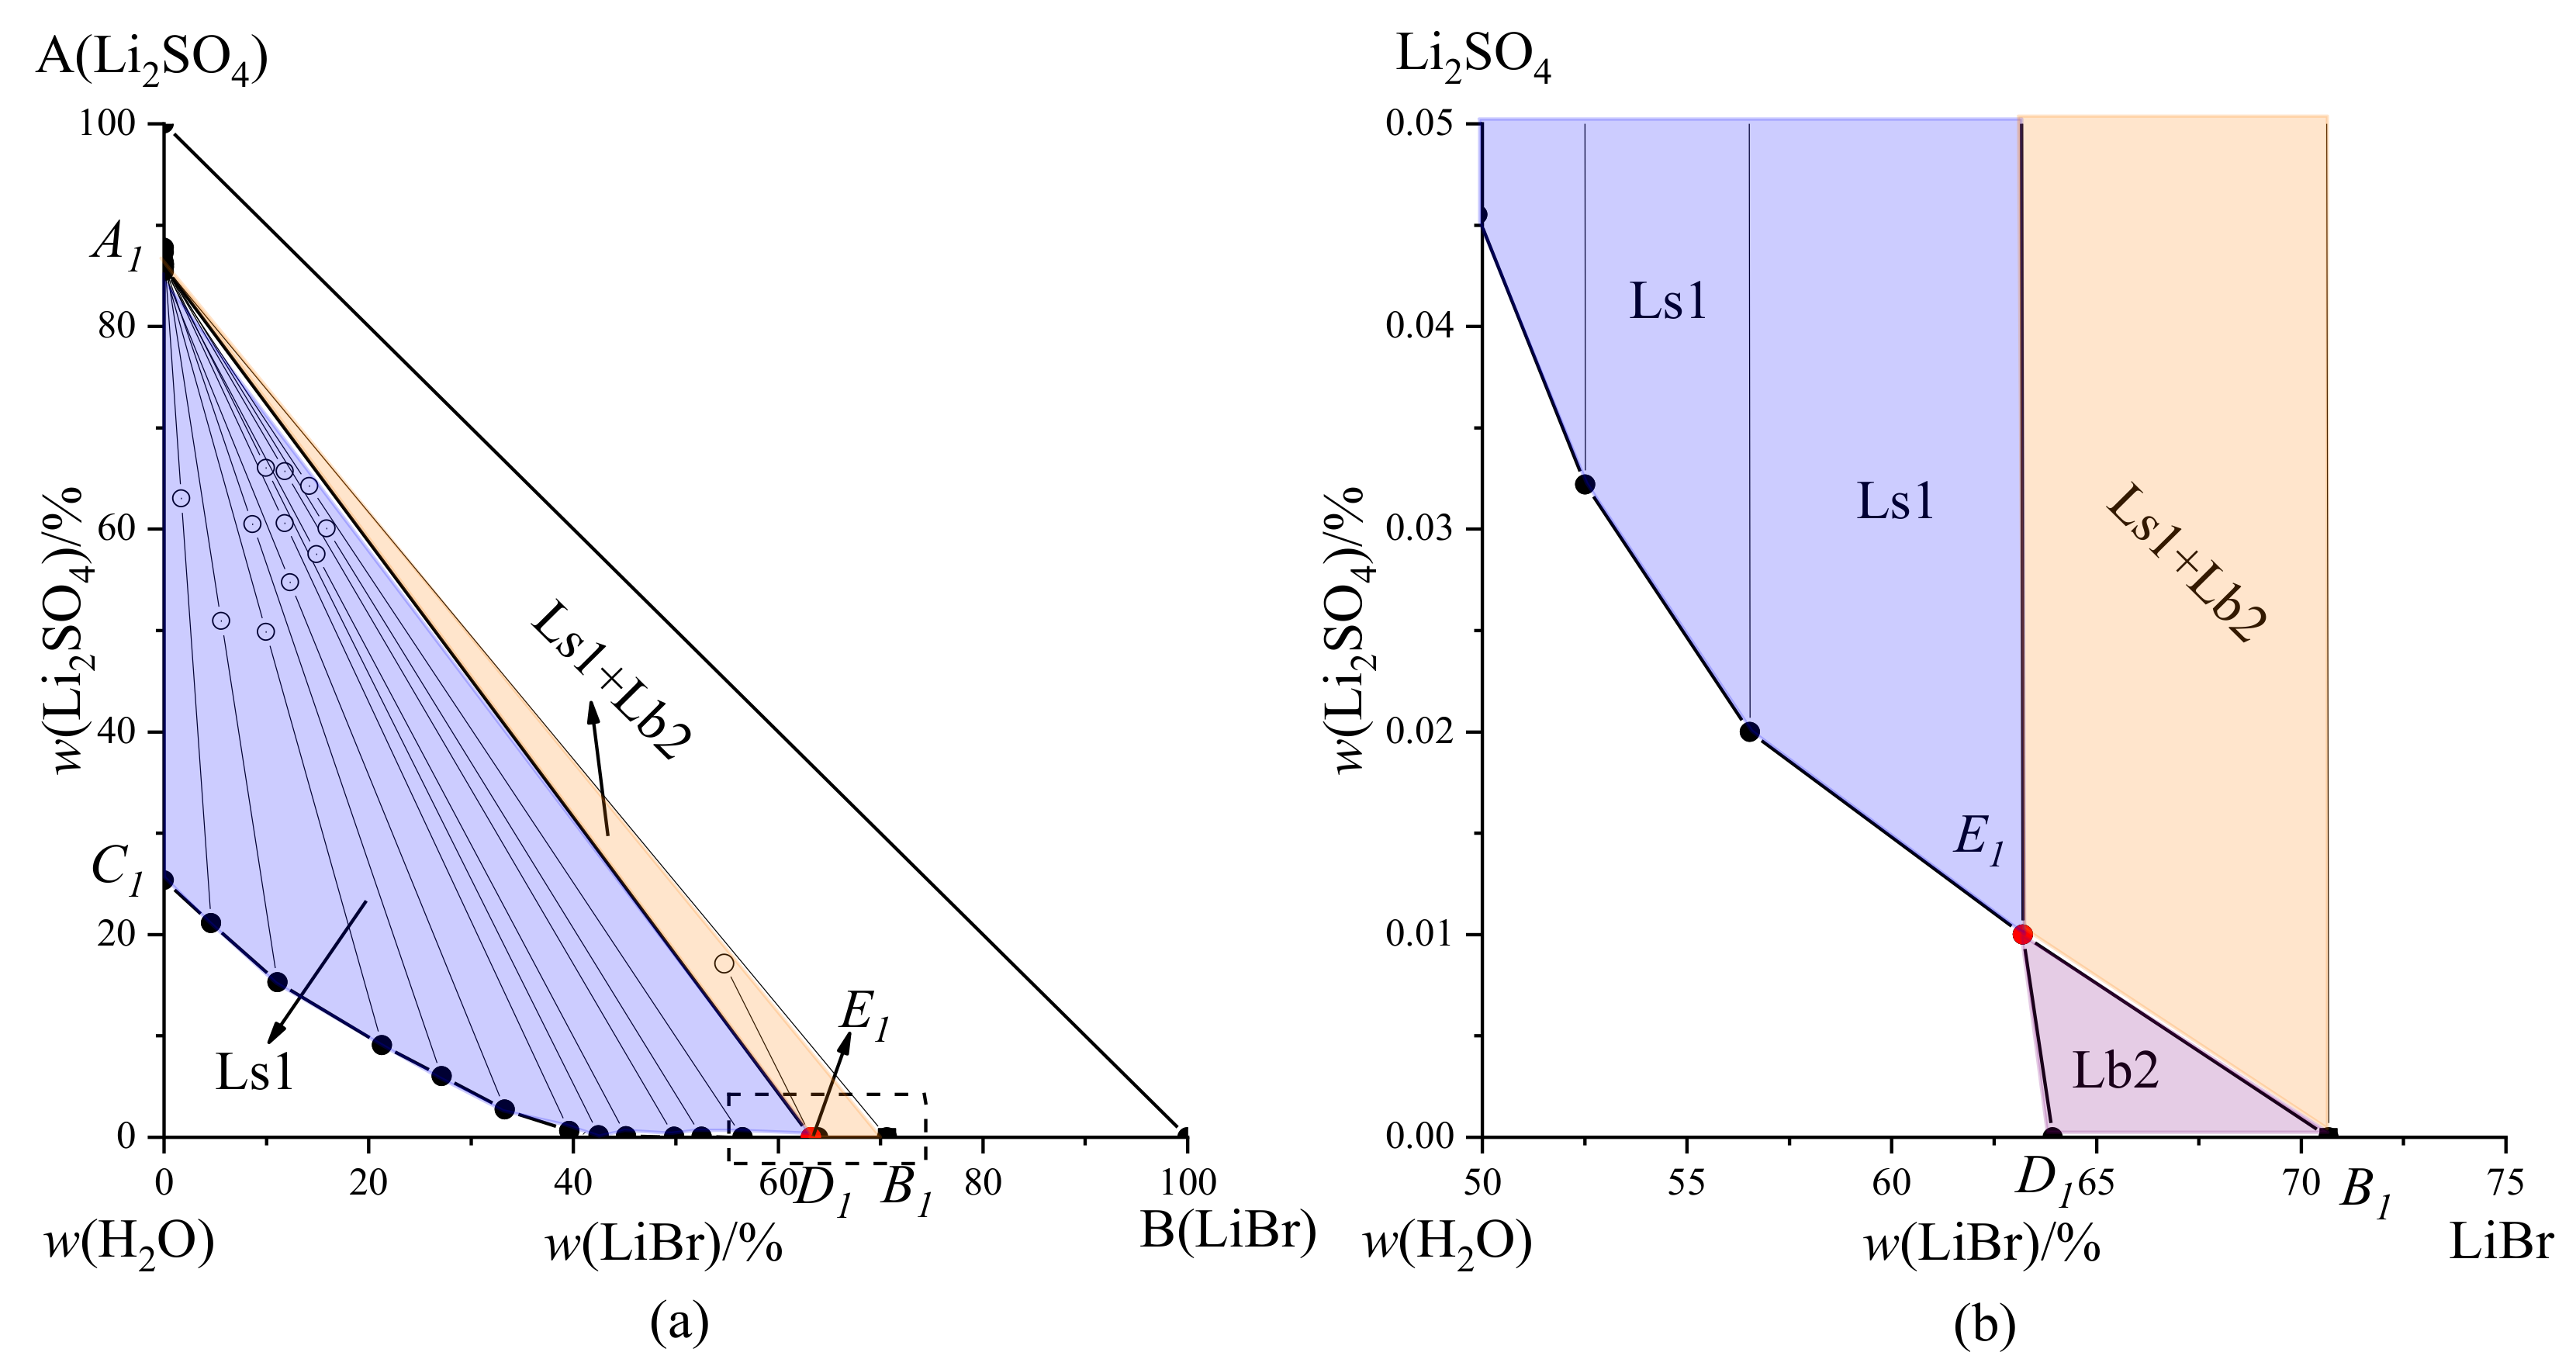
3.1. Phase Equilibrium of the LiBr-Li2SO4-H2O System
Table 3 shows the solubility data in the LiBr-Li
2SO
4-H
2O system at 308.15 K. The XRD characterization patterns of invariant point E
1 are shown in
Figure 1. According to
Table 3, the phase diagram of the LiBr-Li
2SO
4-H
2O system at 308.15 K was drawn (
Figure 2a), and
Figure 2b shows a partially enlarged view near invariant point E
1.
A
1 and B
1 represented the pure solid phase points of Li
2SO
4·H
2O and LiBr·2H
2O (
Figure 2), respectively, C
1 and D
1 were the saturation points of Li
2SO
4-H
2O and LiBr-H
2O, respectively, E
1 denoted the invariant point of the system, and the liquid phase compositions at this point were
w(LiBr) = 63.21%,
w(Li
2SO
4) = 0.01%, and
w(H
2O) = 36.78%. The equilibrium solid phases at this point were Li
2SO
4·H
2O and LiBr·2H
2O. Curve C
1E
1 indicated the solubility curve of Li
2SO
4·H
2O, and curve D
1E
1 corresponded to the solubility curve of LiBr·2H
2O. Fields A
1C
1E
1 and B
1D
1E
1 denoted the crystallization regions of Li
2SO
4·H
2O, and LiBr·2H
2O, respectively. Fields A
1E
1B
1 was the crystallization region of Li
2SO
4·H
2O and LiBr·2H
2O.
The phase diagram consisted of two solid crystalline regions Li
2SO
4·H
2O and LiBr·2H
2O, two solubility curves C
1E
1 and D
1E
1, and one saturation point E
1. The system generated two hydrated salts; therefore, its phase diagram belonged to hydrate type I. The C
1E
1 curve in
Figure 2a indicated that the mass percentage of Li
2SO
4 decreased sharply with LiBr addition. When the mass percentage of LiBr was 39.61%, the content of Li
2SO
4 dropped below 1%, and the crystallization region of LiBr·2H
2O occupied a very small area in the phase diagram. This shows that LiBr had a strong salting-out effect on Li
2SO
4·H
2O, making it easier to separate from the solution.
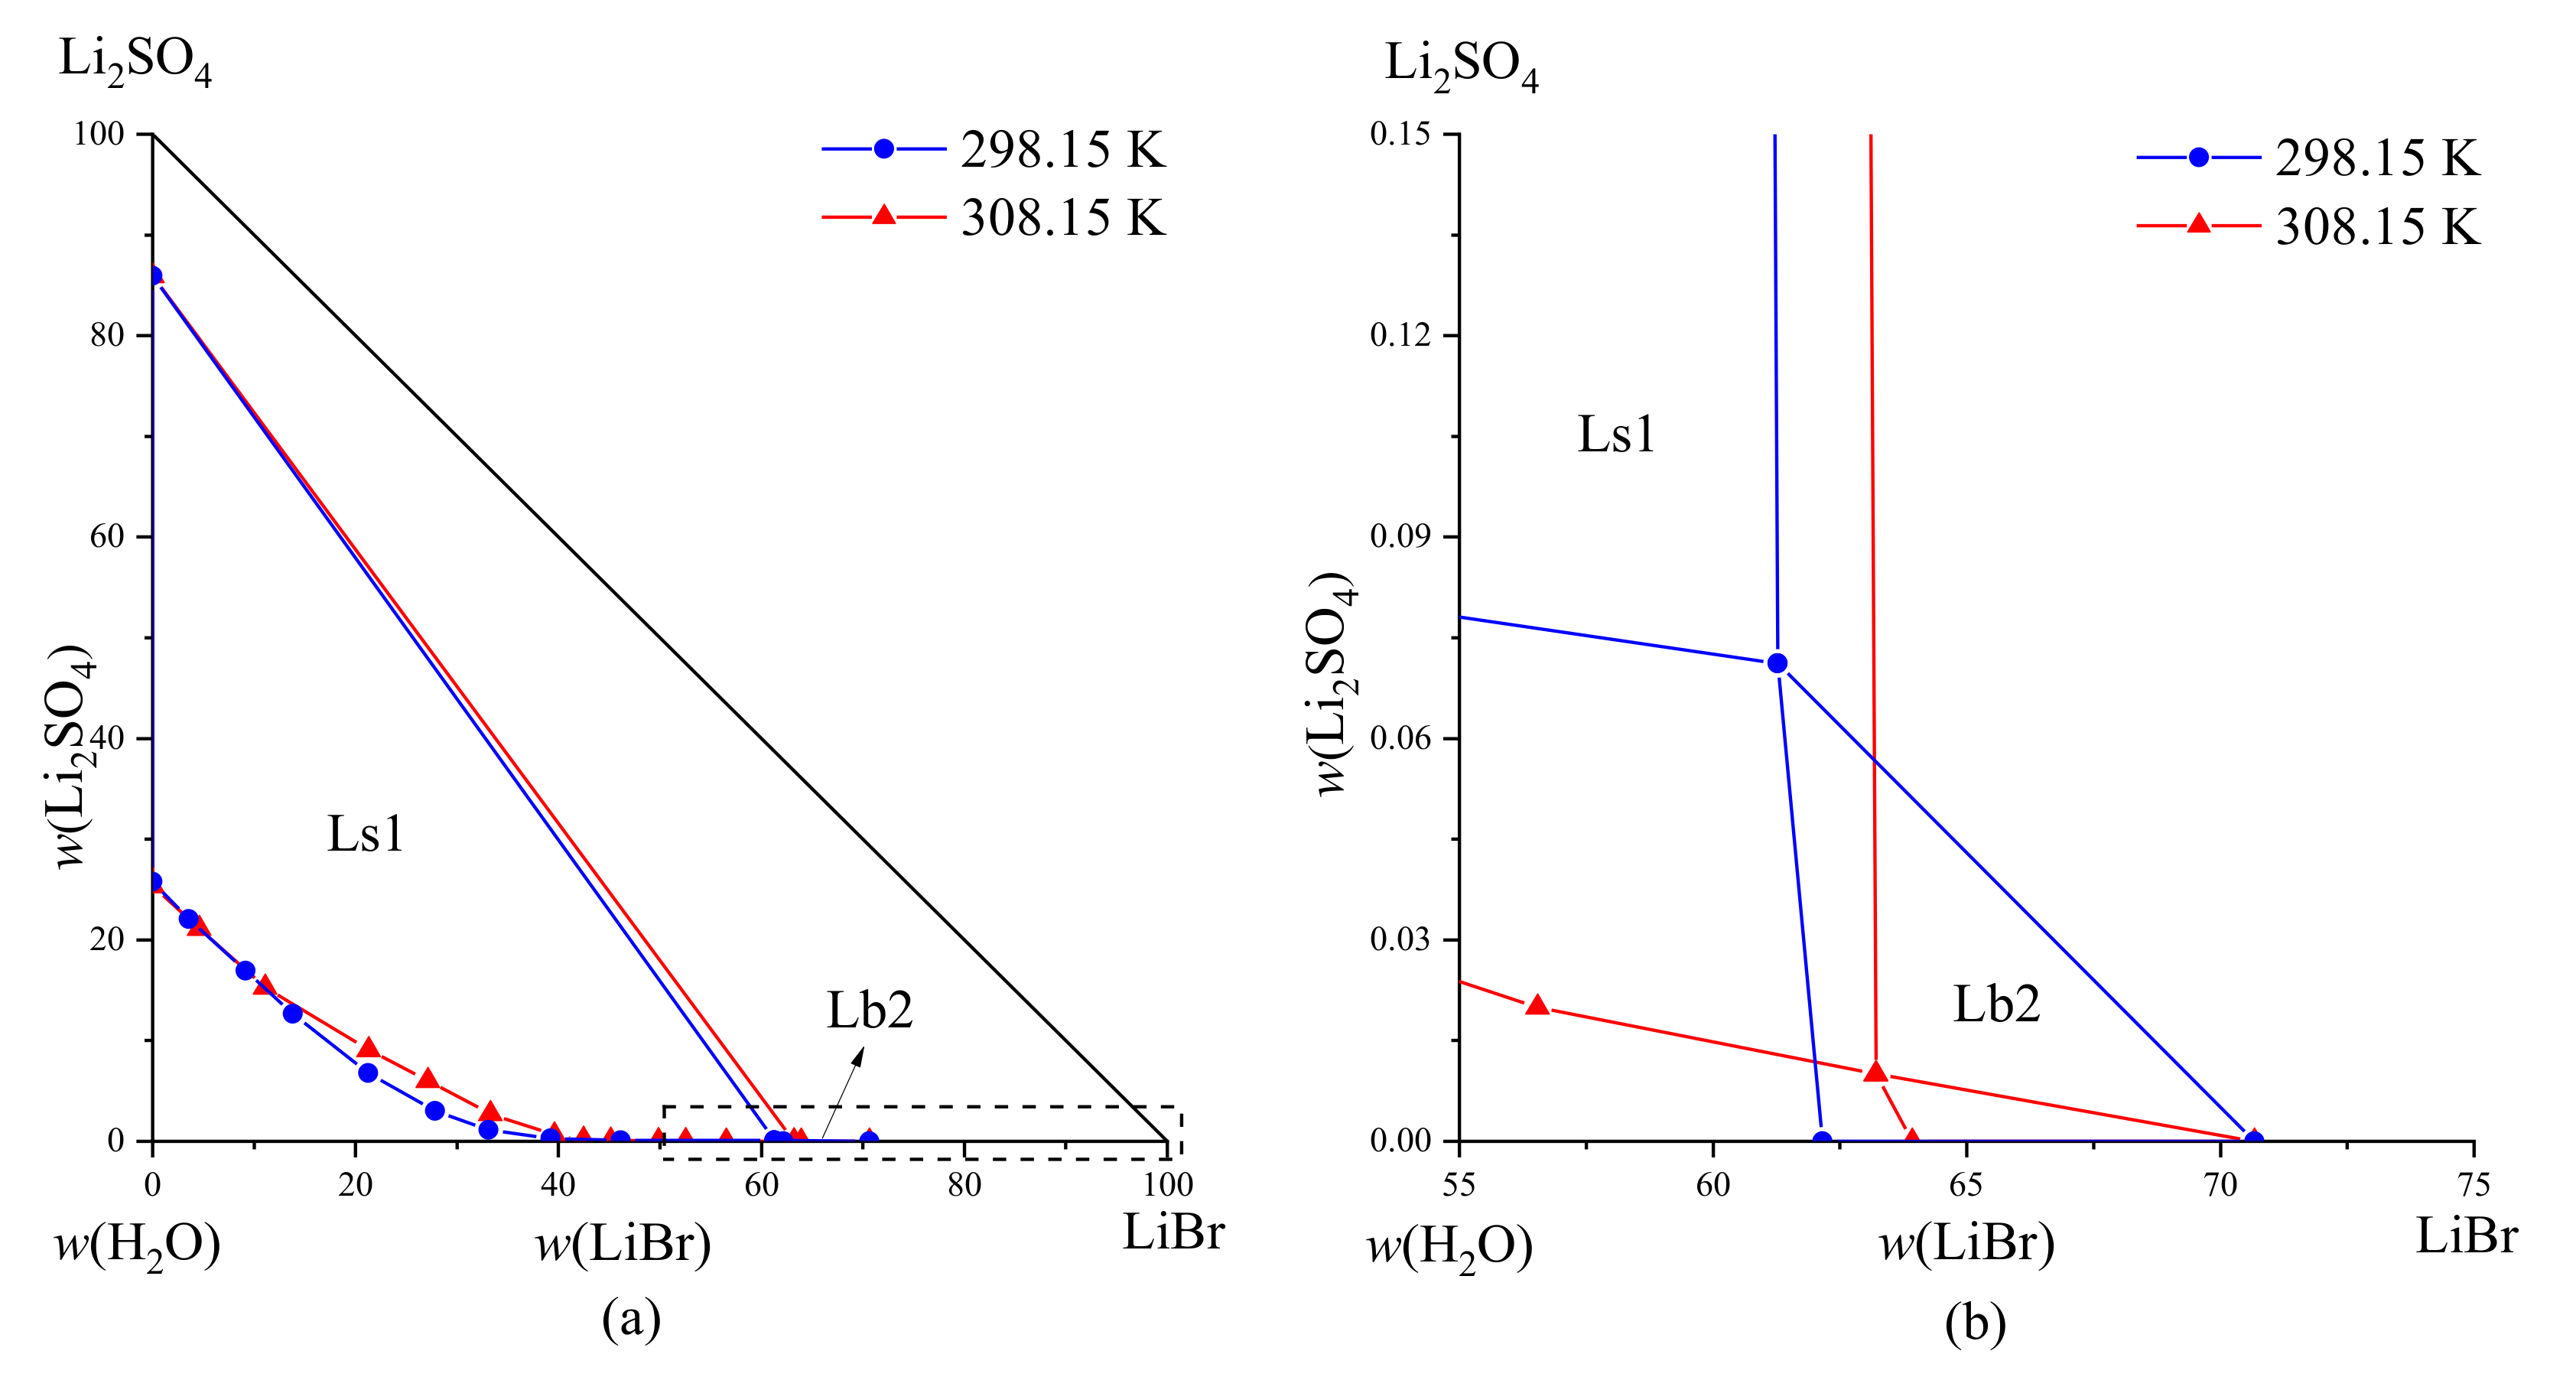
The phase equilibrium data of the LiBr-Li
2SO
4-H
2O system at the co-saturation points of 298.15 K and 308.15 K are shown in
Table 4. The phase diagrams of the system at these two temperatures are shown in
Figure 3. By comparison, we found that the number of saturation points, solubility curves, and crystallization zones of the system were the same at these two temperatures. The equilibrium solid phases corresponding to the saturation point were LiBr·2H
2O and Li
2SO
4·2H
2O. The difference was that when the temperature increased by 10 K, the mass fraction (
w) of Li
2SO
4 in the system decreased from 25.78% to 25.35%, while the mass fraction (
w) of LiBr in the system increased from 62.16% to 63.93%. Meanwhile, the crystallization zone of Li
2SO
4·2H
2O increased while that of LiBr·2H
2O decreased. Based on this observation, we could fabricate an LiBr·2H
2O crystal by lowering the temperature.
3.2. Phase Equilibrium of the KBr-K2SO4-H2O System
Table 5 shows the solubility data of the KBr-K
2SO
4-H
2O system at 308.15 K, where the solid phase was analyzed by XRD characterization. The results indicated that the equilibrium solid phases of sample no. 13 were K
2SO
4 and KBr (
Figure 4). The phase diagram (
Figure 5a) was plotted based on the solubility data, and
Figure 5b presents a partially enlarged view near invariant point E
2.
Points A
2 and B
2 corresponded to solid phases K
2SO
4 and KBr, respectively, while point C
2 and D
2 was the saturation point of K
2SO
4-H
2O and KBr-H
2O (
Figure 5a), where
w(K
2SO
4) was 12.05% and
w(KBr) was 42.21%. In addition, the liquid phase composition was
w(KBr) = 41.77%,
w(K
2SO
4) = 0.59%, and
w(H
2O) = 57.64% in saturated point E
2, and the equilibrium solid phases at this point were KBr and K
2SO
4.
The C
2E
2 curve was the solubility curve of K
2SO
4, where A
2E
2C
2 denoted the crystallization region of K
2SO
4. The solid phase corresponding to the solubility curve D
2E
2 in the partially enlarged view shown in
Figure 5b was KBr, and B
2D
2E
2 was the crystallization region of KBr. As shown in
Figure 5a, the region occupied by A
2E
2C
2 in the triangle was considerably larger than B
2D
2E
2, indicating that the crystallization region of KBr in this system was smaller than that of K
2SO
4, and had a strong salting-out effect on K
2SO
4. This system did not generate a solid solution or hydrated salts at 308.15 K; thus, it consisted of a simple phase diagram.
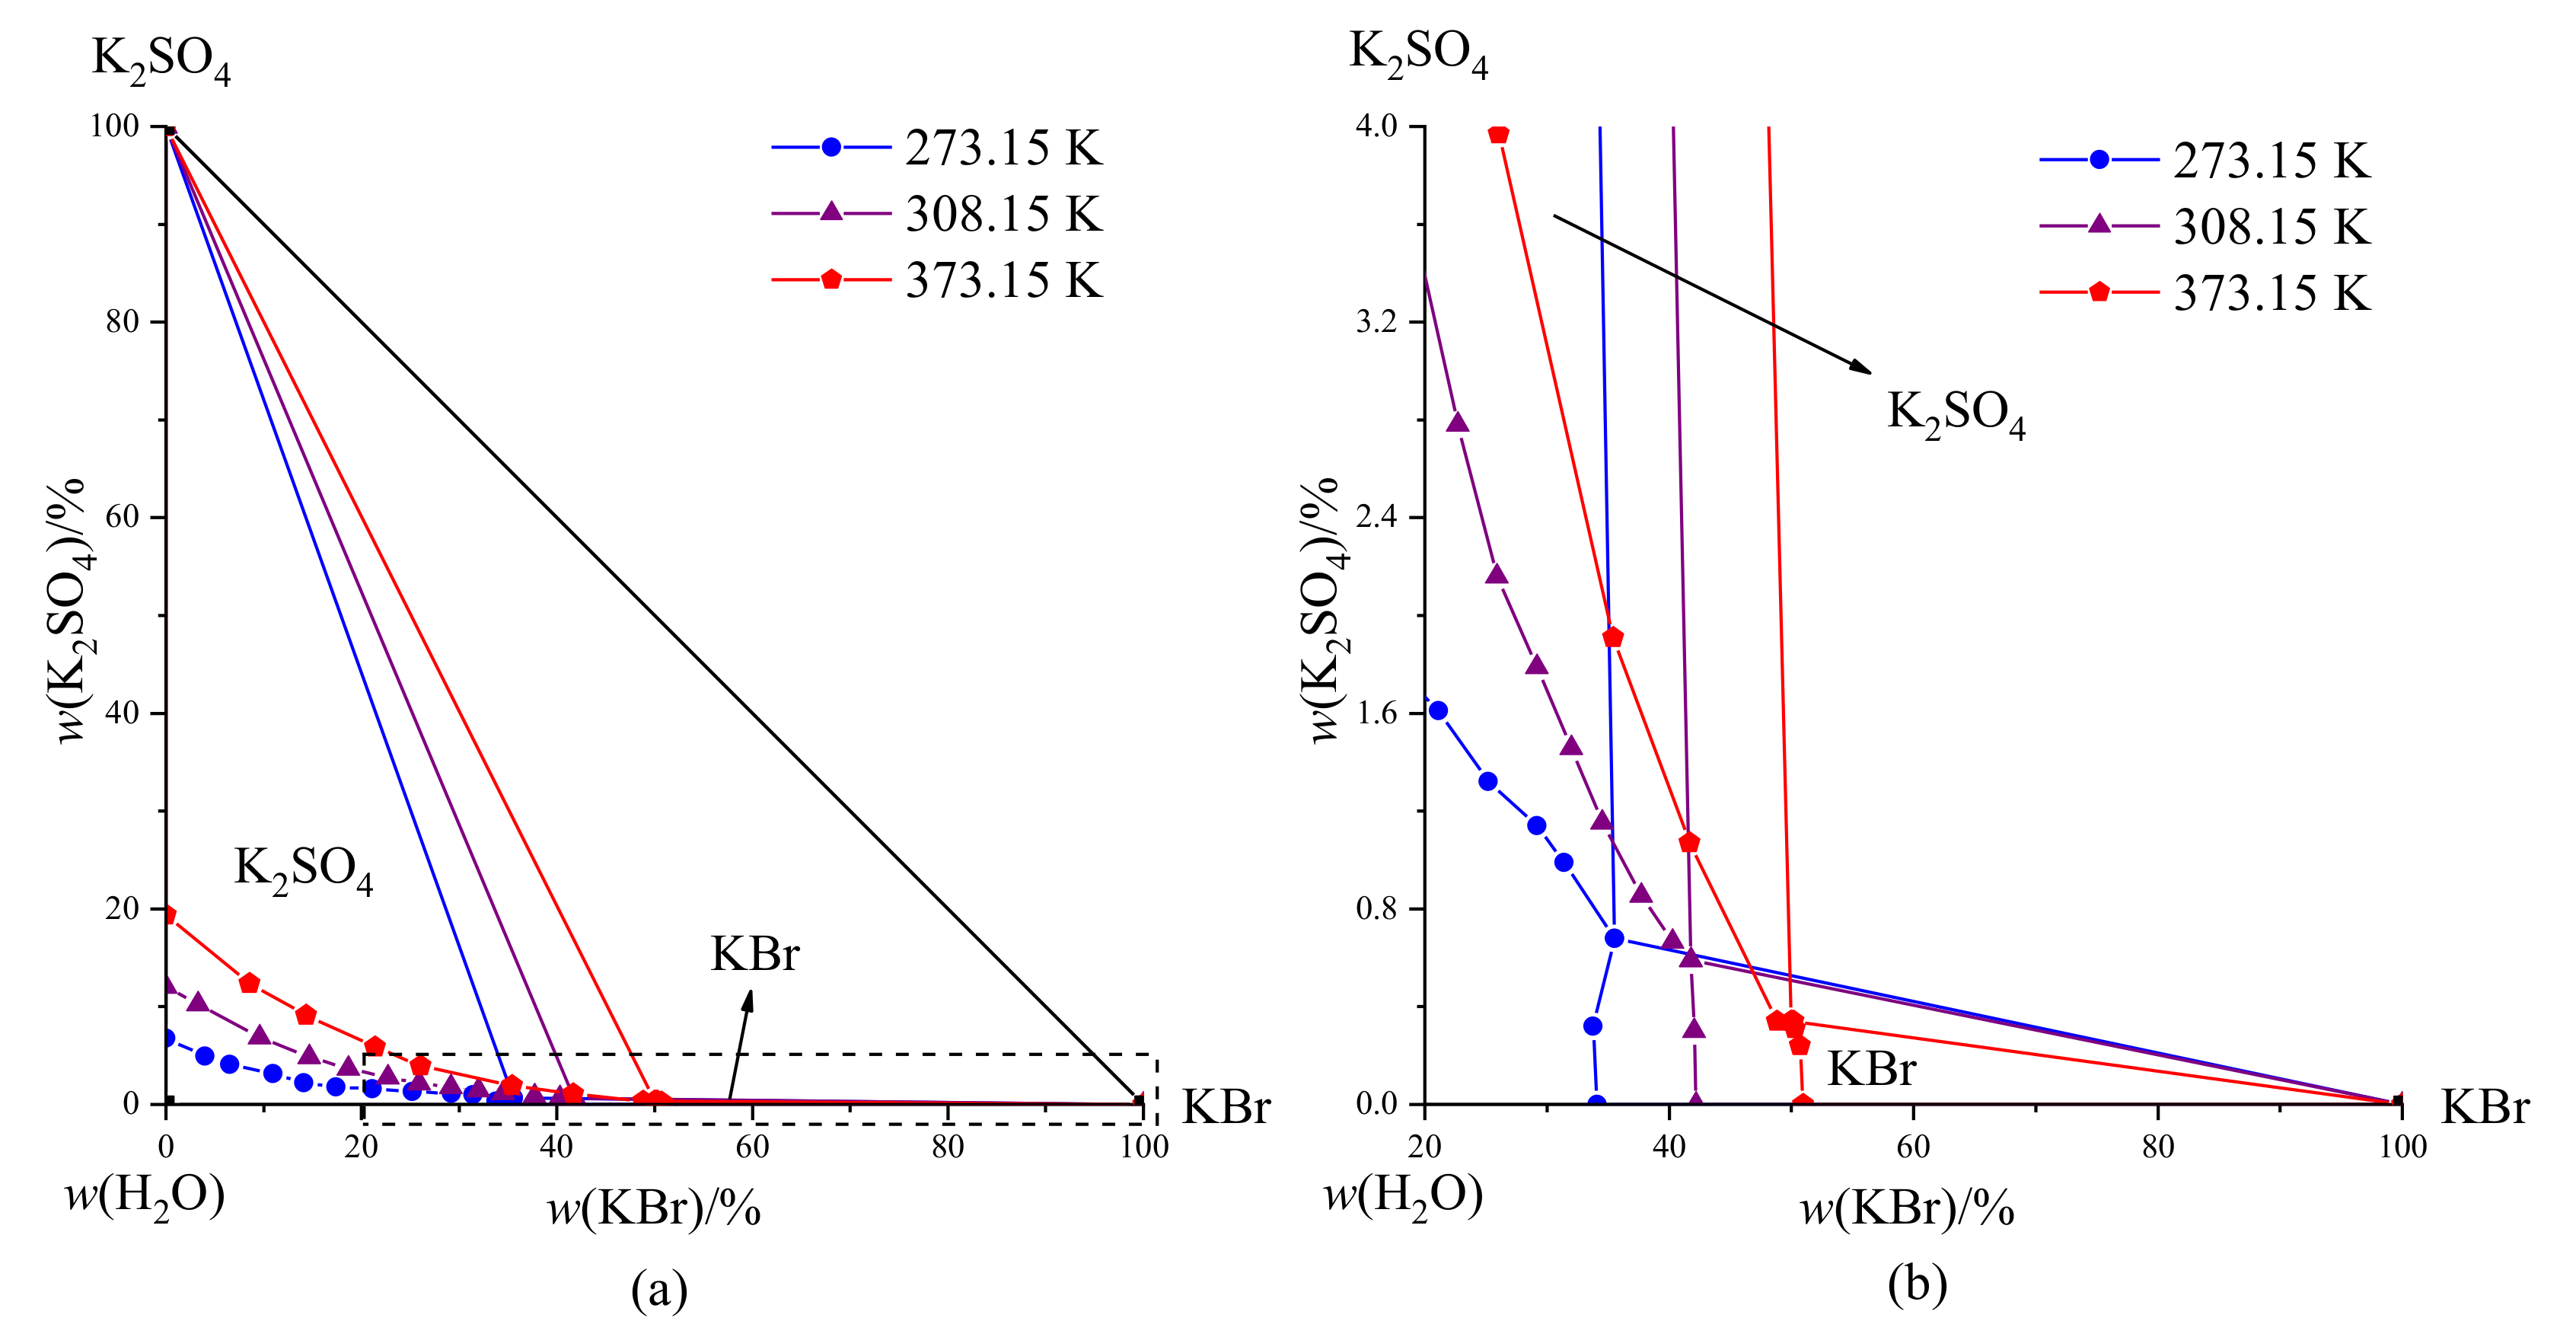
Table 6 lists the phase equilibrium data of the co-saturation points of the KBr-K
2SO
4-H
2O system at different temperatures. A comparison of phase diagrams is shown in
Figure 6. The results show that the phase diagrams had the same characteristics at these three different temperatures, and the equilibrium solid phases corresponding to the saturation point were KBr and K
2SO
4. The mass percentage of K
2SO
4 in the K
2SO
4-H
2O system increased from 6.78% to 19.4%, and the mass percentage of KBr in the KBr-H
2O system increased from 34.11% to 50.98% when the temperature increased by 100 K. By analyzing the data of the saturation points at different temperatures, we found that KBr had a strong salting-out effect on K
2SO
4. These observations provided a scientific basis for the extraction and separation of K
2SO
4.
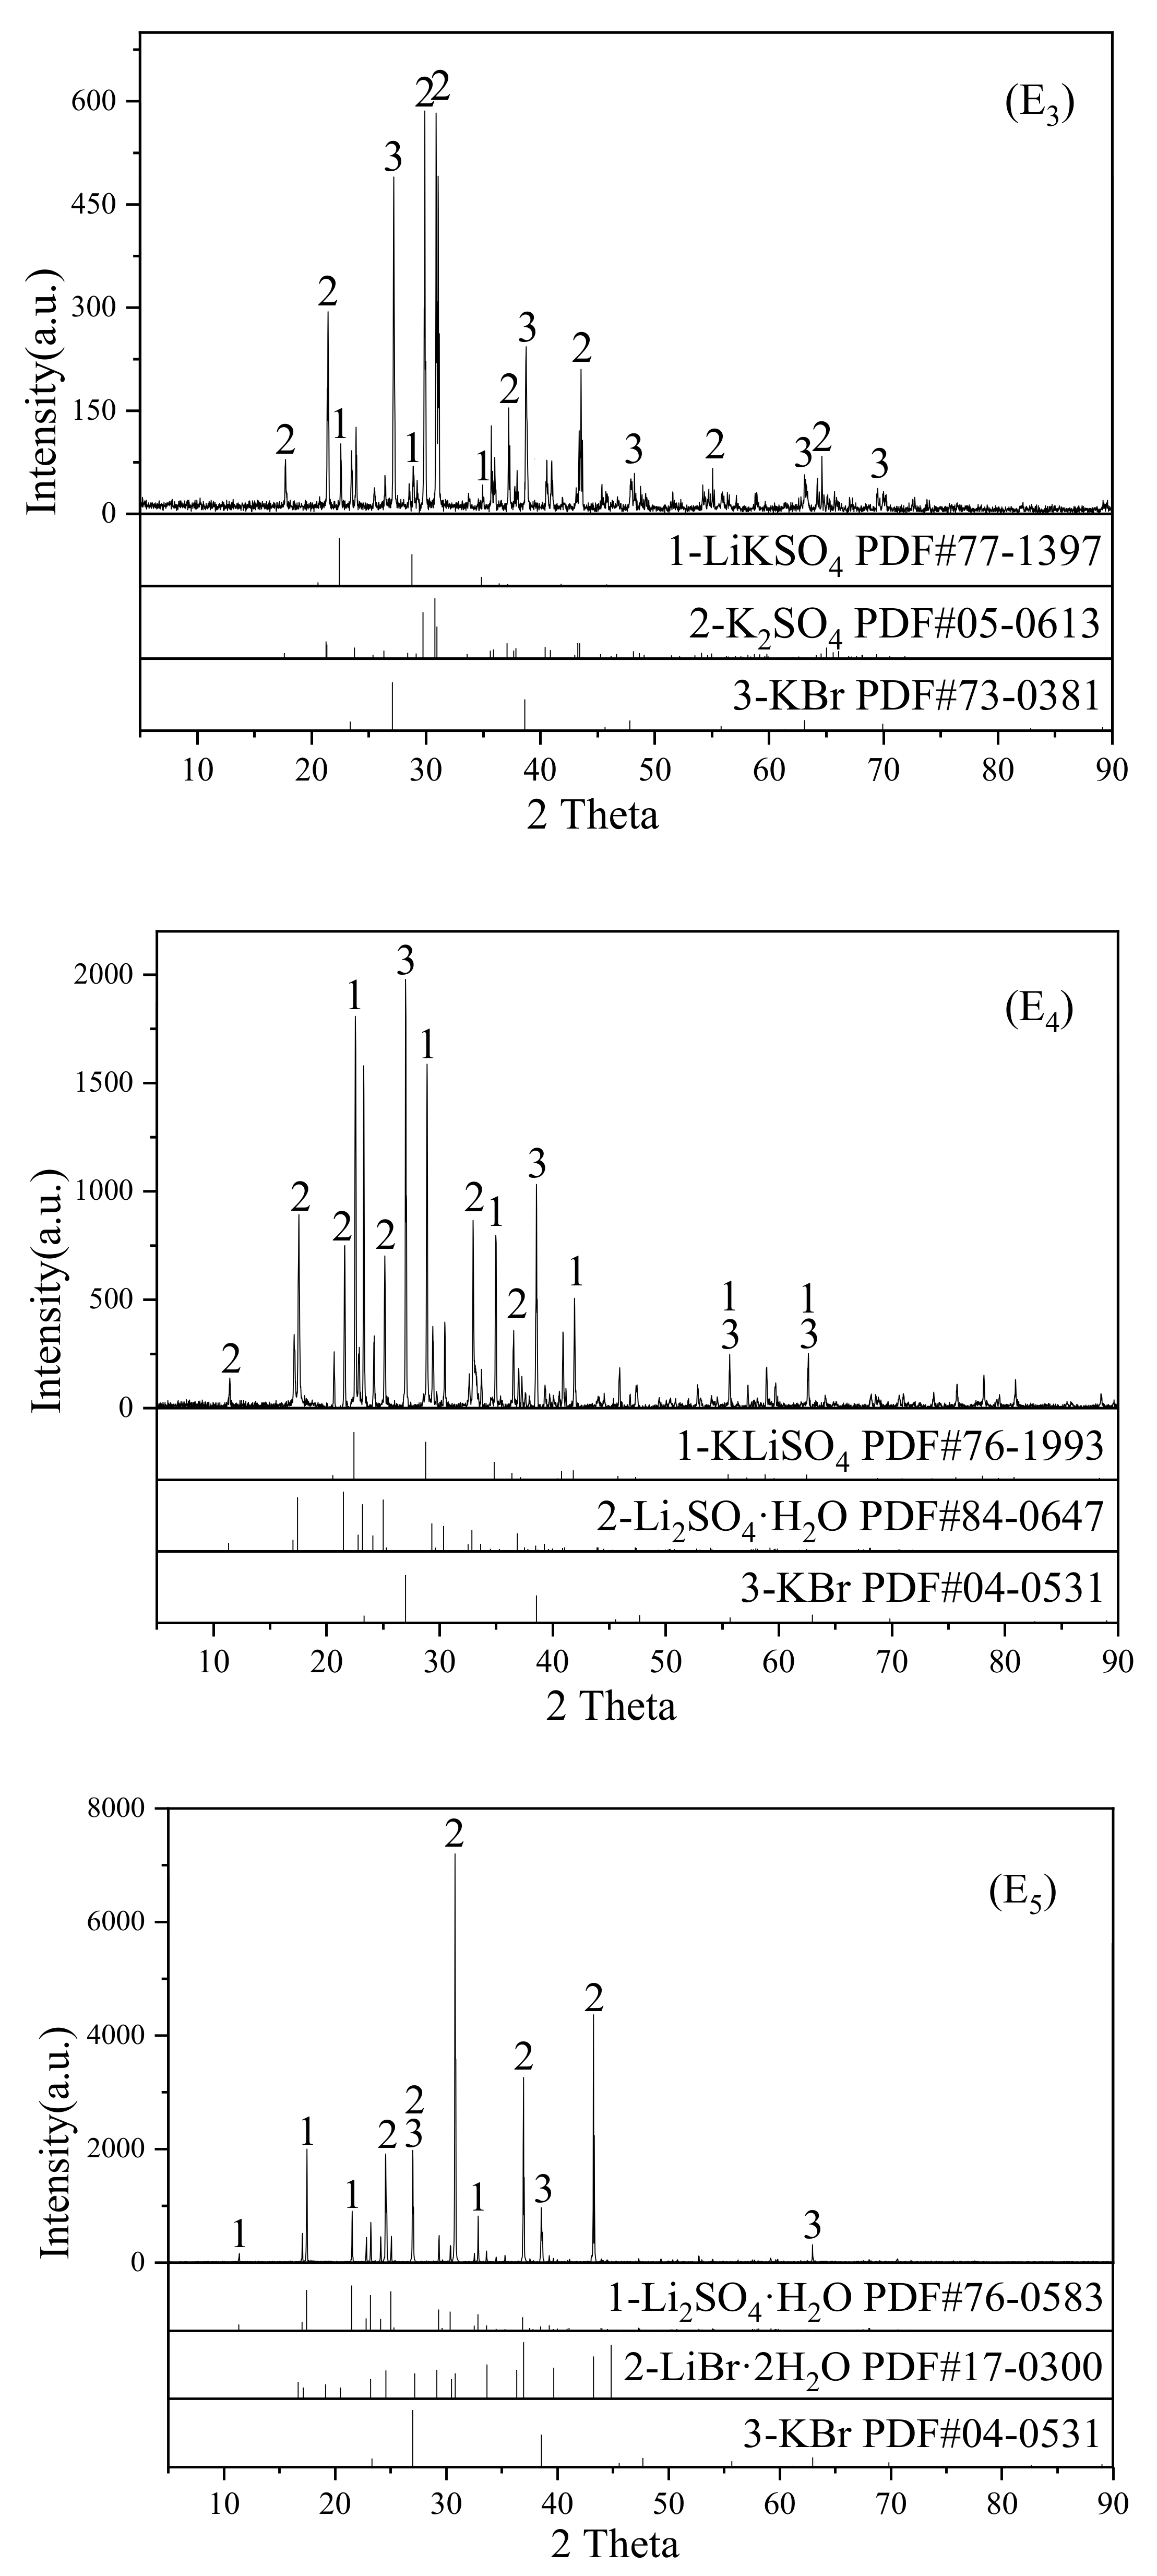
3.3. Phase Equilibrium of the LiBr-Li2SO4-KBr-K2SO4-H2O System
Table 7 shows the solubility data of the LiBr-Li
2SO
4-KBr-K
2SO
4-H
2O system at 308.15 K. The XRD characterization results of the solid phase at invariant points E
3, E
4, and E
5 are shown in
Figure 7. The dry salt phase diagram of the LiBr-Li
2SO
4-KBr-K
2SO
4-H
2O quaternary system at 308.15 K was plotted according to
Table 7, as shown in
Figure 8. Points A
3, B
3, C
3, D
3, and F
3 corresponded to the saturation points of each ternary subsystem. The liquid phase composition of each point is presented in
Table 7. According to the XRD characterization results, the LiBr-Li
2SO
4-KBr-K
2SO
4-H
2O system contained three saturated points (E
3, E
4, and E
5). The equilibrium solid phases at point E
3 were K
2SO
4, KBr and K
2SO
4·Li
2SO
4, and all ion contents for this composition at this point were
w(K
+) = 8.79%,
w(Li
+) = 1.04%,
w(Br
−) = 28.54%, and
w(SO
42−) = 0.87%. The equilibrium solid phases at point E
4 were KBr, Li
2SO
4·H
2O, and K
2SO
4·Li
2SO
4, and all ion contents for this composition were
w(K
+) = 0.96%,
w(Li
+) = 3.57%,
w(Br
−) = 42.91%, and w(SO
42−) = 0.08%. The equilibrium solid phases at point E
5 were Li
2SO
4·H
2O, LiBr·2H
2O, and KBr, and all ion contents for this composition were
w(K
+) = 0.74%,
w(Li
+) = 5.02%,
w(Br
−) = 59.26%, and
w(SO
42−) = 0.01%.
Figure 8 shows that there were seven solubility curves, namely, A
3E
3, B
3E
4, C
3E
3, E
3E
4, E
4E
5, D
3E
5, and F
3E
5. The corresponding equilibrium solid phases of A
3E
3 were K
2SO
4 and K
2SO
4·Li
2SO
4, while the corresponding equilibrium solid phases of B
3E
4 were K
2SO
4·Li
2SO
4 and Li
2SO
4·H
2O, those of C
3E
3 were K
2SO
4 and KBr, those of E
3E
4 were K
2SO
4·Li
2SO
4 and KBr, those of E
4E
5 were KBr and Li
2SO
4·H
2O, those of D
3E
5 were Li
2SO
4·H
2O and LiBr·2H
2O, and those of F
3E
5 were KBr and LiBr·2H
2O. There were five crystallization regions, among which A
3E
3C
3, A
3E
3E
4B
3, C
3E
3E
4E
5F
3, B
3E
4E
5D
3, D
3E
5F
3 corresponded to the crystalline regions of K
2SO
4, K
2SO
4·Li
2SO
4, KBr, Li
2SO
4·H
2O, and LiBr·2H
2O. The area in each crystalline region was different, and among these, the crystalline region of K
2SO
4 was the largest, accounting for more than 50% of the phase diagram followed by K
2SO
4·Li
2SO
4 double salt, which accounted for about 30–40%, Li
2SO
4·H
2O and KBr accounted for a few percent, and the crystallization region of LiBr·2H
2O was very small.
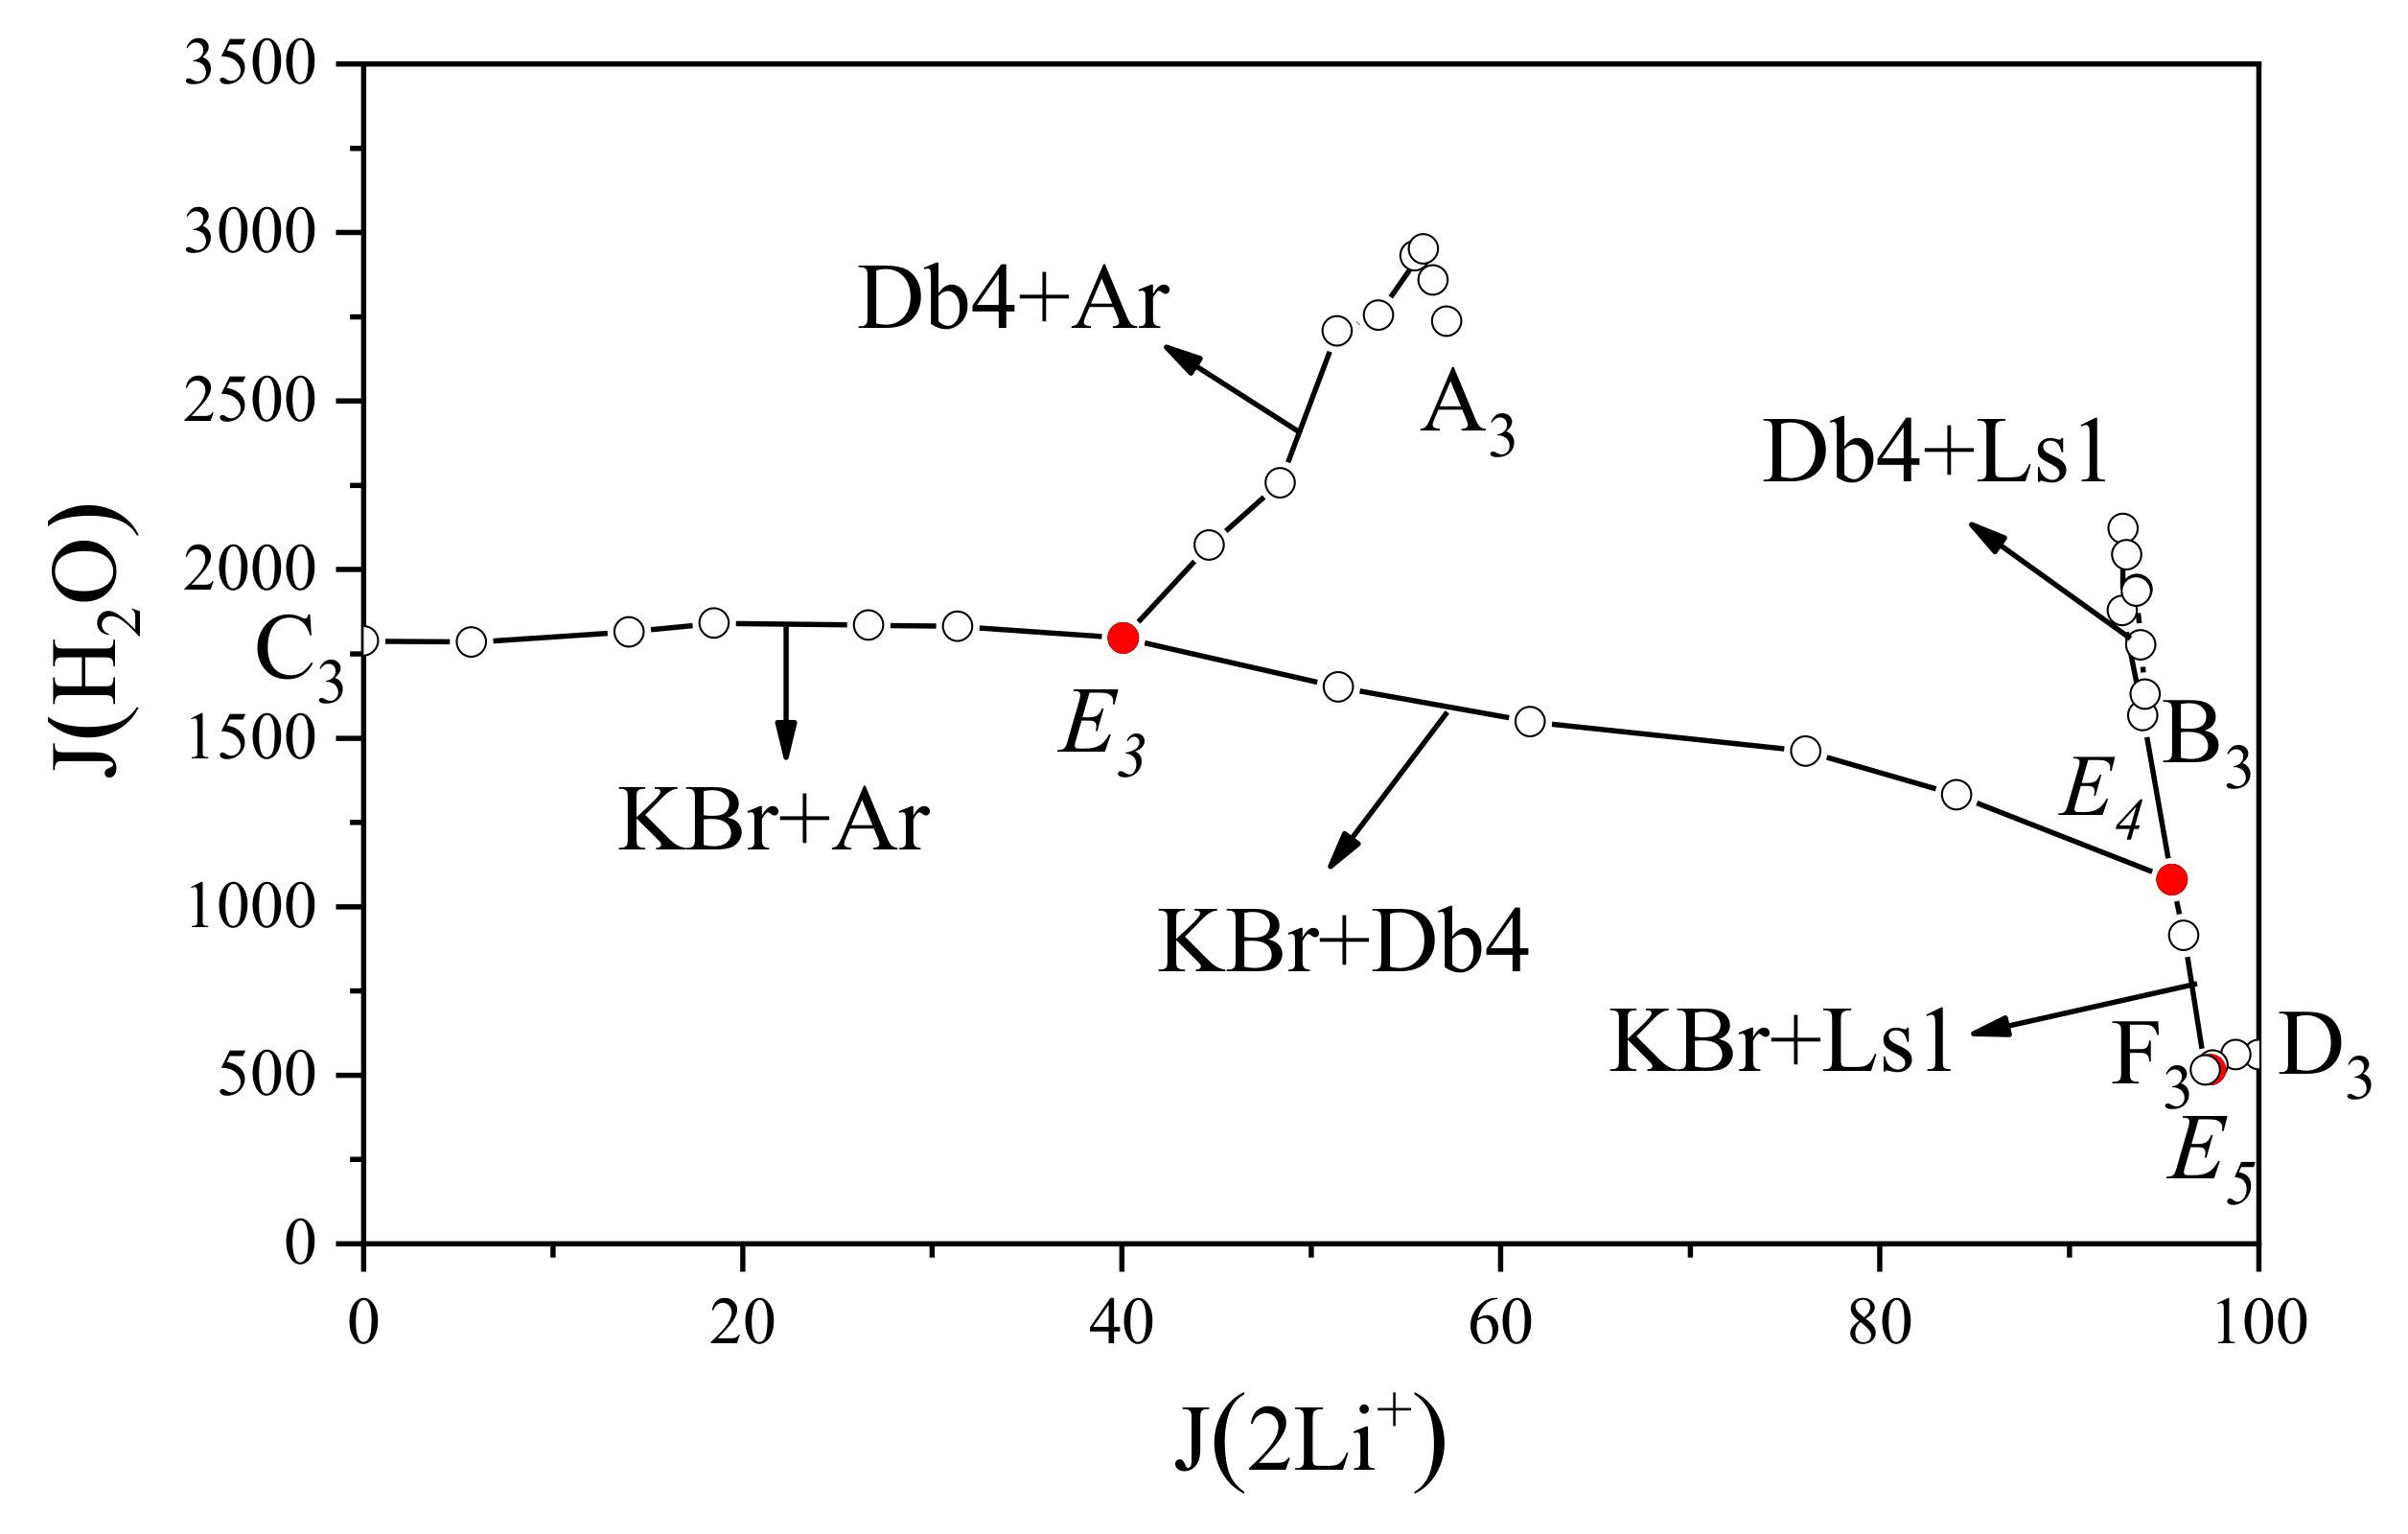
Figure 9 shows the water diagram of this quaternary system plotted with J(2Li
+) and J(H
2O). The solubility curve C
3E
3 corresponding to K
2SO
4 and KBr shows smooth fluctuations, indicating that the addition of Li
2SO
4 had a weak effect on the equilibrium. In the solubility curves A
3E
3, B
3E
4, and E
4E
5, the value of J(H
2O) varied greatly with J(2Li
+), indicating that Br
−-containing salts had a great influence on the phase equilibrium of this system. The values of J(H
2O) near invariant points E
4 and E
5 were substantially lower than the other parts, suggesting that the mass percentage of H
2O in the solution near the crystallization region of LiBr·2H
2O was the smallest. A comprehensive analysis of the system shows that K
2SO
4 crystals most readily precipitated from the system, followed by K
2SO
4·Li
2SO
4 double salt crystals, and the LiBr·2H
2O crystals had the most difficulty precipitating from the system. Bromide salts had a strong salting-out effect on sulfate.
By summarizing the phase diagrams of the related systems, we found that double salts occurred in sulfate-containing systems that also contained two of the three elements of lithium, sodium, and potassium [
21,
22,
23,
24,
25,
26,
27], for example, K
2SO
4·Li
2SO
4, Na
2SO
4·Li
2SO
4, and Na
2SO
4·3K
2SO
4. After comparing the phase diagrams of the systems, we found that the region of the double salt was relatively large, indicating that the double salt had weak solubility and could be easily separated from the system. However, the salts formed by Cl
−, Br
−, as well as alkali metals and their hydrated salts, which exhibited strong solubility in the system, were difficult to separate from the system.


