
Depositional Environment Changes during the Cenozoic in the Northeastern Margin of the Qinghai–Tibet Plateau

 , ,
, ,  , ,
, ,
Abstract
1. Introduction
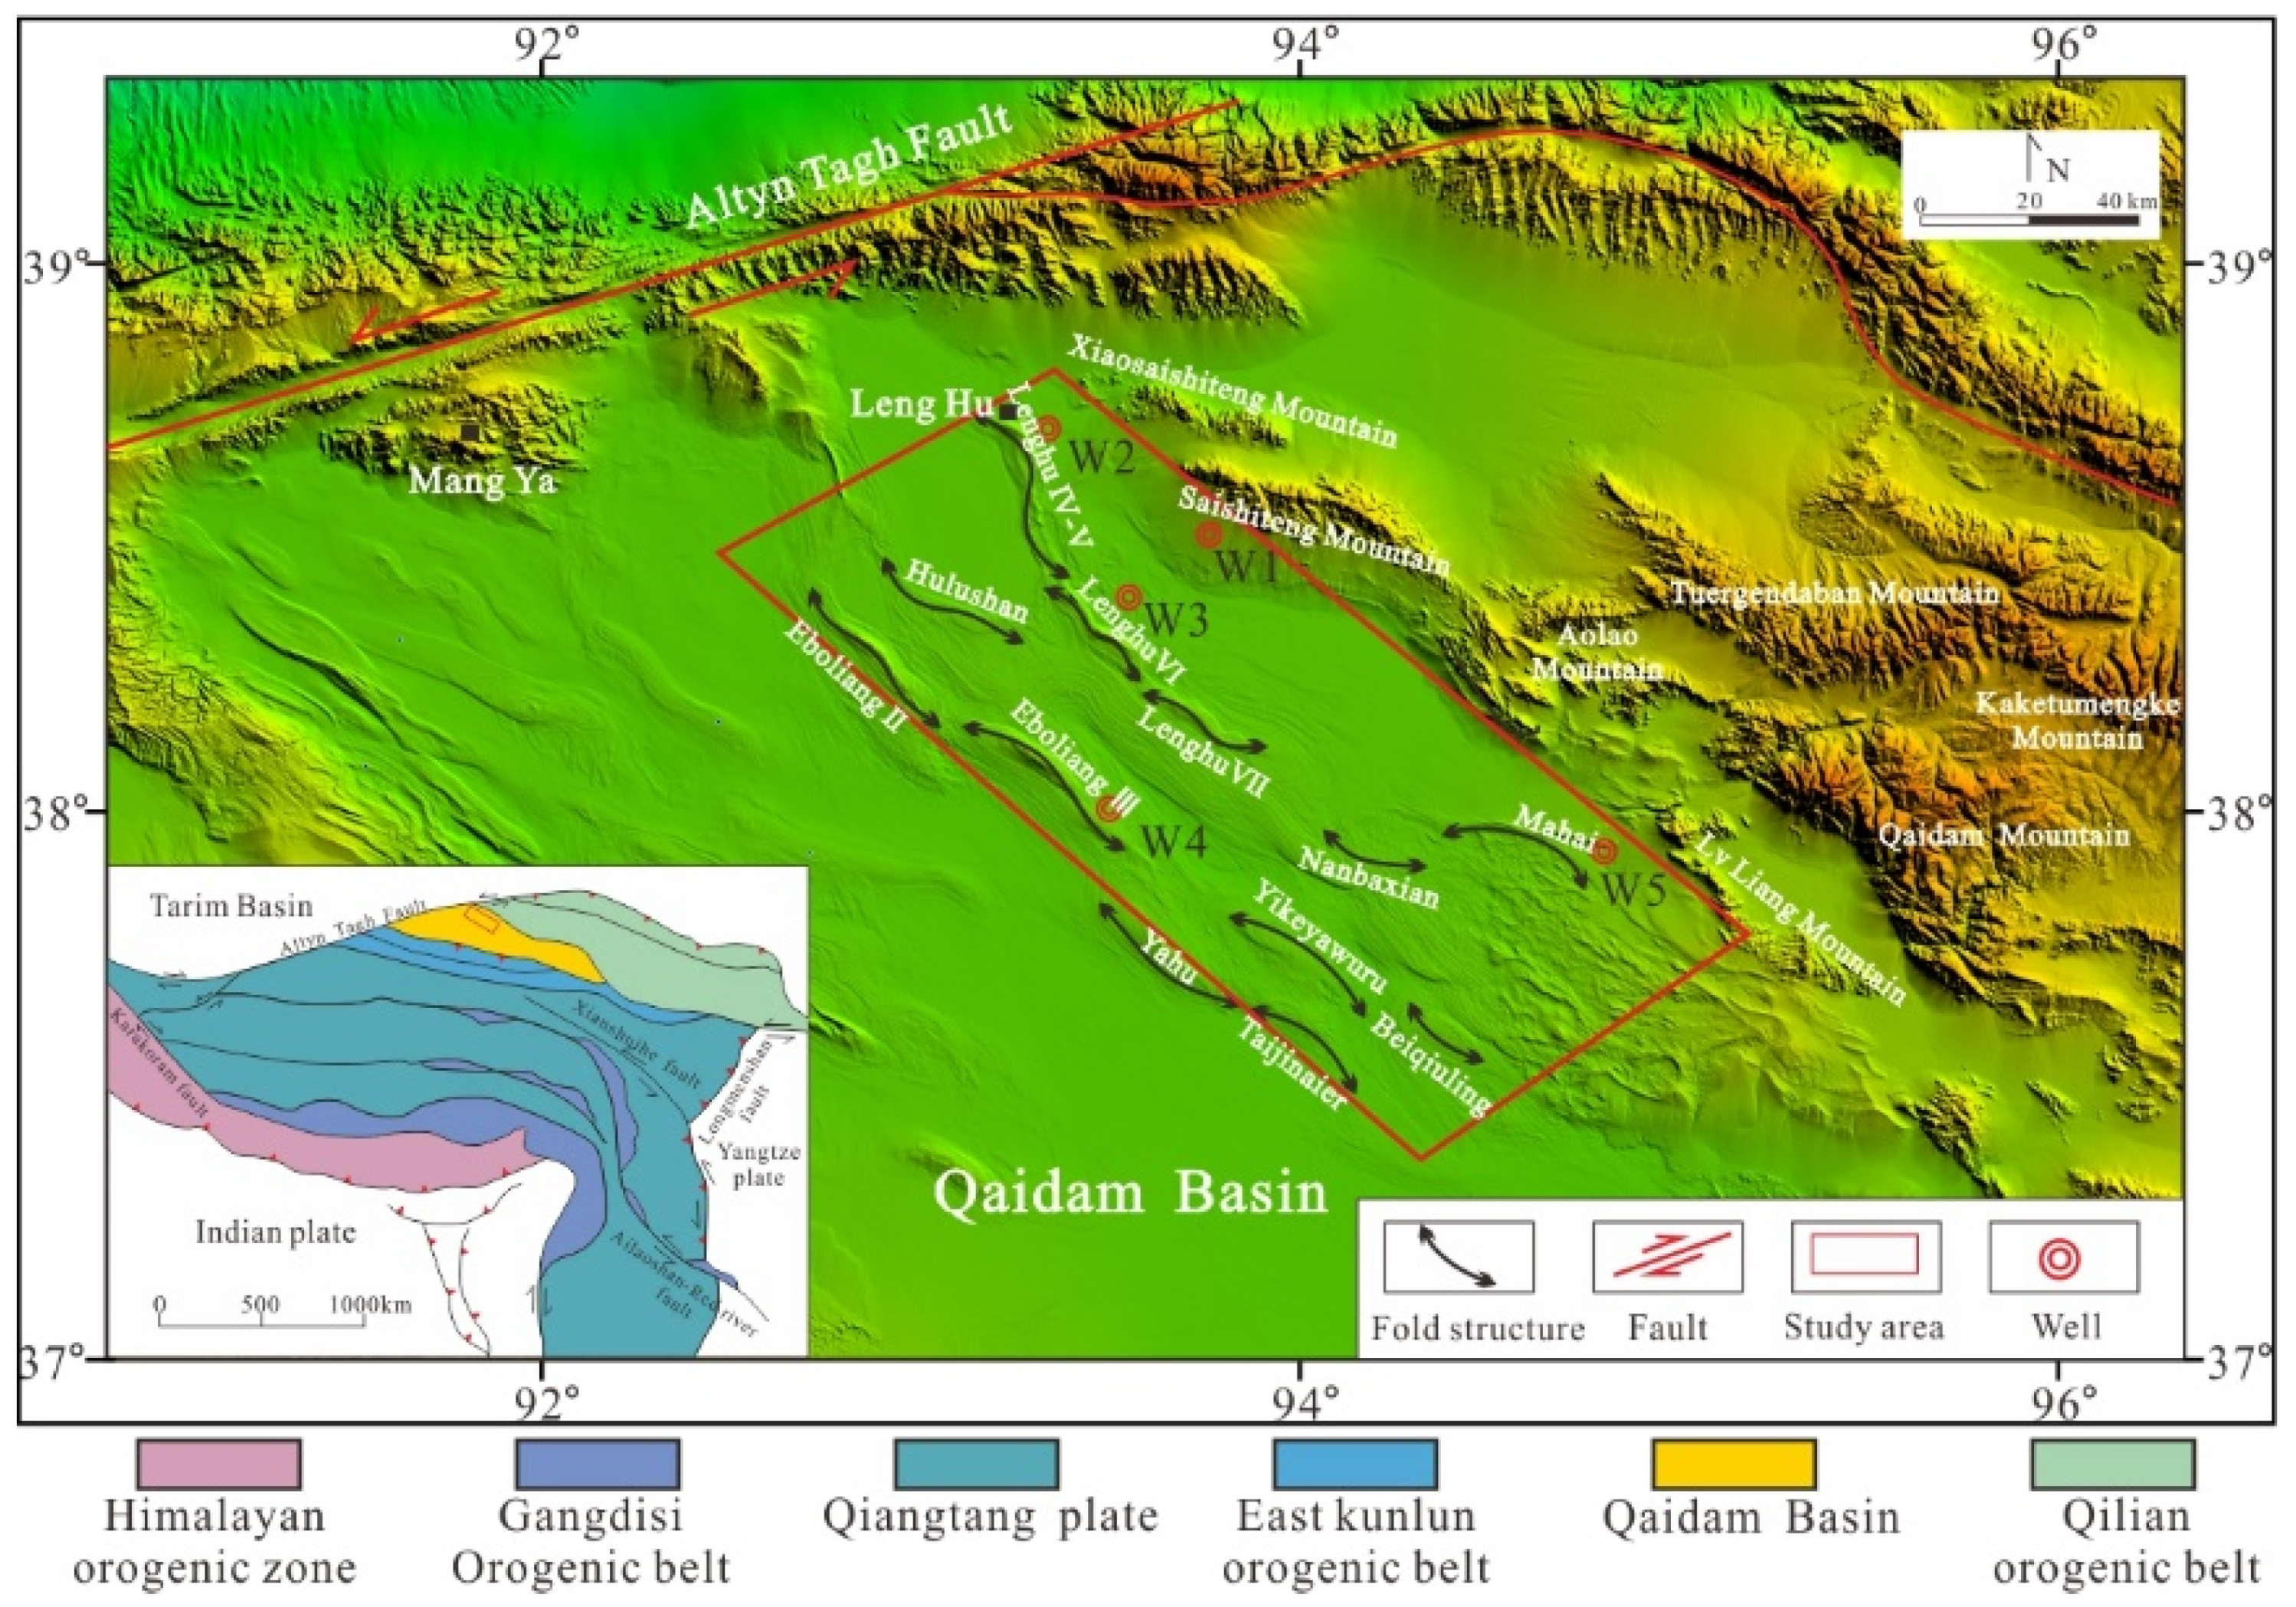
2. Geological Setting
3. Samples and Methods
4. Results
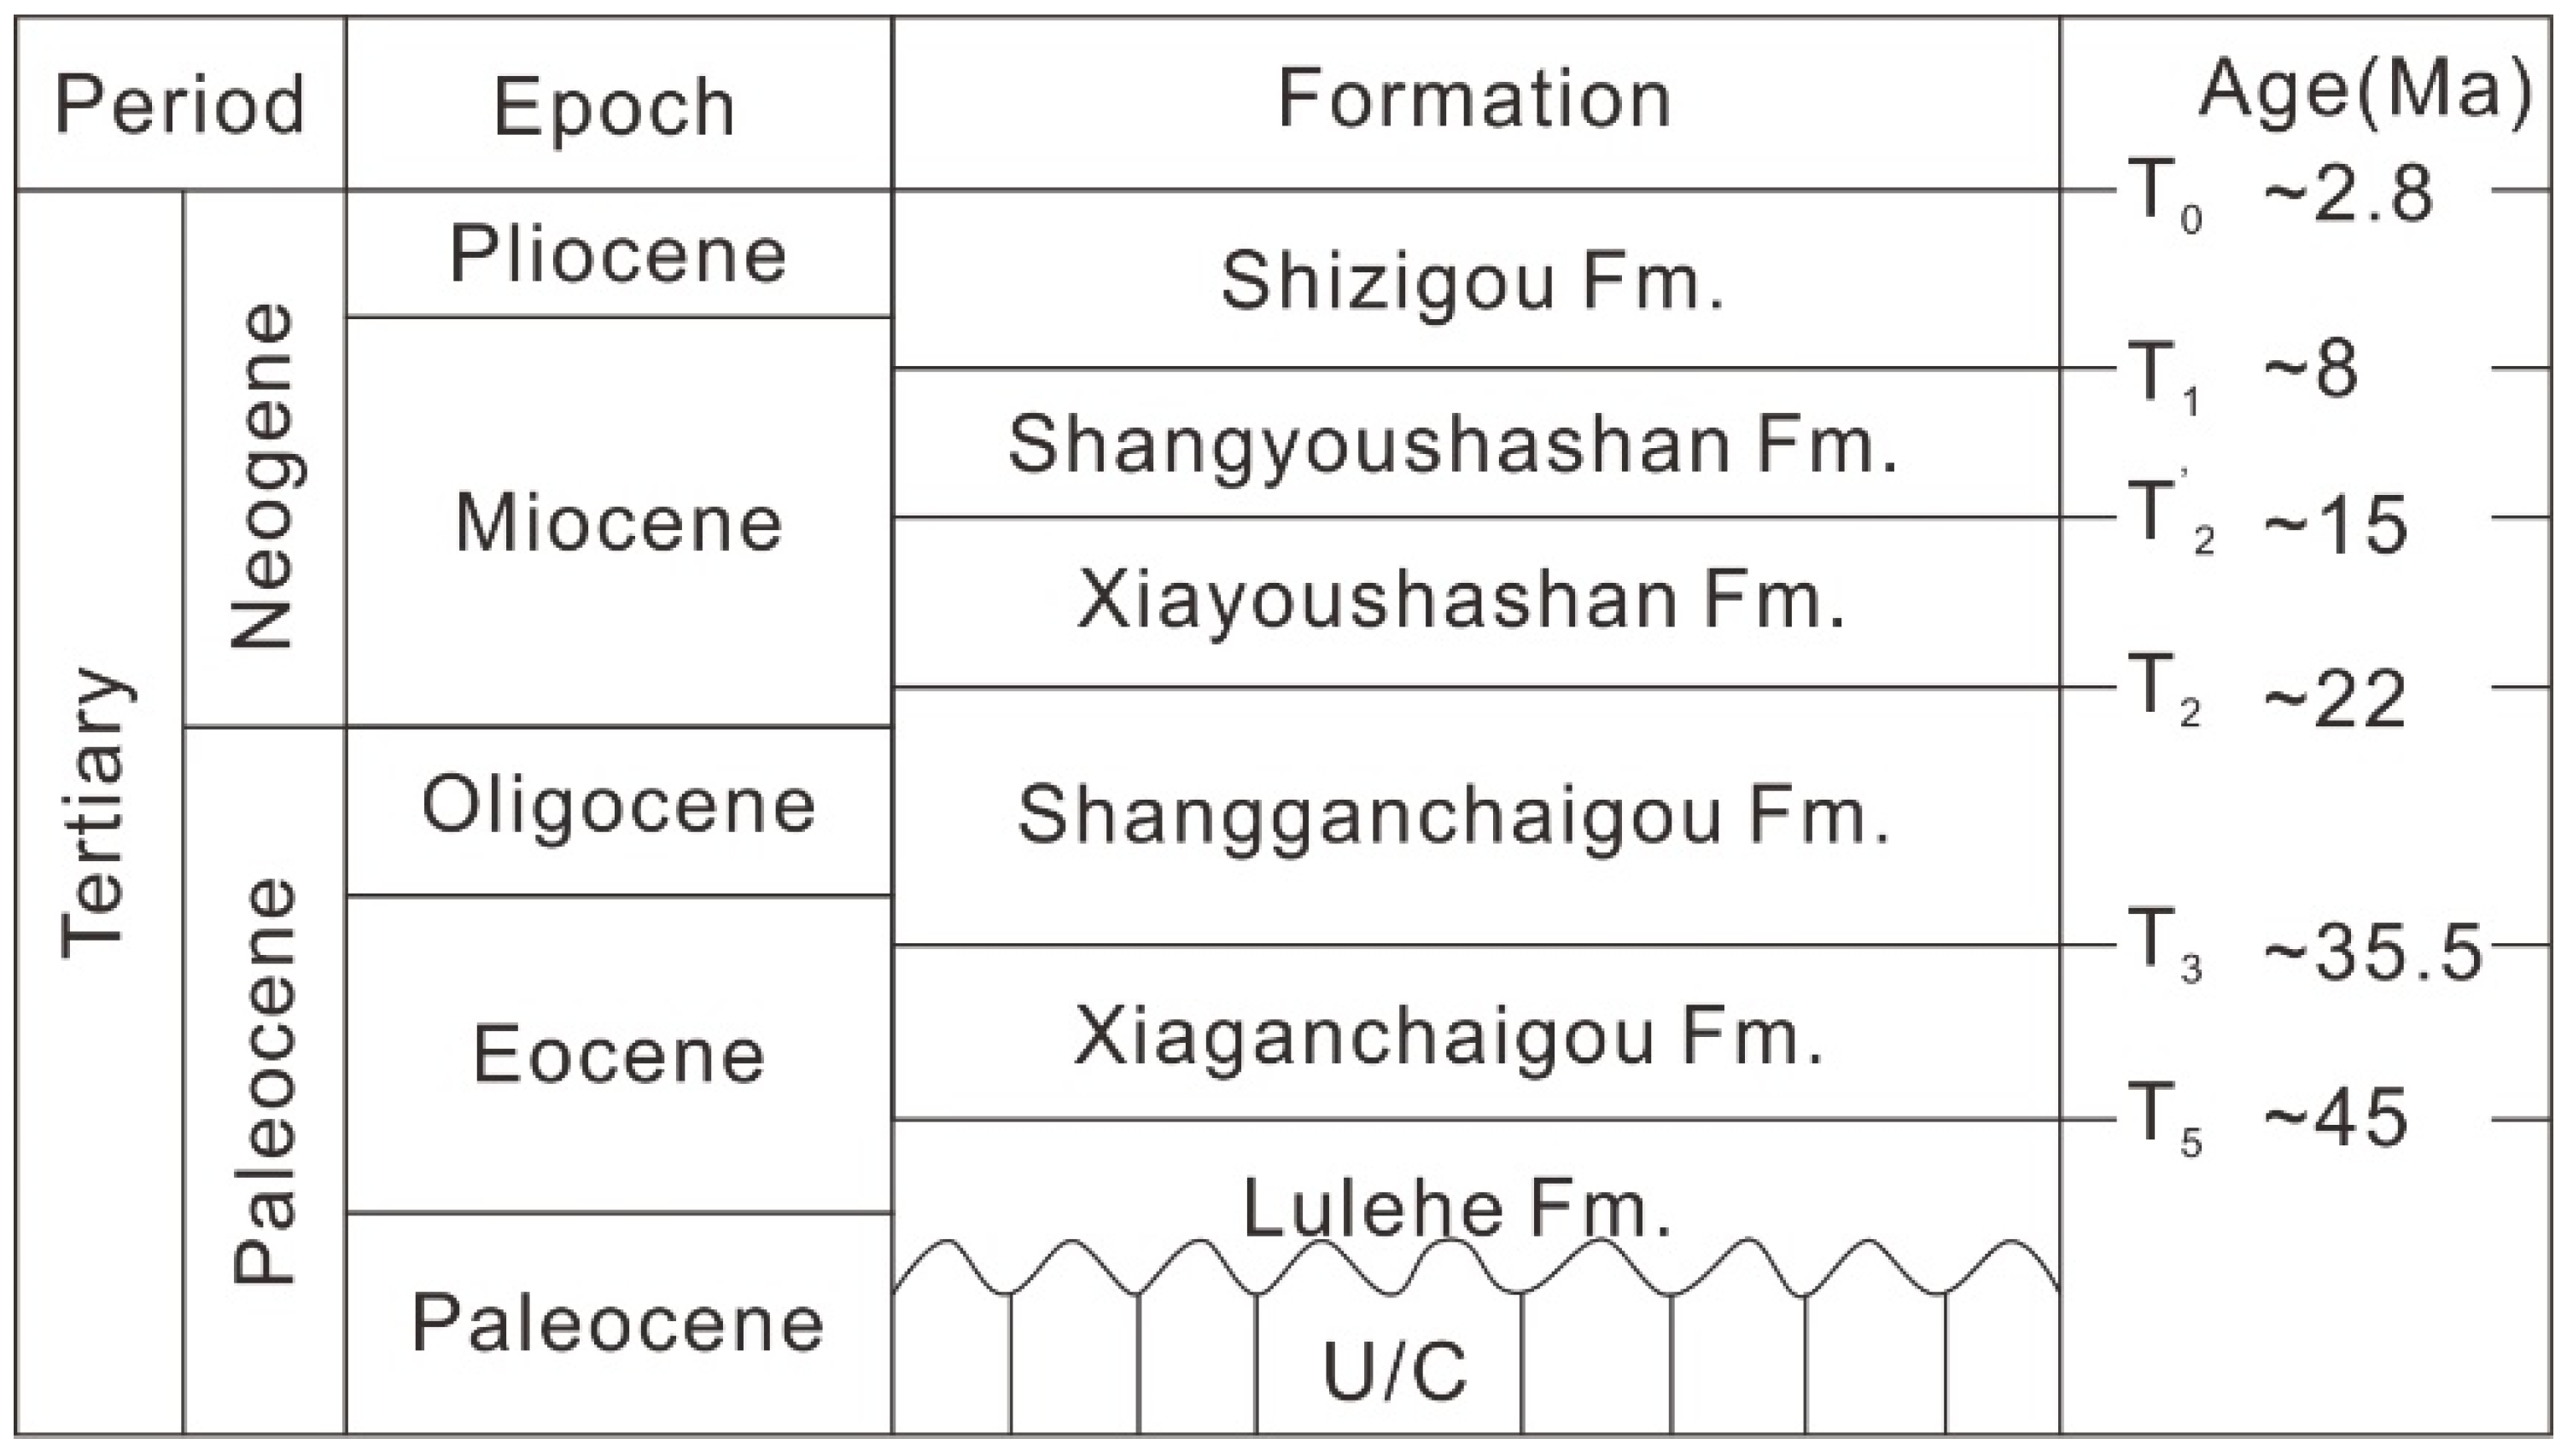
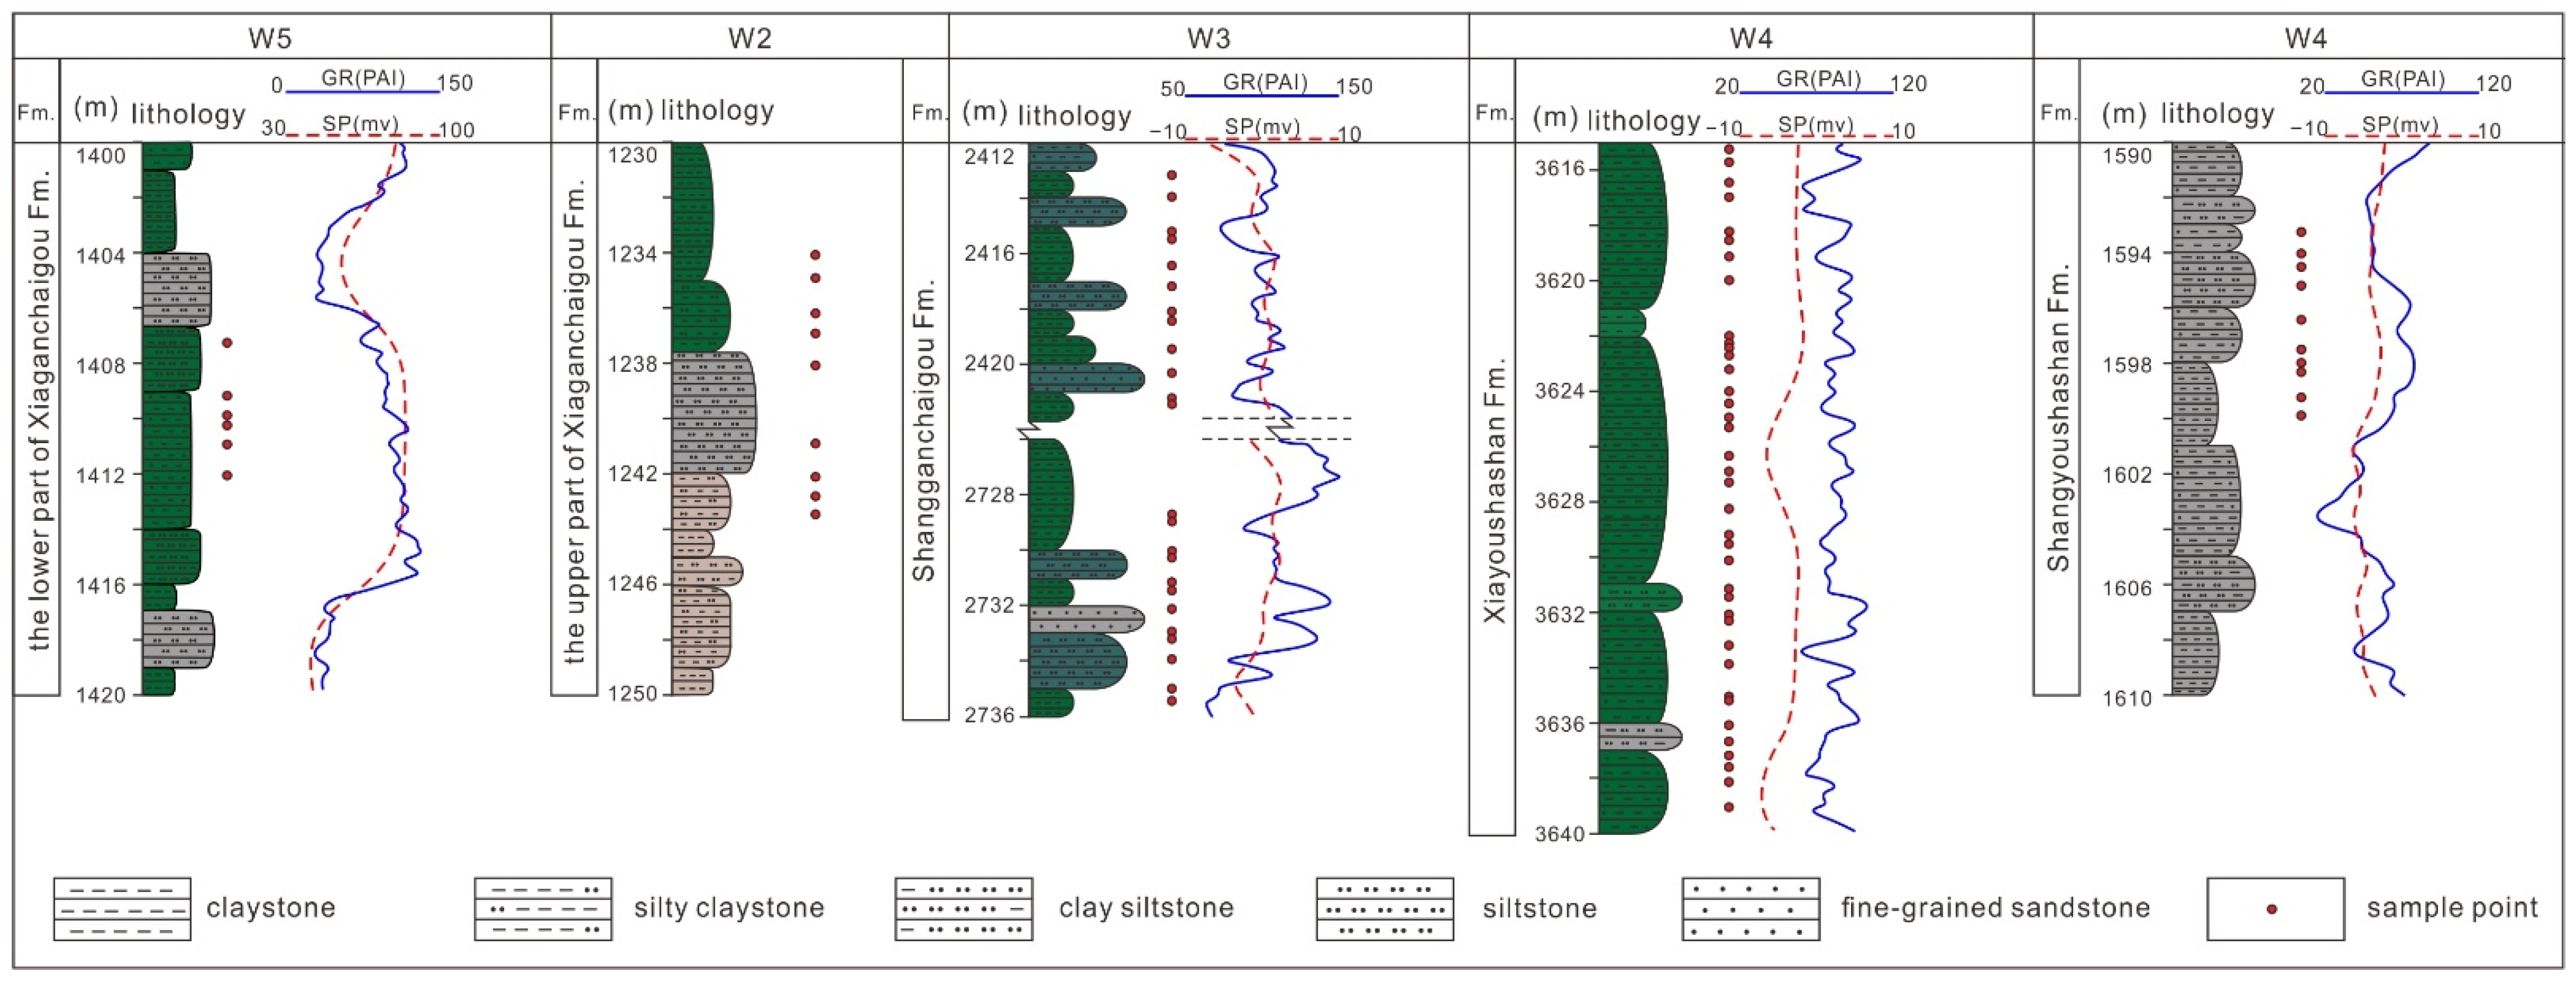
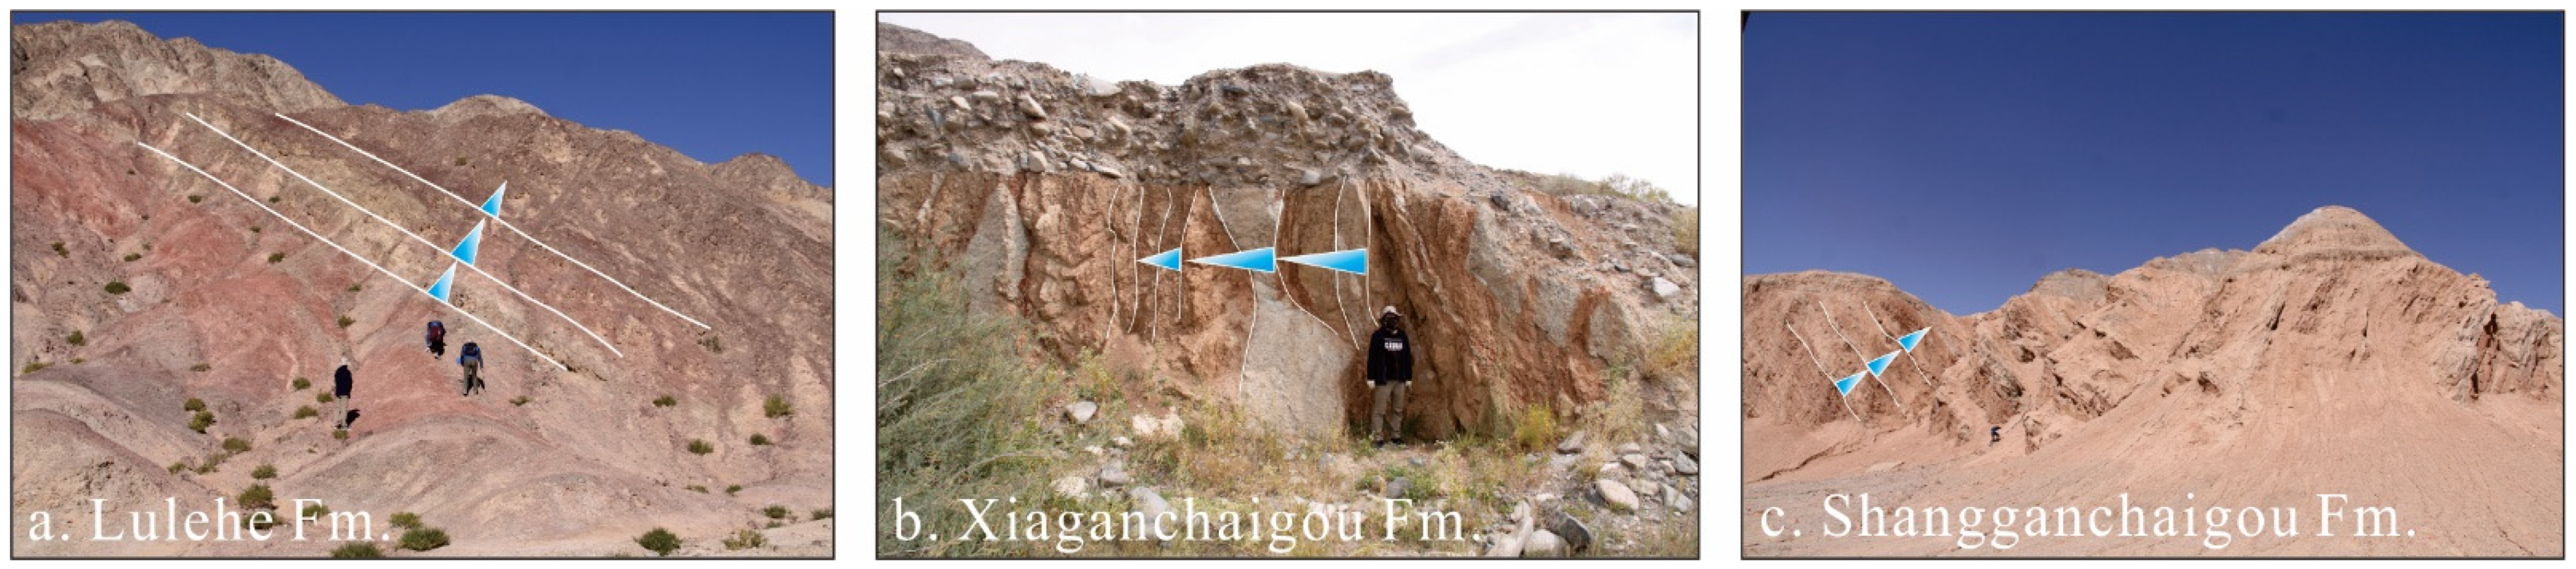
4.1. Stratigraphy
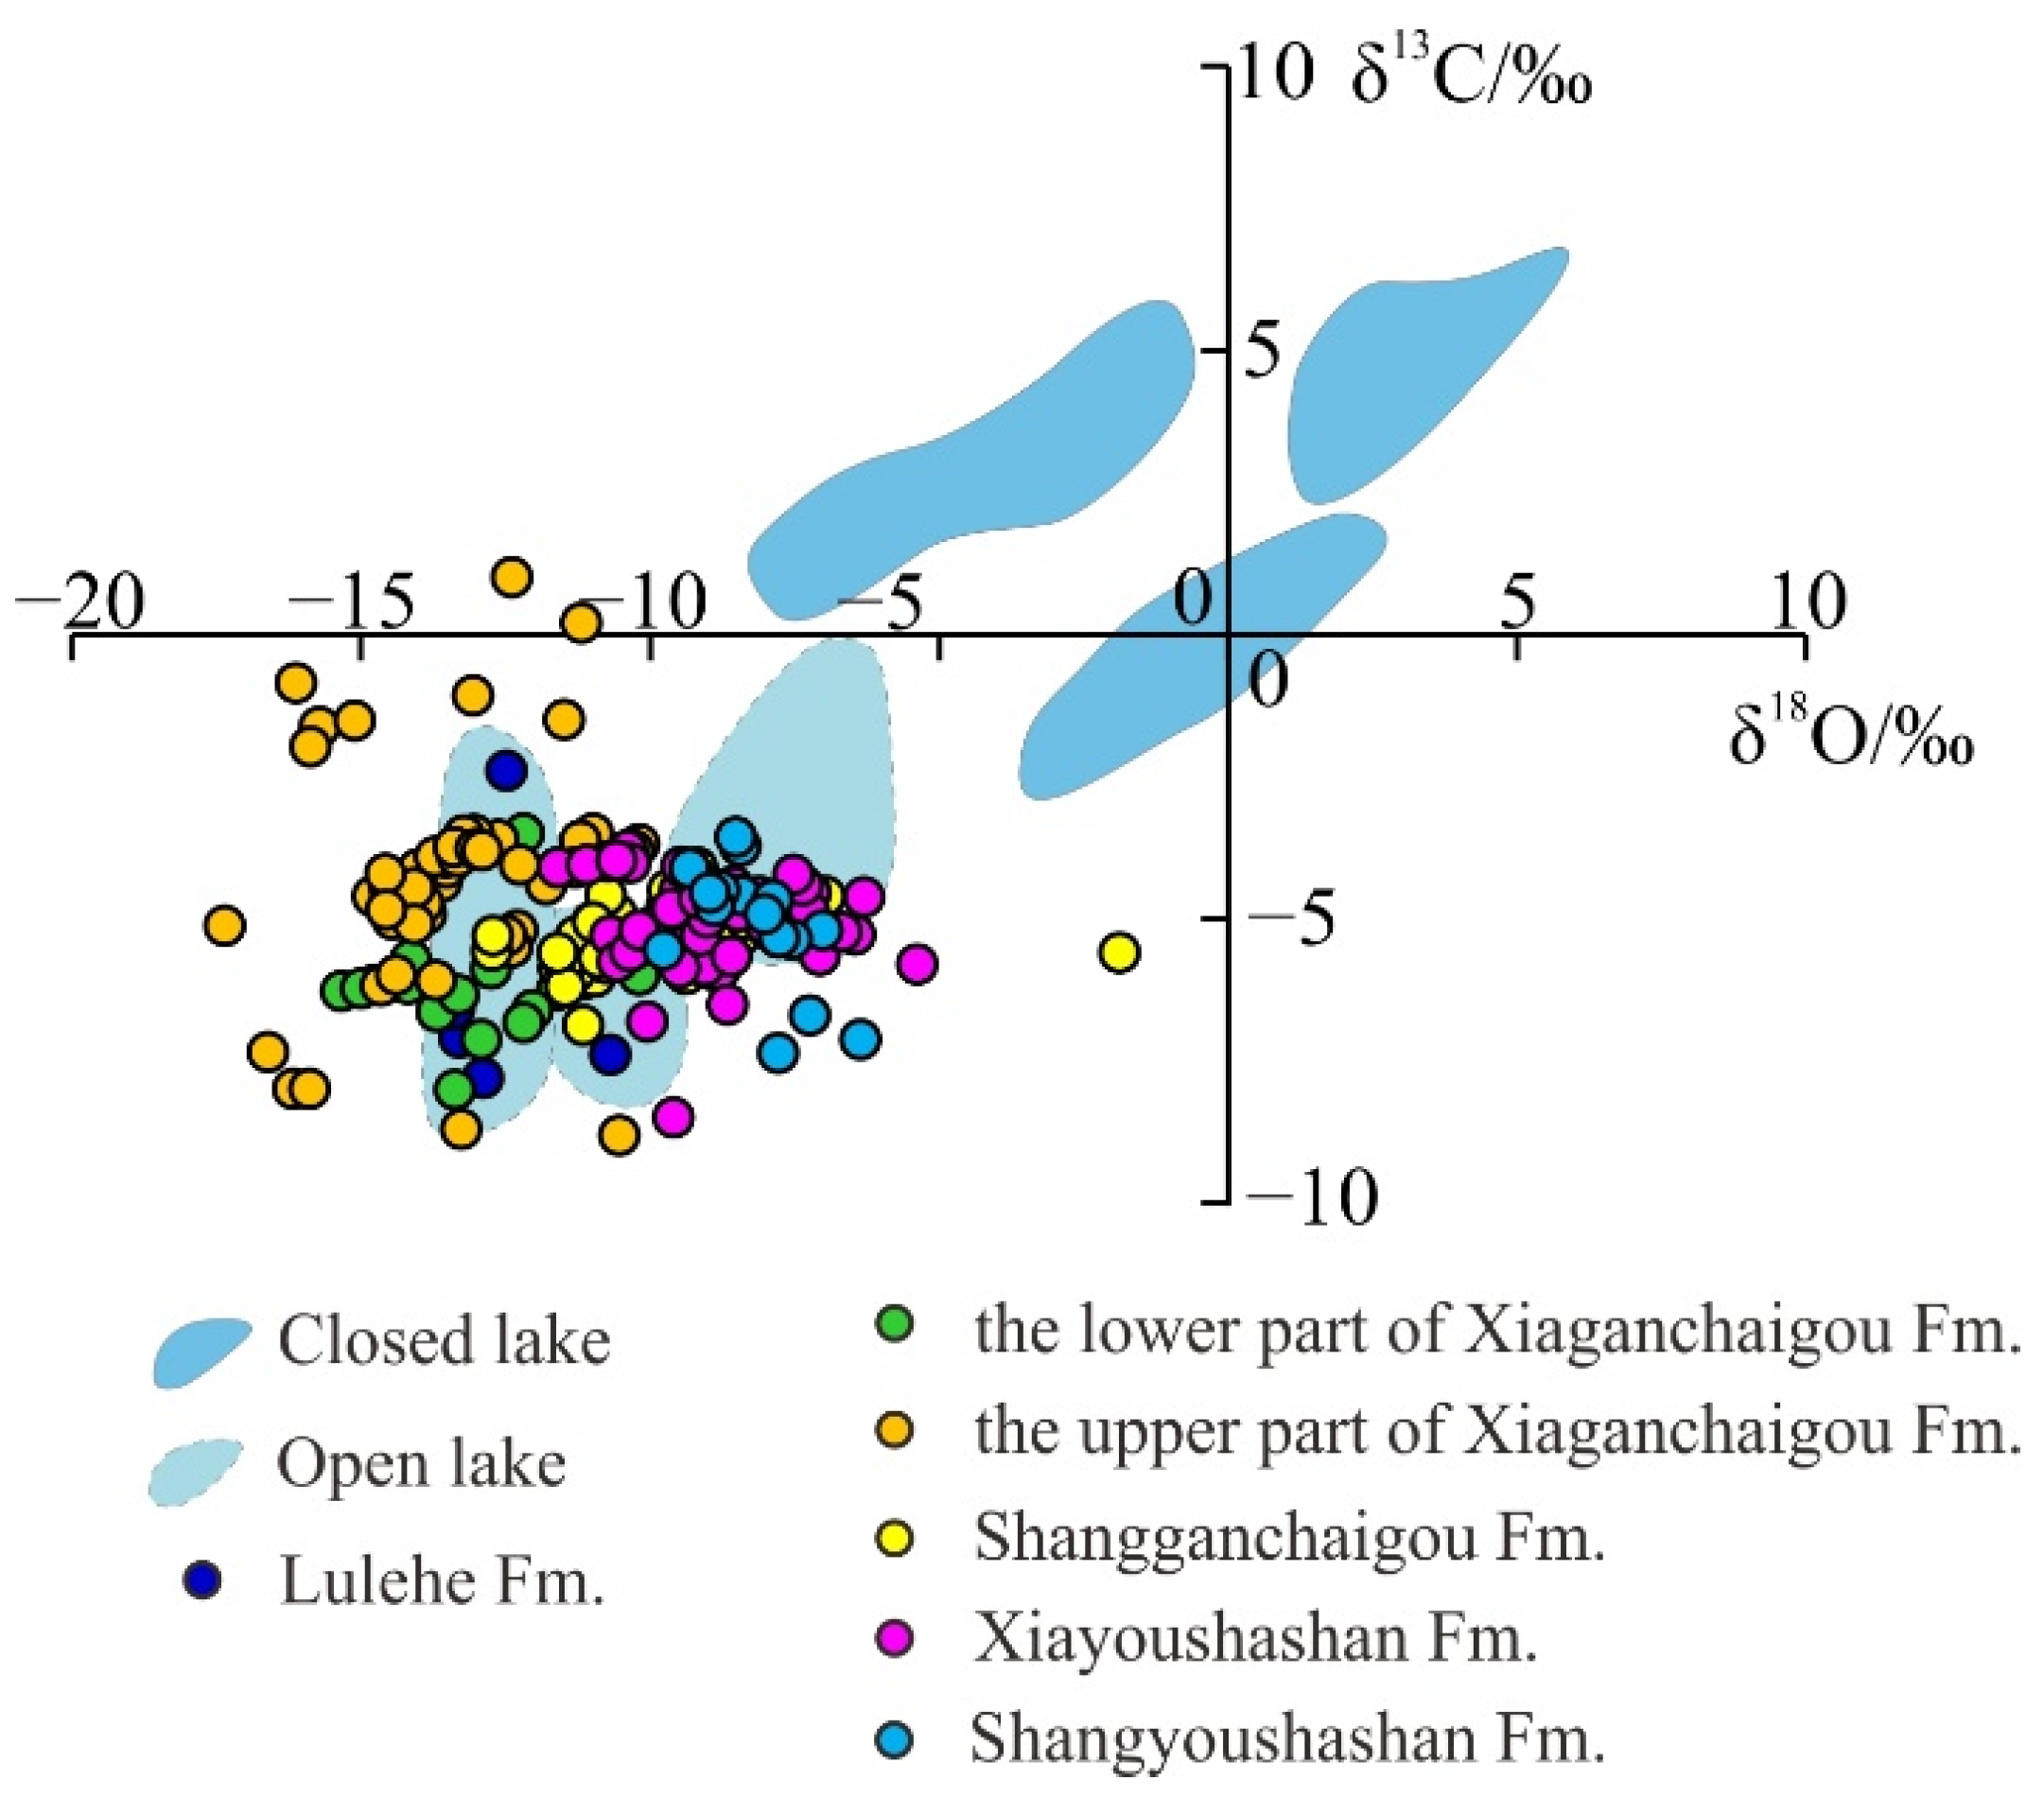
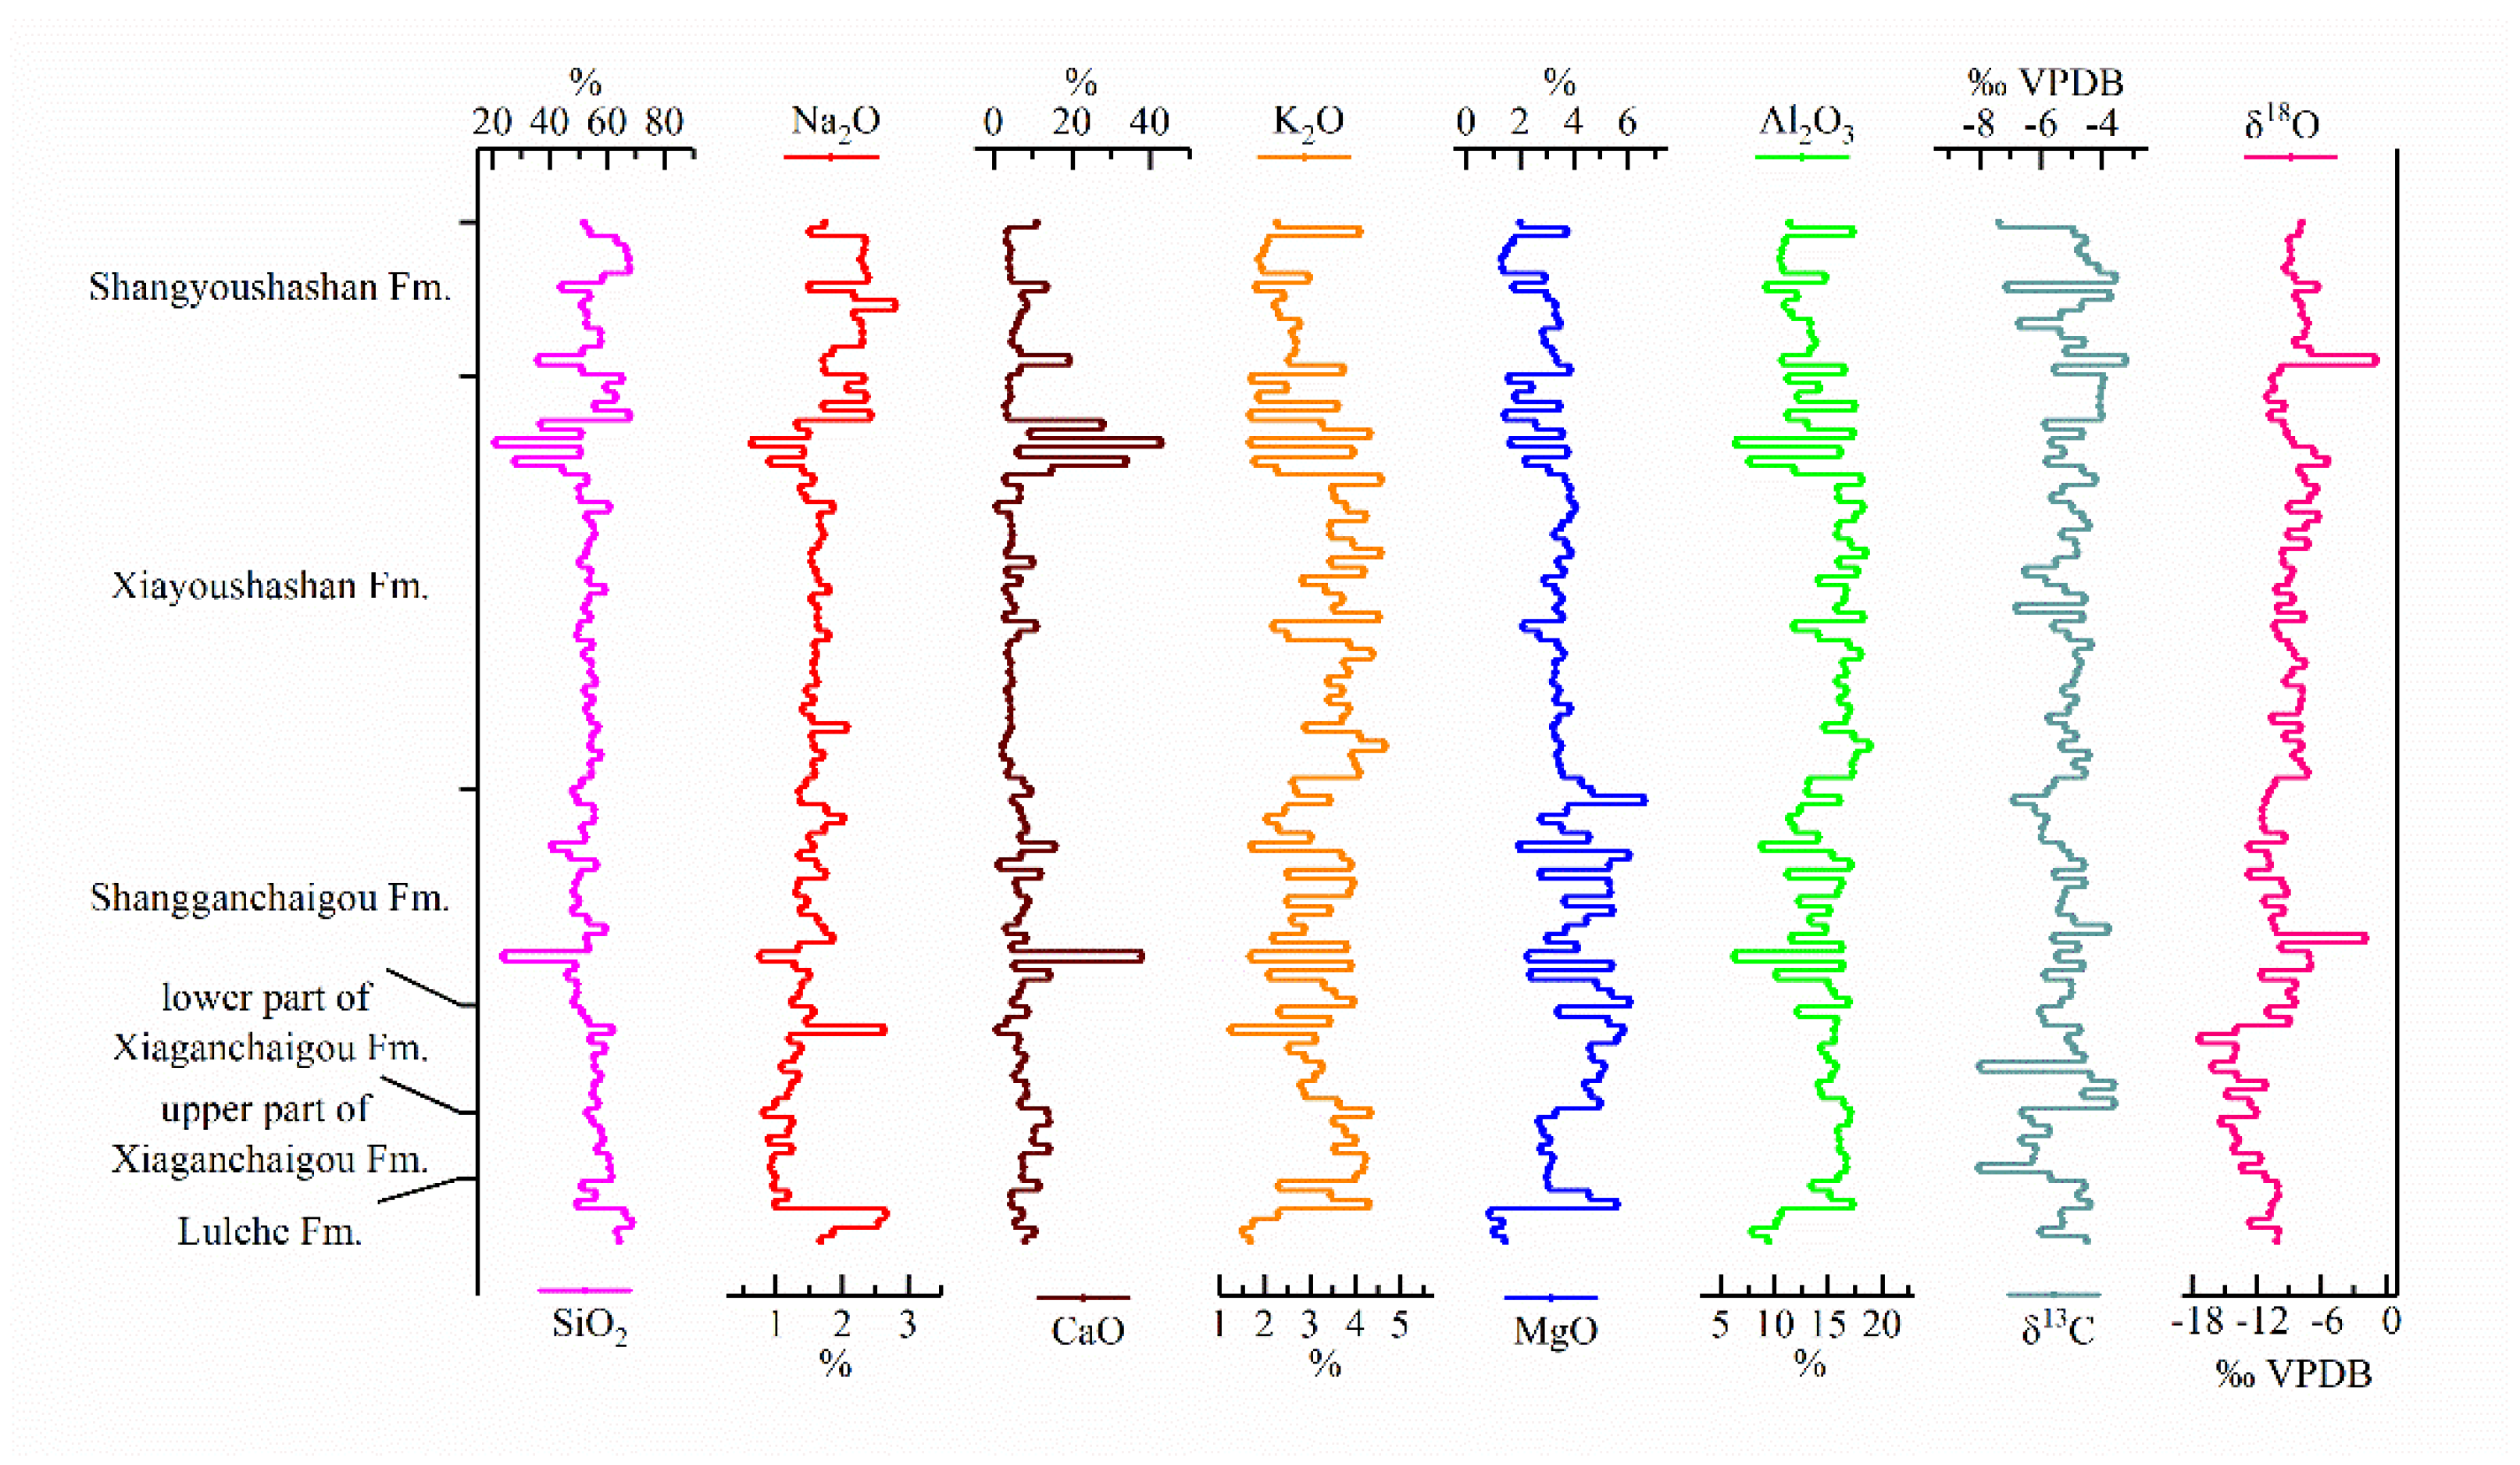
4.2. Carbon and Oxygen Isotopes
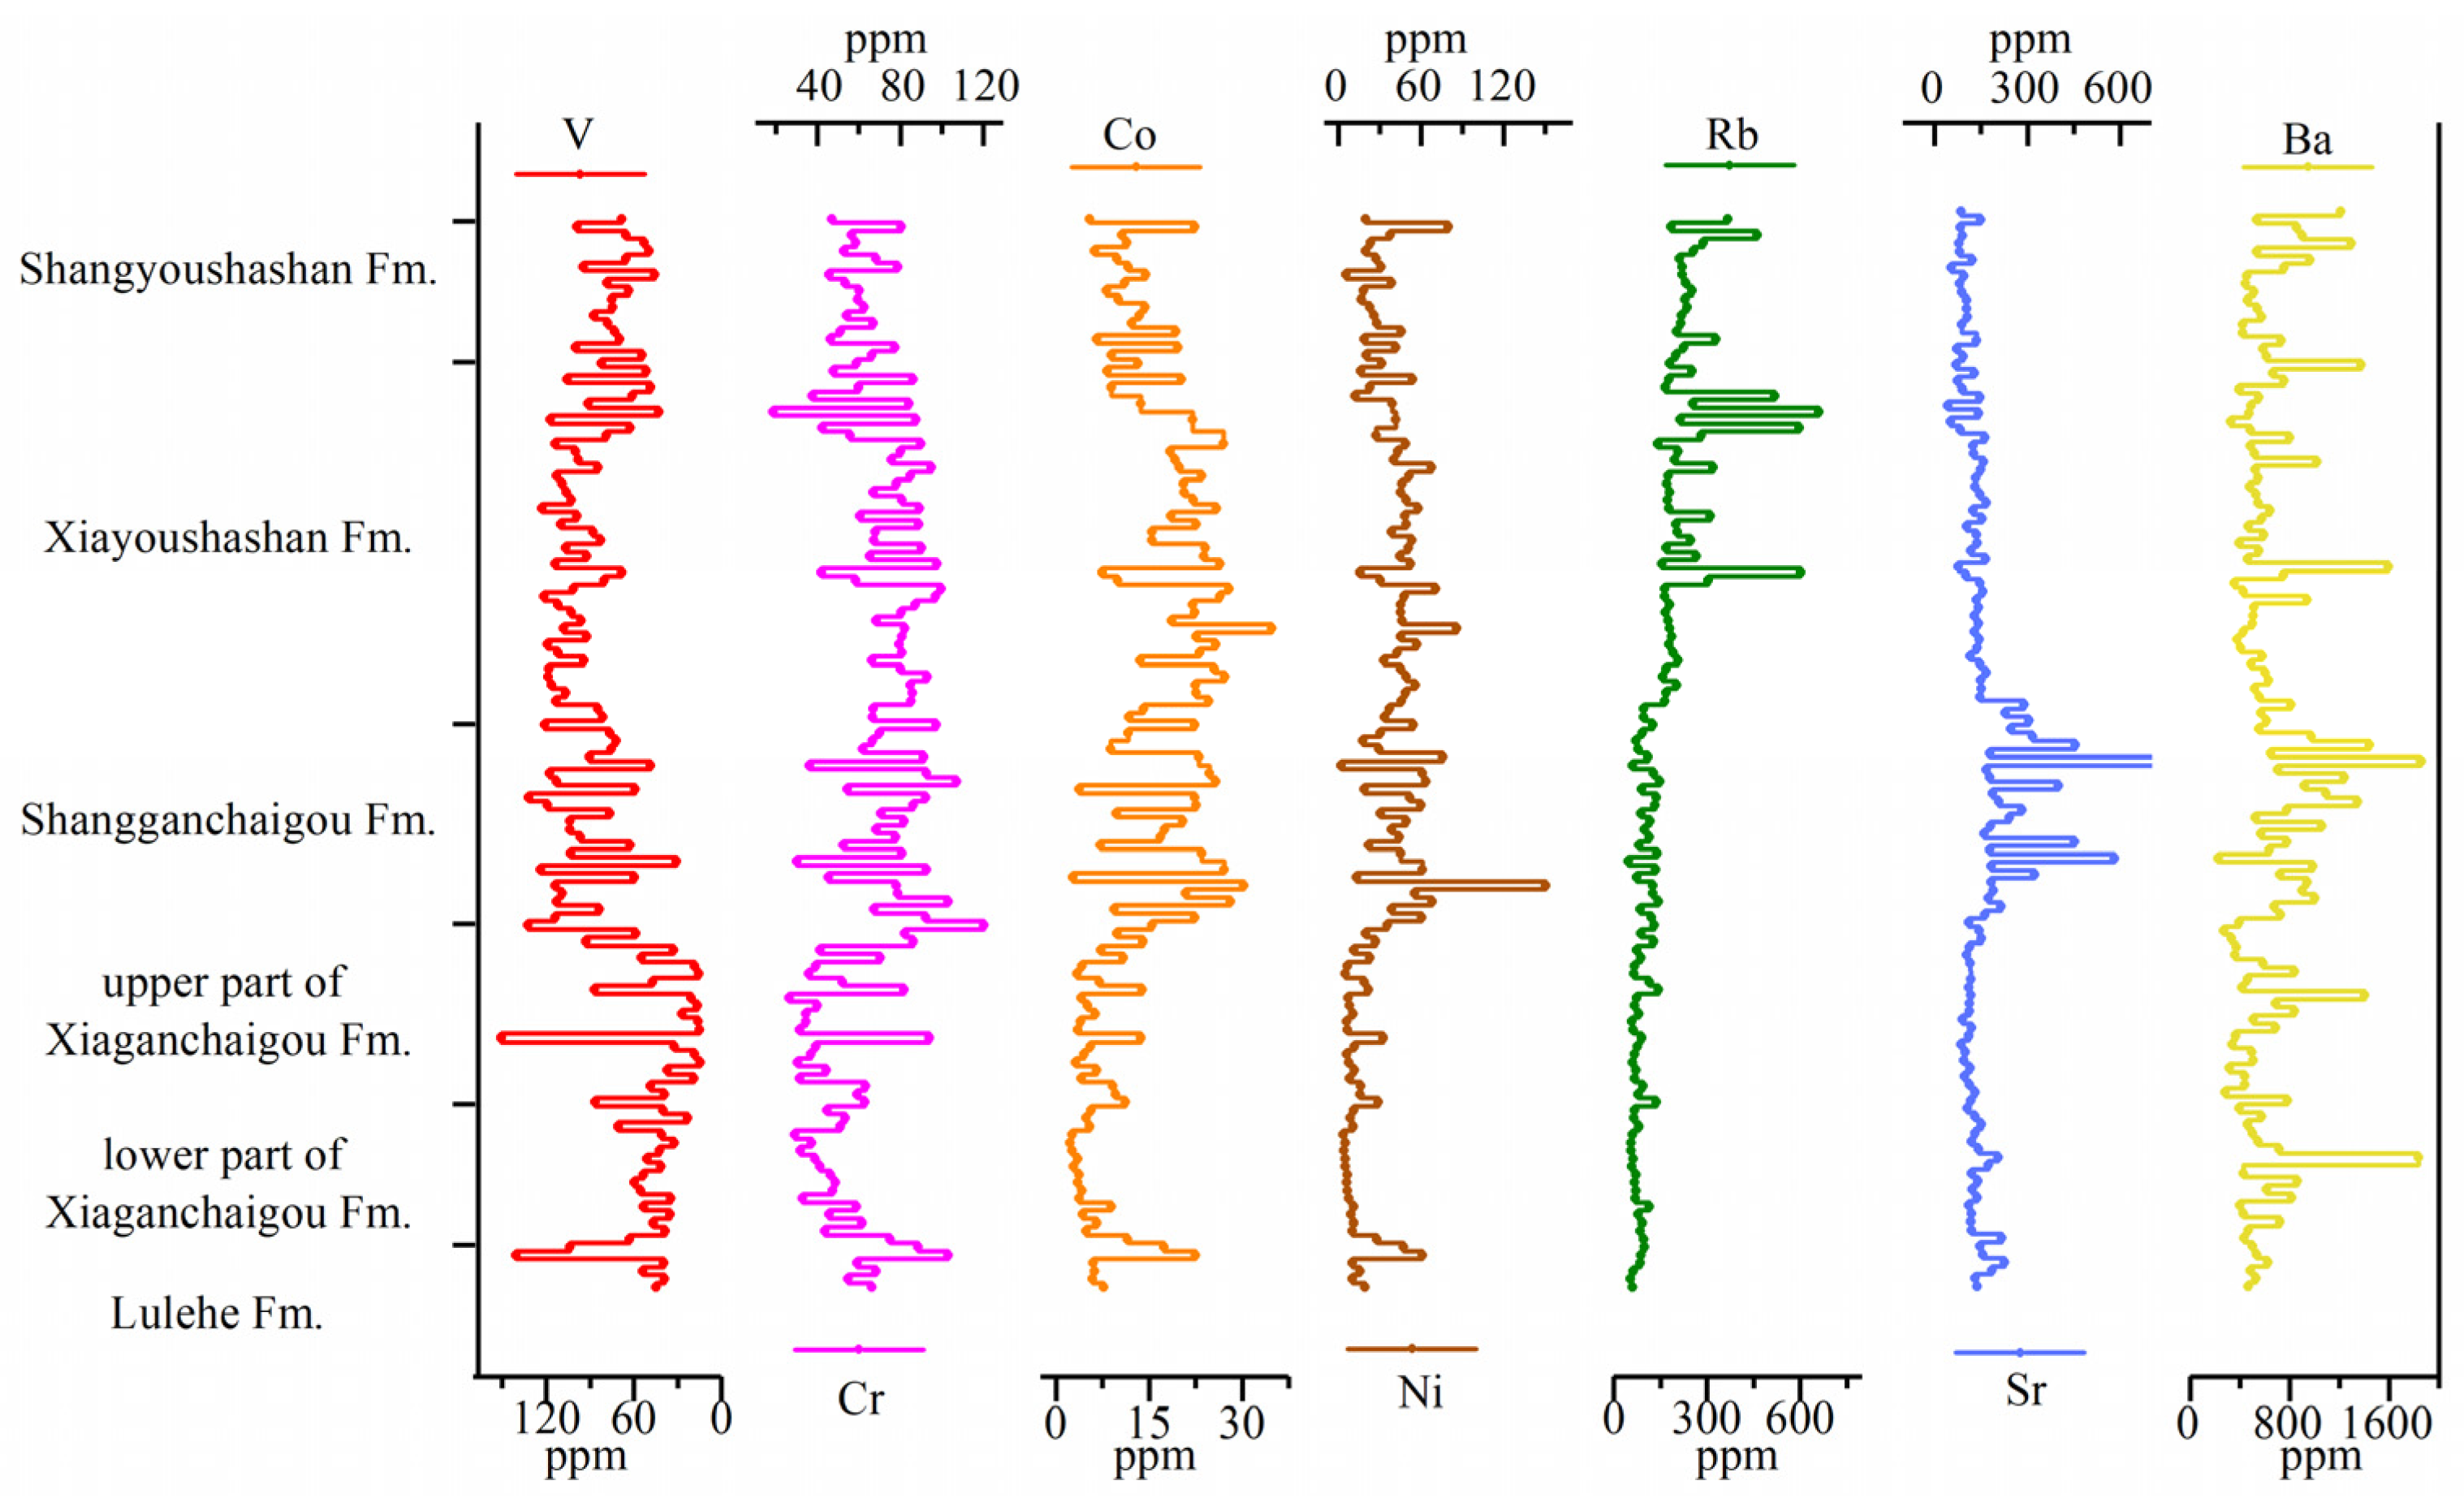
4.3. Major and Trace Elements
5. Discussion
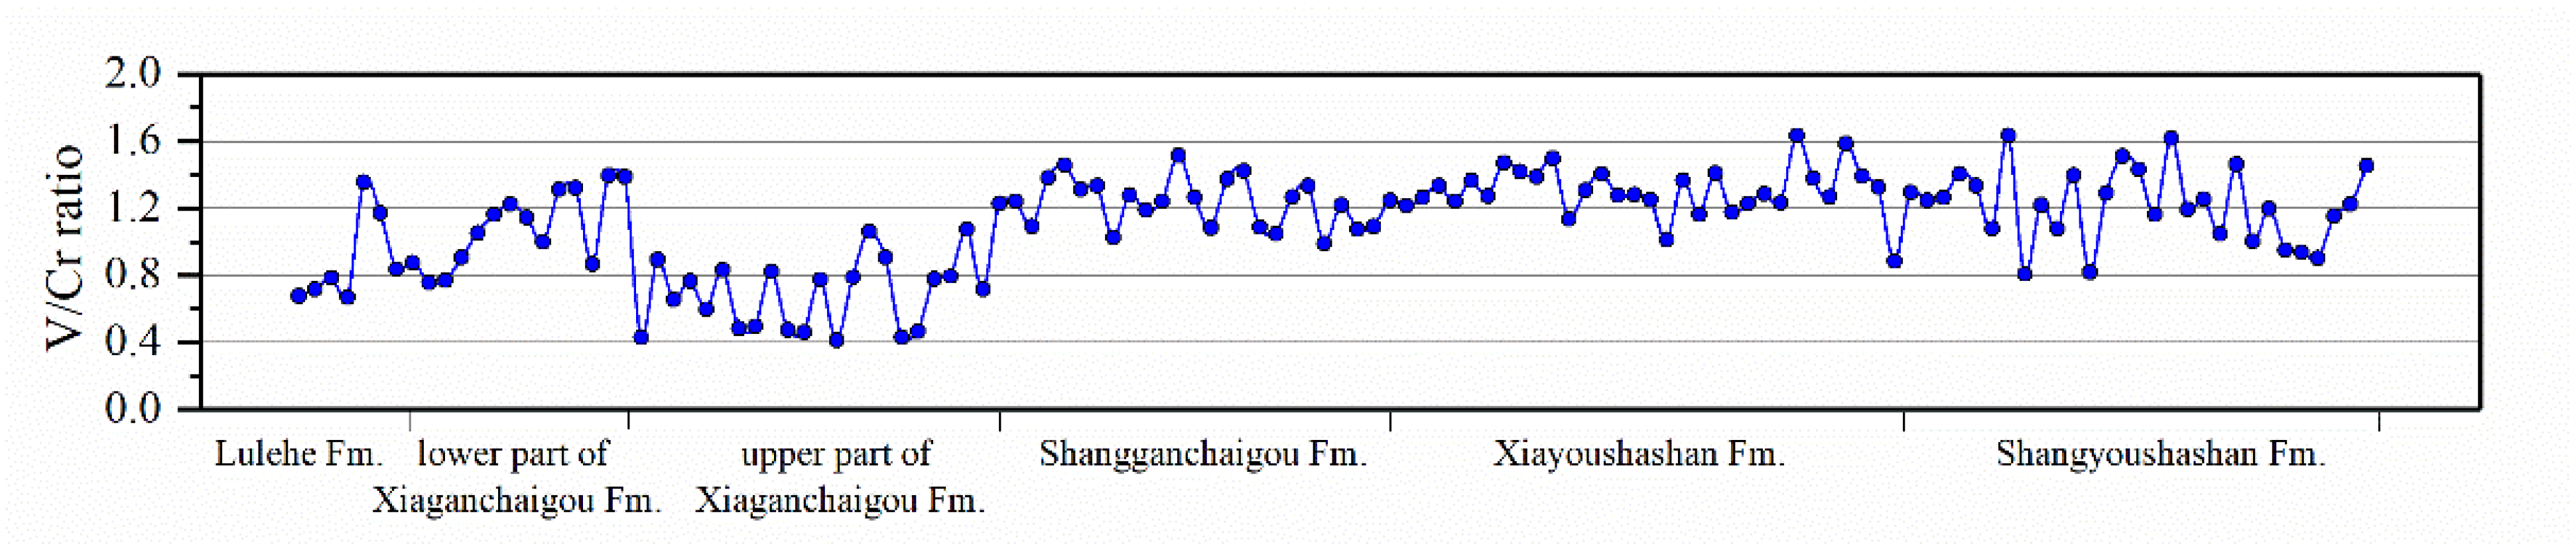
5.1. Sedimentary Environment
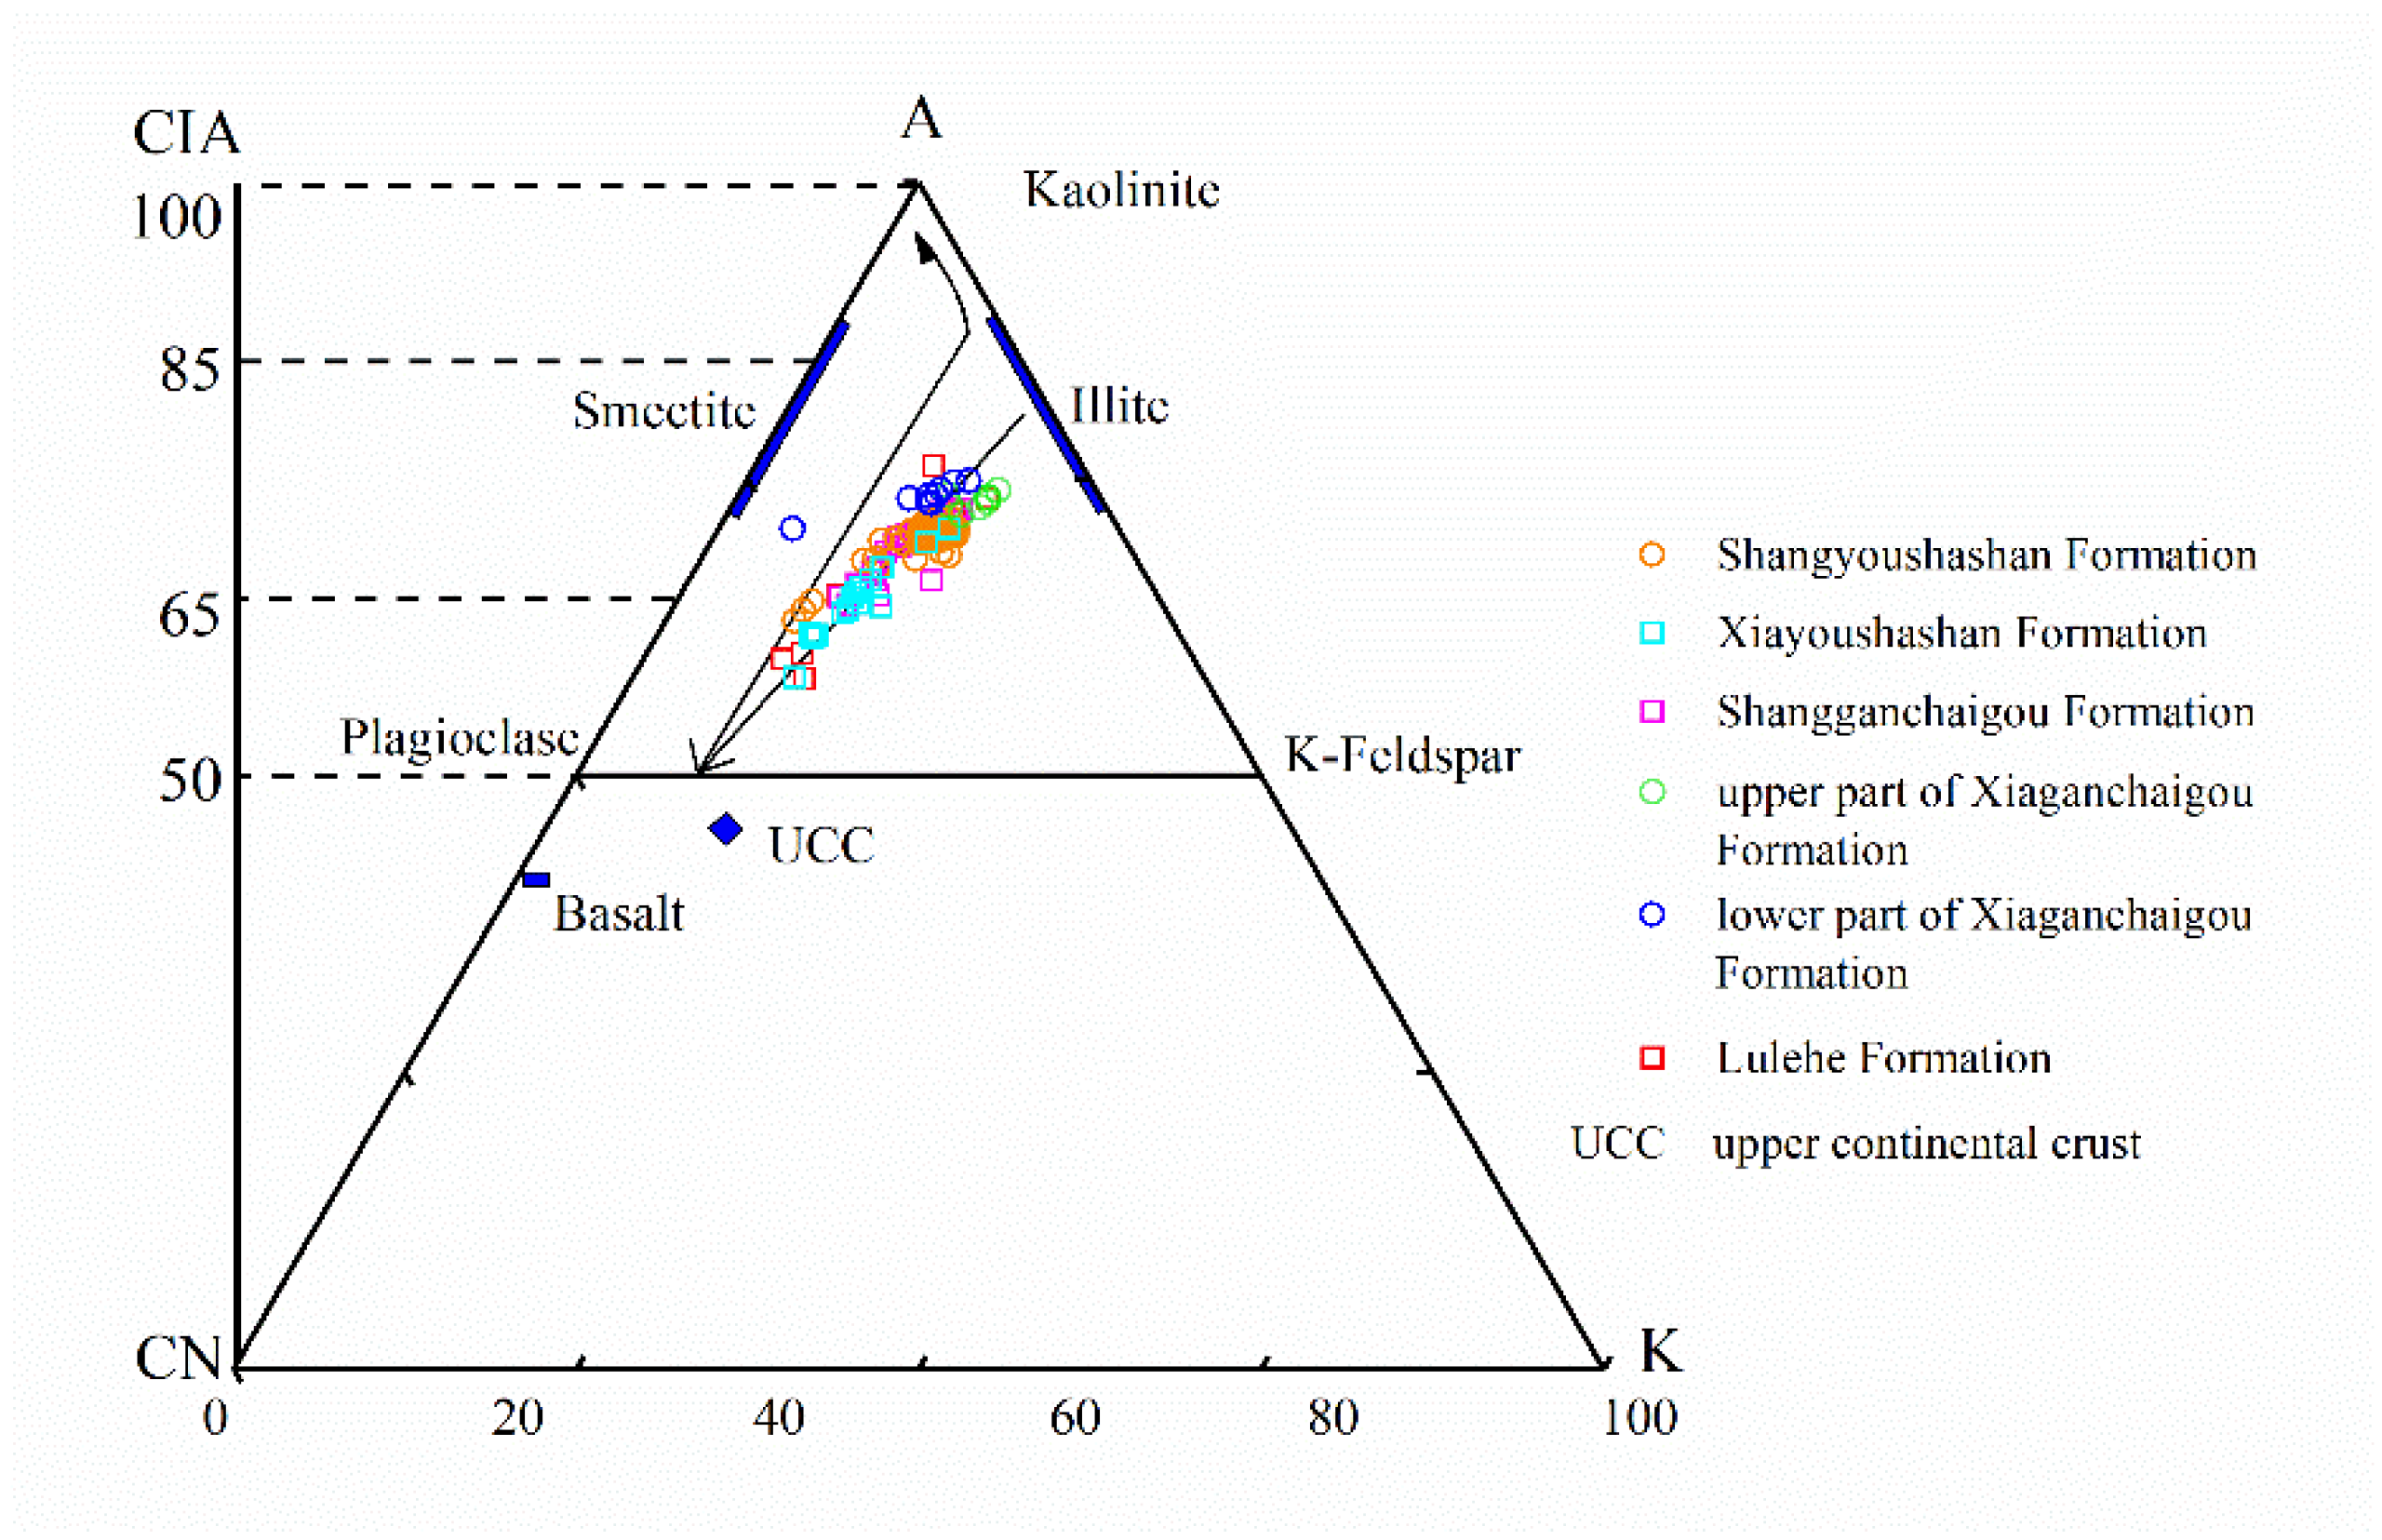
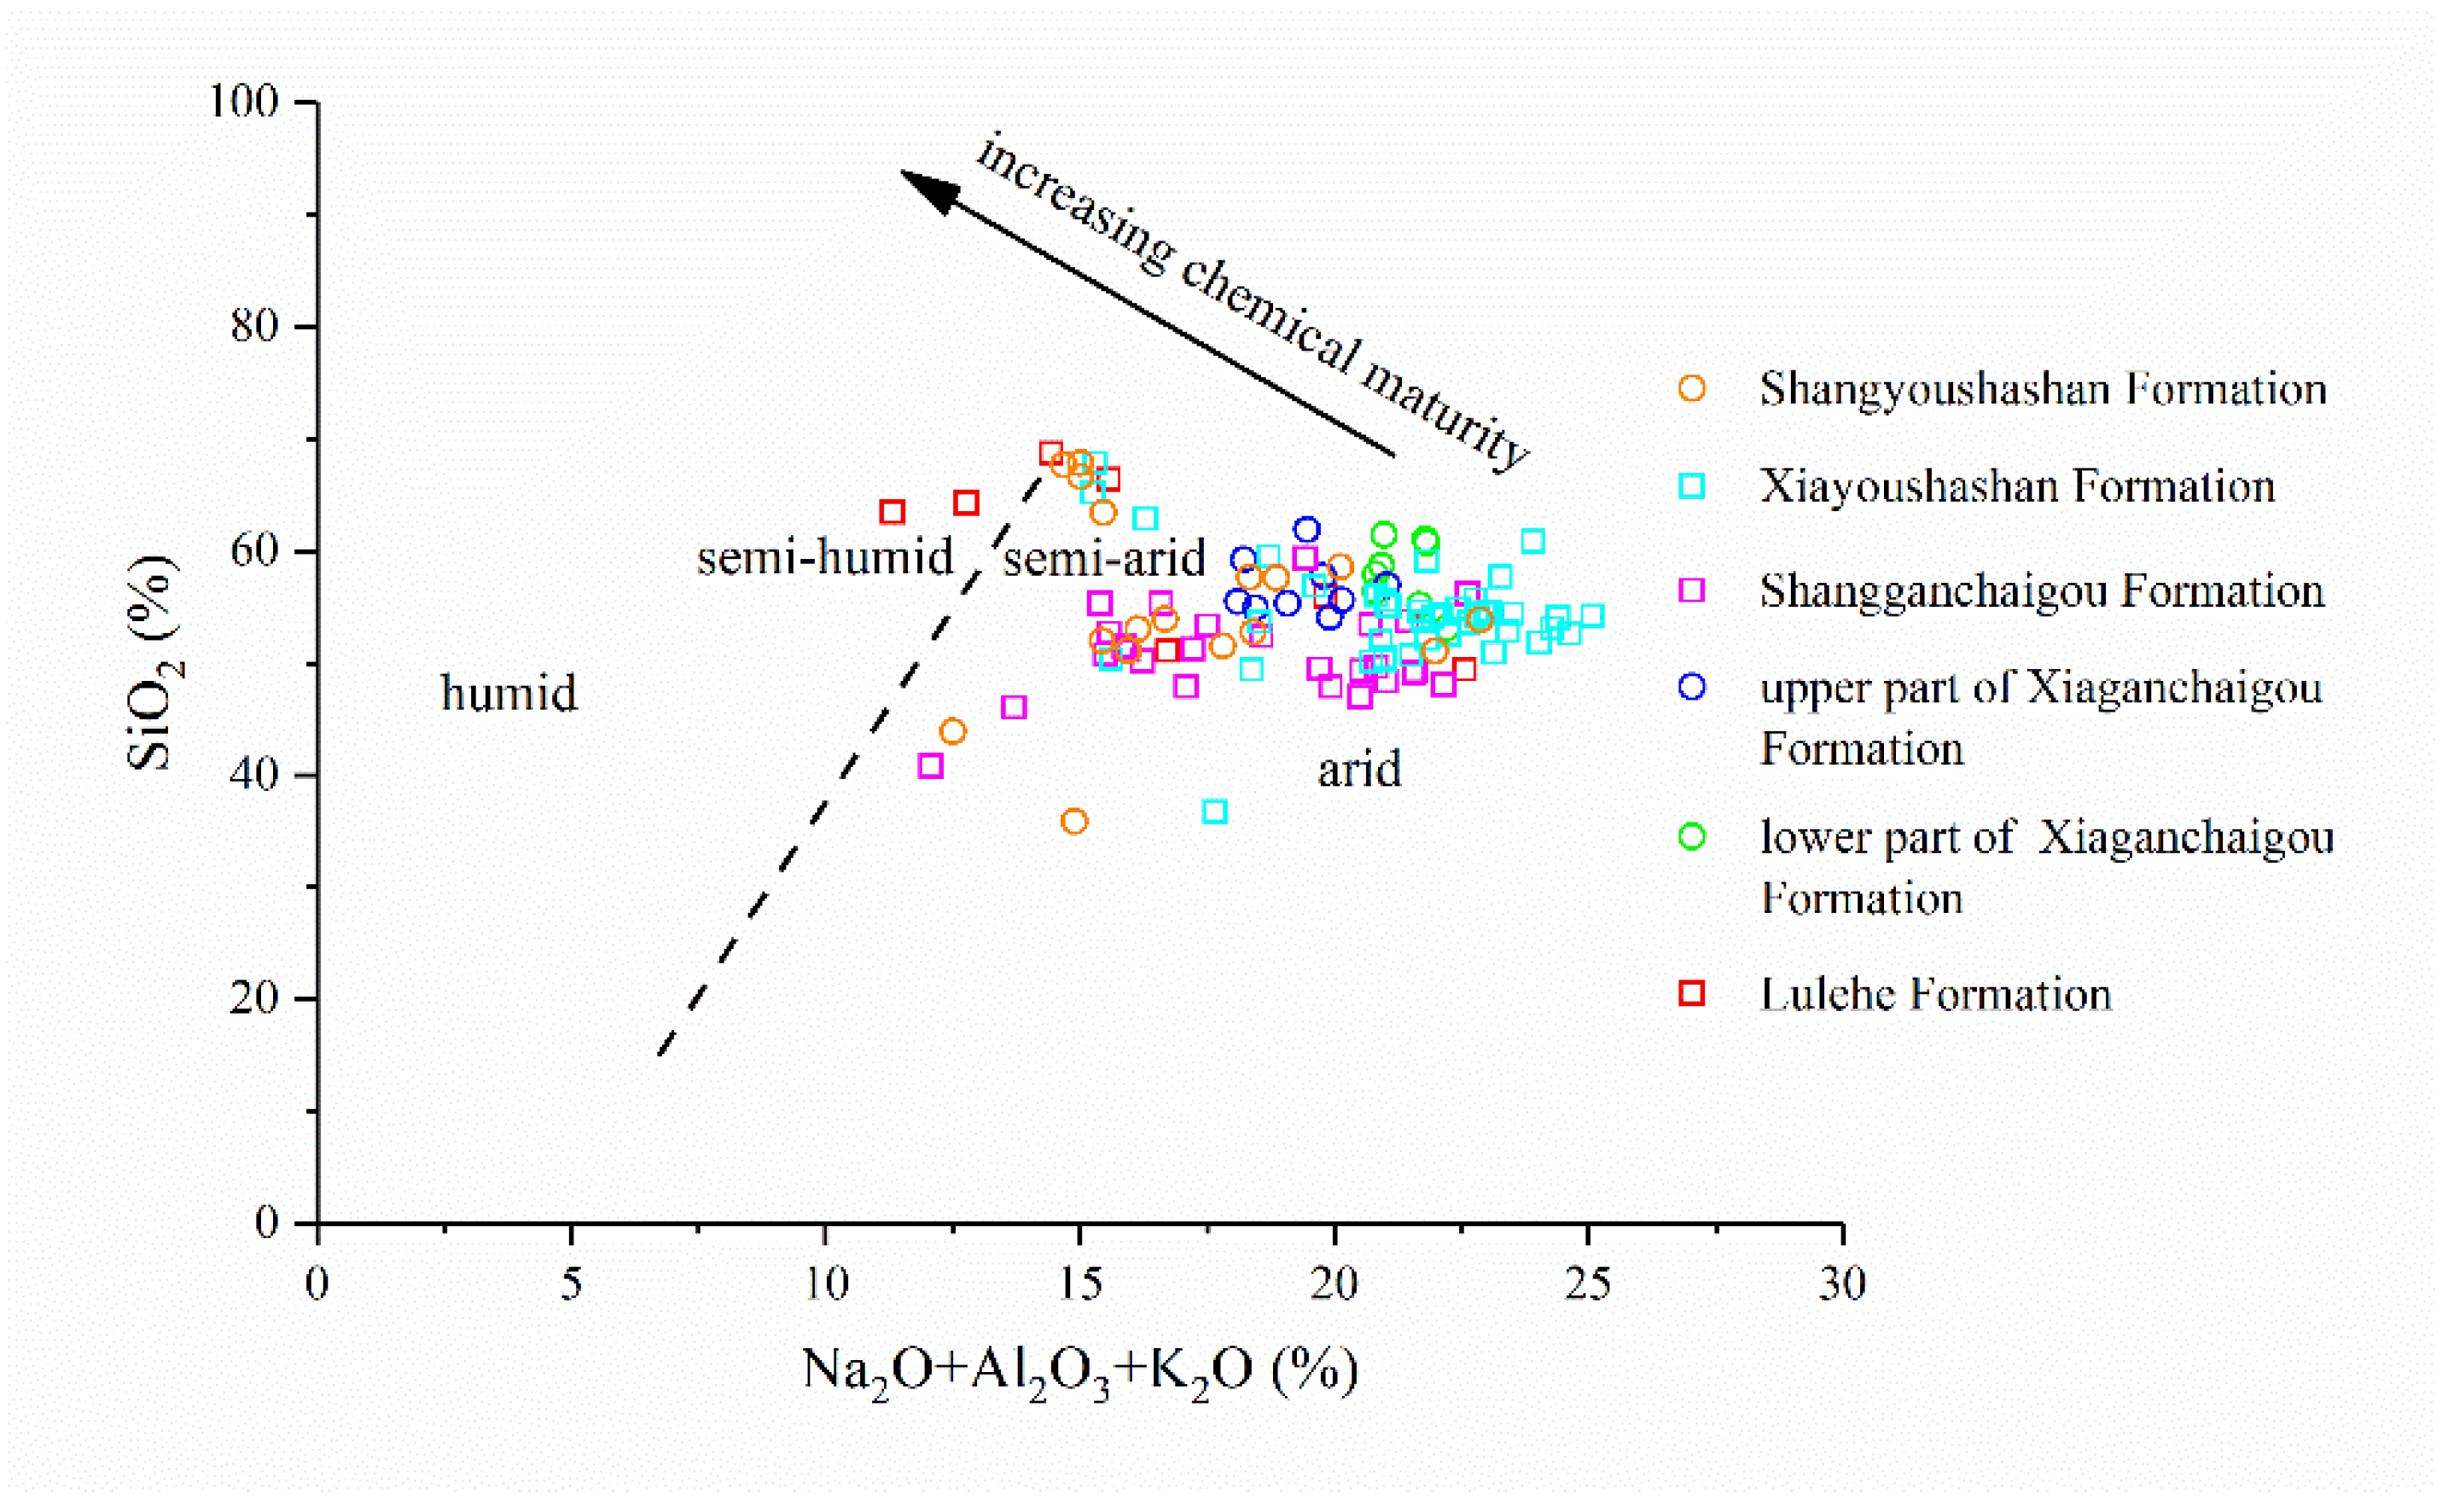
5.2. Paleoclimate Change
5.3. Response of Sand Body to Depositional Environment
5.4. Sedimentary Environment Evolution Model
6. Conclusions
Author Contributions
Funding
Institutional Review Board Statement
Informed Consent Statement
Data Availability Statement
Acknowledgments
Conflicts of Interest
References
- Song, B.; Xu, Y.; Liang, Y.; Jiang, S.; Luo, M.; Ji, J.; Fang, H.; Yi, W.; Xu, Z.; Jiang, G. Evolution of Cenozoic Sedimentary Basins in Western China. Earth Sci. Front. 2014, 8, 1035–1051. [Google Scholar]
- Wang, C.; Zhao, X.; Liu, Z.; Lippert, P.; Graham, S.; Coe, R.; Haisheng, Y.; Zhu, L.; Liu, S.; Li, Y. Constraints on early uplift history of the Tibetan Plateau. Proc. Natl. Acad. Sci. USA 2008, 105, 4987–4992. [Google Scholar] [CrossRef] [PubMed]
- Garzione, C. Surface uplift of Tibet and Cenozoic global cooling. Geology 2008, 36, 1003. [Google Scholar] [CrossRef]
- Molnar, P. The growth of the Tibetan Plateau and Mio-Pliocene evolution of East Asian climate. Palaeontol. Electron. 2005, 8, 1–23. [Google Scholar]
- Sun, G.; Wang, M.; Guo, J.; Wang, Y.; Yang, Y. Geochemical Significance of Clay Minerals and Elements in Paleogene Sandstones in the Center of the Northern Margin of the Qaidam Basin, China. Minerals 2020, 10, 505. [Google Scholar] [CrossRef]
- Yang, Y.H.; Sun, G.Q.; Wang, Y.T.; Wu, J.; Jiang, Y.; Wang, M.; Li, J.S. Diagenesis and sedimentary environment of the lower Xiaganchaigou Formation deposited during the Eocene/Oligocene transition in the Lenghu tectonic belt, Qaidam Basin, China. Environ. Earth Sci. 2020, 79, 1–14. [Google Scholar] [CrossRef]
- Gao, Y.; Wang, C.; Huang, Y.; Bin, H.U. Progress in the study of paleoclimate change in continental scientific drilling projects. Earth Sci. Front. 2017, 24, 229–241. [Google Scholar]
- Melles, M.; Brigham-Grette, J.; Minyuk, P.S.; Nowaczyk, N.R.; Wennrich, V.; DeConto, R.M.; Anderson, P.M.; Andreev, A.A.; Coletti, A.; Cook, T.L.; et al. 2.8 Million Years of Arctic Climate Change from Lake El’gygytgyn, NE Russia. Science 2012, 337, 315–320. [Google Scholar] [CrossRef]
- Sun, Y.; Mu, Z. Isotopic Geochemical Studies on Global Change. Acta Scicentiarum Nat. Univ. Pekinesis 2001, 4, 577–586. [Google Scholar]
- Armstrong-Altrin, J.S.; Lee, Y.I.; Verma, S.P.; Verma, S.P. Geochemistry of Sandstones from the Upper Miocene Kudankulam Formation, Southern India: Implications for Provenance, Weathering, and Tectonic Setting. J. Sediment. Res. 2004, 74, 285–297. [Google Scholar] [CrossRef]
- Yang, L.; Zhang, W.; Fang, X.; Cai, M.; Lu, Y. Aridification recorded by lithofacies and grain size in a continuous Pliocene-Quaternary lacustrine sediment record in the western Qaidam Basin, NE Tibetan Plateau. Palaeogeogr. Palaeoclimatol. Palaeoecol. 2020, 556, 109903. [Google Scholar] [CrossRef]
- Sun, G.; Wang, Y.; Guo, J.; Wang, M.; Jiang, Y.; Pan, S. Clay Minerals and Element Geochemistry of Clastic Reservoirs in the Xiaganchaigou Formation of the Lenghuqi Area, Northern Qaidam Basin, China. Minerals 2019, 9, 678. [Google Scholar] [CrossRef]
- Hao, Q.; Yang, S.; Song, Z.; Ran, X.; Yu, C.; Chen, C.; Van Zwieten, L.; Quine, T.A.; Liu, H.; Wang, Z.; et al. Holocene carbon accumulation in lakes of the current east Asian monsoonal margin: Implications under a changing climate. Sci. Total Environ. 2020, 737, 139723. [Google Scholar] [CrossRef] [PubMed]
- Jia, Y.; Wu, H.; Zhu, S.; Li, Q.; Zhang, C.; Yu, Y.; Sun, A. Cenozoic aridification in Northwest China evidenced by paleovegetation evolution. Palaeogeogr. Palaeoclimatol. Palaeoecol. 2020, 557, 109907. [Google Scholar] [CrossRef]
- Yin, A.; Dang, Y.-Q.; Wang, L.-C.; Jiang, W.-M.; Zhou, S.-P.; Chen, X.-H.; Gehrels, G.E.; McRivette, M.W. Cenozoic tectonic evolution of Qaidam Basin and its surrounding regions (Part 1): The southern Qilian Shan-Nan Shan thrust belt and northern Qaidam Basin. Geol. Soc. Am. Bull. 2008, 120, 813–846. [Google Scholar] [CrossRef]
- Yin, A.; Dang, Y.Q.; Zhang, M.; Chen, X.H.; McRivette, M.W. Cenozoic tectonic evolution of the Qaidam Basin and its surrounding regions (Part 3): Structural geology, sedimentation, and regional tectonic reconstruction. Geol. Soc. Am. Bull. 2008, 120, 847–876. [Google Scholar] [CrossRef]
- Jian, X.; Guan, P.; Zhang, D.W.; Zhang, W.; Feng, F.; Liu, R.J.; Lin, S.D. Provenance of Tertiary sandstone in the northern Qaidam basin, northeastern Tibetan Plateau: Integration of framework petrography, heavy mineral analysis and mineral chemistry. Sediment. Geol. 2013, 290, 109–125. [Google Scholar] [CrossRef]
- Irving, F.; James, O.N.; Gerald, C. Two New Carbonate Stable-Isotope Standards. Geostand. Geoanal. Res. 1982, 6, 11–12. [Google Scholar] [CrossRef]
- Coplen, T.B.; Brand, W.A.; Gehre, M.; Gröning, M.; Meijer, H.A.J.; Toman, B.; Verkouteren, R.M. New Guidelines for δ13C Measurements. Anal. Chem. 2006, 78, 2439–2441. [Google Scholar] [CrossRef]
- Hut, G. Consultants’ Group Meeting on Stable Isotope Reference Samples for Geochemical and Hydrological Investigations; International Atomic Energy Agency (IAEA): Vienna, Austria, 1987. [Google Scholar]
- Stichler, W. Interlaboratory comparison of new materials for carbon and oxygen isotope ratio measurements. Elements 1995, 825, 67–74. [Google Scholar]
- Talbot, M.R. A review of the Palaeohydrological interpretation of Carbon and Oxygen isotopic ratios in primary lacustrine organic matter. Earth Planet. Sci. Lett. 1990, 110, 23–37. [Google Scholar] [CrossRef]
- Sun, G.; Xie, M.; Zhang, Y.; Zhao, M.; Kang, J.; Shi, J. Sedimentary characteristics and evolution of Paleogene Lower Xiaganchaigou Formation in northern Mahai area, northern margin of Qaidam Basin (in Chinese with English abstract). Lithol. Reserv. 2011, 23, 56–61. [Google Scholar]
- Sun, G.; Yin, J.; Zhang, S.; Lu, X.; Zhang, S.; Shi, J. Diagenesis and sedimentary environment of Miocene series in Eboliang III area. Environ. Earth Sci. 2015, 74, 5169–5179. [Google Scholar] [CrossRef]
- Zuo, X.; Li, C.; Zhang, J.; Ma, G.; Chen, P. Geochemical characteristics and depositional environment of the Shahejie Formation in the Binnan Oilfield, China. J. Geophys. Eng. 2020, 17, 539–551. [Google Scholar] [CrossRef]
- Liu, S.; Lin, G.; Liu, Y.; Zhou, Y.; Gong, F.; Yan, Y. Geochemistry of middle oligocene-pliocene sandstones from the Nanpu Sag, Bohai Bay Basin (Eastern China): Implications for provenance, weathering, and tectonic setting. Geochem. J. 2007, 41, 359–378. [Google Scholar] [CrossRef][Green Version]
- Cao, J.; Wu, M.; Chen, Y.; Hu, K.; Bian, L.; Wang, L.; Zhang, Y. Trace and rare earth element geochemistry of Jurassic mudstones in the northern Qaidam Basin, northwest China. Geochemistry 2012, 72, 245–252. [Google Scholar] [CrossRef]
- McLennan, S.M.; Hemming, S.; McDaniel, D.K.; Hanson, G.N.; Johnsson, M.J.; Basu, A. Geochemical approaches to sedimentation, provenance, and tectonics. In Processes Controlling the Composition of Clastic Sediments; Geological Society of America: Boulder, CO, USA, 1993; Volume 284. [Google Scholar]
- Nesbitt, H.W.; Young, G. Early Proterozoic climates and plate motions inferred from major element chemistry of lutites. Nature 1982, 299, 715–717. [Google Scholar] [CrossRef]
- Suttner, L.J.; Dutta, P.K. Alluvial sandstone composition and paleoclimate; I, Framework mineralogy. J. Sediment. Res. 1986, 56, 329–345. [Google Scholar]
- Lu, J.; Zhang, K.; Bowen, S.; Yadong, X.; Jianyu, Z.; Wei, H.; Daolai, Z. Paleogene-Neogene Pollen and Climate Change in Dahonggou Region of Qaidam Basin. Geosci. Front. 2020, 34, 732–744. [Google Scholar]
- Zachos, J.; Pagani, M.; Sloan, L.; Thomas, E.; Billups, K. Trends, Rhythms, and Aberrations in Global Climate 65 Ma to Present. Science 2001, 292, 686–693. [Google Scholar] [CrossRef]
- Zeng, Q.; Wang, B.; Xiluo, L.; Mao, G.; Liu, H.; Liu, G. Suture Zones in Tibetan and Tethys Evolution. Earth Sci. 2020, 8, 2735–2763. [Google Scholar]
- Zeng, L.; Haisheng, Y.I.; Xia, G.; Yuan, T. Sedimentary Sequences and Implications for Paleoenvironment of Cenozoic Lacustrine Stromatolites, Qaidam Basin. Geosci. Front. 2017, 40, 1251–1258. [Google Scholar]
- Zhang, K.; Wang, G.; Hong, H.; Xu, Y.; Wang, A. The study of the Cenozoic uplift in the Tibetan Plateau: A review. Geol. Bull. China 2013, 32, 1–18. [Google Scholar]
- Kong, H.; Zhao, J.; Hou, Z.; Si, D.; Zai, Z.; Ma, J.; Shen, Y. Provenance analysis and sedimentary environment evolution of the Neogene in Eboliang III structure of Qaidam Basin. J. Palaeogeogr. 2015, 17, 51–62. [Google Scholar]
- Yin, K.; Hong, H.L.; Li, R.B. Clay mineralogy and its palaeoclimatic indicator of the Late Oligocene and Early Miocene in Xunhua basin. Geol. Sci. Technol. Form. 2010, 29, 41–48. [Google Scholar]
- Yin, A.; Dang, Y.Q.; Chen, X.H.; Wang, L.Q.; Jiang, W.M.; Jiang, R.B.; Wang, X.F.; Zhou, S.P.; Liu, M.; Li-Xie, M.A. Cenozoic evolution and tectonic reconstruction of the Qaidam Basin: Evidence from seismic profiles. J. Geomech. 2007, 13, 193–211. [Google Scholar]
- Liu, Y.J.; Neubauer, F.; Genser, J.; Ge, X.H.; Takasu, A.; Yuan, S.H.; Chang, L.H.; Li, W.M. Geochronology of the initiation and displacement of the Altyn Strike-Slip Fault, western China. J. Asian Earth Sci. 2007, 29, 243–252. [Google Scholar] [CrossRef]
- Hanlie, H.; Chaowen, W.; Yaoming, X.; Kexin, Z.; Ke, Y. Paleoclimate Evolution of the Qinghai-Tibet Plateau since the Cenozoic. Earth Sci. (J. China Univ. Geosci.) 2010, 35, 728–736. [Google Scholar]


| Element Formation Samples | Lulehe n = 7 | Lower Part of Xiaganchaigou n = 8 | Upper Part of Xiaganchaigou n = 9 | Shangganchaigou n = 27 | Xiayoushashan n = 44 | Shangyoushashan n = 17 | |
|---|---|---|---|---|---|---|---|
| range | SiO2(%) | 49.43–66.35 | 53.13–61.43 | 54.12–61.89 | 23.86–59.32 | 20.99–67.85 | 35.86–67.86 |
| average | 59.89 | 58.09 | 56.81 | 49.74 | 52.76 | 55.22 | |
| range | Al2O3 (%) | 7.95–17.28 | 15.85–16.92 | 14.07–16.42 | 6.3–17.11 | 6.41–18.84 | 9.22–16.51 |
| average | 12.00 | 16.40 | 15.16 | 13.64 | 15.59 | 12.43 | |
| range | MgO (%) | 0.86–5.59 | 2.69–3.35 | 4.40–5.88 | 1.96–6.61 | 1.42–4.06 | 1.31–3.87 |
| average | 2.55 | 3.01 | 4.99 | 4.31 | 3.21 | 2.69 | |
| range | CaO (%) | 4.55–11.65 | 7.29–14.15 | 0.91–8.57 | 1.19–37.87 | 0.78–42.76 | 3.29–19.44 |
| average | 7.49 | 10.60 | 6.34 | 8.40 | 6.88 | 7.03 | |
| range | Na2O (%) | 0.96–2.55 | 0.82–1.26 | 0.99–2.64 | 0.75–2.03 | 0.91–2.44 | 1.49–2.81 |
| average | 1.70 | 1.03 | 1.37 | 1.49 | 1.62 | 2.11 | |
| range | K2O (%) | 1.5–3.46 | 3.51–4.33 | 1.25–3.63 | 1.68–3.97 | 1.68–4.66 | 1.8–4.09 |
| average | 2.47 | 3.94 | 2.83 | 2.96 | 3.44 | 2.53 | |
| range | Fe2O3 (%) | - | 5.73–6.59 | 5.86–7.68 | 2.74–9.18 | 2.09–9.09 | 2.93–7.81 |
| average | - | 6.31 | 6.83 | 6.15 | 6.50 | 5.09 | |
| range | δ13CVPDB | −7.8~−2.4 | −8.01~−5.70 | −8.71~−3.78 | −6.81~−3.80 | −6.81~−3.97 | −7.37~−3.24 |
| average | −4.41 | −6.40 | −5.24 | −5.34 | −5.00 | −5.02 | |
| range | δ18O VPDB | −13.4~−10.7 | −15.35~−11.16 | −16.62~−8.77 | −12.73~−6.98 | −11.1~−5.38 | −9.78~−0.93 |
| average | −12.56 | −13.19 | −13.30 | −9.94 | −8.63 | −7.75 |
| Formation Samples Element | Lulehe | Lower Part of Xiaganchaigou | Upper Part of Xiaganhcaigou | Shangganchaigou | Xiayoushashan | Shangyoushashan |
|---|---|---|---|---|---|---|
| n = 7 Range Average | n = 14 Range Average | n = 24 Range Average | n = 27 Range Average | n = 44 Range Average | n = 17 Range Average | |
| V (ppm) | 39.36–140.47 69.21 | 32.35–70.20 46.77 | 14.36–97.24 39.88 | 30.9–131.8 91.95 | 42.6–121.6 95.85 | 45.9–100.1 72.91 |
| Cr (ppm) | 54.7–103.28 73.61 | 29.14–61.62 43.9 | 26.23–86.17 49.4 | 30.1–107.2 74.43 | 18.6–99.7 74.48 | 45.7–80.5 59.96 |
| Co (ppm) | 5.9–20.49 11.03 | 2.23–8.97 4.22 | 3.16–13.99 7.05 | 2.7–30.2 17.77 | 7.5–34.8 20.39 | 5.4–22.3 12.14 |
| Ni (ppm) | 10.14–61 27.41 | 3.44–11.22 7.33 | 4.99–29.03 13.54 | 2.3–150.5 46.64 | 12.0–85.8 44.33 | 5.7–79.9 29.48 |
| Cu (ppm) | 10.7–33.57 20.83 | 7.06–15.72 9.94 | 6.32–28.91 13.64 | 13.9–66.6 31.54 | 9–58.6 18.58 | 10.3–67.3 26.59 |
| Zn (ppm) | 25.81–118.48 55.85 | 8.88–49.91 19.08 | 19.58–103.51 46.61 | 42.5–150.9 99.8 | 44.8–133.2 97.69 | 44.8–102.8 70.99 |
| Rb (ppm) | 53.23–98.9 77.43 | 55.84–113.82 73.17 | 57.28–144.99 82.45 | 47.8–148.8 106.15 | 142.7–660.2 235.44 | 185.2–462.3 256.34 |
| Sr (ppm) | 132.27–227.13 172.28 | 120.66–206.03 137.25 | 85.53–152.88 115.75 | 162.2–876.2 279.71 | 44.5–167.3 126.94 | 55.7–150.2 96.88 |
| Ba (ppm) | 431.11–622.13 509.64 | 400.82–1835.48 736.71 | 271.9–1402.61 527.94 | 223.5–1856.4 862.25 | 323.7–1594.8 590.9 | 421.1–1297.7 683.54 |
| Y (ppm) | 9.21–26.46 17.85 | 4.37–16.24 10.14 | 6.56–26.27 13.5 | 15.3–26.4 22.85 | 16–29.7 25.04 | 15.1–25.7 21.75 |
| Zr (ppm) | 99.53–331.5 224.64 | 60.36–173.87 119.39 | 71.74–334.93 165.66 | 91.5–246.4 138.41 | 79–203.7 145.02 | 114.4–230.3 165.39 |
| Nb (ppm) | 3.91–14.05 9.68 | 2.77–8.48 5.13 | 2.84–13.43 6.47 | 11.4–19.7 15.72 | 6.9–22.8 15.68 | 10.8–31.2 16.85 |
| La (ppm) | 12.97–42.28 26.91 | 5.13–29.41 12.86 | 9.34–47.06 21.18 | 9.5–79.3 44.17 | 12.1–97.3 51.84 | 14–66.9 38.14 |
| Pb (ppm) | 9–29.34 15.22 | 7.77–18.76 12.59 | 6.6–31.33 11.76 | 6.5–37.6 20.59 | 7.3–41.2 18.4 | 1–67.2 21.01 |
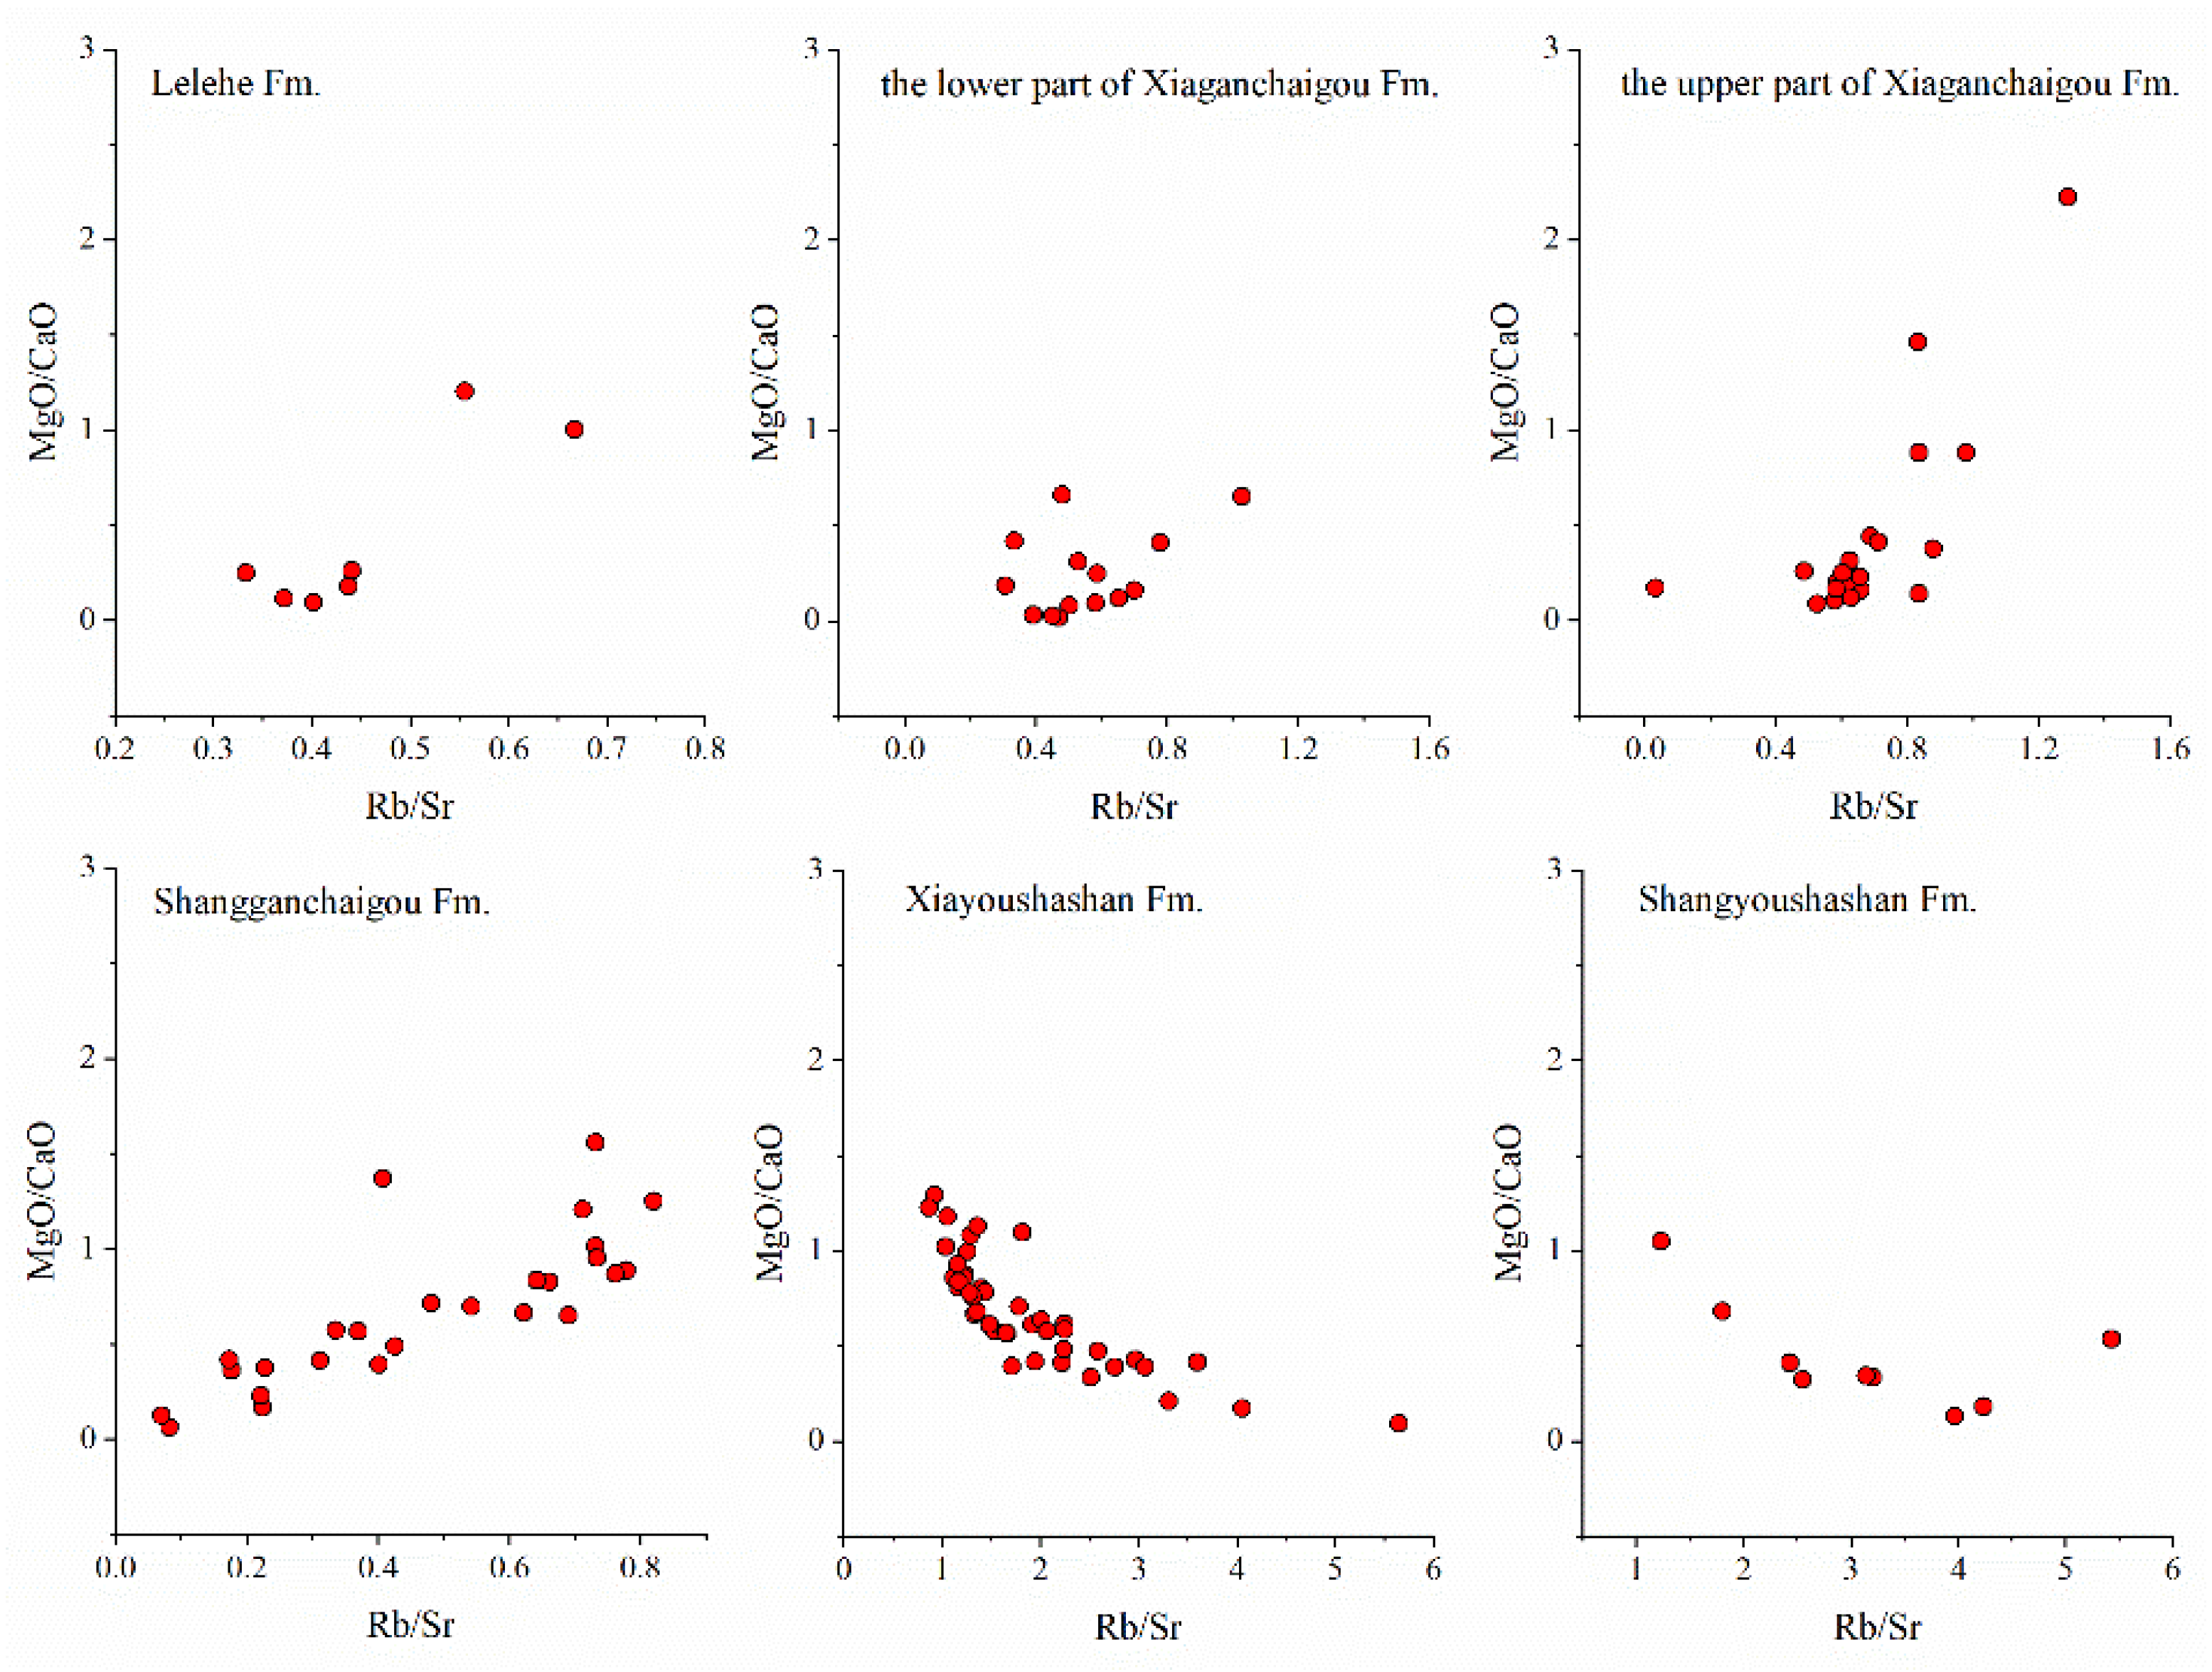
| MgO/CaO | 0.1–1.2 0.44 | 0.02–0.66 0.24 | 0.09–5.52 0.65 | 0.16–4.47 0.82 | 0.04–5.21 0.83 | 0.13–1.05 0.46 |
| Rb/Sr | 0.33–0.67 0.46 | 0.31–1.03 0.56 | 0.03–1.29 0.70 | 0.07–0.83 0.49 | 0.87–5.65 1.70 | 1.23–5.43 2.82 |
| V/Cr | 0.67–1.36 0.89 | 0.76–1.40 1.09 | 0.43–1.49 0.75 | 0.99–1.52 1.23 | 0.81–2.29 1.32 | 0.90–1.62 1.22 |
Publisher’s Note: MDPI stays neutral with regard to jurisdictional claims in published maps and institutional affiliations. |
© 2022 by the authors. Licensee MDPI, Basel, Switzerland. This article is an open access article distributed under the terms and conditions of the Creative Commons Attribution (CC BY) license (https://creativecommons.org/licenses/by/4.0/).
Share and Cite
Wang, Y.; Sun, G.; Zhang, S.; Cantarero, I.; Cruset, D.; Baqués, V.; Guo, H.; Bo, S.; Travé, A. Depositional Environment Changes during the Cenozoic in the Northeastern Margin of the Qinghai–Tibet Plateau. Processes 2022, 10, 1000. https://doi.org/10.3390/pr10051000
Wang Y, Sun G, Zhang S, Cantarero I, Cruset D, Baqués V, Guo H, Bo S, Travé A. Depositional Environment Changes during the Cenozoic in the Northeastern Margin of the Qinghai–Tibet Plateau. Processes. 2022; 10(5):1000. https://doi.org/10.3390/pr10051000
Chicago/Turabian StyleWang, Yetong, Guoqiang Sun, Shuncun Zhang, Irene Cantarero, David Cruset, Vinyet Baqués, Hui Guo, Shangshang Bo, and Anna Travé. 2022. "Depositional Environment Changes during the Cenozoic in the Northeastern Margin of the Qinghai–Tibet Plateau" Processes 10, no. 5: 1000. https://doi.org/10.3390/pr10051000
APA StyleWang, Y., Sun, G., Zhang, S., Cantarero, I., Cruset, D., Baqués, V., Guo, H., Bo, S., & Travé, A. (2022). Depositional Environment Changes during the Cenozoic in the Northeastern Margin of the Qinghai–Tibet Plateau. Processes, 10(5), 1000. https://doi.org/10.3390/pr10051000