1. Introduction
Wastewater production from industries and its management have always been a challenge for the industrial sector. In recent years, the regulations on wastewater discharge into local municipal sewage lines and to the natural water basins have become stricter. In Norway, particularly the water basins leading to Skagerrak and the North Sea have been identified as some of the most sensitive areas [
1]. Chemical industries that fall along the southern coast of Norway close to the Skagerrak region have been strictly regulated for their wastewater discharge. The wastewater generated from one of such companies is challenged by a stricter discharge limitation with a permitted quantity reduced by the government as it is looking to expand its production capacity through the coming years. The wastewater is currently being trucked offsite to a third-party treatment plant, which is an expensive ordeal for the company operator, and is also unsustainable, emitting large quantities of CO
2. To turn this challenge into an opportunity, the pharmaceutical company in partnership with Biowater Technology AS evaluated options for an on-site, low footprint, highly efficient biological wastewater treatment plant.
The aim of the study was to provide robust and sustainable solutions, minimizing and abating emissions as per the Industrial Emissions Directive (IED) by applying best available techniques (BAT) to comply with BAT associated emission levels (BAT-AEL) or equivalent produced by the Norwegian regulator, being able to document compliance through adequate and relevant monitoring and control procedures and controls.
Knowing little about the wastewater quantity, its contents, and variations, Biowater Technology proposed a pilot study to understand the wastewater quality and its treatability. Considering the estimated high COD concentration and strict discharge requirement meant that organic content needed to be reduced by more than 90%. On the other hand, the total suspended solids needed to be as low as 35 mg/L in the final effluent. Therefore, Biowater Technology proposed a containerized pilot system that consisted of both an anaerobic expanded granular sludge bed (EGSB) reactor [
2] and an aerobic biofilm continuous flow intermittent cleaning (CFIC
®, Biowater Technology AS, Tonsberg, Norway, EU patent No.2438019) [
3] reactor running in series to maximize the biological organic removal.
Anaerobic digestion is one of the preferred methods to treat industrial wastewater [
4] due to its greater efficiency, low maintenance, ease of operation, and harmless sludge with less or no addition of chemicals [
5]. EGSB is a type of anaerobic digestion system that embellishes all the benefits with a compact design that occupies a fraction of the footprint of the traditional design. EGSB, as the name suggests uses a granular sludge bed that is rich in anaerobic bacterial species which can stay inside the reactor for a long time while cleaning the wastewater within hours [
6]. This is why EGSB is classified as a high-rate anaerobic process and is the most preferred form of anaerobic digestion for industrial wastewater treatment [
5,
7].
The aerobic treatment of wastewater is mostly applied for high volume, low concentration wastewater as it can take up large footprint. However, the development of the moving bed biofilm reactor (MBBR) has made it possible to use aerobic treatment for industrial wastewater treatment [
8,
9]. MBBR uses specialized plastic biocarriers to which the aerobic bacteria can attach and form a biofilm [
10]. This makes the MBBR process significantly more efficient and smaller in size compared to conventional activated sludge treatment. A CFIC
® reactor is a very compact aerobic biofilm reactor that follows the basic principles of MBBR by operating in two modes. The normal cleaning mode is operated with over 90% biocarrier filling ratio and the washing modes operate at less than 70% of an MBBR reactor [
11]. Due to this, the normal mode significantly reduces the demand on air supply to the reactor for the major part of operation and makes the process more efficient.
Many previous studies have demonstrated the inhibitory effects of salinity on the anaerobic process and adopted acclimatization to overcome it, although they were ultimately unsuccessful [
12,
13,
14]. Other studies were successful in overcoming the hypersaline inhibition by enriching species of halophilic methanogens (that are active in the marine and brackish sediments) combined with a mixed anaerobic culture capable of handling sodium concentrations of about 35 g/L [
15,
16,
17,
18].
In this article, the fully automated pilot container was designed, constructed, and operated onsite to investigate the degradation capability of pharmaceutical wastewater. The wastewater with varying concentrations and high salinity and organic contents was loaded to the pilot to identify the best operation conditions with the proposed processes. The study was conducted using mixed anaerobic culture with no prior enrichment of any specific species. However, the pilot was operated in adaptive phase (high COD and high salinity) for five months before testing with more realistic wastewater conditions. The pilot also served as a training tool for industry operators to build confidence in monitoring the reactor performance and operating a potential full-scale plant with a similar concept.
2. Materials and Methods
A fully automatic containerized pilot plant (20 ft/6.1 m) was constructed and set up by Biowater Technology in 2018 onsite for a pharmaceutical client to demonstrate the proposed solution (EGSB in combination with Biowater’s patented CFIC®) for treating the hypersaline wastewater.
2.1. Design of the Pilot Plant
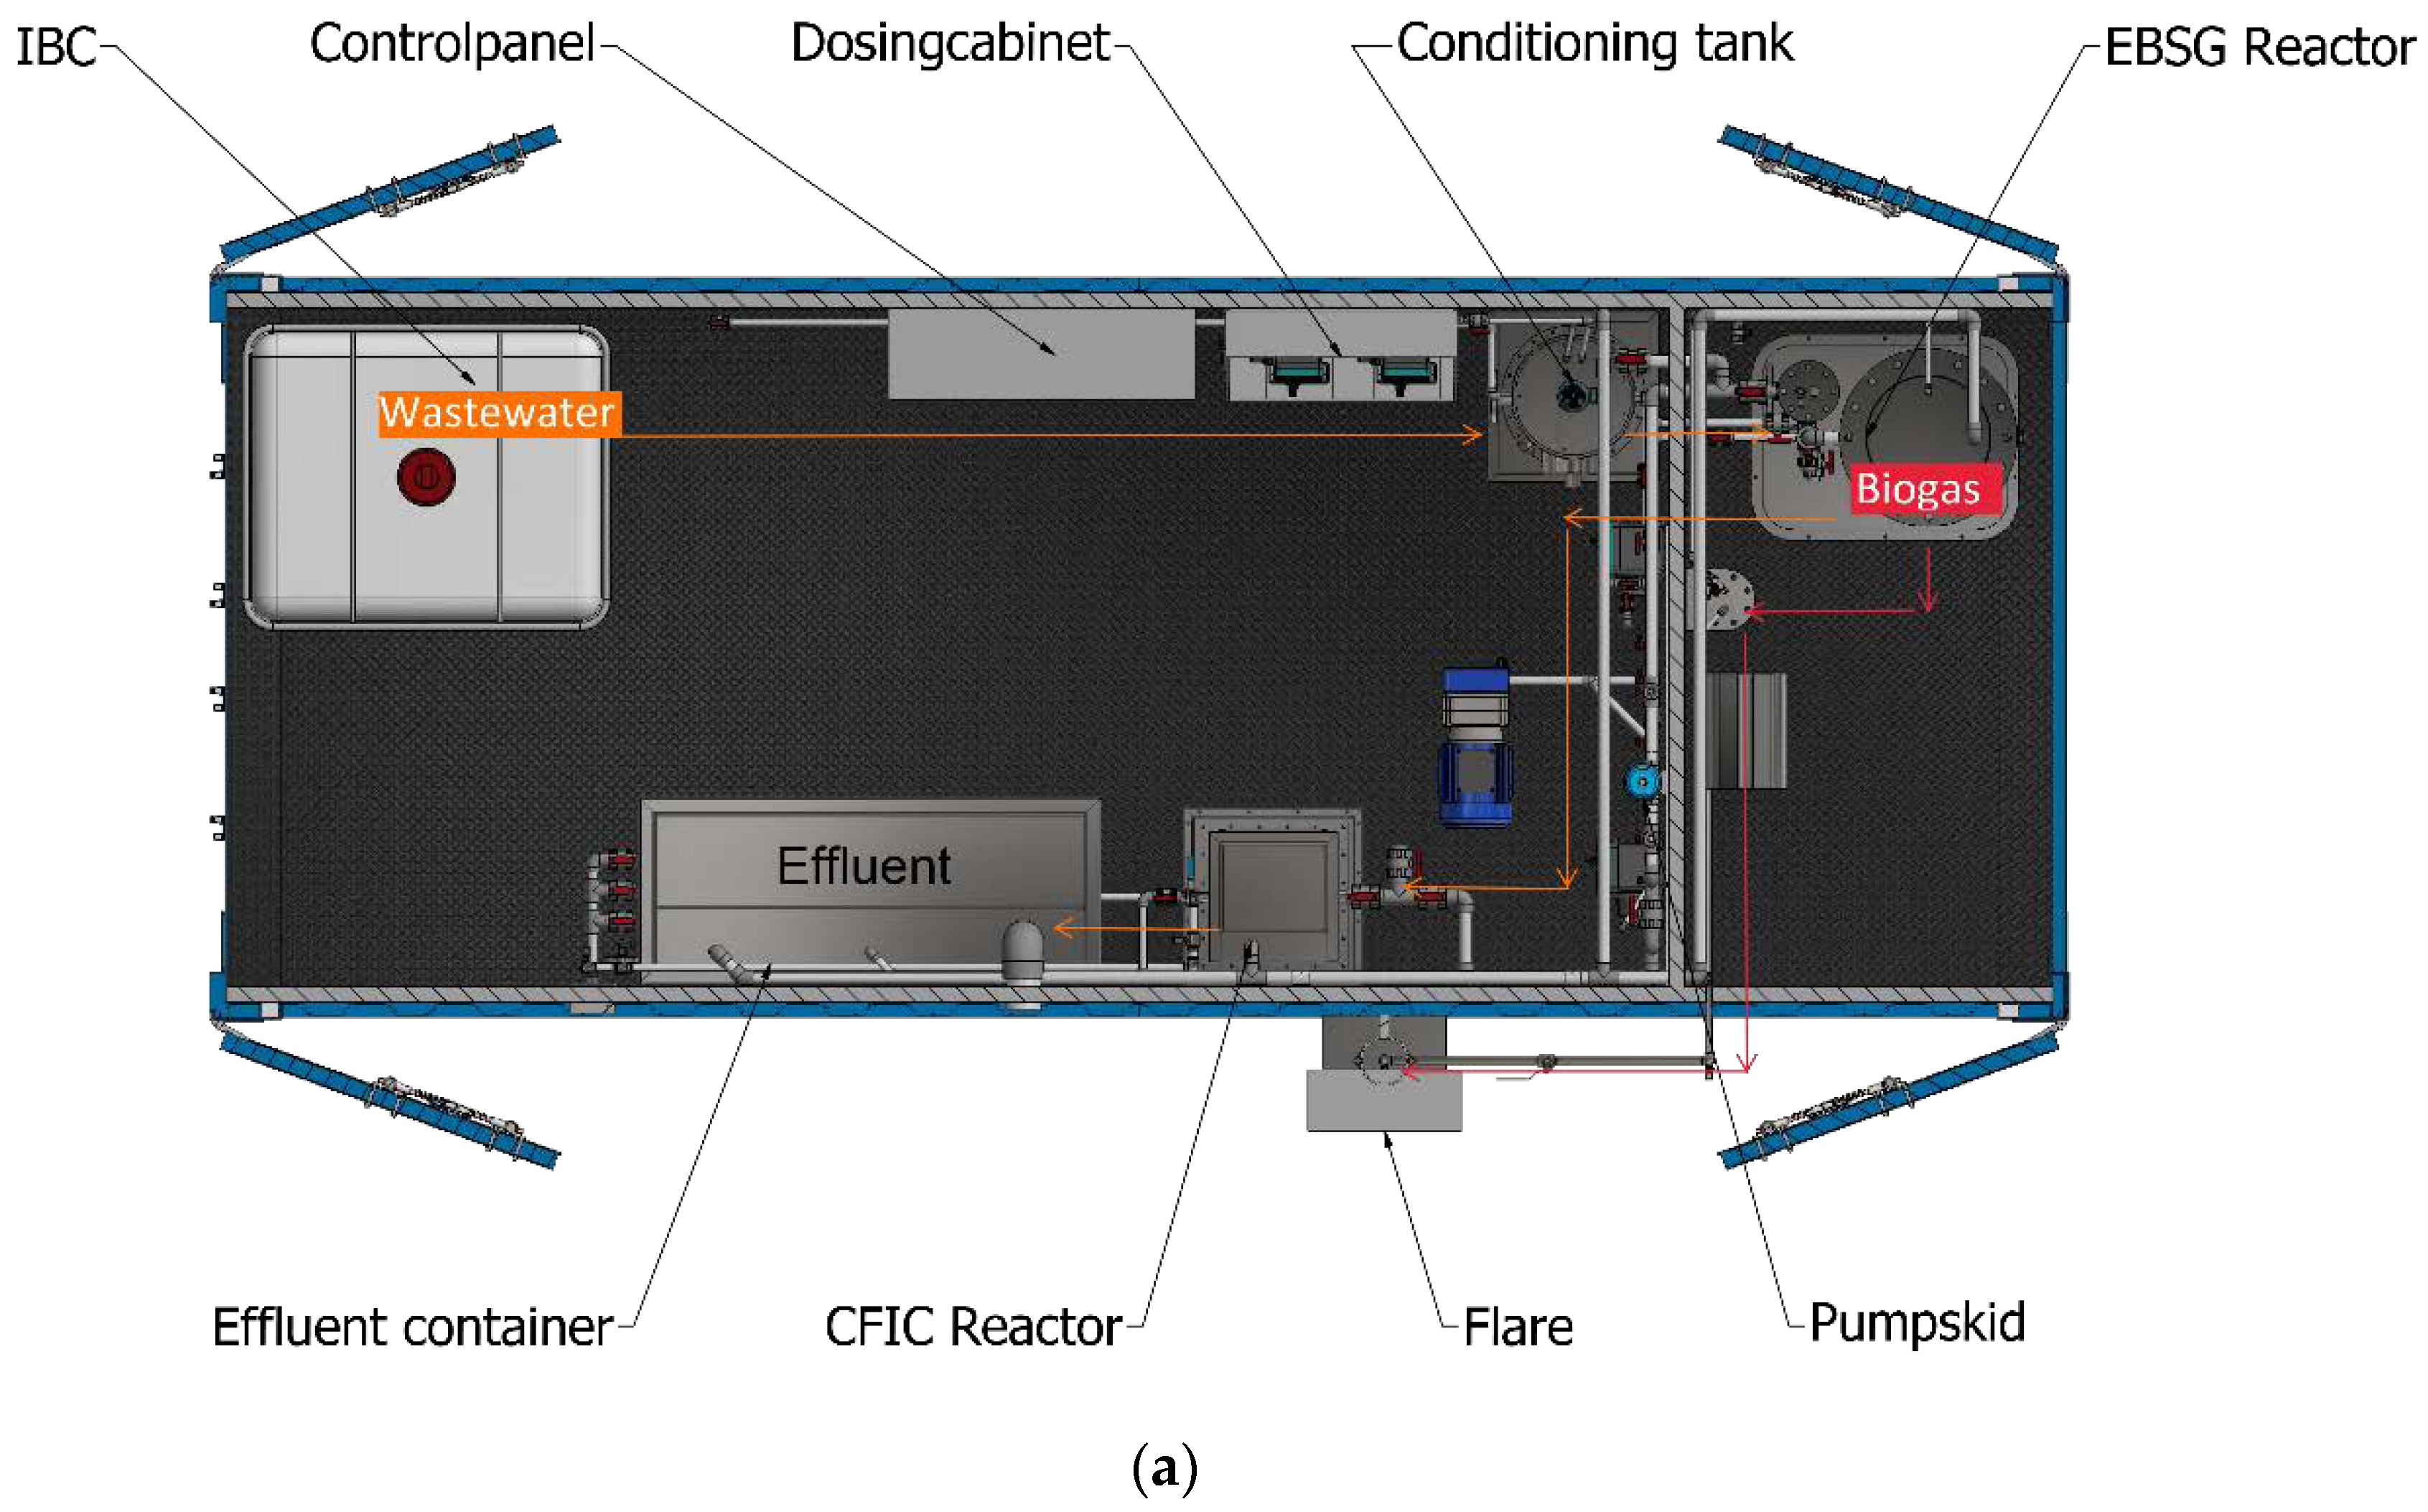
The pilot container consisted of two separate sections, namely an anaerobic section and a control room with an aerobic reactor. Due to the potential explosive zone (EX zone) around the anaerobic reactor, the anaerobic section with a dedicated entrance was separated from the other one by a solid wall (
Figure 1). The anaerobic section contains an EGSB reactor of dimensions 0.4 m diameter × 1.55 m height with a volume of 200 L and an external recycle loop, a biogas condensate, and a biogas flowmeter. A 3-phase separator on top of the EGSB separates the liquid effluent and biogas towards the recycle pipe. The recycle column is placed parallel to the EGSB to hold enough anaerobically treated wastewater, which is partially recycled back to the EGSB merging with feed wastewater. Biogas flows continuously through the separator to the biogas condensate pit and is eventually burned by the flare automatically. The flare system is mounted to the outer wall of the container (
Figure 1).
The other section (non-EX zone) contains a wastewater storage IBC, a condition tank where the wastewater temperature, pH, and nutrient contents can be adjusted and controlled through a heater, and chemical dosing pumps, respectively. The equalization tank has a volume of 110 L. The section also hosts a CFIC reactor of the size 0.42 m × 0.42 m × 1.6 m = 282 L. An effluent storage tank where the wastewater from CFIC normal and washing modes and an overflow of the EGSB can be collected separately is also placed in the non-EX zone. The operating volume of the CFIC is 176 L (height = 1.0 m) and it increases to 230 L (height = 1.3 m) during the intermittent forward washing cycle (FWC/washing mode). The wastewater flow route (orange lines) is given in
Figure 1.
2.2. Control Logic and Operational Methods
The pilot reactor is a fully automated reactor with remote monitoring access through Teamviewer® software. The control system consists of a Siemens programmable logic controller (PLC) and Citect supervisory control and data acquisition (SCADA) as the operator interface.
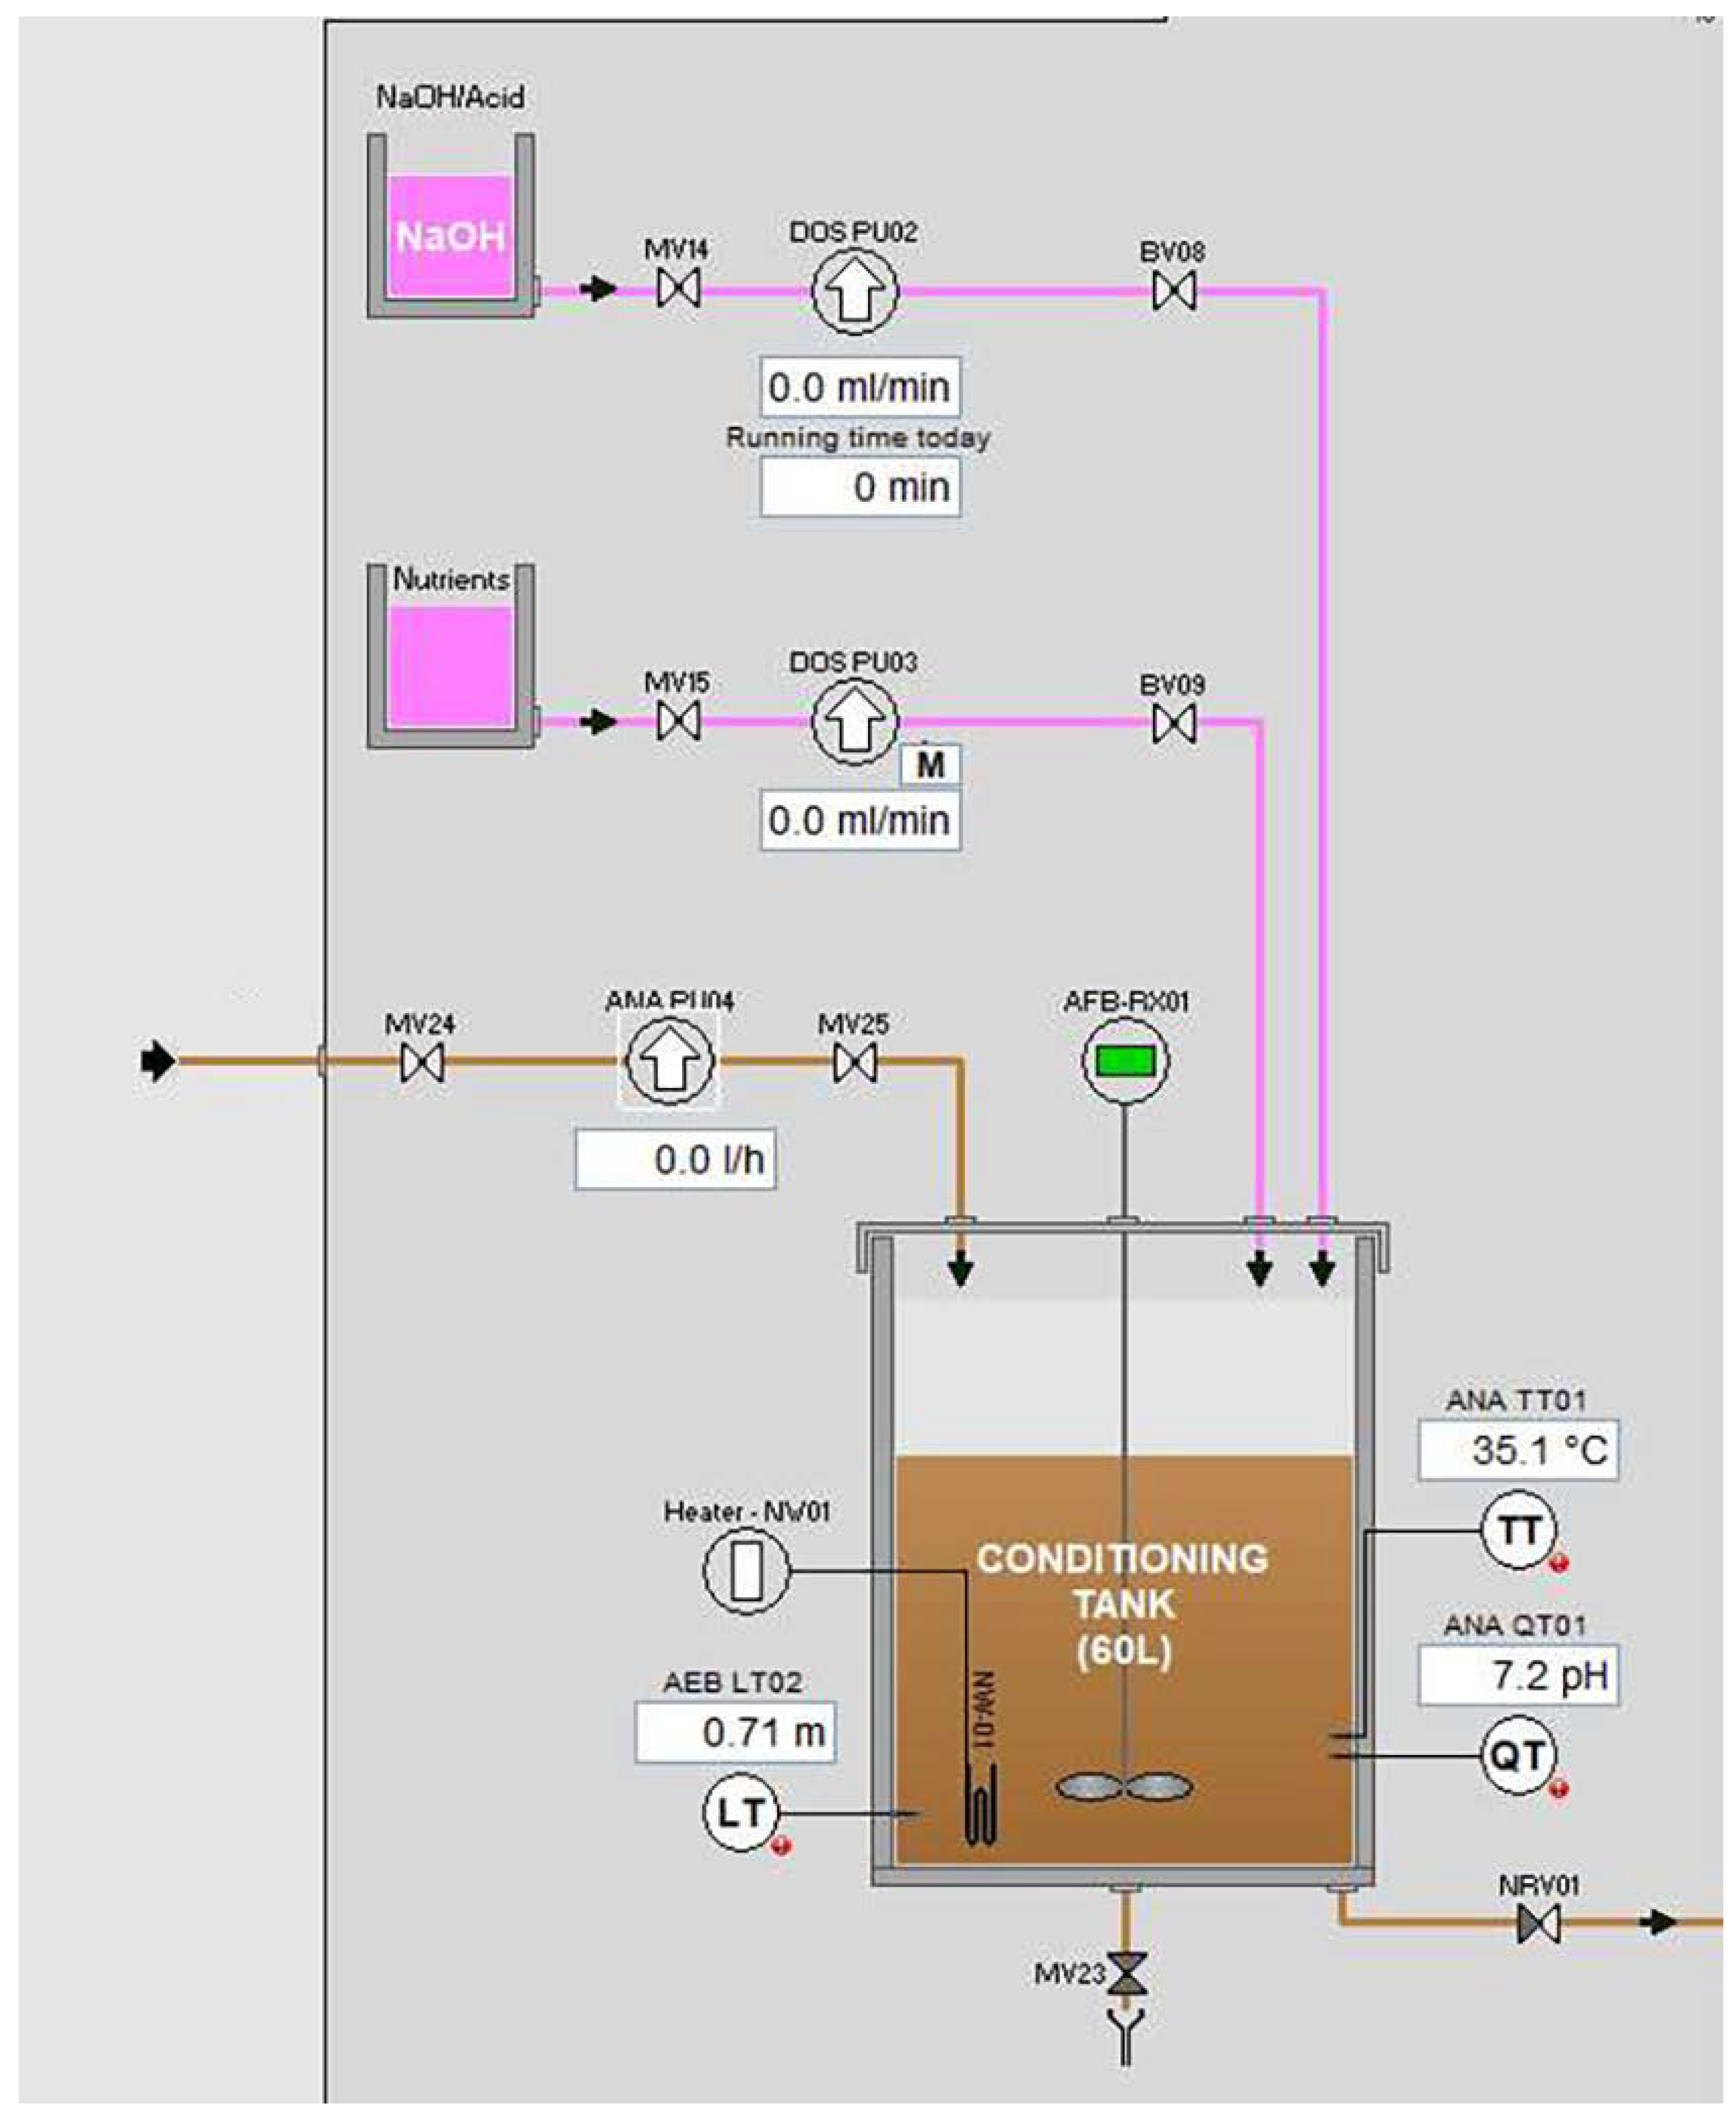
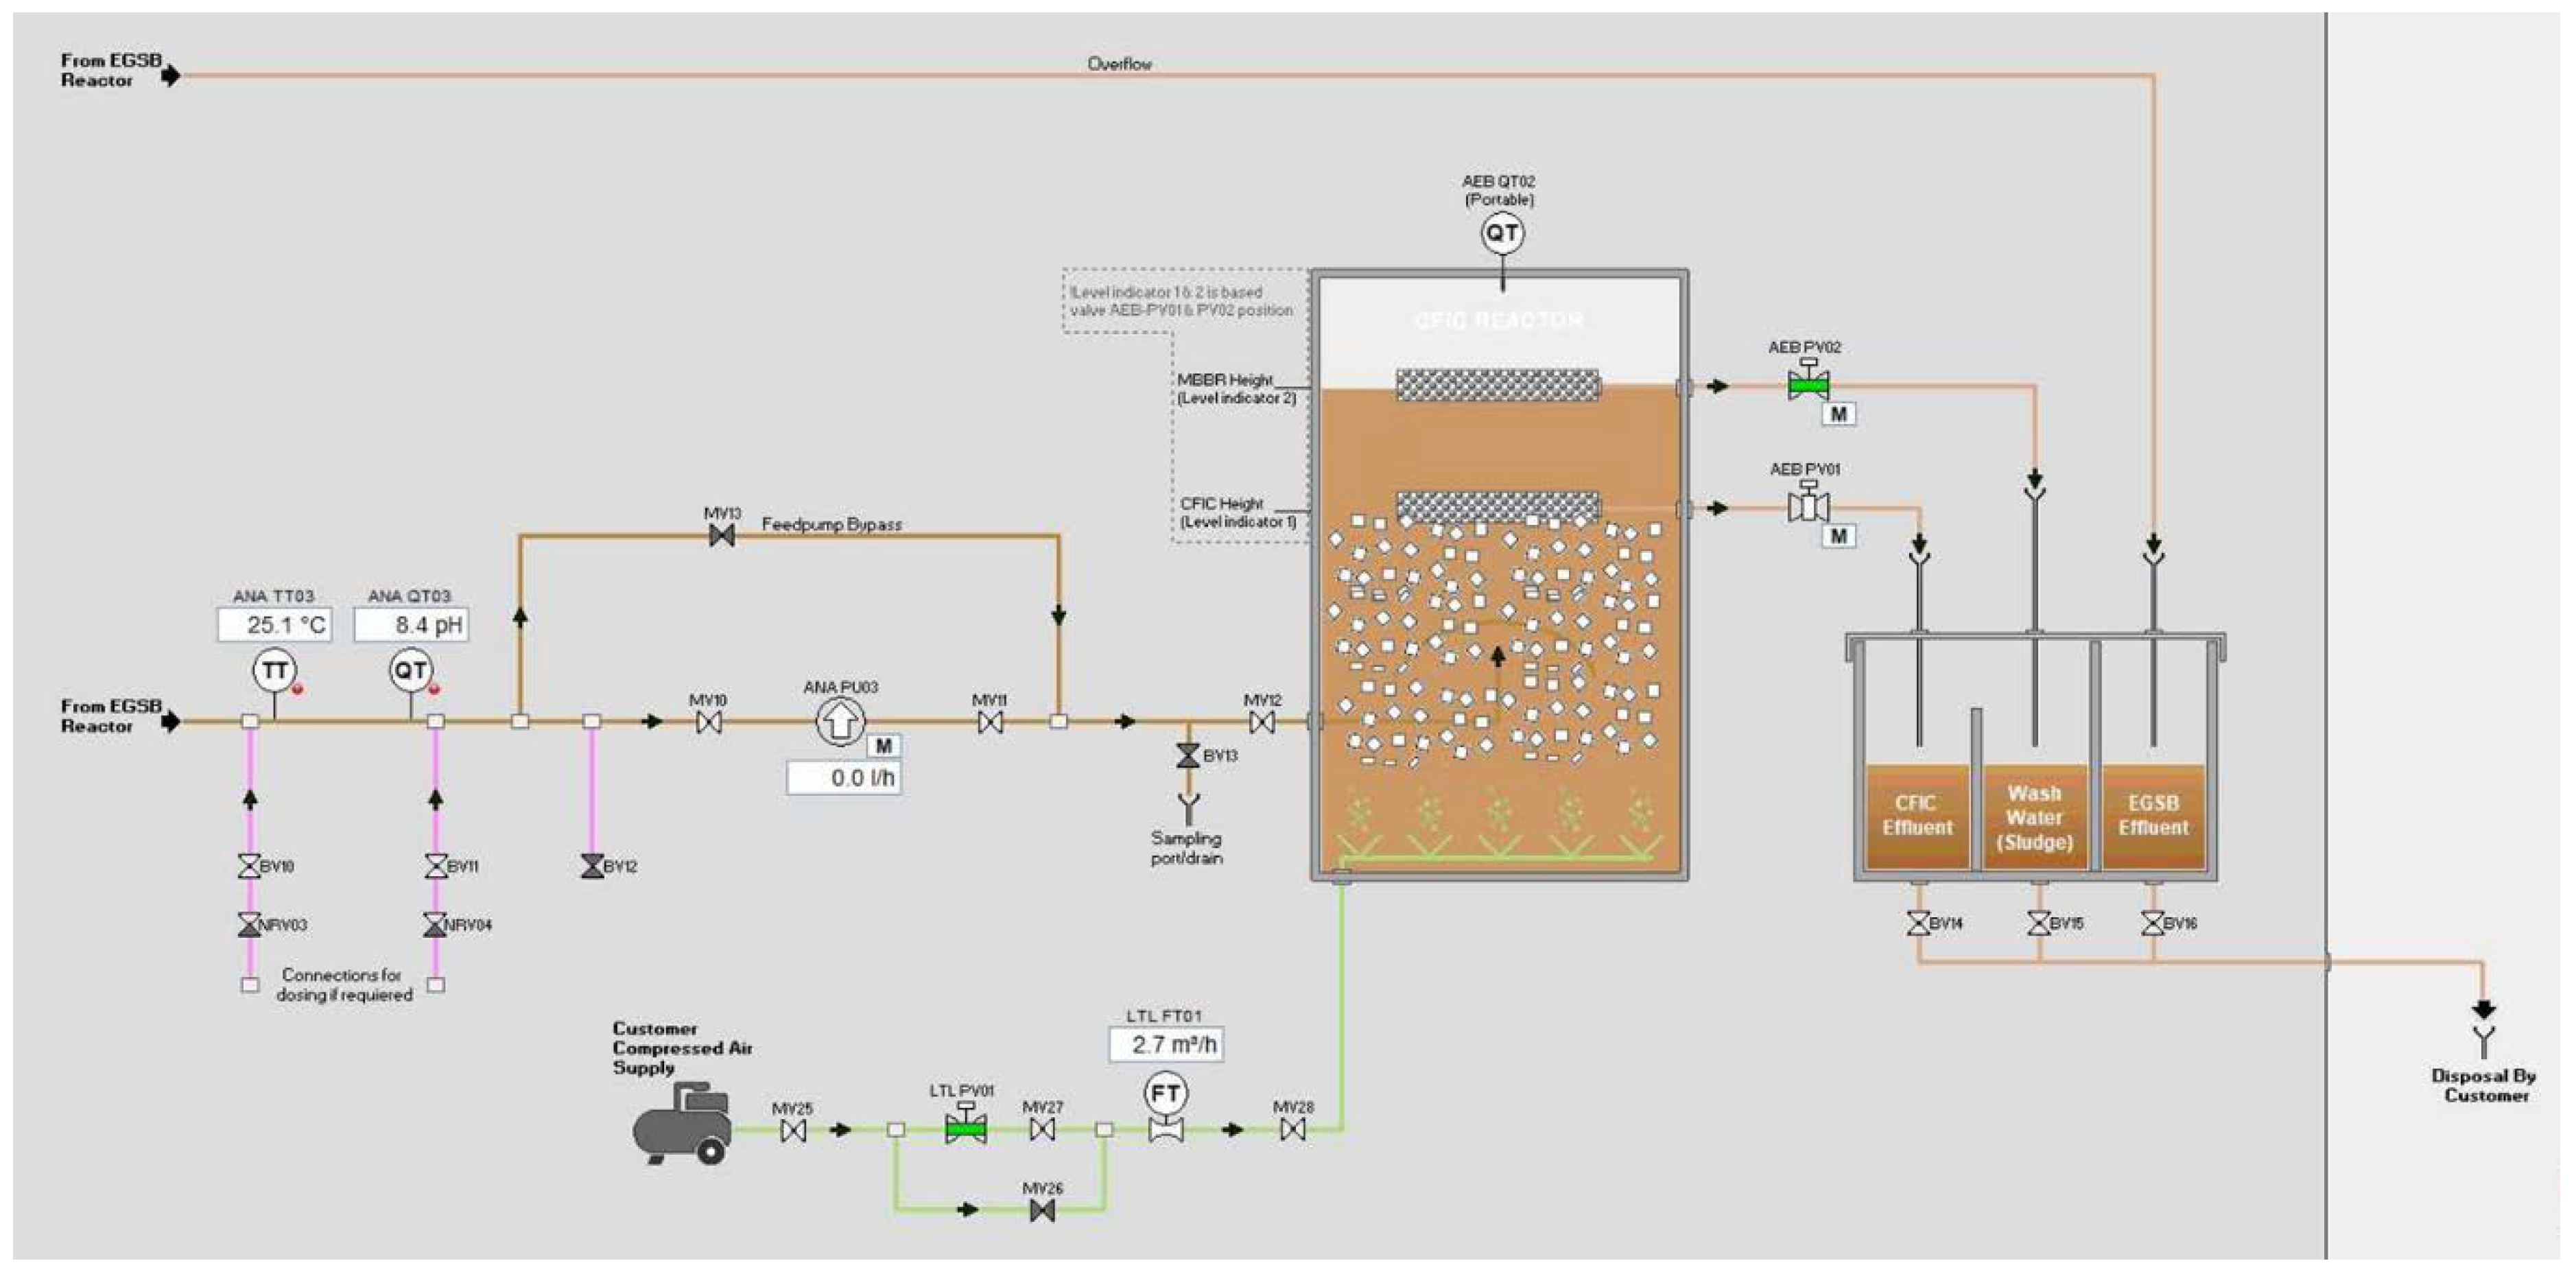
In the control interface, different control parameters for each stage of the pilot system, such as the temperature and pH of wastewater in the conditioning tank and wastewater feed rate to the reactors are presented (
Figure 2). Operational data are recorded in the SCADA system, which can be extracted for data analysis (
Figure 2). The drum type biogas flow meter (Ritter) and flare system were monitored onsite at the pilot plant and were not integrated to the PLC.
The control system controls and monitors critical operational parameters and raises alarms when the pH, water level, and water temperature are out of the operational ranges and stops the operation of the pumps/valves when the setpoint conditions are breached. Alarms are also given when electrical and mechanical issues appear, such as pump leakage and cable breaks.
2.2.1. Feed Control
Wastewater was automatically pumped from the 1 m
3 IBC storage tank to the conditioning tank by pump 1 to reach a setpoint (
Figure 2). Different height setpoints were given during the pilot study, which induce different hydraulic retention times in the conditioning tank. The wastewater in the conditioning tank was well mixed by an overhead mixer and its pH, nutrient content, and temperature were adjusted by proportional integral derivative (PID) control of the chemical dosing pumps 1 and 2 (
Figure 2) and the heater, respectively. The feed pump 1 was regulated by the water level (level transmitter) in the conditioning tank. Wastewater in the conditioning tank after adjustment was further pumped to the EGSB by pump 2 (
Figure 2).
2.2.2. EGSB Control
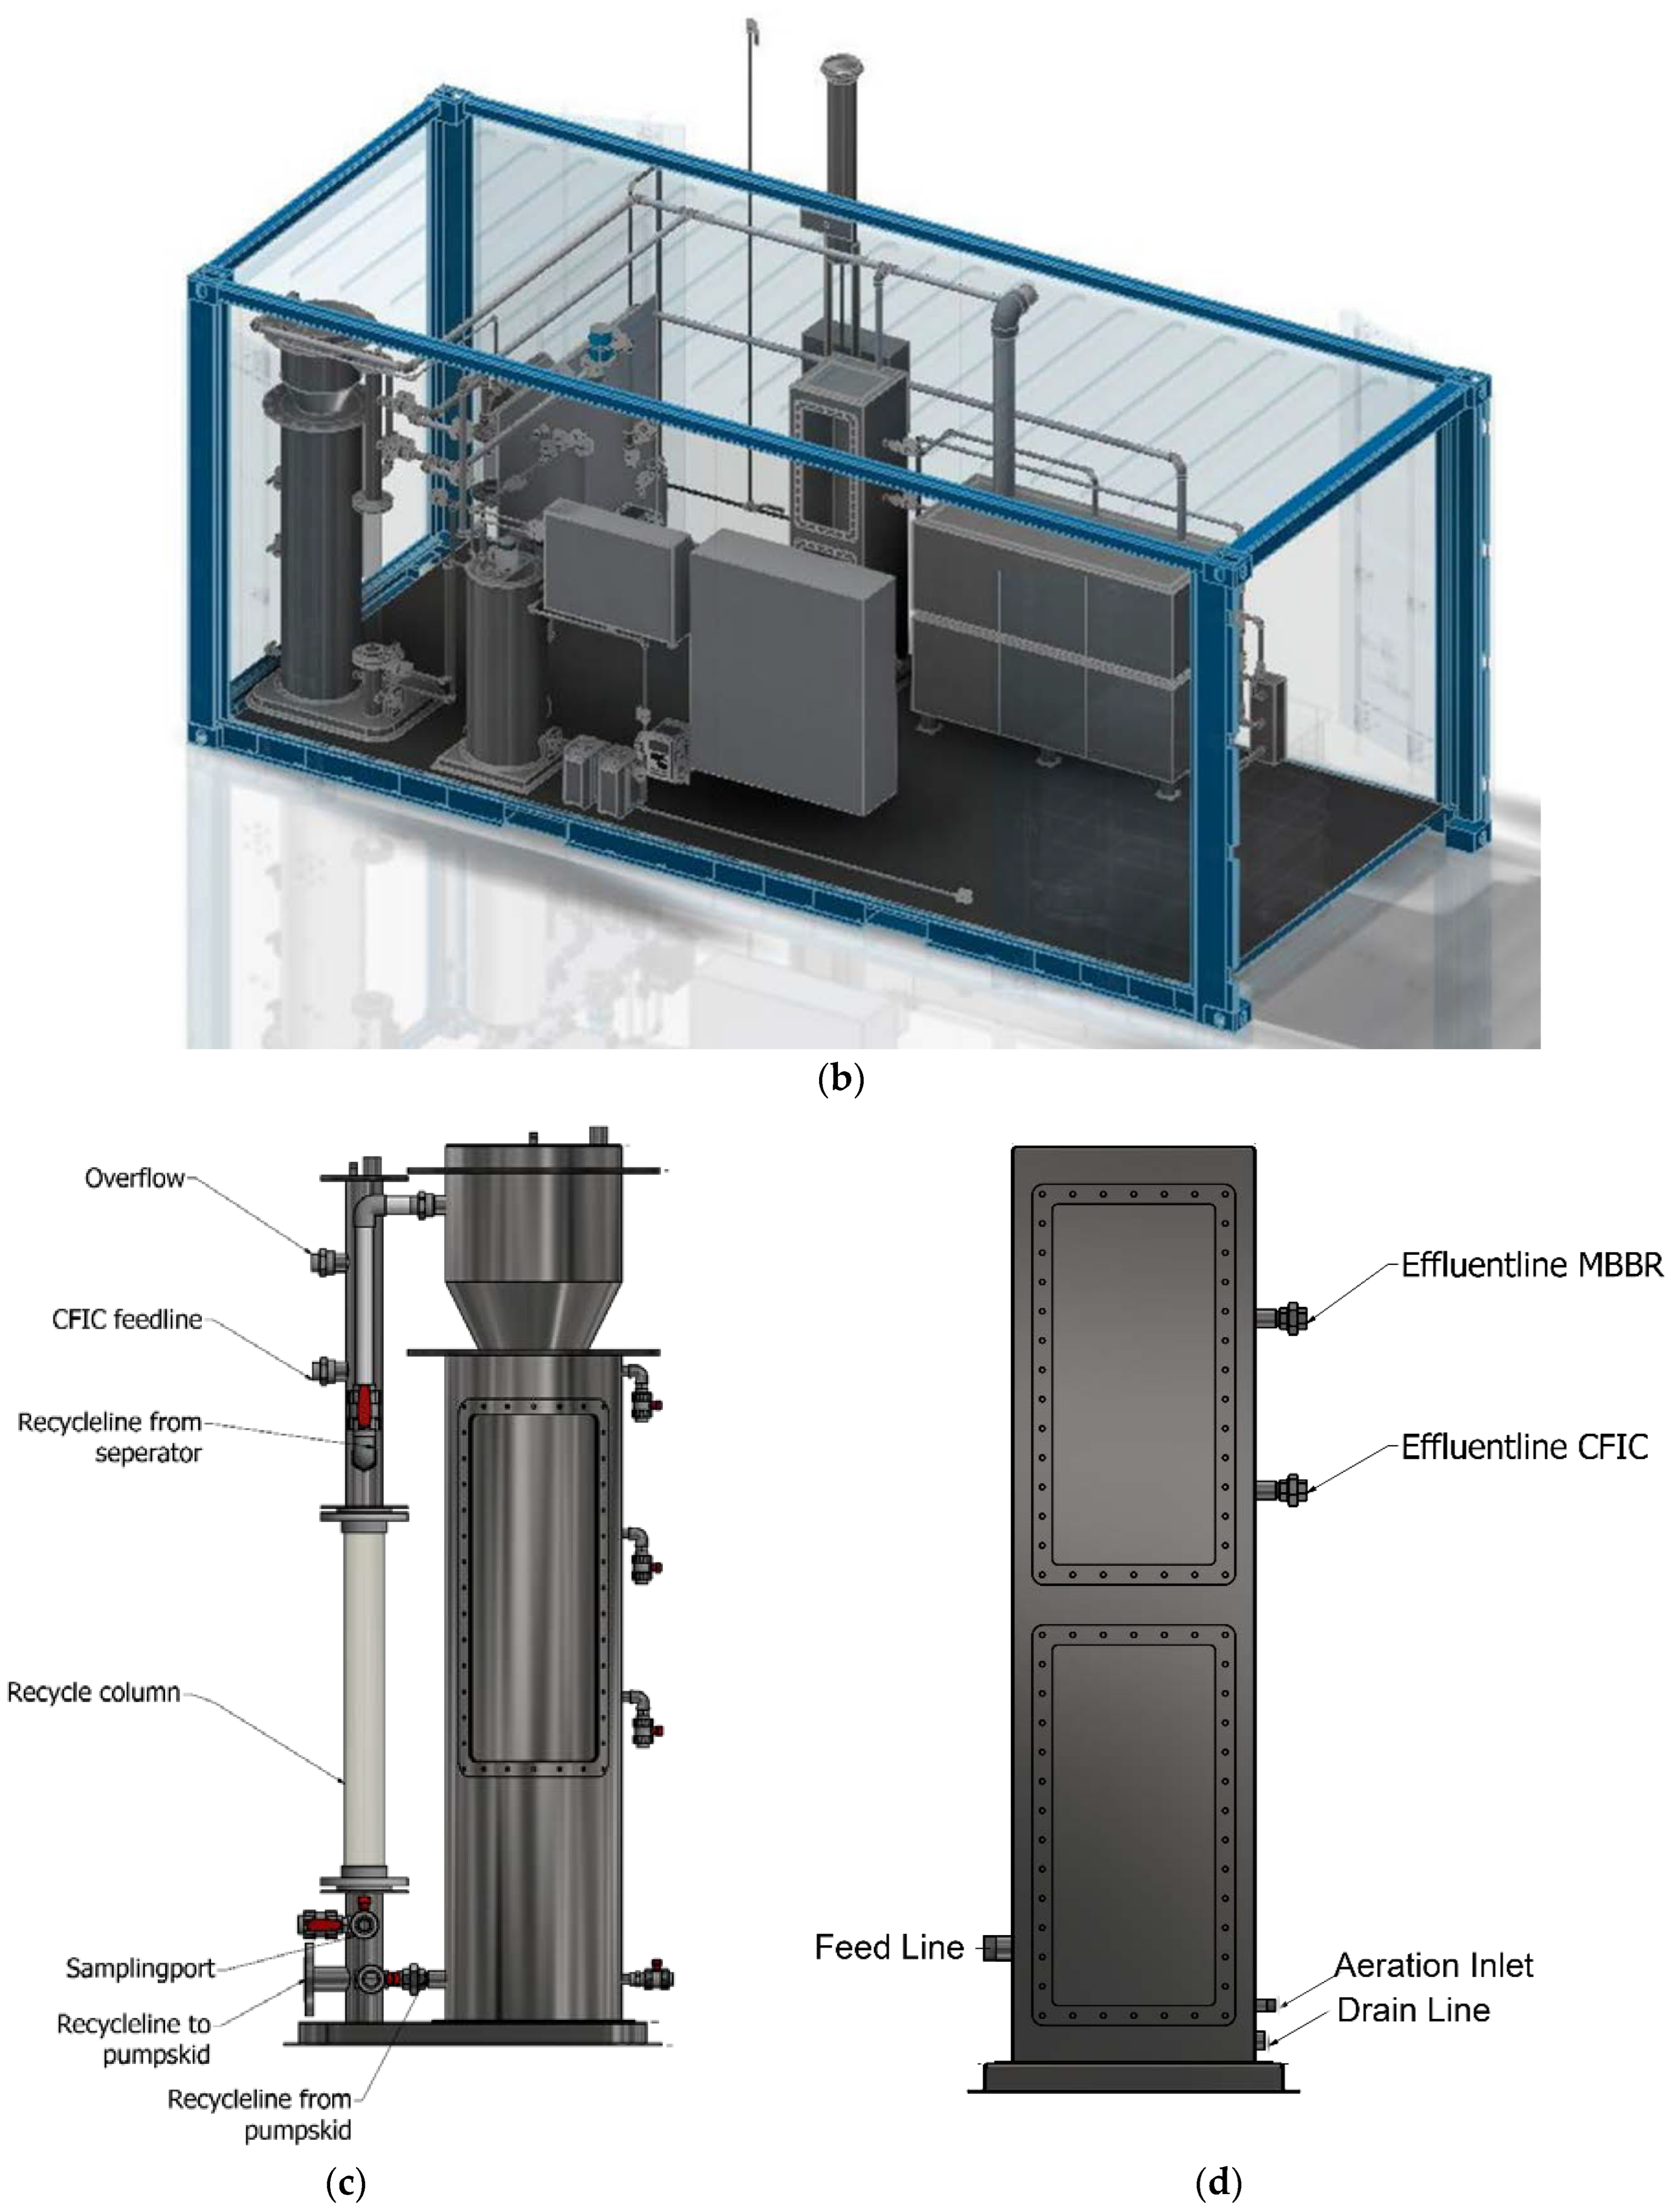
The EGSB reactor was equipped with a recycle column (
Figure 1C and
Figure 3) which receives the effluent from the EGSB reactor and partially recycled back by the recycle pump to the bottom of EGSB merging with wastewater feed from the conditioning tank by pump 2 (
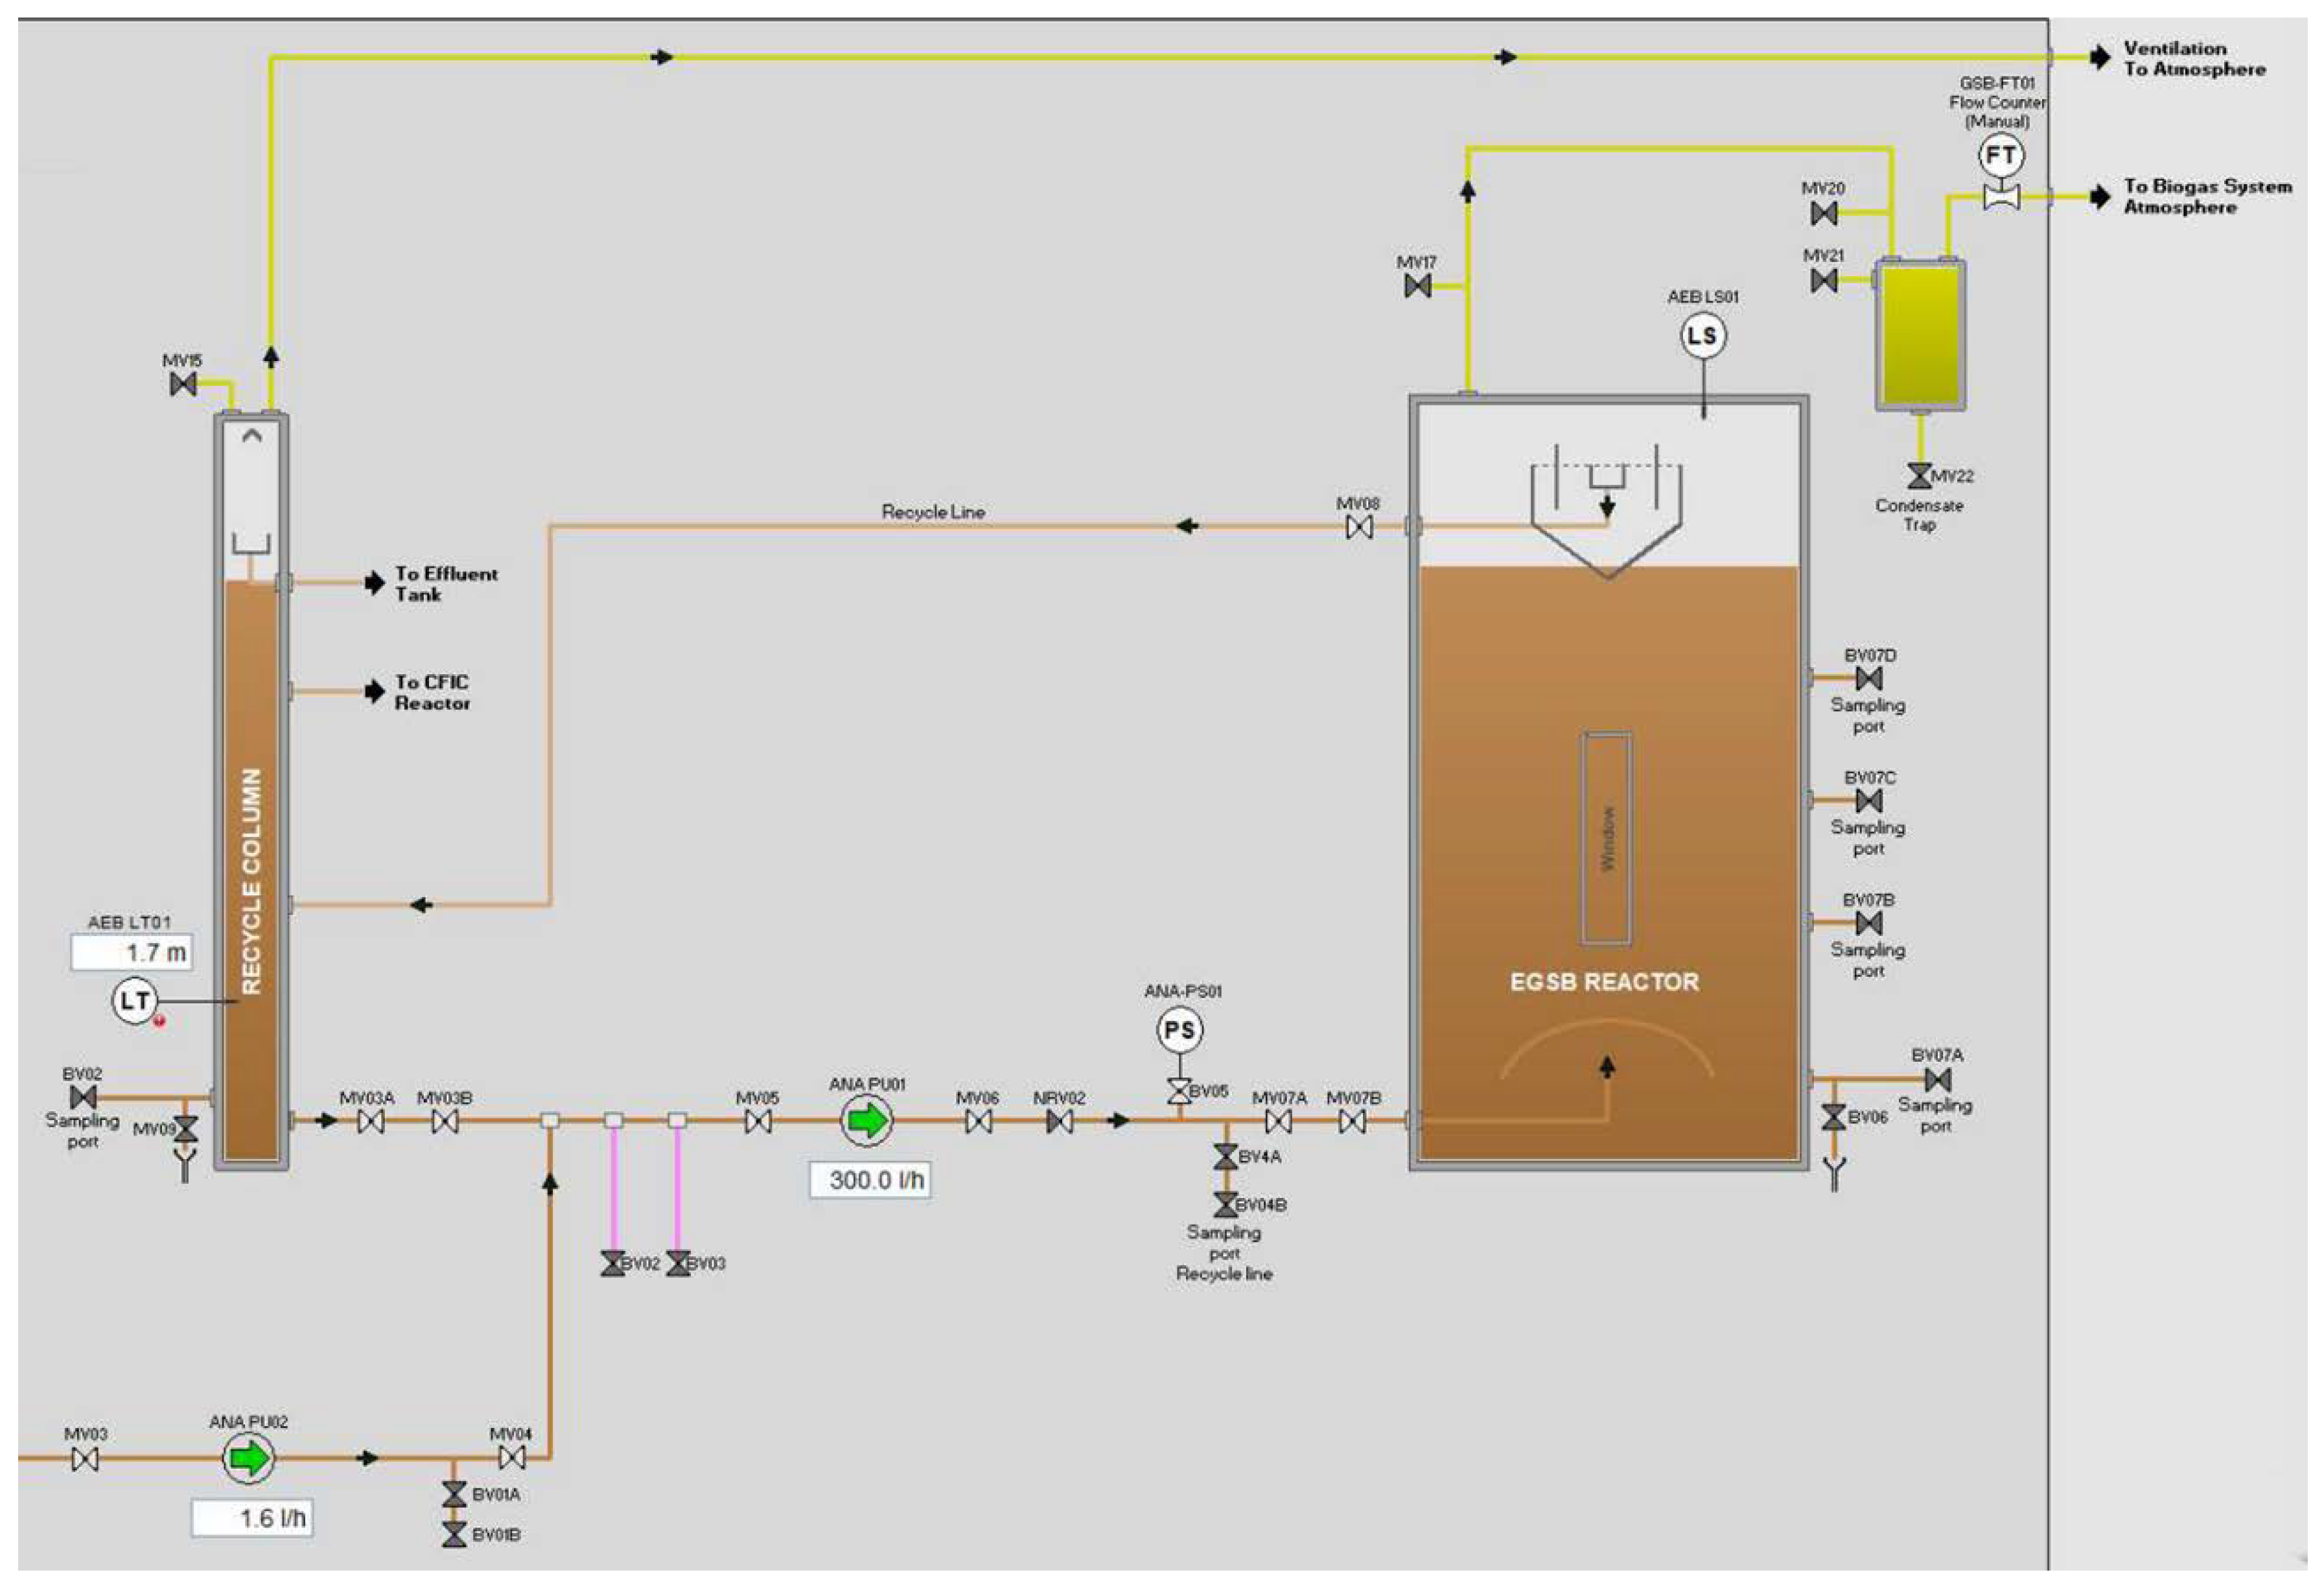
Figure 3). The waster height in the recycle column is indicated by a level transmitter. The EGSB has a constant water height while in the recycle column the water level varies due to the pressure applied by biogas, as indicated by the level transmitter. The EGSB effluent pH and temperature were monitored inline of the pipeline leading the wastewater to the CFIC stage. No temperature and pH regulation were conducted to the EGSB effluent. There are 4 sampling points along the height of the EGSB for collecting sludge samples.
Biogas produced in the EGSB was separated by the gas liquid separator on top of the EGSB together with some of the biogas degassed from the top of the recycle column before being transported through pipelines to the condensate pit and out of the pilot container. The biogas was dewatered in the condensate pit and the flow was recorded by the biogas flow meter. The biogas was then burned in the flare system without being stored (
Figure 1). Due to the relatively small biogas quantity, the flare was automatically ignited at a predetermined frequency.
The top of the EGSB is equipped with a level switch to identify water overflow from the EGSB, which will stop pump 2 and the recycle pump. To prevent high-pressure build up in the recycle line, a pressure switch placed inline is used to stop the complete system.
2.2.3. CFIC Control
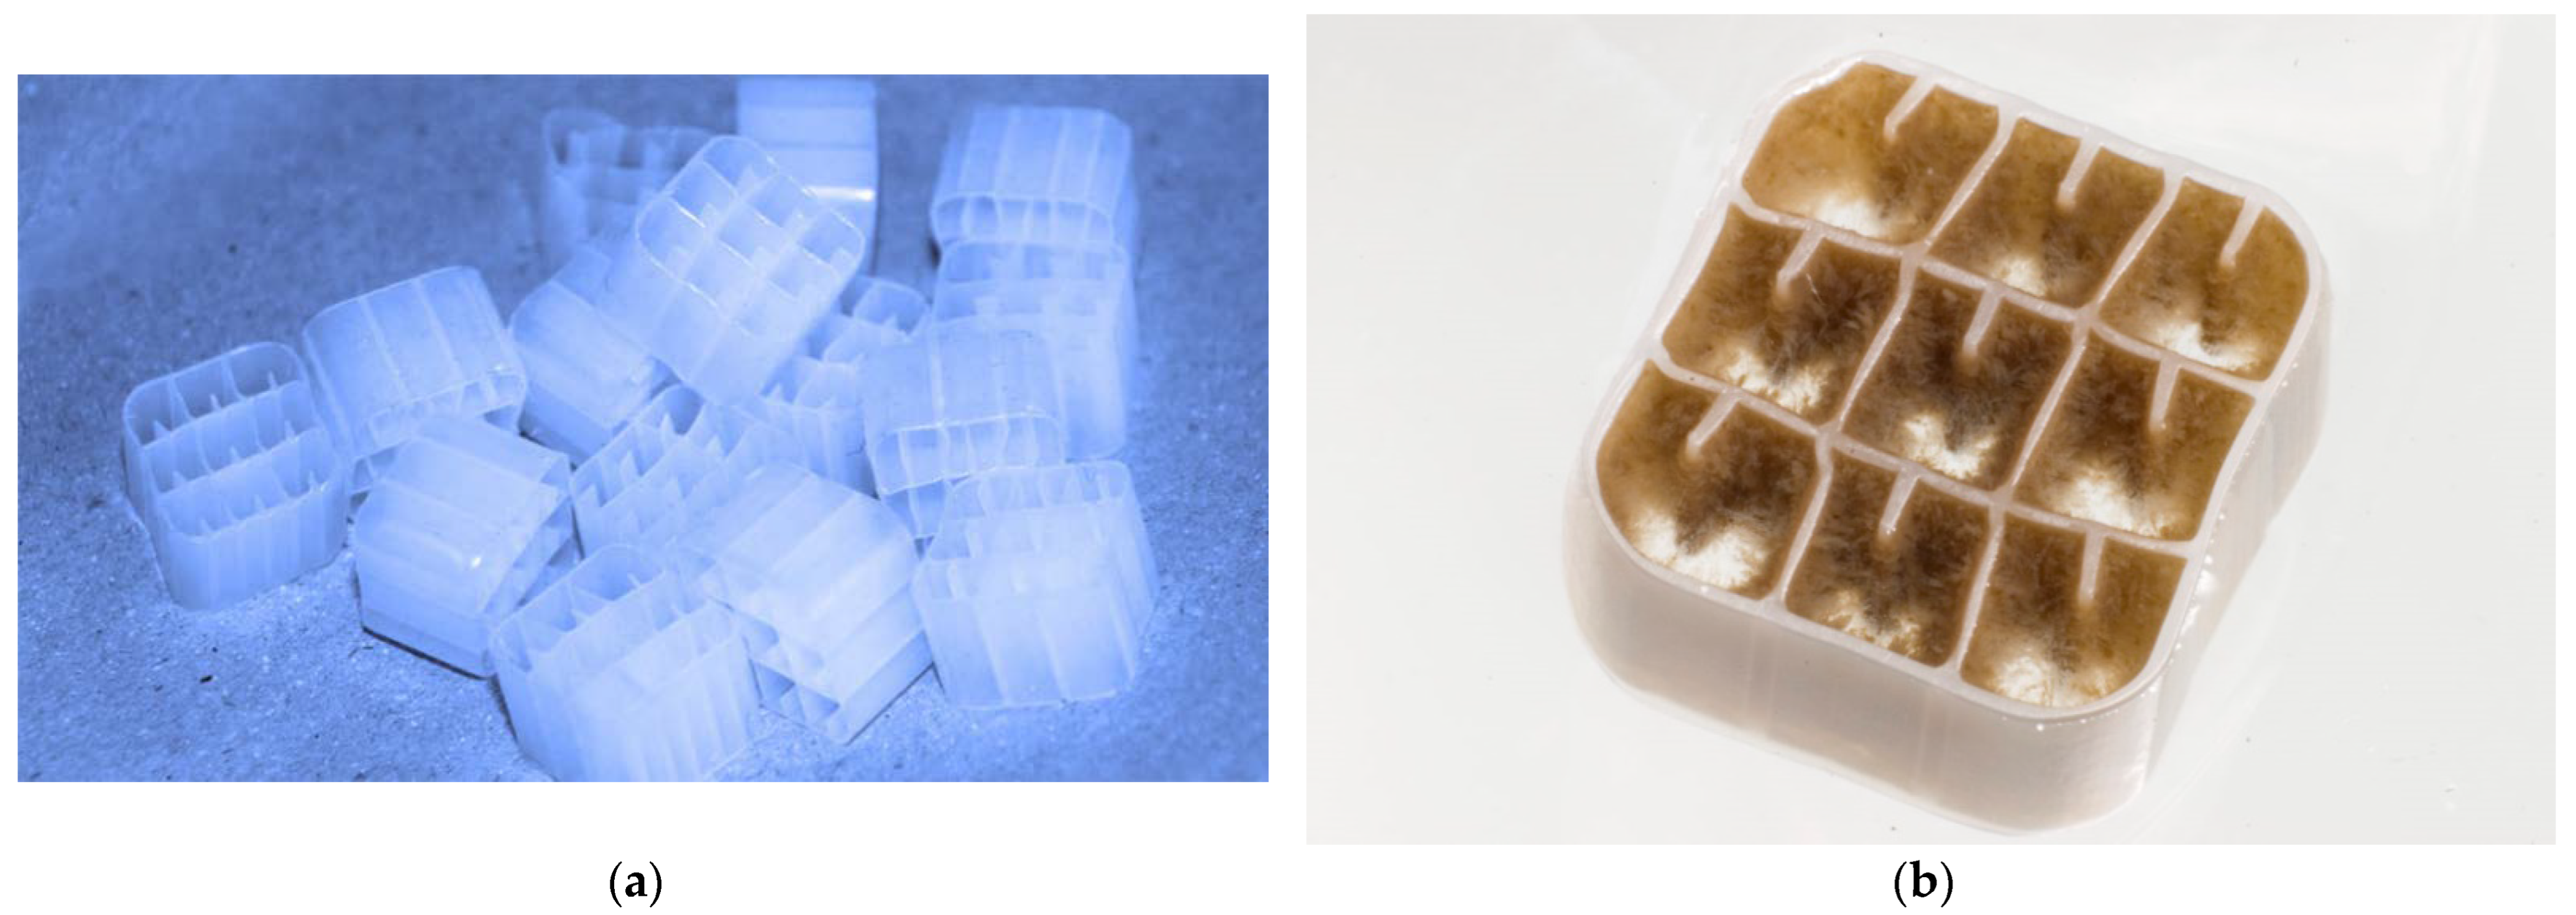
New biofilm carriers BWTX
® (650 m
2/m
3, Biowater Technology AS) (
Figure 4) were filled in the aerobic CFIC stage at a filling degree of 90% to the CFIC level (
Figure 5). The CFIC process receives wastewater from the EGSB recycle column either through gravity flow or a dedicated feed, pump 3 (
Figure 4). The dedicated pump enabled to decouple the EGSB and CFIC system, so that wastewater from EGSB effluent can be fed at a lower speed to the CFIC, allowing for varied CFIC hydraulic retention times. Overflow from the EGSB recycle column can then flow directly to the effluent collection chamber. Wastewater temperature, DO, and pH were monitored manually inside the CFIC reactor.
The CFIC stage was operated at two water levels, with the higher-level functions as a forward washing (FW) mode to remove extra sludge accumulated on the carriers, which were activated at a programmed frequency (
Figure 5). When the FW mode is activated, electric valve 1 is stopped and electric valve 2 is opened automatically. Wastewater continuously fills up the reactor until reaching the washing level and is discharged (
Figure 5). Aeration was enhanced due to increased air flow by opening electric valve 2, causing stronger shear force to act on the carriers. The air flow was adjusted manually from the air source, and the air flow rates were indicated on the flow transmitter on the control interface.
2.3. Feed Wastewater
The feed wastewater was prepared by manually mixing 6 effluent streams from the customer chemical production processes which contained a varied quantity of organic/inorganic chemicals. The typical composition of the wastewater was obtained after combining these effluents, as presented in
Table 1. Due to uncertainty over the wastewater availability to the potential full-scale biological treatment plants, the wastewater was classified into two different scenarios. The most concentrated scenario gave a wastewater COD around 50 g/L, containing mostly acetic acid and 2-methoxy ethanol (
Table 1) and was used to acclimatize the biology. A more likely wastewater as feed to the full-scale bioreactor contained either no acetic acid or over 81%, giving COD concentrations at 2.2 and 14 g/L, respectively (
Table 1). The prepared wastewater was stored in the 1 m3 IBC tank inside the container at room temperature before being pumped to the conditioning tank. The IBC was refilled after the wastewater was close to empty.
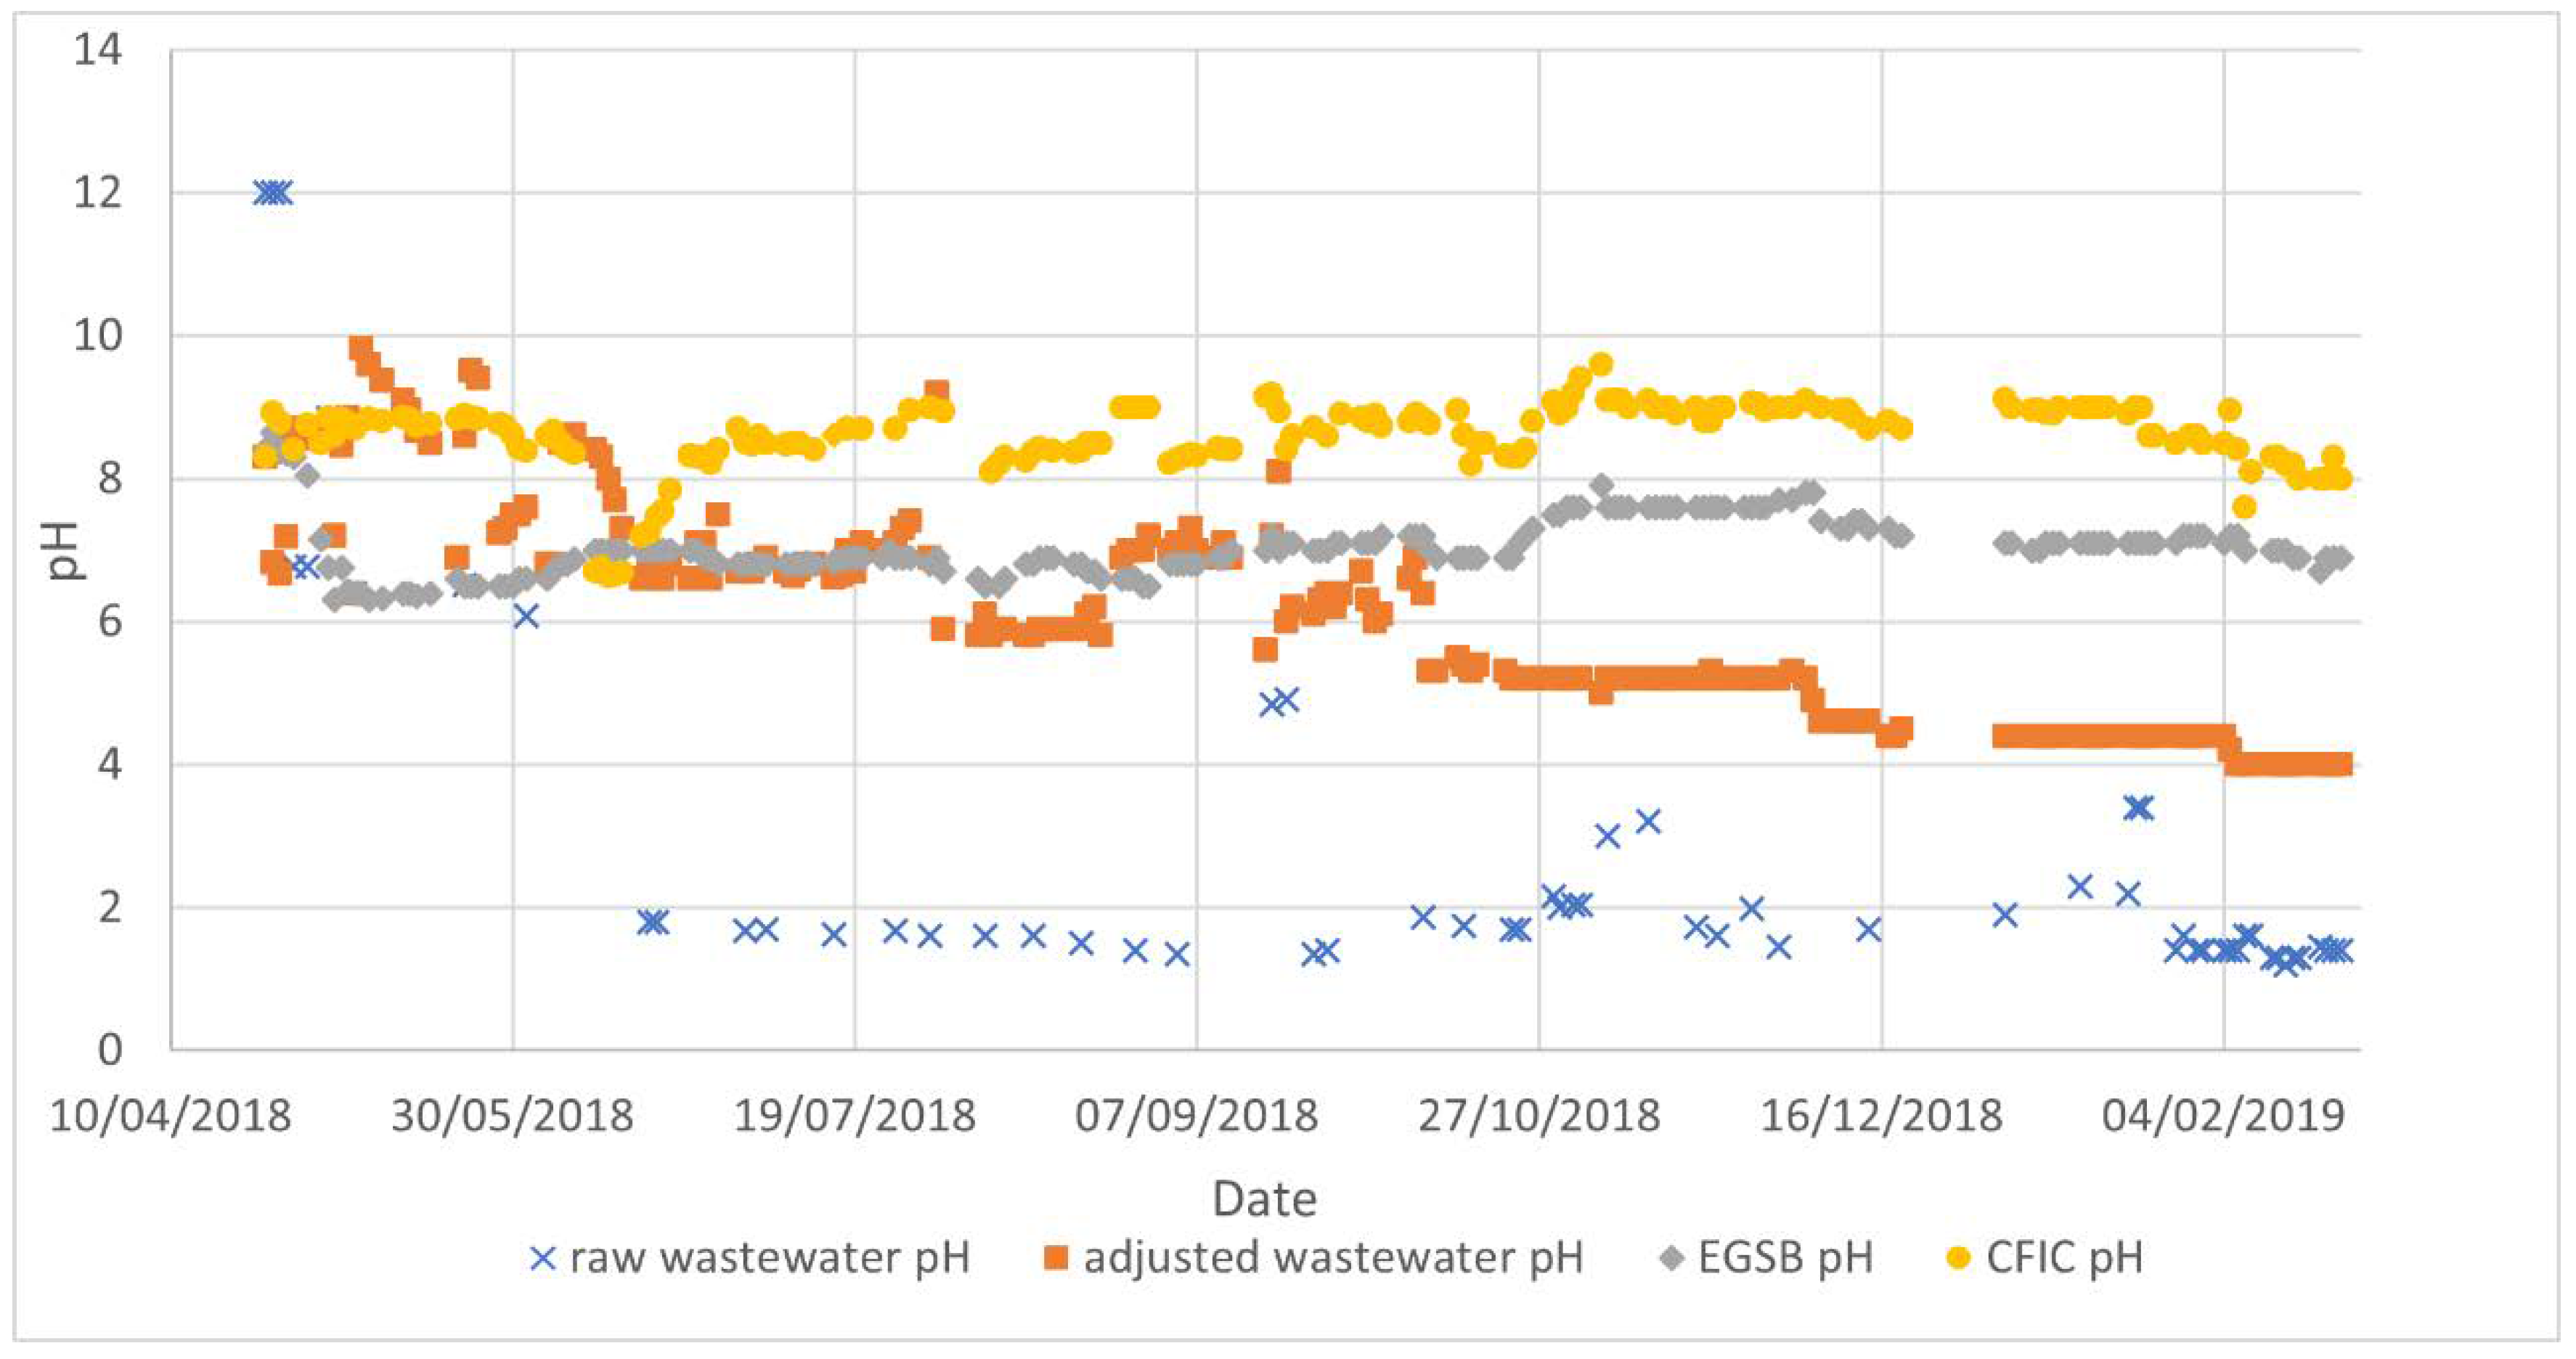
The average raw feed wastewater temperature during the operation period was approximately 18.7 °C and was heated by the heater in the conditioning tank to an average of 30.0 °C. At the same time, pH was adjusted from an average 1.8 to 4.9 by automatic caustic soda dosing. Other characteristics of the feed wastewater are presented in
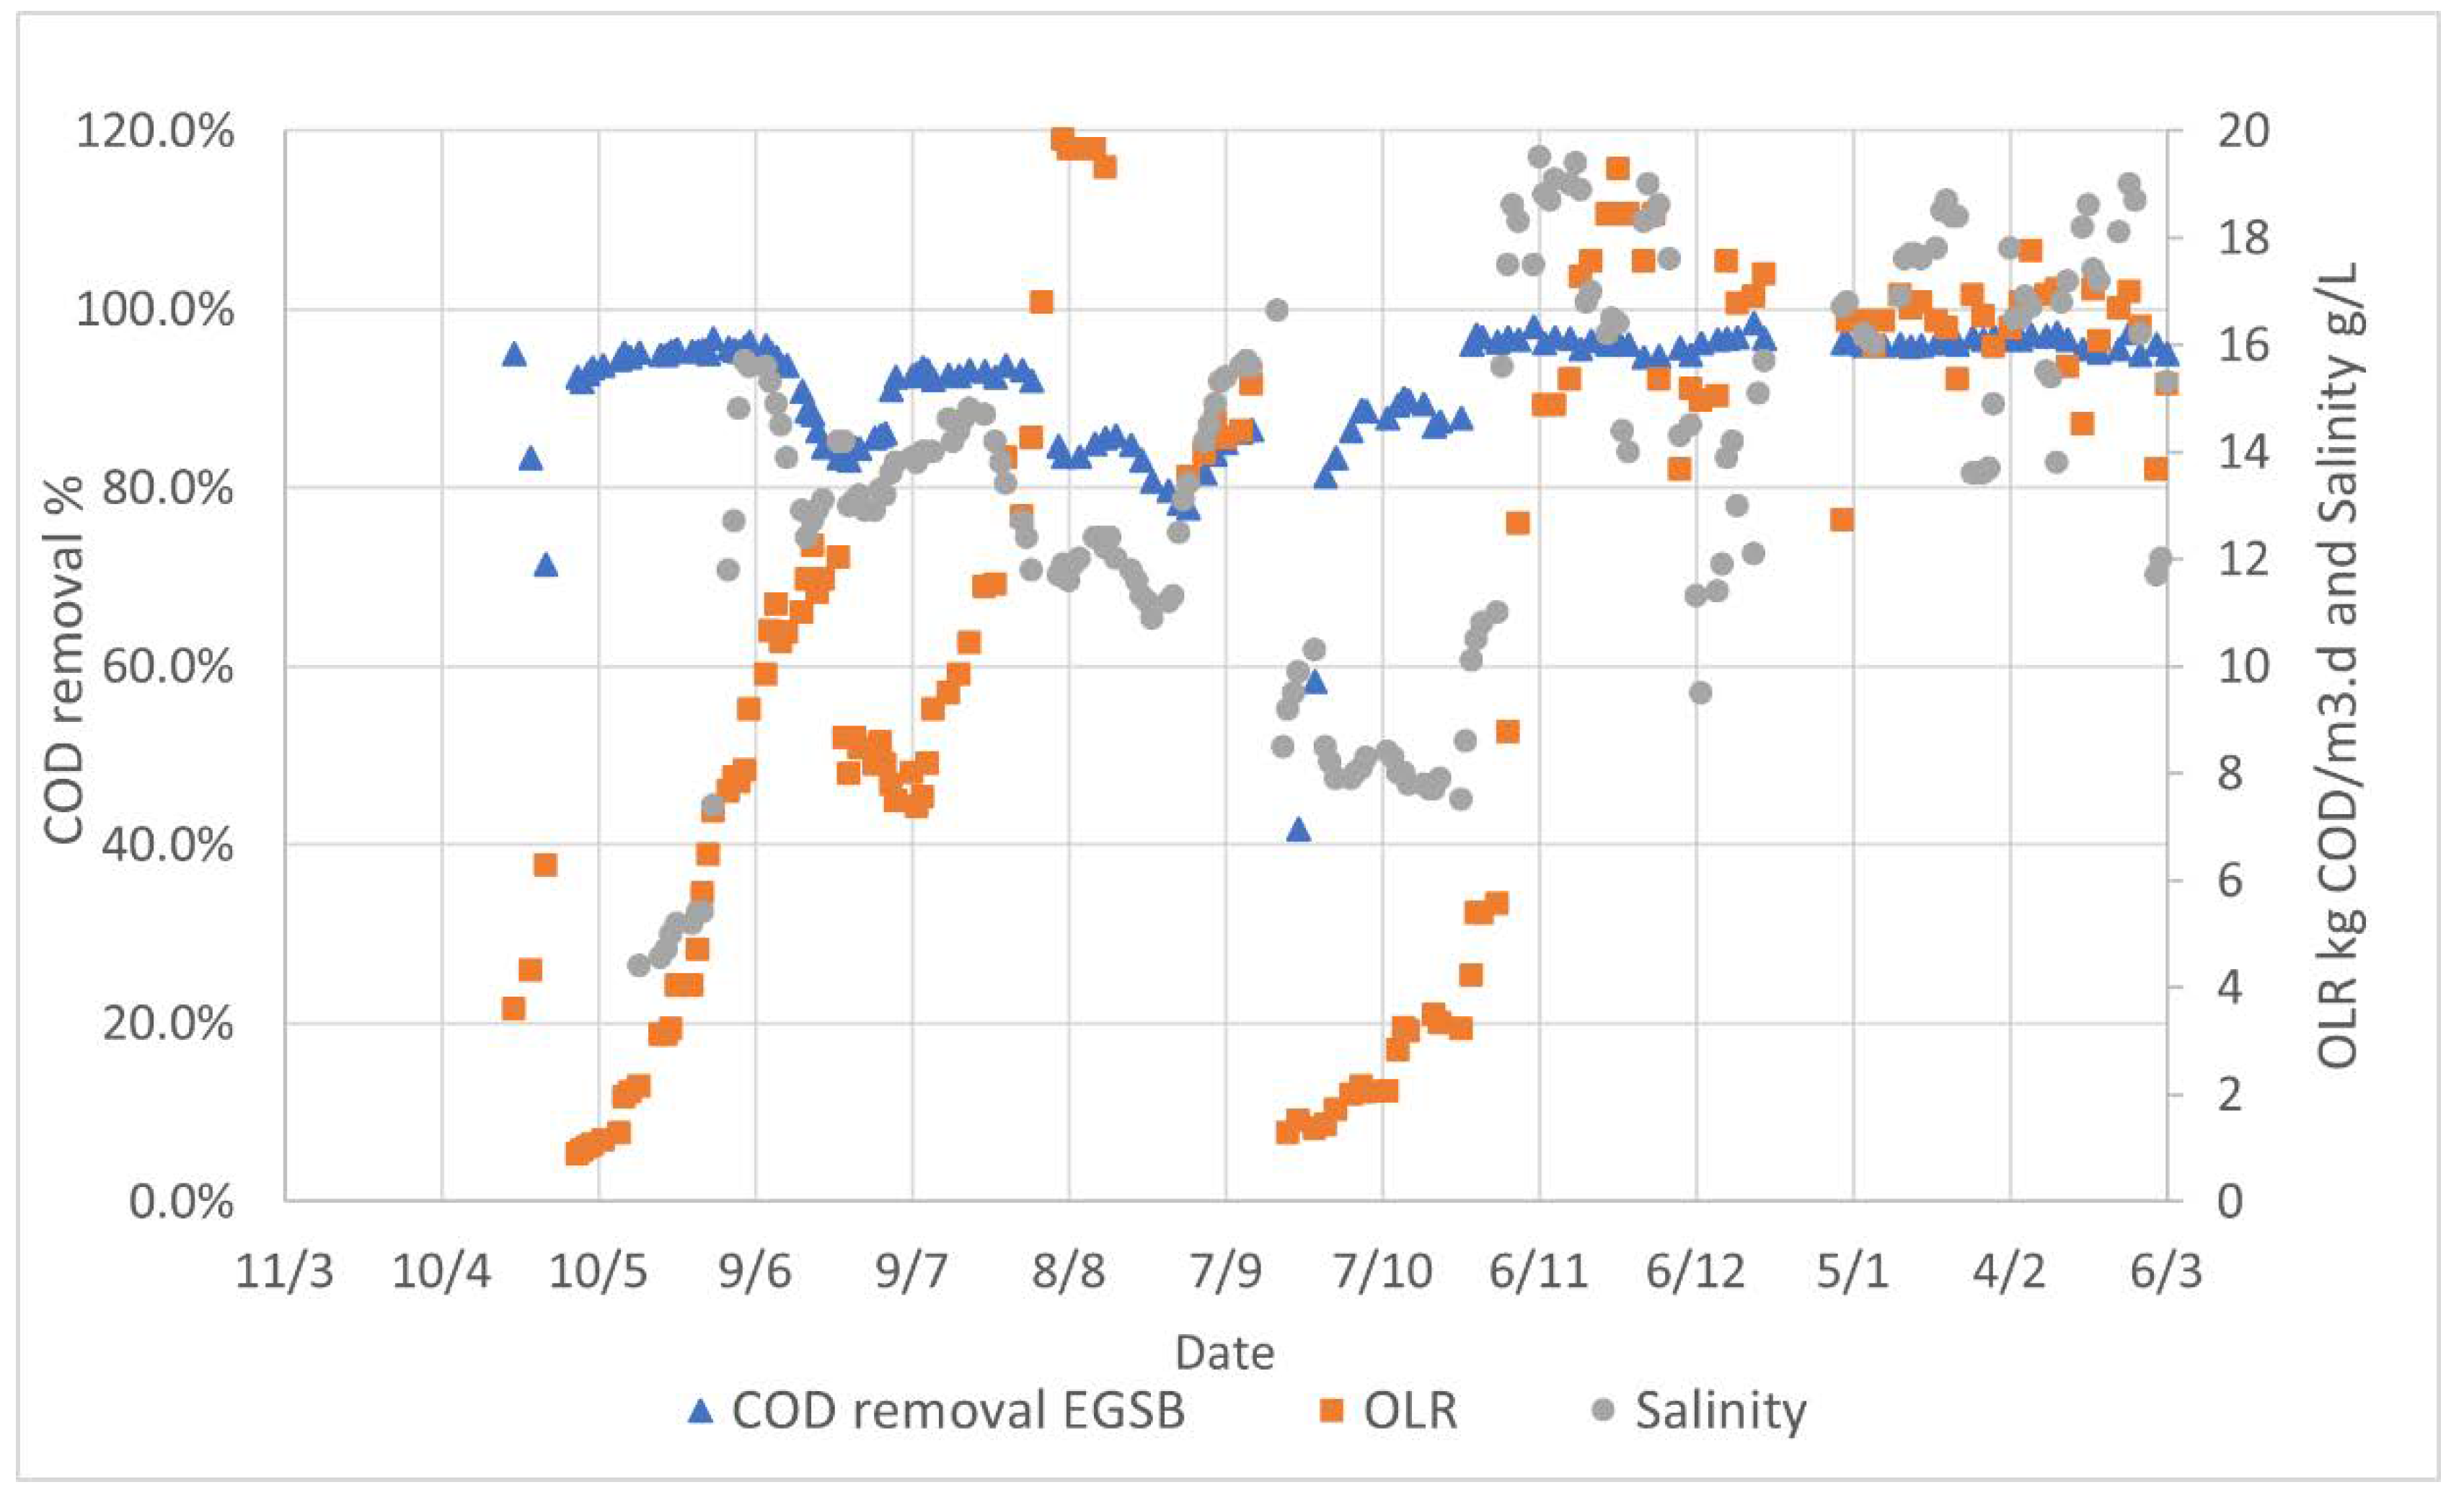
Table 2. High salinity of around 15–20 g/L NaCl was commonly observed in the feed wastewater. Due to a lack of nitrogen and phosphorous in the feed wastewater, nutrient (urea and KH
2PO
4) solution was prepared and dosed to the conditioning tank at a flow rate proportional to the feed flow.
2.4. Granular Sludge
The granular sludge was extracted from a HyVAB
® reactor [
11], treating vegetable processing wastewater. The granules have been treating wastewater at a COD concentration of on average 2500 mg/L and at a temperature of 25 °C for over 2 years. The granules have an average size of 2 mm and their properties are described in
Table 3. The anaerobic granules were inoculated 2 times, the first time with approximately 6 kg VS and second time with 3.4 kg VS after about 2.5 months of operation.
2.5. Operational Plan
The EGSB was fed gradually from low COD loading rates to facilitate the granular sludge adaptation to the new wastewater streams. A detailed feed program is given in
Table 4.
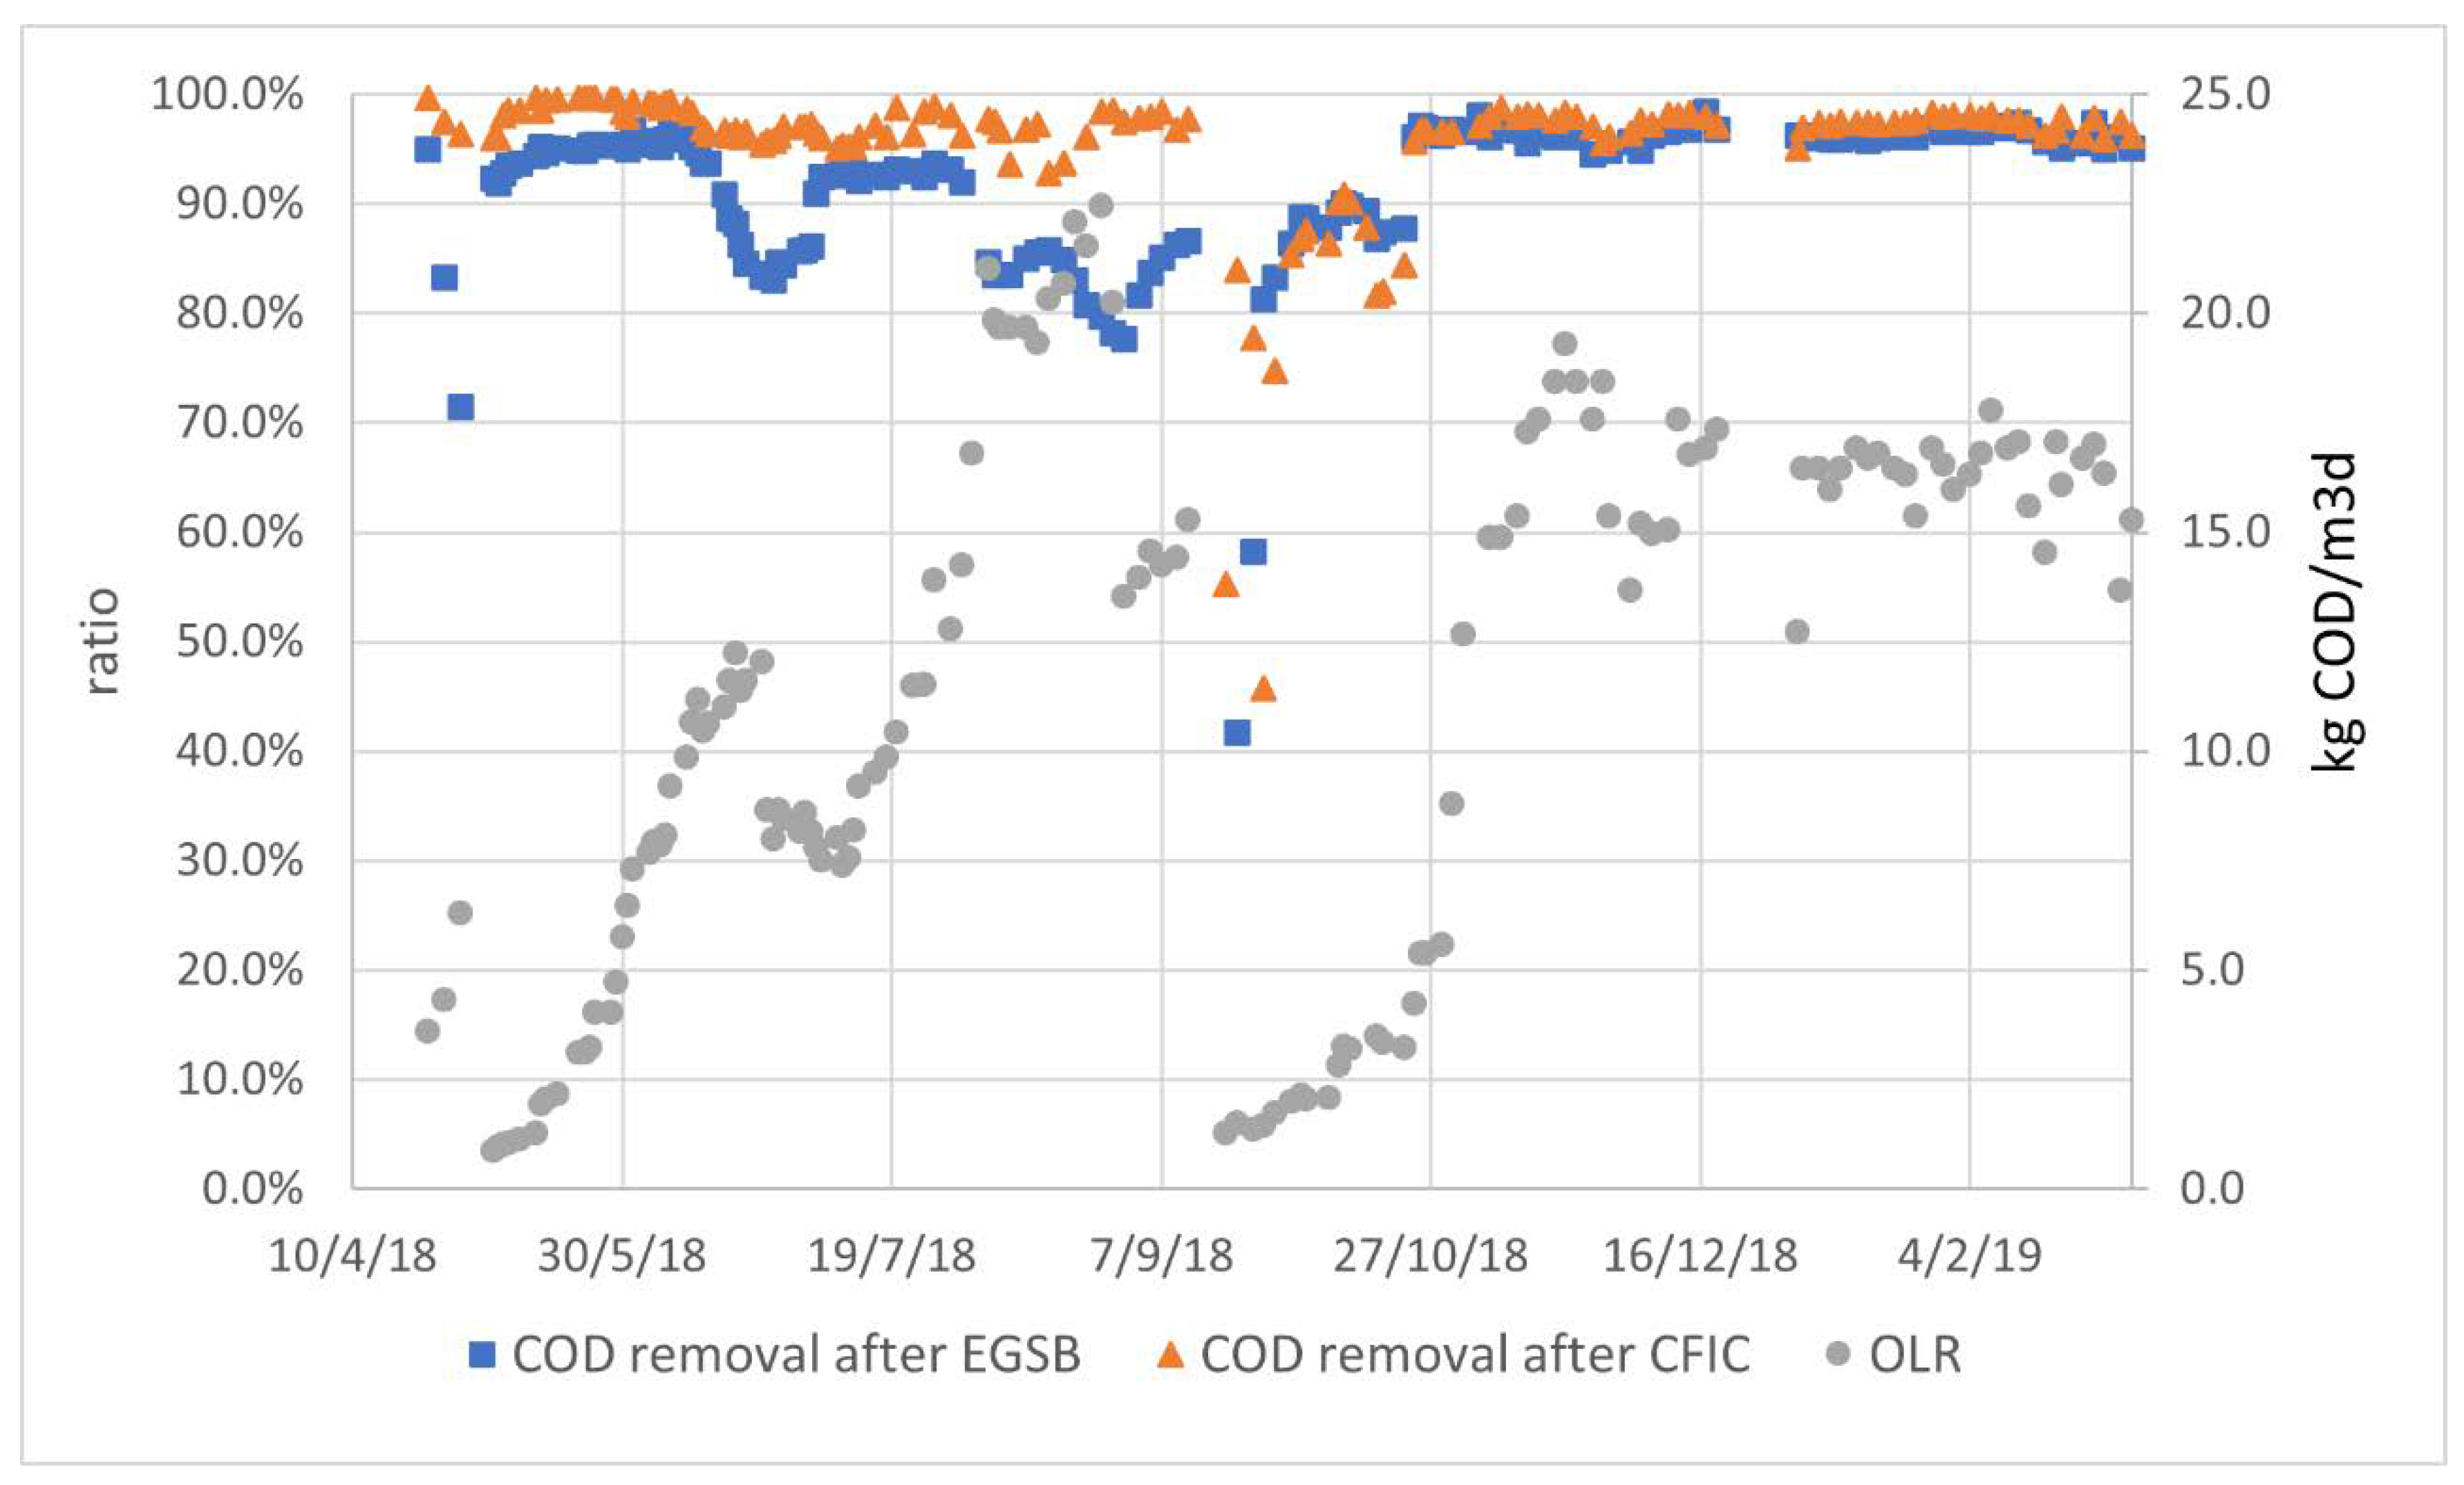
The plant was operated for a total of 11 months from 23 April 2018 to 20 March 2019. The most concentrated wastewater scenario was planned first in the pilot study as an adaptive phase, i.e., 23 April 2018 to 15 September 2018. The COD concentration during the first few weeks of the start-up period was kept low at 10 g/L by diluting the high COD concentration and gradually increased to 50 g/L in about 2 months. The pilot was operated at high hydraulic retentions times (approximately 0.5 L/h flow rate = 480 h AD HRT). During this period, the feed COD loading rates were pushed to investigate the feed limitation of the anaerobic granules. Wastewater salinity was also gradually increased in the wastewater mixer.
Another 185-day test period from 16 September 2018 to 5 March 2019 was conducted as a testing phase for wastewater contents (2.2 and 14 g COD/L), representing a feed of a more realistic concentration in the full-scale biological treatment plant. The feed wastewater concentration (
Table 2) and flow fluctuations during the testing phase are representative of realistic year-round operation, including the down time such as holidays and other minor production and processing deviations.
In the CFIC stage, 163 L BWTX
® (650 m
2/m
3, Biowater Technology AS) (
Figure 3) were added in the reactor, which gives a surface area of approximately 106 m
2. Air was supplied at a rate of 1–2 m
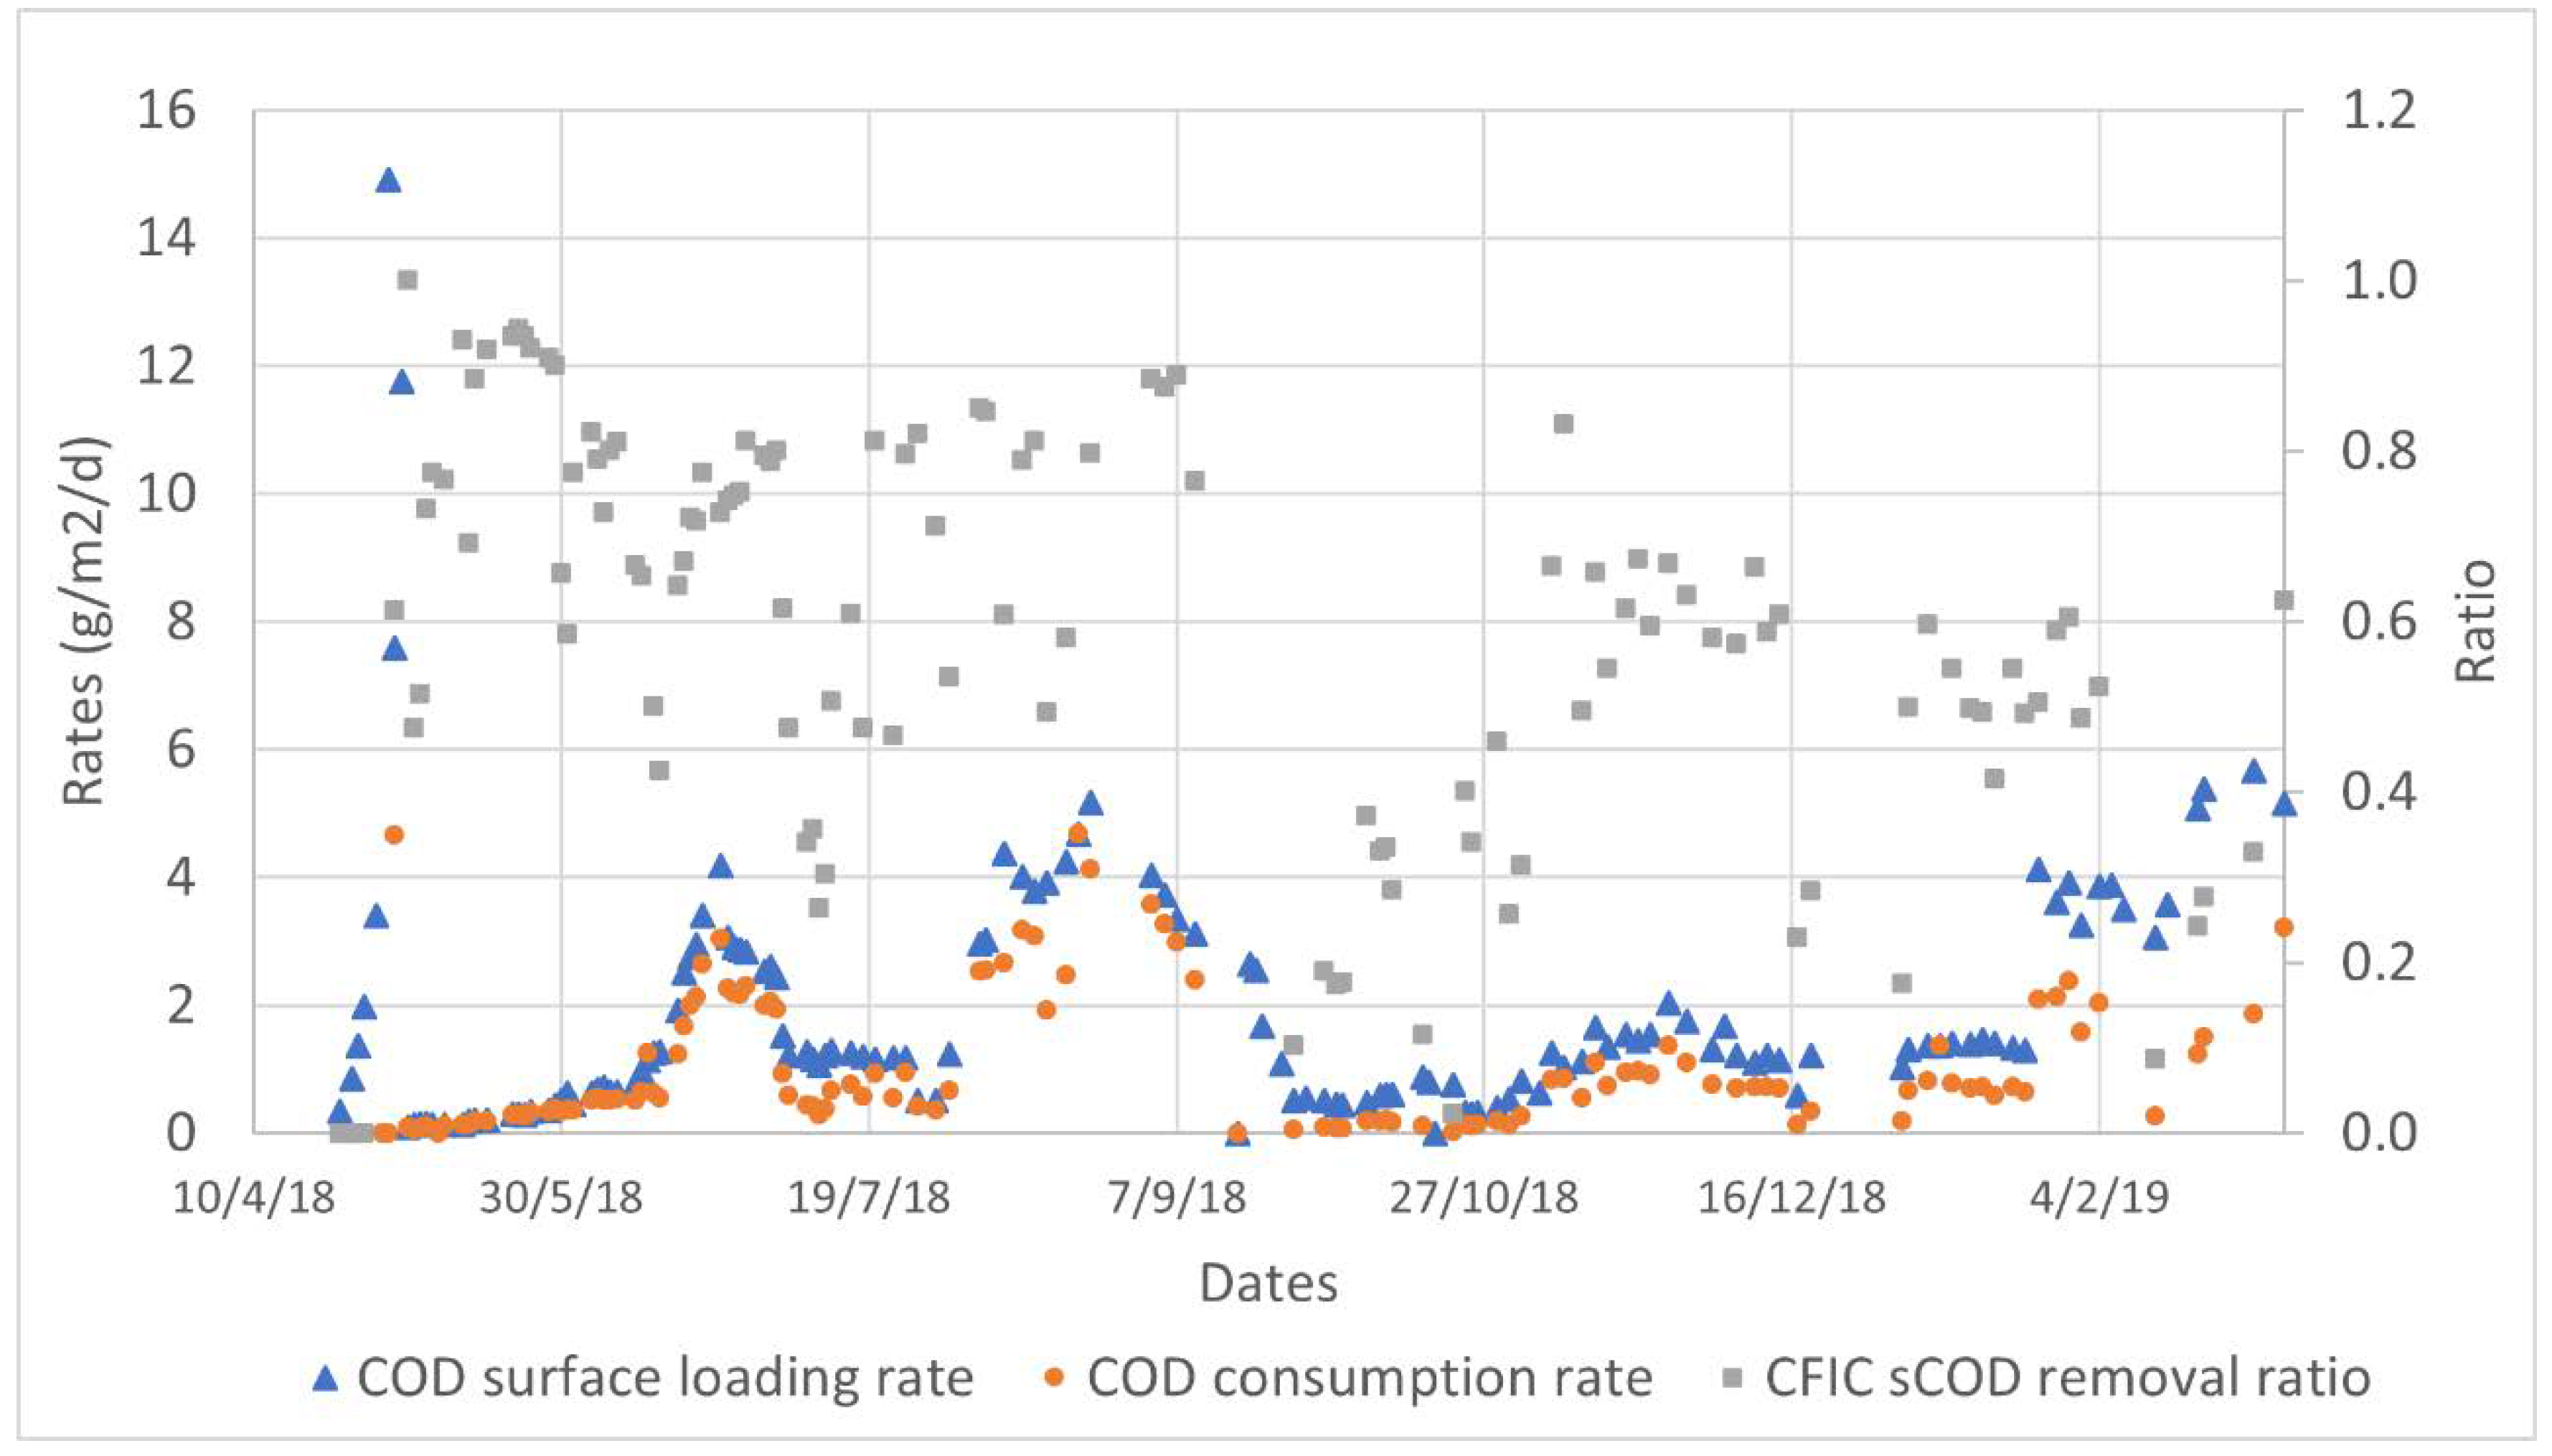
3/h to maintain dissolved oxygen (DO) at above 2 mg/L during the normal operation. The aerobic CFIC stage was running in the forward washing cycle as a MBBR a few times to study the washing effects on the accumulated biomass on the carriers. The loading rate based on the protected surface area is shown in
Table 4.
2.6. Sampling and Analysis
Operational data from sensors, such as pH, temperature, and dissolved oxygen, were recorded automatically in the SCADA system. Data for parameters, such as temperature, pH, alkalinity, total and soluble COD, ammonia, phosphate concentrations, conductivity, and salinity for liquid samples, were collected at least 3 times a week from the EQ tank, EGSB effluent, and CFIC effluent for analysis. The total/volatile solid contents (TS/VS) of anaerobic granular sludge were analyzed 3 times during the study. The analysis mentioned was carried out according to the standard methods and procedures described in [
11]. Biogas analysis was carried out regularly using BIOGAS 5000 (Geotech
®, by QED, Coventry, UK).
4. Pilot Usability
The pilot was approved to be an operator-friendly system with high automated levels for both studying the biological treatment capacity of the specific wastewater and for training operators with limited knowledge of the biological processes.
Many test scenarios have been carried out during the pilot study, including adjusting wastewater conditions, testing hydraulic retention times regarding the system performance, investigating a combined anaerobic and aerobic process at varying operational conditions, etc. Important knowledge has been accumulated in terms of how well the biological process can handle such wastewater and the optimal conditions. The excellent treatment results have proven the stability and effectiveness of the process. The customer eventually started the full-scale project construction in 2019, applying the same treatment concept as the pilot, which justified the value of the pilot system. The full-scale treatment plant has been commissioned and began operation in March 2020.
5. Conclusions
The pilot was demonstrated as a valuable tool because of its user-friendly nature with high automation level and its high efficiency in treating specific wastewater. It provides critical information for full-scale system design as well as training for the customer in handling a previously unfamiliar process in comparison to their chemical production.
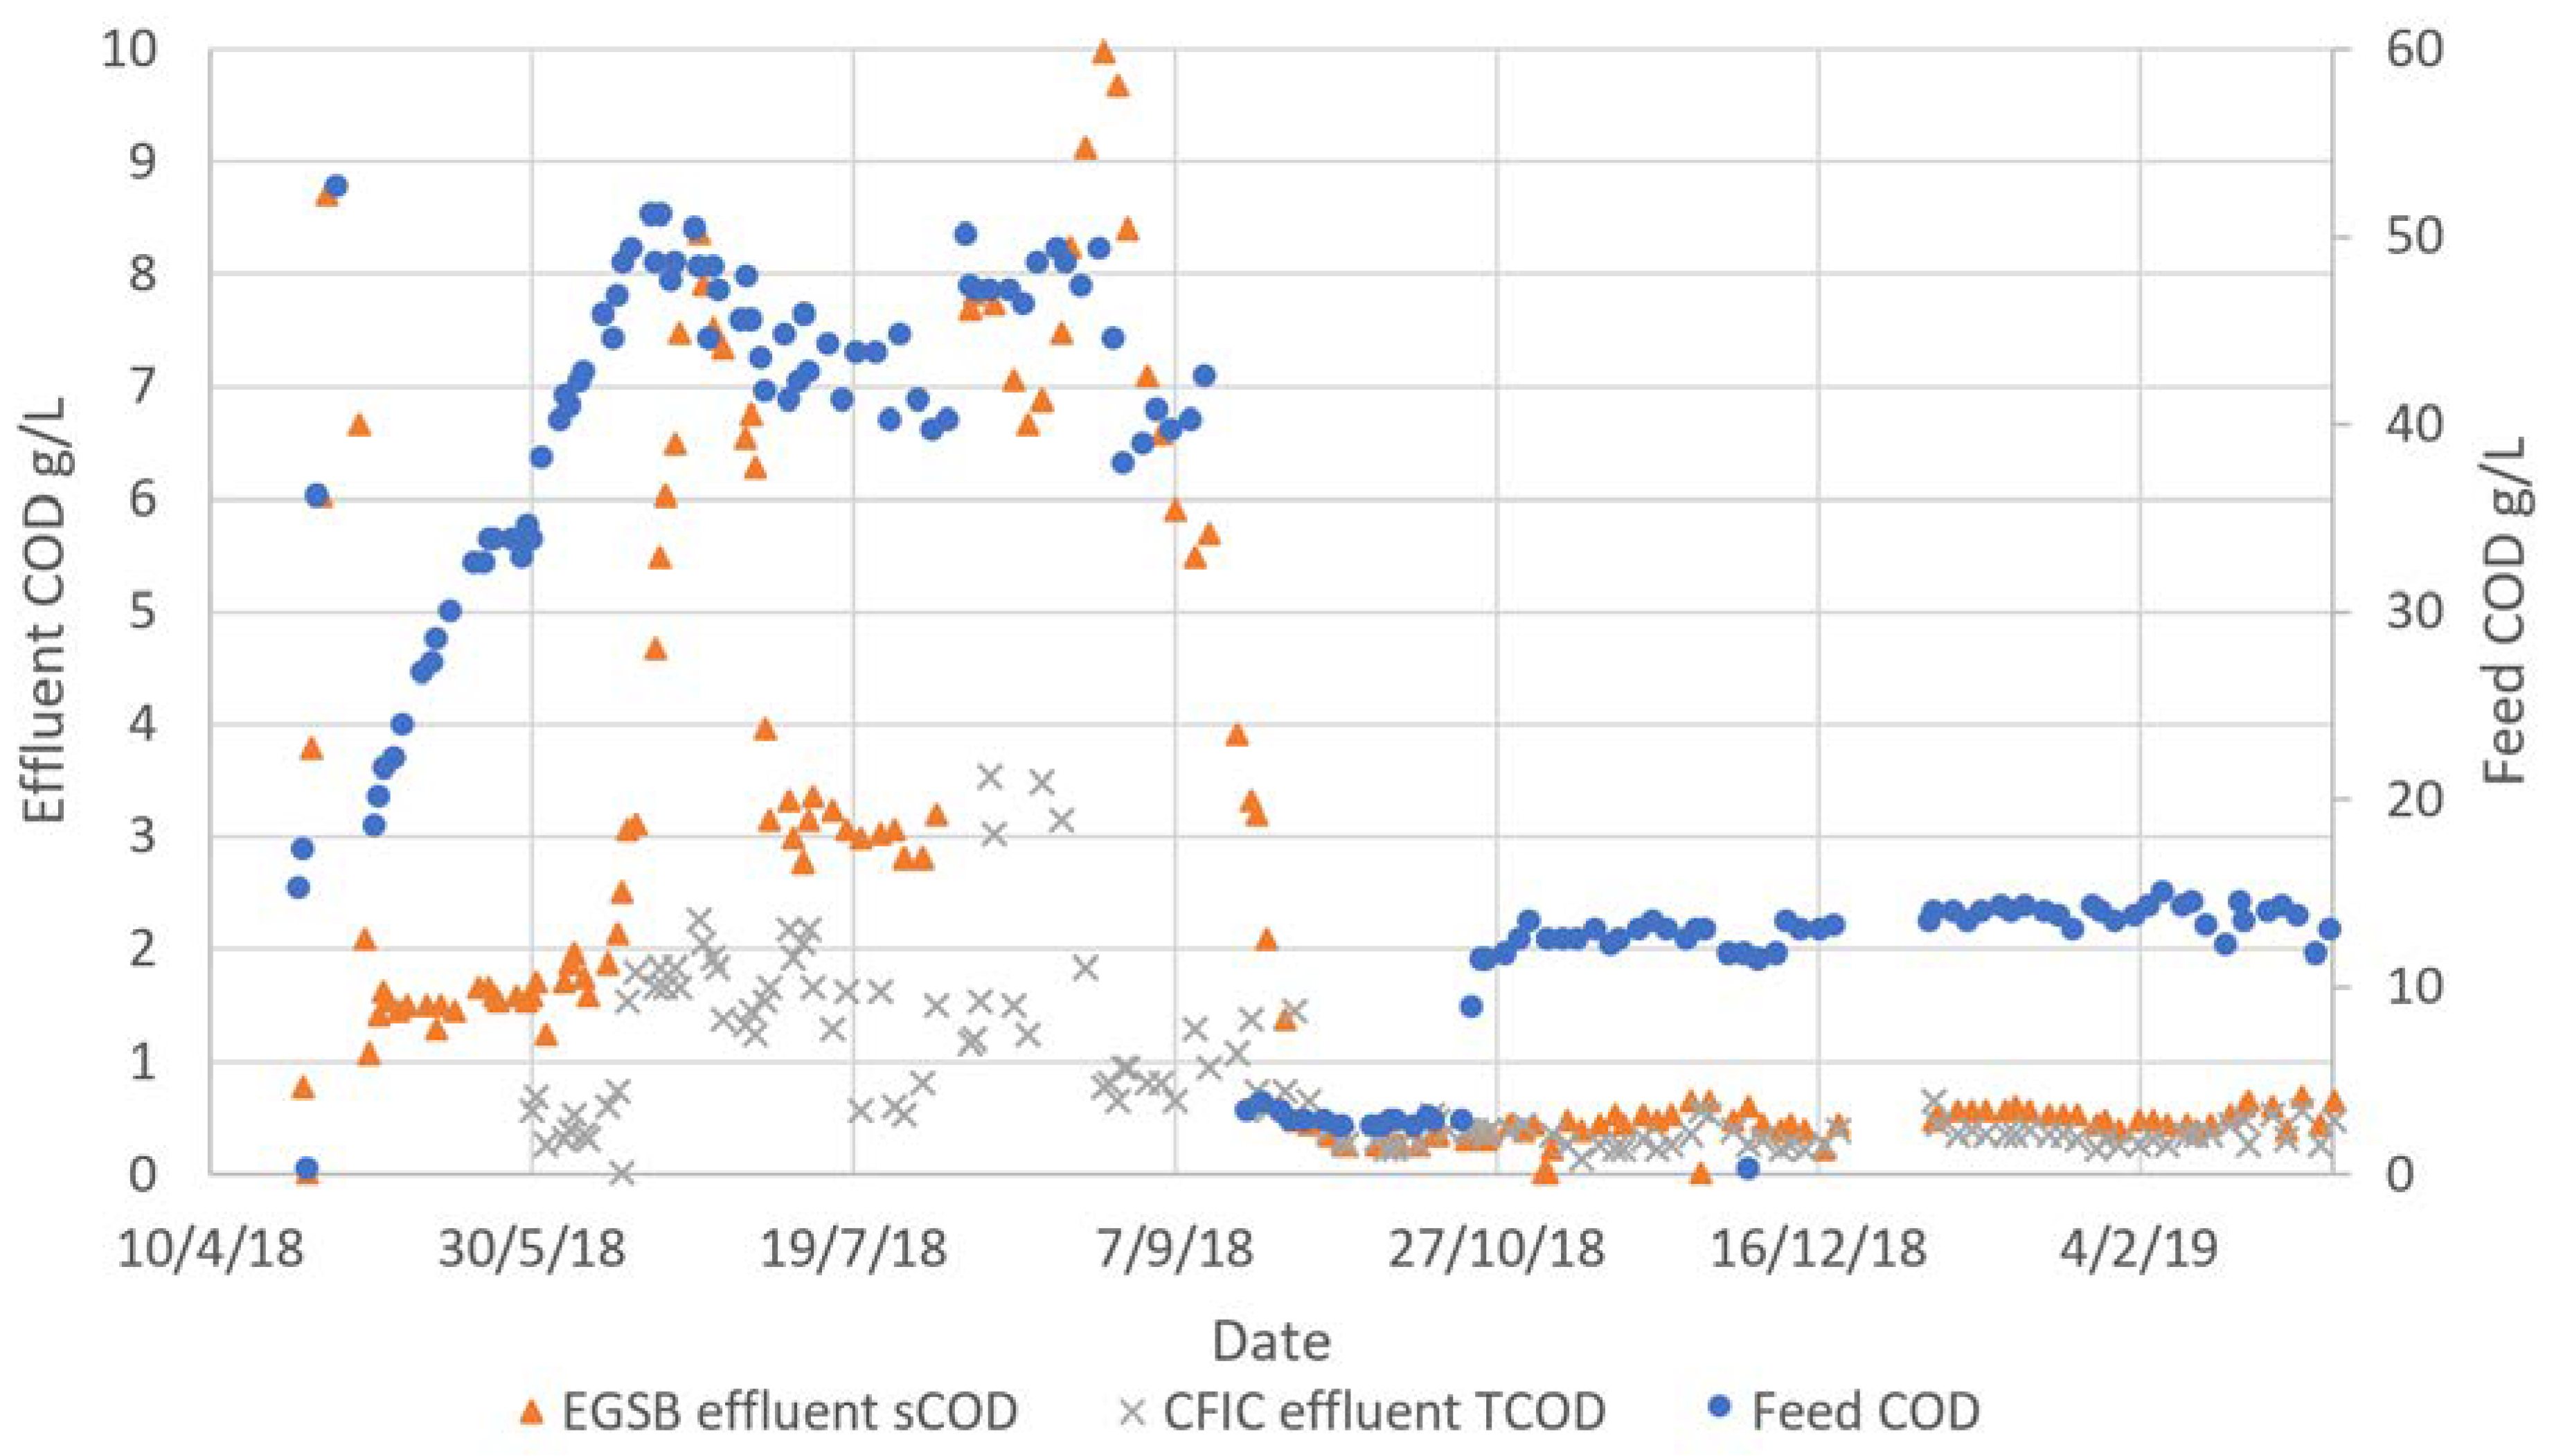
The pilot was operated for a total of 317 days, including 147 days of adaptive phase and 170 days of testing phase. A series of pilot studies treating wastewater COD concentrations from 2 to 50 g/L with salinity up to 20 g/L was carried out. The systems achieved a high removal rate of COD (>90%) within one month of start-up. Good pilot stability was achieved by feeding ‘most concentrated’ wastewater (adaptive phase) when the EGSB efficiency reached over 95%. The efficiency was reduced to 80% when the OLR was stretched up to 22 kg COD/m3·d. In the test phase, the EGSB removal efficiency reached over 97% of feed COD at an average OLR of 16.3 kg COD/m3·d with up to 82% acetic acid present in the feed. A slight increase in VS/TS ratio from 0.8 to 0.87 was observed, and no clear inhibition of COD removal was observed by increasing the feed wastewater salinity up to 20 g/L during the study. The CFIC stage further polished the residual organic from EGSB, and the complete biological process was very stable with the removal of 90–97% of the total COD depending on the wastewater composition.


