Article

Soil Organic Carbon and Its Controlling Factors in the Lakeside of West Mauri Lake along the Wetland Vegetation Types

1
School of Environmental Science and Engineering, Central South University of Forestry and Technology, No. 498 Shaoshan South Road, Changsha 410004, China
2
School of Life Science and Technology, Central South University of Forestry and Technology, No. 498 Shaoshan South Road, Changsha 410004, China
*
Author to whom correspondence should be addressed.
Processes 2022, 10(4), 765; https://doi.org/10.3390/pr10040765
Submission received: 26 March 2022 / Revised: 9 April 2022 / Accepted: 11 April 2022 / Published: 13 April 2022
(This article belongs to the Section Biological Processes and Systems)

Abstract

:
There is a huge carbon pool in the lakeside, which is sensitive to environmental changes and can very easily be transformed into a carbon source as land from the lake is reclaimed. In this paper, West Mauri Lake was employed as a case study to examine soil organic carbon (SOC) and its controlling factors along the lakeside. Four transects of land use (i.e., vegetation) types along the landward lakeside were identified as the fluctuation zone, the beach zone, the mesozoic farmland rewetting zone and the xerophytic farmland rewetting zone. With the increase in soil depth, SOC in the lakeside decreased significantly (p < 0.05). SOC had an obvious seasonal variation (p < 0.001), ranking in order: winter (December) > spring (February) > summer (May). Among the aforementioned transects, SOC density differed significantly (p < 0.05), showing a significant increasing trend. Pearson correlation indicated that most soil physiochemical factors showed a significant correlation with SOC (p < 0.01), except total chromium, total copper, total zinc and total phosphorus. The relationship between SOC density and total nitrogen (N) has an obvious “S” curve, and total N accounts for 81% of the variation of SOC, suggesting that total N is the main controlling factor of SOC in the lakeside. The significant difference in SOC along the different vegetation (land use) types implied that land use affects the SOC in the lakeside. The long-term accumulation of N fertilizer after the man-made reclamation and aquaculture obviously controls SOC in the lakeside of West Mauri Lake.

1. Introduction

Wetlands are a type of ecosystem located between water bodies and land and are known as one of the three major ecosystems along with forests and oceans [1]. The ecosystem service function of wetlands is currently declining, and wetland restoration has thus become a hot topic [2,3]. The effective implementation of wetland restoration requires an in-depth study of the ecological process of wetland systems. To our knowledge, little information on the changes of soil physicochemical factors (including soil carbon pool) in the process of ecological restoration projects is known. The carbon pool stored in wetlands is one of the important links in the global carbon cycle [4,5,6,7]. Wetlands occupy about 2–6% of the Earth’s land area, but store 20–30% of the Earth’s terrestrial soil carbon [8]. Global wetland soil organic carbon (SOC) is about 202.0–535.0 Pg [9], and the Chinese wetland carbon pool has been estimated to be about 5.0–6.2 Pg [10].
Despite the large carbon sequestration potential of wetland ecosystems, the system (lakeside in particular) is often converted into a carbon source because it is more sensitive to changes in environmental factors such as temperature, soil water content, and nutrient concentration [9,11]; for example, the carbon emissions from natural wetlands are expected to increase by 37.5% with a temperature rise of 1.5 °C [12]. In addition, human activities also affect wetland SOC [13,14]; previous studies have shown that when wetlands are converted to other land use types, the SOC pool decreases [15,16,17]. In view of the large wetland carbon pools and the impact of their changes on the global carbon cycle, changes in wetland soil carbon pools during degradation or restoration and their influencing factors have become one of the hot issues in wetland ecology [18,19,20,21].
As a part of Dongting Lake, the second largest freshwater lake in China, the cultivation of fields, unreasonable use of chemical fertilizers and over-fertilization of aquaculture in West Mauri Lake have led to a reduction in the water surface and a decline in the quality of water bodies in the lake’s wetlands as well as serious ecological degradation. In this paper, we employed West Mauri Lake as a case study and set up four transects along the landward lakeside to analyze the changes in SOC and its influencing factors in the process of ecological restoration of lakeside, so as to provide scientific references for the formulation of wetland restoration and protection policies.

2. Site Description and Study Methods

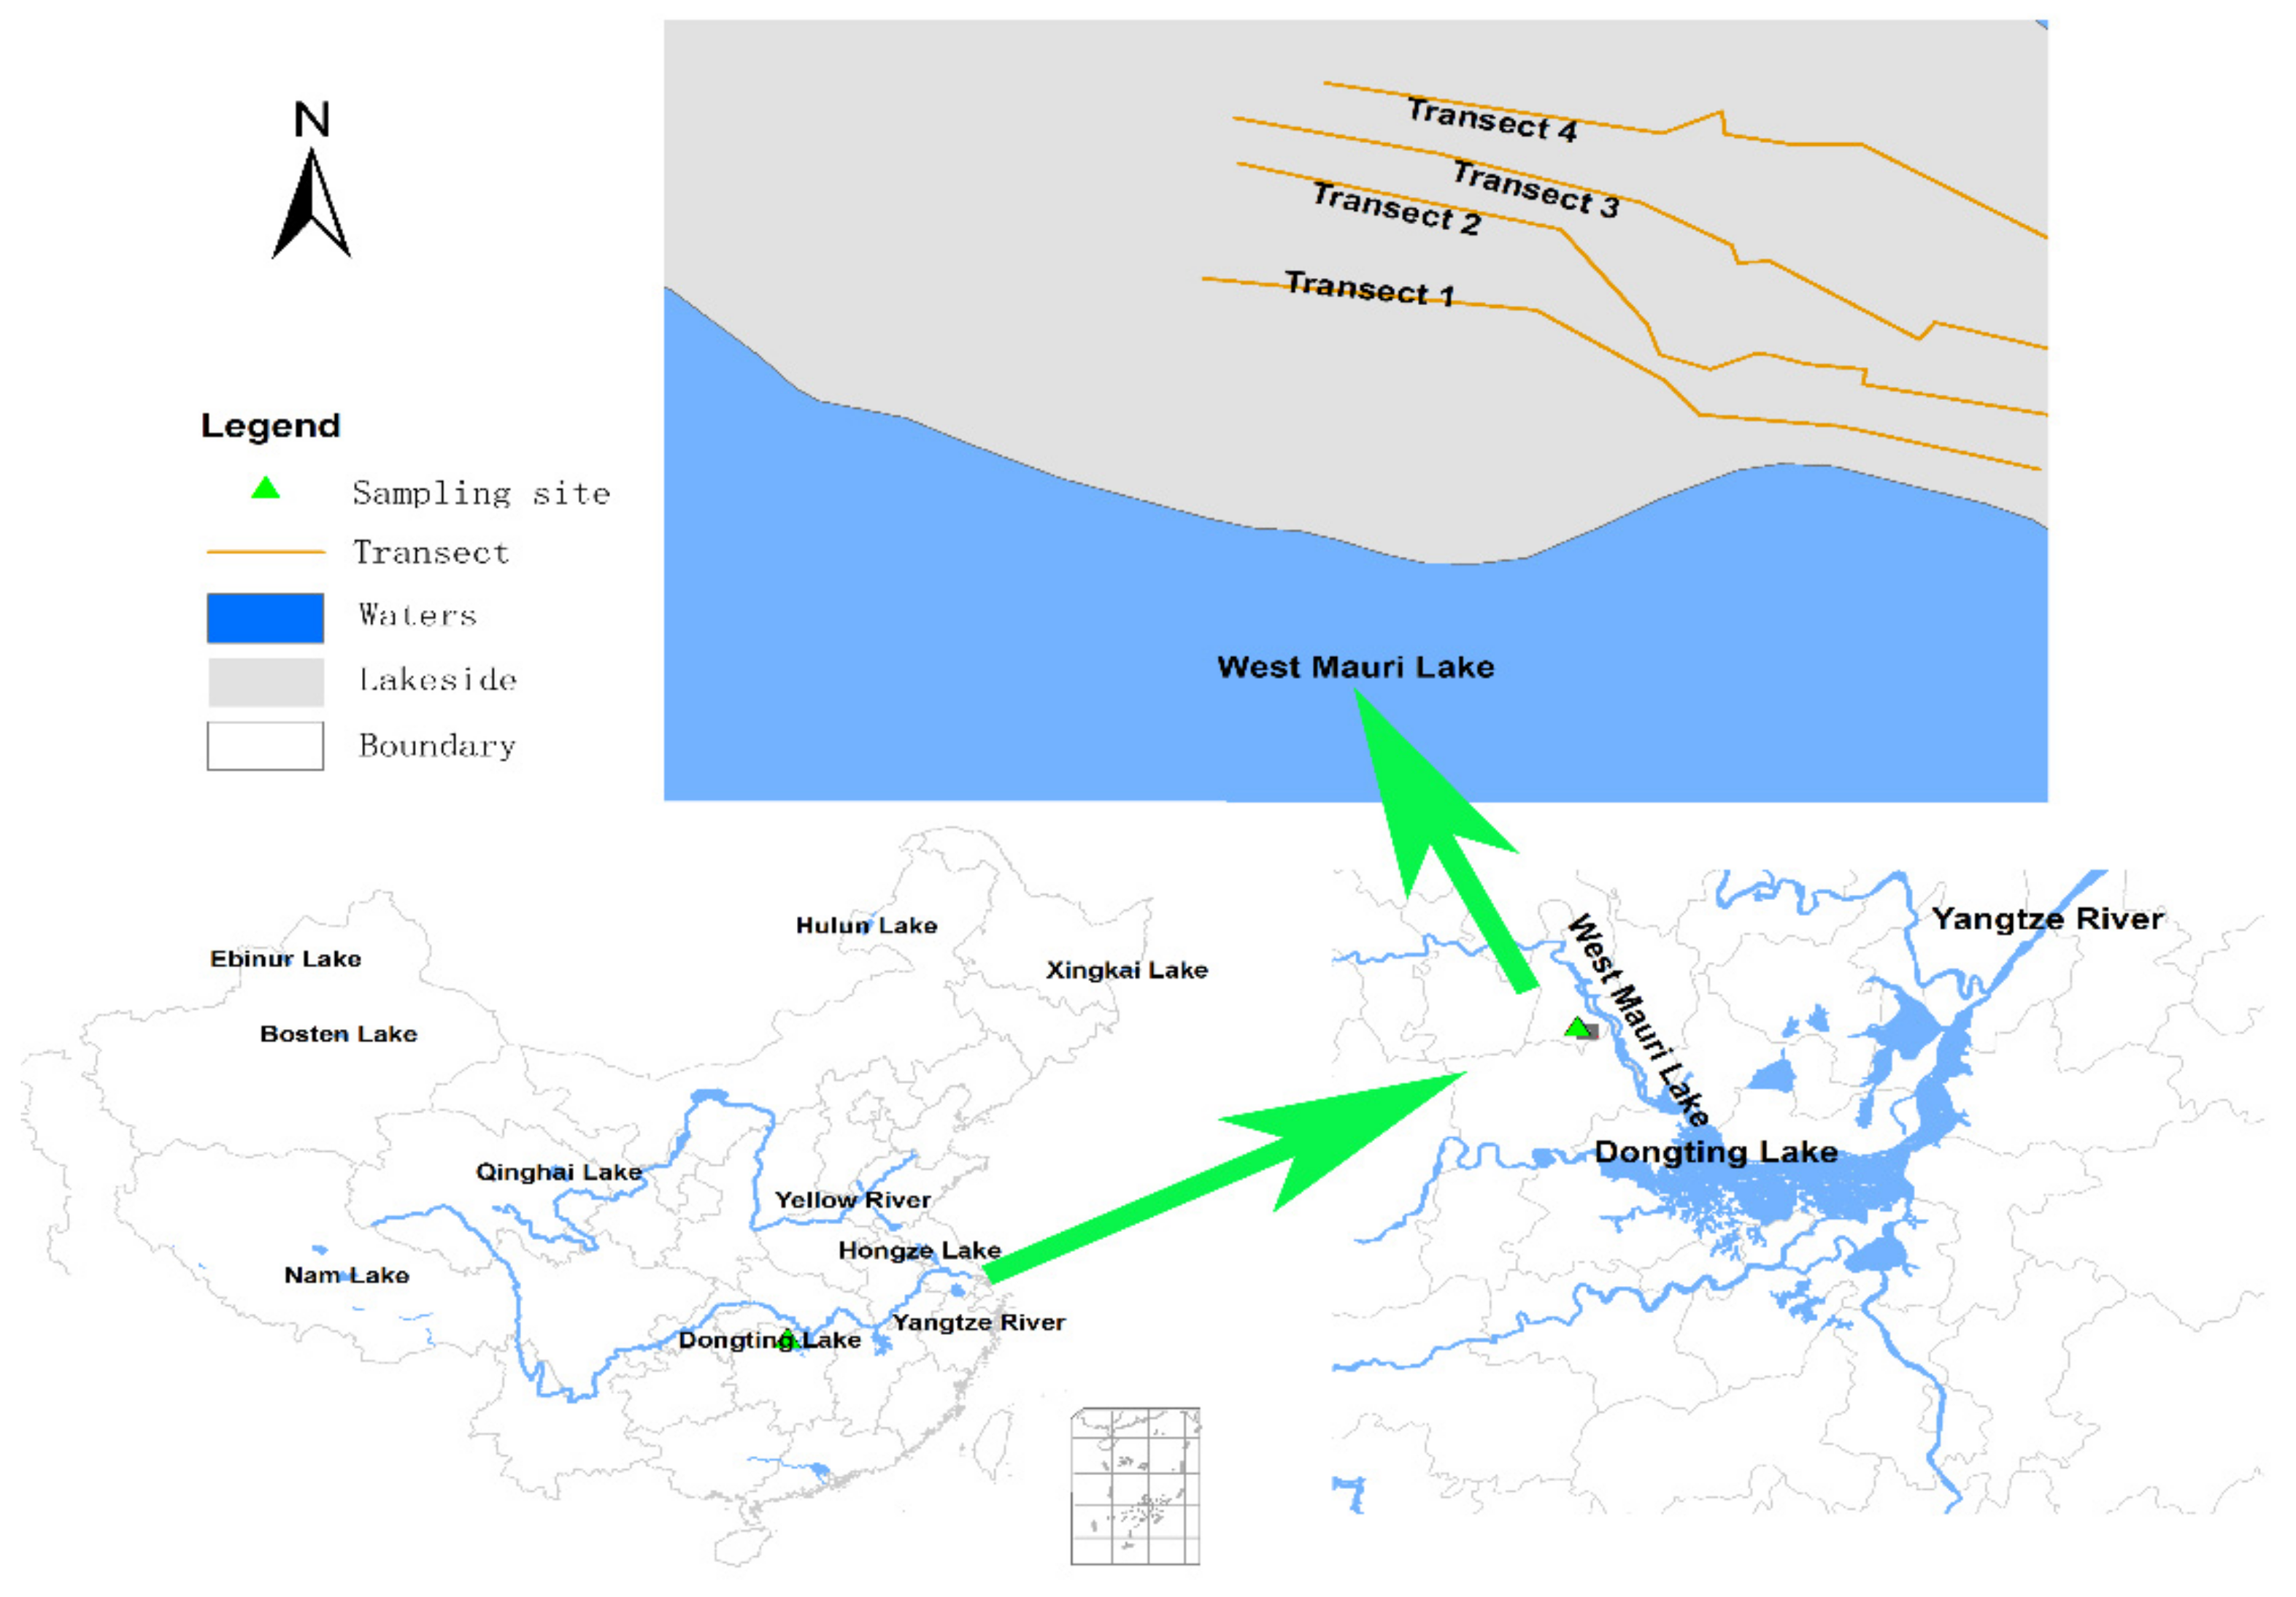
2.1. Site Description

The research site is located in the West Mauri Lake National Wetland Park, in the southeast of Jin City, Hunan Province (Figure 1), with 111°51′08″–111°58′28″ E and 29°20′48″–29°29’40″ N. West Mauri Lake is a part of Dongting Lake, the second largest freshwater lake in China. The wetland covers an area of 6250 hm2 with a humid monsoon climate zone. The annual mean precipitation and temperature are, respectively, 1164.3 mm and 16.6 °C, with an extreme high and a low temperature of 40.5 °C and −13.5 °C. The annual mean sunshine and frost-free period is 1770.6 h and 272 d. Such plant species as Alternanthera philoxeroides, Glycine soia, Carex brevicuspis, Hydrilla verticillata, Ceratophyllum demersum, Phalaris arundinacea, Trapa incisa, Ceralopteris pteriodoides, Ceratopteris thalictroides, Ormosia henryi and Camptotheca acuminate are distributed in this area. Mauri Lake is surrounded by hills with gentle slopes, with an altitude of 28–60 m. The soil is red soil, with a high content of clay particles, a strong water-holding capacity, weak erosion resistance and poor permeability of water and air.

2.2. Study Methods

2.2.1. Experimental Design

The water level obviously affects the vegetation distribution and composition in the lakeside [22,23]; fluctuation in the water level often leads to a belt-like distribution of the vegetation in the lakeside [24]. Therefore, for this article a combination of sample transects and sample squares was used to collect soil samples. Along the lakeside of West Mauri Lake, four sample transects (i.e., land use types or vegetation types) were set up according to the water level and vegetation type, namely, the fluctuating zone (Transect 1), the beach (Transect 2), the mesophytic farmland rewetting zone (Transect 3) and the xerophytic farmland rewetting zone (Transect 4). Each transect was 30.00 m long, and a sample square (1.00 m × 1.00 m) was set up every 3.00 m to collect soil samples.

2.2.2. Soil Sampling

Soil samples were collected, respectively, in spring (February), summer (May), and winter (November) in 2015, through the soil profile in the four transects. Along each transect for each season, three soil profiles were excavated, all in the location where the same covered vegetation type and the soil with a similar color were found. The columnar soil samples were layered according to 0–2 cm, 2–5 cm, 5–10 cm, 10–20 cm, 20–40 cm, 40–60 cm, and the soil in the same layer in the same square was evenly mixed into one sample. A total of 72 soil samples (3 profiles × 4 gradients × 6 soil layers) was obtained for each season. After the visible roots and litter had been removed, all the soil samples were sealed in a plastic bag and taken to a laboratory. Soil samples were divided into two parts; one was air-dried for basic property determinations, and the other was used for chemical analysis.

2.2.3. Determination of Soil Physiochemical Properties

To estimate the SOC and analyze the influencing factors of SOC, soil physiochemical properties such as soil bulk density, moisture content, organic matter, nutrients (N, P and K), and heavy metals (including total Cd, Pb, Cr, Cu and Zn) were measured. Soil bulk density and moisture content were determined using the ring knife and oven-dry method. Soil organic matter was determined by the potassium dichromate-sulfuric acid method [25]. Total N content was determined by the potassium dichromate-sulfuric acid digestion method [26]. Samples of 5 g soil were soaked, shaken for 1 h, and soil nitrogen was extracted through the addition of 5.0 mL of conc. H2SO4 and selenium catalyst, then distilled with NaOH and titrated against 0.1 mol HCl. Total P content was determined by the sulfuric acid and perchloric acid decoction method [27]. In short, total P was determined by inductively coupled plasma-optical emission spectroscopy after 5 mL of the sieved supernatants were digested in a H2SO4–HClO4 mixture. The chemical shifts were recorded relative to an 85% H3PO4 standard. Analysis of the aforementioned heavy metal in soil samples was carried out as follows. The digestion was carried out with 1 g of sample in a glass digestion tube of 250 mL along with 15 mL of HNO3 at 140 °C. The content was evaporated to dryness, and the dried sample treated by 3 mL of HClO4 for further oxidation from the sample solution for 30 min at 245 °C. After digestion to cool the content, filter and made up to 100 mL with distilled water, heavy metals were determined with the help of an atomic absorption spectrometer (Hitachi, Tokyo, Japan) [28]. Repeated measurements of soil samples have a coefficient of variation of less than 5%.

2.2.4. Statistical Analysis

Soil organic carbon density (SOCD) was calculated using the following equation:
SOCD = i = 1 n S O M i × 0.58 × B D i × 1 V i × 100
where SOCD is soil organic carbon density (kg/m2), SOM is organic matter content (g/kg), 0.58 is the Bemmelan coefficient for conversion of organic matter to organic carbon content, BD is soil bulk density (g/cm3), V is gravel content greater than 2 mm (V, %), and i represents the soil layer.
In this paper, the differences in SOC in different soil layers, different seasons and different gradients in the lakeside of West Mauri Lake were compared separately using a one-way analysis of variation (ANOVA) with the help of SPSS software. When the differences reached a level of significance (α = 0.05) or became highly significant (α = 0.01), the differences between the two were compared by using a multiple comparison method. To study the influencing factors of SOC in wetlands, Pearson correlation was used to investigate the relationship between SOC and water content, N, P, K or heavy metals.
To more accurately quantify the relationship between SOC and total N, we fitted the two with the nine most commonly used functional forms provided by SPSS software, such as linear, composite, inverse proportional, logarithmic, power, exponential, logistic, growth and “S”-type. The estimated standard deviation was used to screen the optimal fitted equation.

3. Results

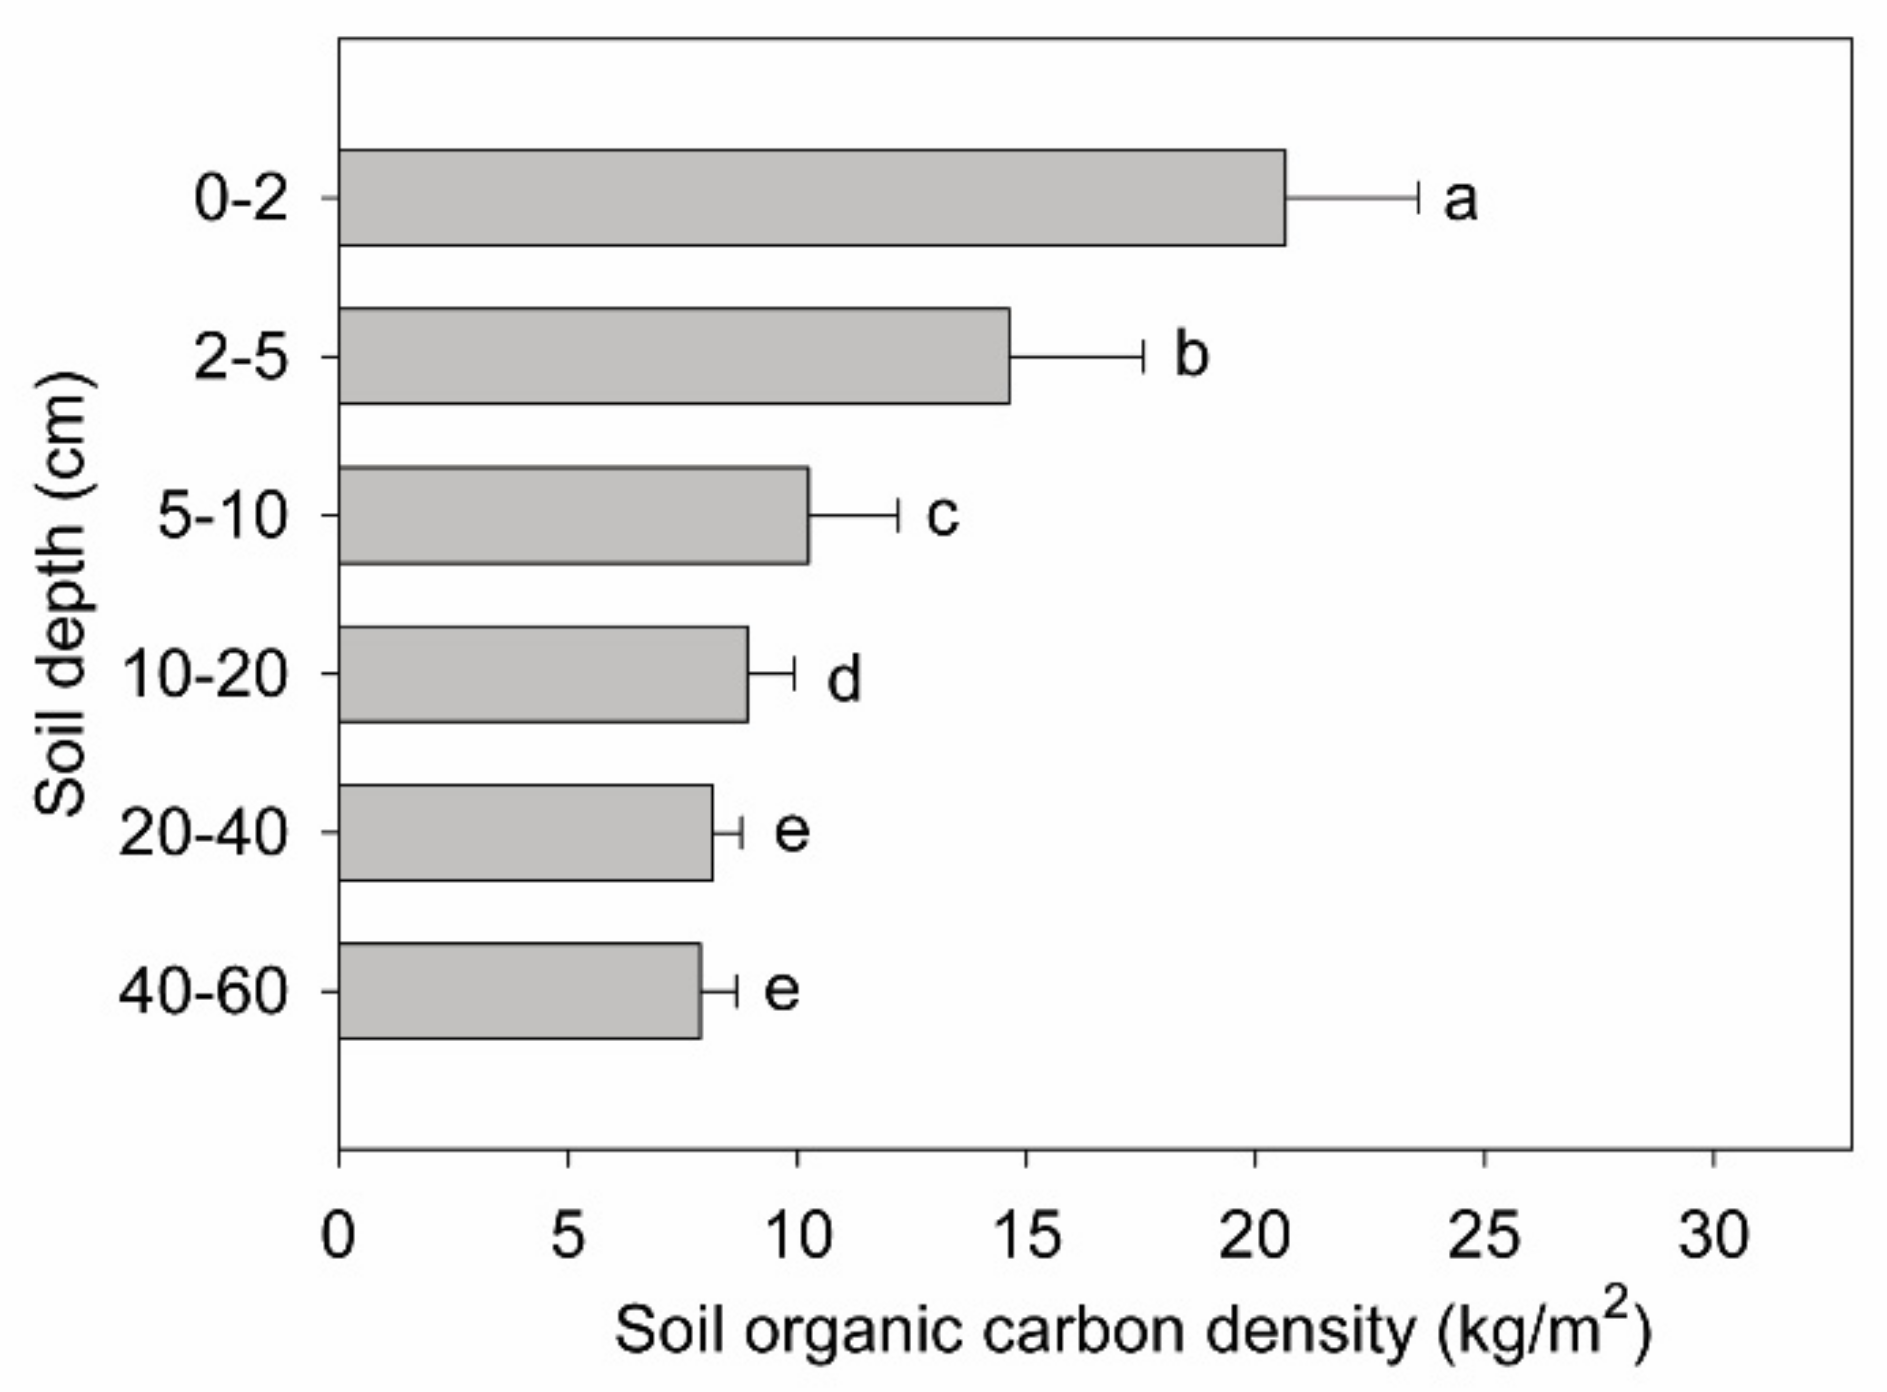
3.1. Vertical Distribution of SOC on the Lakeside of West Mauri Lake

One-way ANOVA indicated that a significant difference in SOC density was found in different depths in the lakeside of West Mauri Lake (p = 0.008 < 0.01) (Figure 2). The maximum organic carbon density was found in 0–2 cm (20.66 kg/m2) and the minimum in 40–60 cm (7.90 kg/m2). The organic carbon in soil surface (0–2 cm) was just twice that in 5–10 cm (10.25 kg/m2) and three times the size in the deep layer (20–60 cm). With the increase in soil depth, SOC density decreased continuously and significantly.

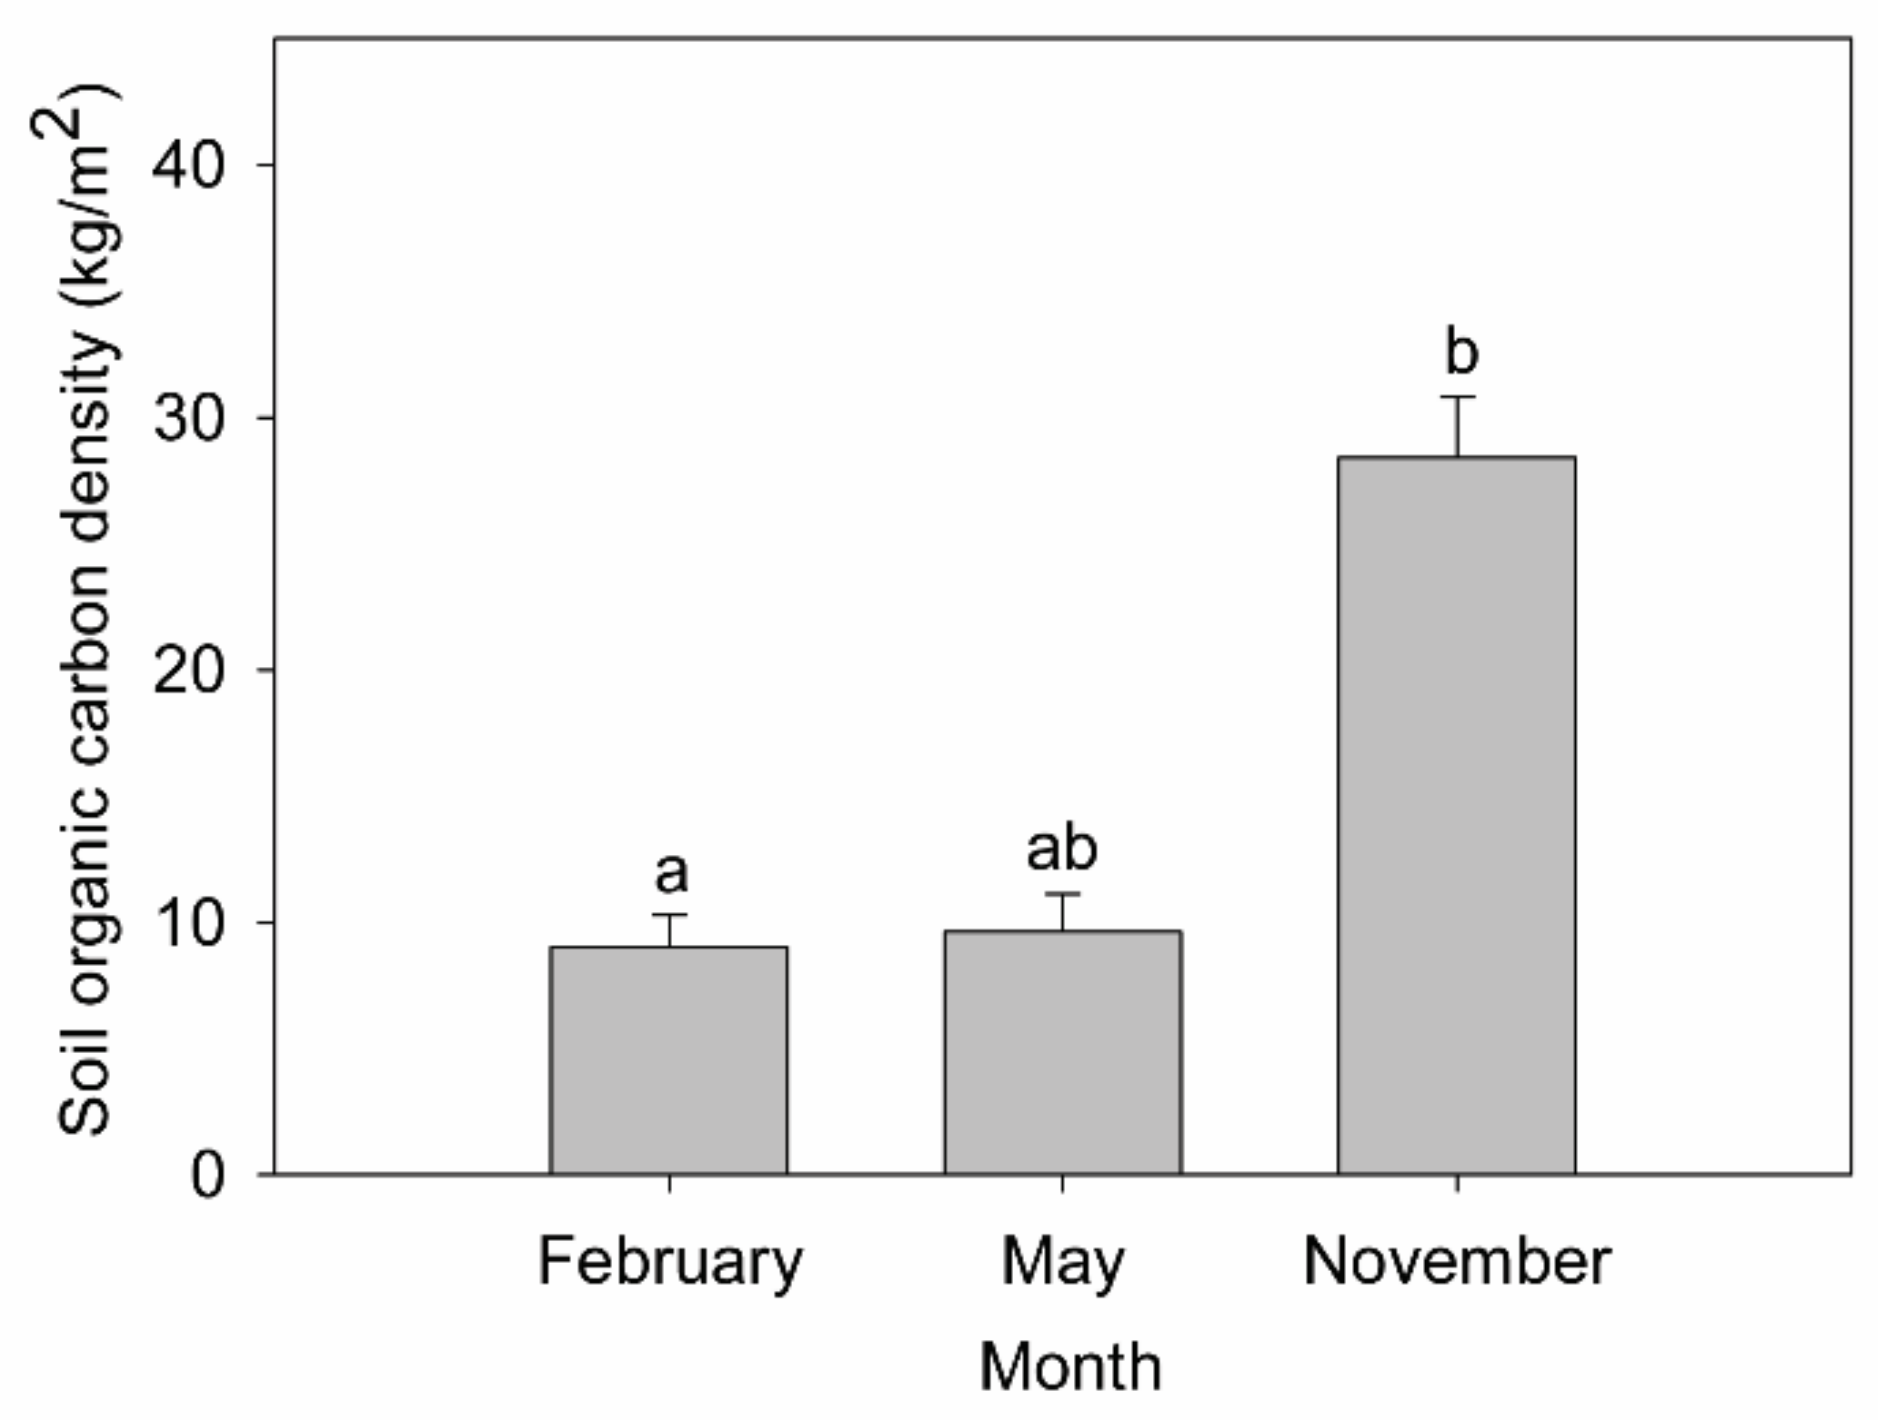
3.2. Seasonal Dynamics of SOC in the Lakeside of West Mauri Lake

Similarly, one-way ANOVA also showed that SOC in the lakeside of West Mauri Lake differed significantly (p < 0.001) in February, May and November (Figure 3), which increased as the month progressed. Multiple comparisons showed that SOC density in November (i.e., winter) (28.41 kg/m2) was significantly greater than that in February (i.e., spring) (9.03 kg/m3) and May (i.e., summer) (9.64 kg/m2), indicating a more than twofold difference in SOC among seasons.

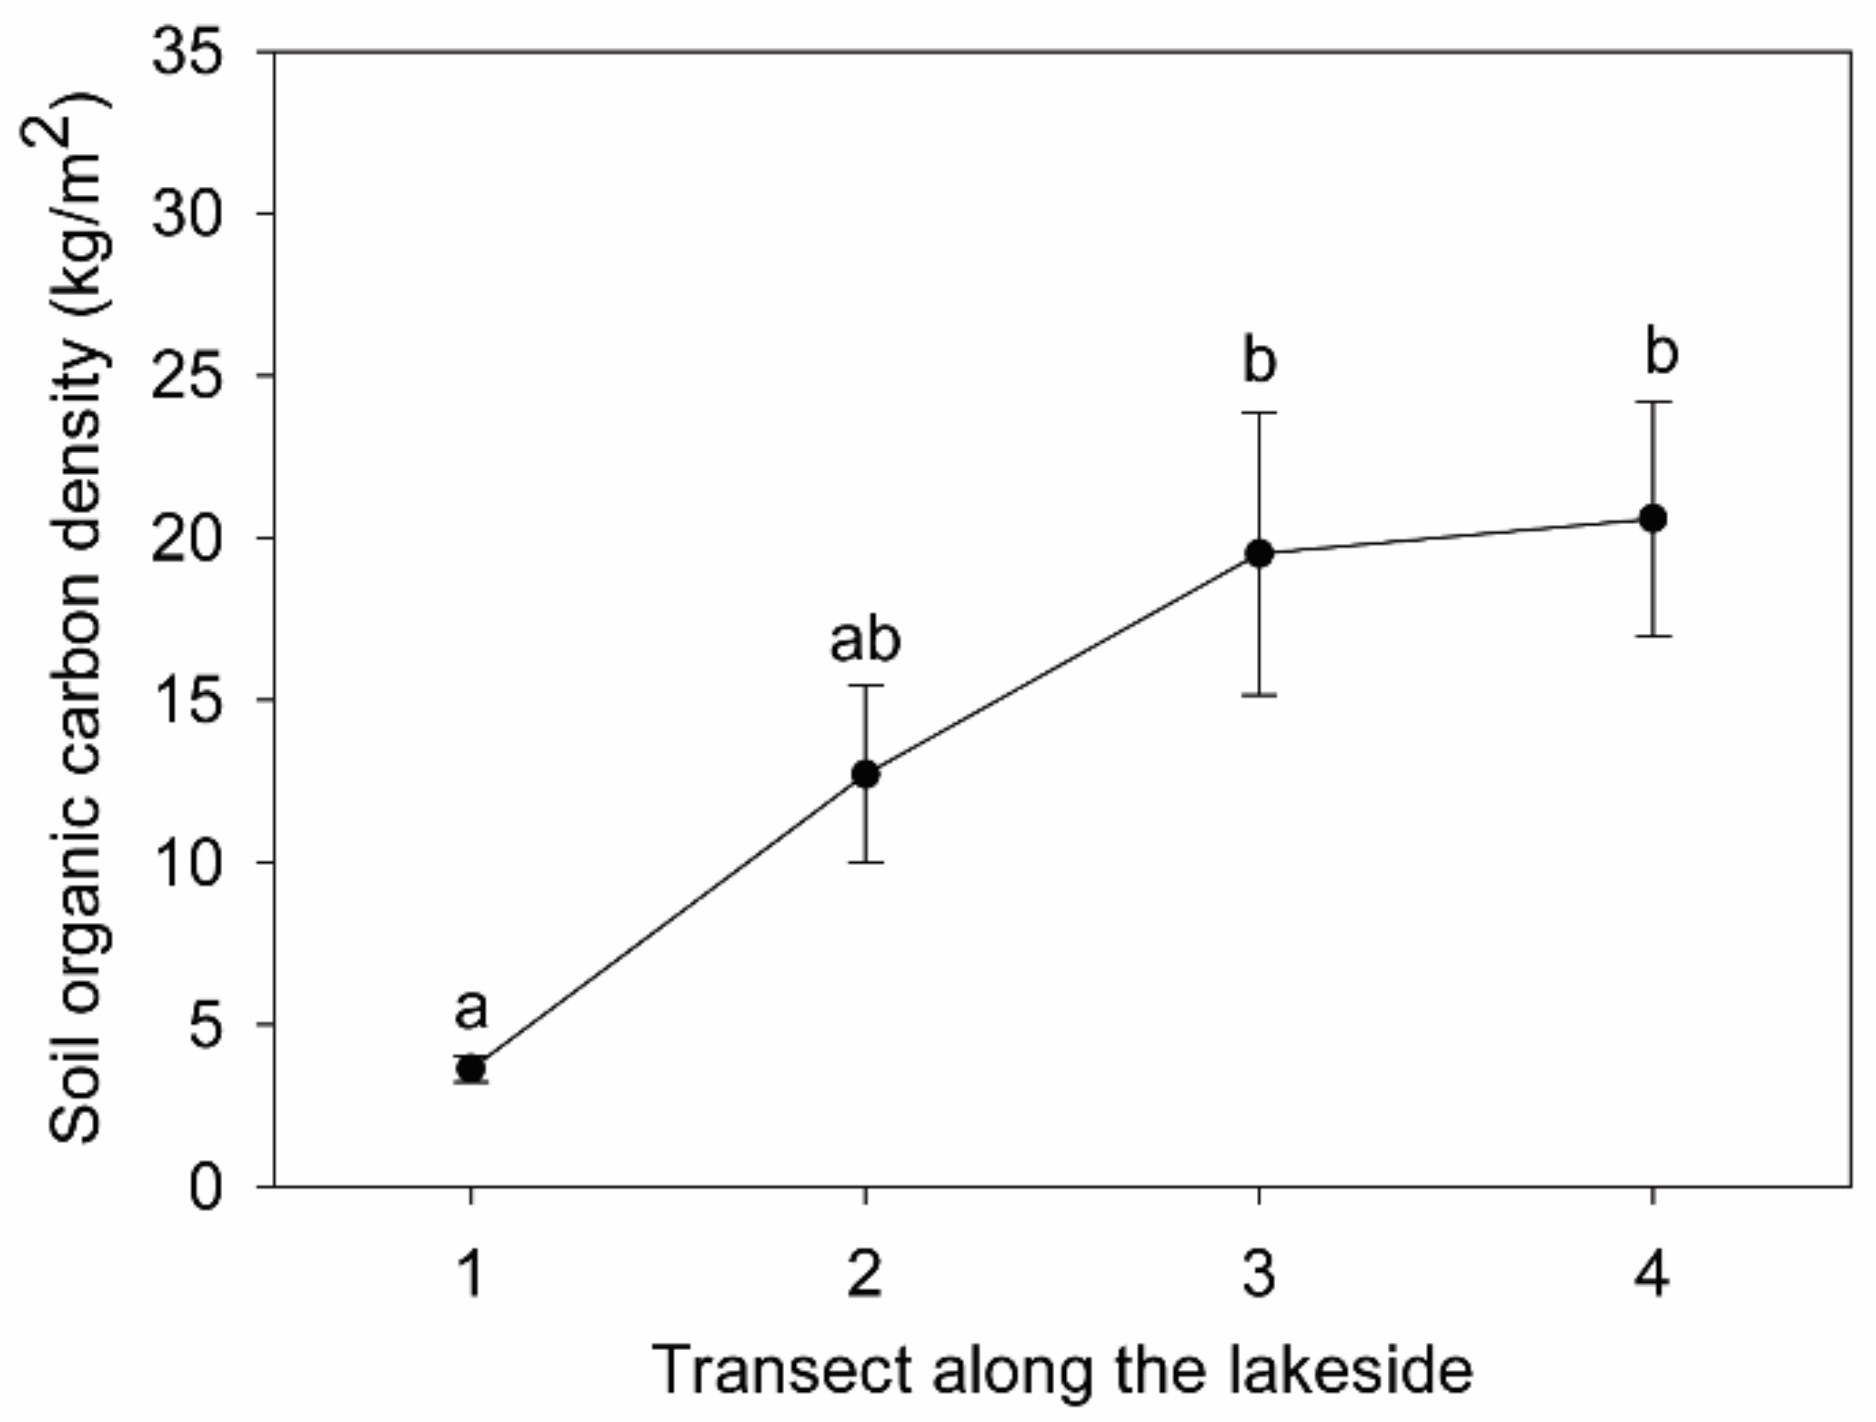
3.3. Change in SOC along the Lakeside of West Mauri Lake

One-way ANOVA was also used to compare SOC among different vegetation types (transects) along the landward lakeside of West Mauri Lake (Figure 4). It was found that SOC density varied significantly (p = 0.017 < 0.05) in outward direction from the lake surface and showed a significant increasing trend along the landward lakeside. The SOC density in the fluctuating zone (Transect 1) was the smallest, only 3.63 kg/m2; the SOC density in the mesophytic farmland rewetting zone (Transect 3) and the xerophytic farmland rewetting zone (Transect 4) was much larger, about 19.51 kg/m2 and 20.59 kg/m2, respectively.

3.4. Analysis of Influencing Factors of SOC in the Lakeside of West Mauri Lake

In order to analyze the influencing factors of SOC density in the lakeside of West Mauri Lake, correlation analysis was conducted between SOC density and soil physiochemical factors such as soil organic matter, bulk weight, water content, total N, total P, total K, total Cd, total Pb, total Cr, total Cu, and total Zn (Table 1). The results showed that SOC density had highly significant correlations (p < 0.001) with soil physiochemical factors, except for total Pb, total Cr, total Cu, total Zn, and total P. The correlation coefficients between SOC and soil organic matter, total N, total K, and total Cd, were all greater than 0.700, implying that SOC density in the lakeside of West Mauri Lake was strongly influenced by these four factors. In addition, the correlations of total N with organic matter and total Cd were highly significant and the correlation coefficients were all greater than 0.700 (the correlation coefficient with organic matter even reached 0.983), implying that total N was most likely the main influencing factor in SOC density in West Mauri Lake.
The further curve fitting results showed that there was a clear “S”-shaped curve between SOC density and total N (Figure 5), and total N explained 81% of the variation in SOC (R2 = 0.81).

4. Discussion

Wetland anaerobic soil indicated a slow decomposition rate compared with terrestrial ecosystems; this fact, coupled with the large amount of sediment accumulated in wetlands, means that wetland ecosystems are important carbon pools in the global biogeochemical cycle [9]. Changes in wetland carbon pools are influenced by environmental factors such as temperature [11], water level [29], and soil nutrients. Clarifying the magnitude and seasonal variation of SOC and its main influential factors in the lakeside zone is of significance both to accurately evaluate the role of wetland ecosystems in global climate change and to deeply understand the mechanisms of carbon pool changes in wetland ecosystems [2].

4.1. Vertical Distribution of SOC in the Lakeside of West Mauri Lake

The present study on the vertical distribution of SOC showed that SOC decreased continuously with the increase in soil depth (Figure 2), which is in full agreement with the report by Qi et al. [13] and by Wang and Jiao [30] on the vertical distribution pattern of SOC in coastal wetlands. According to Jobbagy and Jackson [31], SOC in terrestrial ecosystems also has a similar vertical variation pattern. Therefore, although wetland ecosystems and terrestrial ecosystems have obvious differences in terms of soil water content and decomposition rate, the vertical distribution pattern of SOC decreases continuously with increasing soil depth [31]. In terms of SOC content in the surface layer (0–10 cm), the average organic carbon content of lakeside soils in West Mauri is about 6.68 g/kg, which is slightly higher than the tidal wetland (6.45 g/kg) reported by Shao et al. [32], and comparable to the size of desert shrubs and riparian forests in the dry zone of Xinjiang, but significantly lower than wetland meadows (37.24–57.77 g/kg) [30].

4.2. Changes in SOC in the Lakeside of West Mauri Lake

In terms of seasonal variation, most studies have shown that SOC is highest in winter (November) [33,34]. As the months of the year progressed, SOC density increased along the lakeside of West Mauri Lake. SOC was significantly greater in winter than in other seasons (Figure 3), which is more consistent with the results of previous studies. This may be attributed to the inhibition effect of surface water on organic carbon decomposition. The higher water level in winter can limit O2 exchange, which is largely dependent on soil respiration and the decomposition process, and thus accumulates more SOC [35,36]. However, some studies have also pointed out that SOC was lower in winter than in summer and spring [37]. Wang et al. [38] even divided the seasonal variation of soil microbial carbon into three patterns of variation, namely high summer and low winter, low summer and high winter, and alternating dry-wet seasonal cycles. Therefore, in the context of global climate change, an accurate evaluation of global carbon balance requires further in-depth studies on the seasonal changes of SOC and its mechanism.
The results of this paper showed that there were significant differences (p = 0.017 < 0.05) in SOC density along the lakeside zone for different vegetation (land use) types (i.e., Transects 1–4) (Figure 4). In other words, land use type affects SOC in the lakeside zone. The SOC density was greater in both the mesophytic and xerophytic farmland rewetting restoration zone compared with the fluctuating zone and the beach, implying that the soil surface organic carbon could be increased through wetland restoration projects. This is similar to the conclusion presented by Jiao and Lu [39], who found that SOC in the soil surface in Taihu lake increased from 0.71% after 2 years of restoration to 1.85% after 15 years of restoration. Li et al. [40] also found an increase in soil organic matter in the Uygur River riparian wetland after 2 years of returning farmland to wetland. According to Miao et al. [41], SOC increased continuously as the vegetation succession stage advanced. The four types selected in this study, which were set along the lakeside from the lake surface outward, can basically be regarded as different succession stages of a succession series. After farmland has been returned to wetland, the intensity of human disturbance is reduced, which is conducive to the restoration of the wetland ecosystem and the accumulation of SOC. The results of this paper support the conclusion that wetland restoration projects are often regarded as an important initiative to increase SOC in wetland restoration, and also provide an empirical study showing the increase in SOC with positive results.

4.3. Correlation between SOC and Influencing Factors in the Lakeside of West Mauri Lake

Correlation analysis between SOC and soil physiochemical factors in the lakeside zone showed that most factors are closely related to SOC (p < 0.01; Table 1). However, the fitted curve shows that total N explains 81% of the variation in SOC in the lakeside zone (R2 = 0.81; Figure 5), suggesting that total N is the controlling factor leading the change in organic carbon. Long-term fertilization experiments have shown that the application of nitrogen fertilizer can increase SOC [7]. Is it right to increase the capacity to sequestercarbon by applying excessive amounts of nitrogen fertilizer? Since the 1980s, China has encouraged the application of chemical fertilizers in pursuit of high agricultural productivity; nowadays, the amount of nitrogen fertilizer application in China accounts for 30% of the global total [42,43]. West Mauri Lake is the granary of Tianjin City; the application of a large amount of chemical and organic fertilizers in aquaculture has resulted in serious nitrogen fertilizer and water pollution in West Mauri Lake. Therefore, it is not a scientific choice to unilaterally increase soil carbon sequestration potential through fertilization. According to the report by Kristek et al. [44], microbiological preparation is better than chemical fertilizers and can reduce nitrogen fertilizers by 30%, suggesting that biofertilizers may be a good option. In addition, effective nutrient management aimed at curbing phosphorus input has cleaned up many lakes in the western world and successfully controlled cyanobacterial blooms [45,46]. Can nutrient management help many lakes to recover from the effects of nitrogen pollution? This is a topic worthy of further study. The fitted SOC and N in this paper have an “S”-shaped relationship, which implies that the contribution of nitrogen fertilizer to SOC under low N content is greater than the effect of nitrogen application under high soil N content. However, there are few quantitative studies on how much nitrogen fertilizer should be used to increase SOC, or the relationship between the amount of nitrogen fertilizer and the rate of increasing SOC. Future research should focus on providing theoretical guidance for vegetation restoration in the lakeside.

5. Conclusions

The SOC in the lakeside decreased significantly with the increase in soil depth, as reported in the terrestrial ecosystem. The SOC density in the lakeside has obvious seasonal changes, and differs among land use types, indicating that land use affects SOC in the lakeside. The long-term accumulation of N fertilizer after the man-made reclamation and aquaculture clearly controls SOC in the lakeside of West Mauri Lake.

Author Contributions

Conceptualization, D.L. and L.J.; Formal analysis, D.L., L.J., X.W. and W.L.; Funding acquisition, L.J.; Investigation, D.L., L.J., X.W., W.L. and R.H.; Methodology, D.L., L.J., X.W., W.L. and R.H.; Resources, D.L., L.J., X.W. and R.H.; Validation, D.L., L.J. and X.W.; Writing—original draft, D.L., L.J., X.W., W.L. and R.H.; Writing—review and editing, D.L., L.J., X.W. and W.L. All authors have read and agreed to the published version of the manuscript.

Funding

This research was funded by the National 12th Five-year Science and Technology Support Project of China (No. 2014BAC09B01).

Institutional Review Board Statement

Not applicable.

Informed Consent Statement

Not applicable.

Data Availability Statement

The data presented in this study are available on request from the corresponding author. The data are not publicly available due to privacy or ethical restrictions.

Conflicts of Interest

The authors declare no conflict of interest. The funders had no role in the design of the study; in the collection, analyses, or interpretation of data; in the writing of the manuscript, or in the decision to publish the results.

References

  1. Keddy, P.A. Wetland Ecology: Principles and Conservation, 2nd ed.; Cambridge University Press: Cambridge, UK, 2010. [Google Scholar]
  2. Comer-Warner, S.A.; Nguyen, A.T.Q.; Nguyen, M.N.; Wang, M.L.; Turner, A.; Le, H.; Sgouridis, F.; Krause, S.; Kettridge, N.; Nguyen, N.; et al. Restoration Impacts on Rates of Denitrification and Greenhouse Gas Fluxes from Tropical Coastal Wetlands. Sci. Total Environ. 2022, 803, 13. [Google Scholar] [CrossRef] [PubMed]
  3. Gardner, R.C.; Barchiesi, S.; Beltrame, C.; Finlayson, C.M.; Galewski, T.; Harrison, I.; Paganini, M.; Perennou, C.; Pritchard, D.E.; Rosenqvist, A.; et al. State of the World’s Wetlands and Their Services to People: A Compilation of Recent Analyses; Ramsar Convention Secretariat: Gland, Switzerland, 2015. [Google Scholar]
  4. Chmura, G.L.; Anisfeld, S.C.; Cahoon, D.R.; Lynch, J.C. Global Carbon Sequestration in Tidal, Saline Wetland Soils. Glob. Biogeochem. Cycles 2003, 17, 1111. [Google Scholar] [CrossRef]
  5. Duarte, C.M.; Middelburg, J.J.; Caraco, N. Major Role of Marine Vegetation on the Oceanic Carbon Cycle. Biogeosciences 2005, 2, 1–8. [Google Scholar] [CrossRef] [Green Version]
  6. Sahagian, D.; Melack, J. Global Wetland Distribution and Functional Characterization: Trace Gases and the Hydrologic Cycle; International Geosphere-Biosphere Programme (IGBP): Stockholm, Sweden, 1998. [Google Scholar]
  7. Ludwig, B.; Geisseler, D.; Michel, K.; Joergensen, R.G.; Schulz, E.; Merbach, I.; Raupp, J.; Rauber, R.; Hu, K.; Niu, L.; et al. Effects of Fertilization and Soil Management on Crop Yields and Carbon Stabilization in Soils. A Review. Agron. Sustain. Dev. 2011, 31, 361–372. [Google Scholar] [CrossRef] [Green Version]
  8. Mitsch, W.J.; Gosselink, J.G. Wetlands, 4th ed.; John Wiley & Sons Inc.: New York, NY, USA, 2007. [Google Scholar]
  9. Mitra, S.; Wassmann, R.; Vlek, P.L.G. An Appraisal of Global Wetland Area and Its Organic Carbon Stock. Curr. Sci. 2005, 88, 25–35. [Google Scholar]
  10. Zheng, Y.; Niu, Z.; Gong, P.; Dai, Y.; Shangguan, W. Preliminary Estimation of the Organic Carbon Pool in China’s Wetlands. Chin. Sci. Bull. 2013, 58, 662–670. [Google Scholar] [CrossRef] [Green Version]
  11. Minick, K.J.; Mitra, B.; Li, X.F.; Fischer, M.; Aguilos, M.; Prajapati, P.; Noormets, A.; King, J.S. Wetland Microtopography Alters Response of Potential Net CO2 and CH4 Production to Temperature and Moisture: Evidence from a Laboratory Experiment. Geoderma 2021, 402, 13. [Google Scholar] [CrossRef]
  12. Liu, S.W.; Zheng, Y.J.; Ma, R.Y.; Yu, K.; Han, Z.Q.; Xiao, S.Q.; Li, Z.F.; Wu, S.; Li, S.Q.; Wang, J.Y.; et al. Increased Soil Release of Greenhouse Gases Shrinks Terrestrial Carbon Uptake Enhancement under Warming. Glob. Chang. Biol. 2020, 26, 4601–4613. [Google Scholar] [CrossRef]
  13. Qi, Q.; Zhang, D.J.; Zhang, M.Y.; Tong, S.Z.; Wang, W.H.; An, Y. Spatial Distribution of Soil Organic Carbon and Total Nitrogen in Disturbed Carex Tussock Wetland. Ecol. Indic. 2021, 120, 8. [Google Scholar] [CrossRef]
  14. Xiong, X.; Grunwald, S.; Myers, D.B.; Ross, C.W.; Harris, W.G.; Comerford, N.B. Interaction Effects of Climate and Land Use/Land Cover Change on Soil Organic Carbon Sequestration. Sci. Total Environ. 2014, 493, 974–982. [Google Scholar] [CrossRef]
  15. Lal, R. Soil Carbon Sequestration Impacts on Global Climate Change and Food Security. Science 2004, 304, 1623–1627. [Google Scholar] [CrossRef] [PubMed] [Green Version]
  16. Wang, G.X.; Ma, H.Y.; Qian, J.; Chang, J. Impact of Land Use Changes on Soil Carbon, Nitrogen and Phosphorus and Water Pollution in an Arid Region of Northwest China. Soil Use Manag. 2004, 20, 32–39. [Google Scholar] [CrossRef]
  17. Zhang, J.; Song, C.; Wang, S. Short-Term Dynamics of Carbon and Nitrogen after Tillage in a Freshwater Marsh of Northeast China. Soil Tillage Res. 2008, 99, 149–157. [Google Scholar] [CrossRef]
  18. Grasset, C.; Rodriguez, C.; Delolme, C.; Marmonier, P.; Bornette, G. Can Soil Organic Carbon Fractions Be Used as Functional Indicators of Wetlands? Wetlands 2017, 37, 1195–1205. [Google Scholar] [CrossRef]
  19. Liang, Y.K.; Dong, W.H.; Wu, X.C.; Xie, W. Changes and Vertical Distribution Characteristics of Soil Organic Carbon in Different Land Cover Types in Honghe Wetland of Sanjiang Plain, China. Curr. Sci. 2018, 114, 1055–1062. [Google Scholar] [CrossRef]
  20. Pearse, A.L.; Barton, J.L.; Lester, R.E.; Zawadzki, A.; Macreadie, P.I. Soil Organic Carbon Variability in Australian Temperate Freshwater Wetlands. Limnol. Oceanogr. 2018, 63, S254–S266. [Google Scholar] [CrossRef]
  21. Tao, B.X.; Wang, Y.P.; Yu, Y.; Li, Q.Z.; Luo, C.Y.; Zhang, B.H. Interactive Effects of Nitrogen Forms and Temperature on Soil Organic Carbon Decomposition in the Coastal Wetland of the Yellow River Delta, China. Catena 2018, 165, 408–413. [Google Scholar] [CrossRef]
  22. Coops, H.; Beklioglu, M.; Crisman, T.L. The Role of Water-Level Fluctuations in Shallow Lake Ecosystems—Workshop Conclusions. Hydrobiologia 2003, 506, 23–27. [Google Scholar] [CrossRef]
  23. Dai, X.; Wan, R.R.; Yang, G.S.; Wang, X.L.; Xu, L.G. Responses of Wetland Vegetation in Poyang Lake, China to Water-Level Fluctuations. Hydrobiologia 2016, 773, 35–47. [Google Scholar] [CrossRef]
  24. Hu, J.Y.; Xie, Y.H.; Tang, Y.; Li, F.; Zou, Y.A. Changes of Vegetation Distribution in the East Dongting Lake After the Operation of the Three Gorges Dam, China. Front. Plant Sci. 2018, 9, 582. [Google Scholar] [CrossRef] [Green Version]
  25. Nelson, D.W.; Sommers, L.E. Total carbon, organic carbon, and organic matter. In Methods of Soil Analysis. Part 2. Chemical and Microbiological Properties; Page, A.L., Ed.; American Society of Agronomy, Soil Science Society of America: Madison, WI, USA, 1982; pp. 539–579. [Google Scholar]
  26. Bremner, J.M. Nitrogen-total. In Methods of Soil Analysis. Part 3-Chemical Methods; Sparks, D.L., Page, A.L., Helmke, P.A., Loeppert, R.H., Soltanpour, P.N., Tabatabai, M.A., Johnston, C.T., Sumner, M.E., Eds.; American Society of Agronomy, Soil Science Society of America: Madison, WI, USA, 1996; pp. 1085–1122. ISBN 0891188258. [Google Scholar]
  27. Watanabe, F.S.; Olsen, S.R. Test of an Ascorbic Acid Method for Determining Phosphorus in Water and NaHCO3 Extracts from Soil. Soil Sci. Soc. Am. J. 1965, 291, 677–678. [Google Scholar] [CrossRef]
  28. Hanlon, E.A. Elemental determination by atomic absorption spectrophotometry. In Handbook of Reference Methods for Plant Analysis; Kalra, Y.P., Ed.; CRC Press: Boca Raton, FL, USA, 1998; pp. 157–164. [Google Scholar]
  29. Yin, S.; Bai, J.H.; Wang, W.; Zhang, G.L.; Jia, J.; Cui, B.S.; Liu, X.H. Effects of Soil Moisture on Carbon Mineralization in Floodplain Wetlands with Different Flooding Frequencies. J. Hydrol. 2019, 574, 1074–1084. [Google Scholar] [CrossRef]
  30. Wang, Y.H.; Jiao, L. Study of the Characteristics and Storage of Soil Organic Carbon in the Ebinur Lake Weland. Acta Ecol. Sin. 2016, 36, 1–9. [Google Scholar]
  31. Jobbagy, E.G.; Jackson, R.B. The Distribution of Soil Nutrients with Depth: Global Patterns and the Imprint of Plants. Biogeochemistry 2001, 53, 51–77. [Google Scholar] [CrossRef]
  32. Shao, X.X.; Yang, W.Y.; Wu, M.; Jiang, K.Y. Soil Organic Carbon Content and Its Distribution Pattern in Hangzhou Bay Coastal Wetlands. Chin. J. Appl. Ecol. 2011, 22, 658–664. [Google Scholar]
  33. Liu, J.; Zhou, H.; Qin, P.; Zhou, J. Effects of Spartina Alterniflora Salt Marshes on Organic Carbon Acquisition in Intertidal Zones of Jiangsu Province, China. Ecol. Eng. 2007, 30, 240–249. [Google Scholar] [CrossRef]
  34. Zhou, L.; Yin, S.; An, S.; Yang, W.; Deng, Q.; Xie, D.; Ji, H.; Ouyang, Y.; Cheng, X. Spartina Alterniflora Invasion Alters Carbon Exchange and Soil Organic Carbon in Eastern Salt Marsh of China. CLEAN Soil Air Water 2015, 43, 569–576. [Google Scholar] [CrossRef]
  35. Chivers, M.R.; Turetsky, M.R.; Waddington, J.M.; Harden, J.W.; McGuire, A.D. Effects of Experimental Water Table and Temperature Manipulations on Ecosystem CO2 Fluxes in an Alaskan Rich Fen. Ecosystems 2009, 12, 1329–1342. [Google Scholar] [CrossRef]
  36. Krauss, K.W.; Whitbeck, J.L.; Howard, R.J. On the Relative Roles of Hydrology, Salinity, Temperature, and Root Productivity in Controlling Soil Respiration from Coastal Swamps (Freshwater). Plant Soil 2012, 358, 265–274. [Google Scholar] [CrossRef]
  37. Yang, W.; Zhao, H.; Chen, X.; Yin, S.; Cheng, X.; An, S. Consequences of Short-Term C-4 Plant Spartina Alterniflora Invasions for Soil Organic Carbon Dynamics in a Coastal Wetland of Eastern China. Ecol. Eng. 2013, 61, 50–57. [Google Scholar] [CrossRef]
  38. Wang, G.B.; Ruan, H.H.; Tang, Y.F.; He, R. A Review on the Dynamics of Soil Microbial Biomass in Forest Ecosystems. J. Anhui Agric. Univ. 2009, 36, 100–104. [Google Scholar]
  39. Jiao, H.J.; Lu, J.W. Study on Soil Structure, Carbon and Nitrogen Characteristics during Natural Restoration of Degraded Wetland in Lakeside Zone. Beijing Water J. 2012, 4, 21–24. [Google Scholar]
  40. Li, Y.; Han, Q.; Liu, X.Y.; Zhao, L.; Zhang, Q.C. Characteristic of Soil Nutrient Restoration under Different Modes of Returning Farmlands to Wetlands in the Riparian Wetlands of Wuyu’er River. Wetl. Sci. 2016, 14, 578–581. [Google Scholar]
  41. Miao, L.; Yang, X.T.; Wang, T.; Sun, Y.J.; Zhang, J. Seasonal Dynamics and Content of Soil Organic Carbon of Southern Foot of Taihang Mountains during Different Natural Successions. J. Henan Agric. Univ. 2016, 50, 318–324. [Google Scholar]
  42. Ju, X.T.; Xing, G.X.; Chen, X.P.; Zhang, S.L.; Zhang, L.J.; Liu, X.J.; Cui, Z.L.; Yin, B.; Christie, P.; Zhu, Z.L.; et al. Reducing Environmental Risk by Improving N Management in Intensive Chinese Agricultural Systems. Proc. Natl. Acad. Sci. USA 2009, 106, 3041–3046. [Google Scholar] [CrossRef] [PubMed] [Green Version]
  43. Zhu, Z.L.; Chen, D.L. Nitrogen Fertilizer Use in China—Contributions to Food Production, Impacts on the Environment and Best Management Strategies. Nutr. Cycl. Agroecosyst. 2002, 63, 117–127. [Google Scholar] [CrossRef]
  44. Kristek, S.; Resic, I.; Jovic, J.; Rasic, S.; Varga, I.; Lenart, L.; Kispal, H.; Antunovic, M. Possibility of Minearl Nitrogen Fertilization Reduction by Applying Beneficial Microoganisms. Listy Cukrovarnické a Reparské 2017, 133, 90–93. [Google Scholar]
  45. Winder, M. Limnology: Lake Warming Mimics Fertilization. Nat. Clim. Chang. 2012, 2, 771–772. [Google Scholar] [CrossRef]
  46. Conley, D.J.; Paerl, H.W.; Howarth, R.W.; Boesch, D.F.; Seitzinger, S.P.; Havens, K.E.; Lancelot, C.; Likens, G.E. Controlling Eutrophication: Nitrogen and Phosphorus. Science 2009, 323, 1014–1015. [Google Scholar] [CrossRef]
Figure 1. Schematic diagram of the four transects established along the landward lakeside of West Mauri Lake.
Processes 10 00765 g001
Figure 2. Vertical distribution of soil organic carbon along the lakeside of West Mauri Lake.
Processes 10 00765 g002
Figure 3. Seasonal variation of soil organic carbon in the lakeside of West Mauri Lake.
Processes 10 00765 g003
Figure 4. Soil organic carbon density and its variation in four transects (vegetation types) along the lakeside of West Mauri Lake.
Processes 10 00765 g004
Figure 5. Relationship between soil organic carbon density and soil nitrogen content in West Mauri Lake.
Processes 10 00765 g005
Table 1. Correlation of soil organic carbon with physiochemical factors in the lakeside of West Mauri Lake.
Organic MatterBulk DensityMoisture ContentTotal NTotal PTotal KTotal CdTotal PbTotal CrTotal CuTotal Zn
SOCDr0.7280.5710.3300.7180.133−0.7680.7210.264−0.114−0.167−0.161
p<0.001<0.001<0.001<0.0010.139<0.001<0.0010.0090.2690.1050.116
Organic matterr −0.0890.5790.9830.373−0.0810.7310.210−0.236−0.212−0.158
p 0.320<0.001<0.001<0.0010.270<0.0010.0270.0130.0260.098
Bulk densityr −0.081−0.092−0.559−0.883−0.4710.0480.3680.2220.163
p 0.3130.306<0.001<0.001<0.0010.639<0.0010.0300.112
Moisture contentr 0.559−0.194−0.2490.5800.2210.011−0.097−0.055
p <0.0010.0150.002<0.0010.0310.9130.3470.594
Total Nr 0.390−0.1180.7300.249−0.194−0.159−0.116
p <0.0010.108<0.0010.0090.0410.0960.224
Total Pr 0.4340.3810.5460.3110.2770.110
p <0.001<0.001<0.0010.0010.0030.250
Total Kr −0.467−0.0220.3290.4380.422
p <0.0010.821<0.001<0.001<0.001
Total Cdr 0.377−0.087−0.011−0.026
p <0.0010.3660.9110.790
Total Pbr 0.5430.3650.234
p <0.001<0.0010.013
Total Crr 0.4870.404
p <0.001<0.001
Total Cur 0.484
p <0.001
Publisher’s Note: MDPI stays neutral with regard to jurisdictional claims in published maps and institutional affiliations.

