Review

Review on Zigzag Air Classifier

1
Institute of Mechanical Process Engineering and Mineral Processing, TU Bergakademie Freiberg, 09599 Freiberg, Germany
2
Helmholtz-Zentrum Dresden-Rossendorf (HZDR), Helmholtz Institut Freiberg for Resource Technology (HIF), Chemnitzer Straße 40, 09599 Freiberg, Germany
*
Author to whom correspondence should be addressed.
Processes 2022, 10(4), 764; https://doi.org/10.3390/pr10040764
Submission received: 3 March 2022 / Revised: 31 March 2022 / Accepted: 6 April 2022 / Published: 13 April 2022

Abstract

:
The zigzag (ZZ) classifier is a sorting and classification device with a wide range of applications (e.g. recycling, food industry). Due to the possible variation of geometry and process settings, the apparatus is used for various windows of operation due to the specifications of the separation (e.g. cut sizes from 100 µm to several decimetres, compact and fluffy materials as well as foils). Since the ZZ classifier gains more and more interest in recycling applications, it is discussed in this paper, with regards to its design, mode of operation, influencing parameters and the research to date. Research on the ZZ-classifier has been ongoing on for more than 50 years and can be divided into mainly experimental studies and modelling approaches.

1. Introduction

Recycling plays a key role in the strive for a circular economy [1,2,3,4,5,6]. In addition to the liberation of components and valuable materials, an an efficient sorting is key to every successful recycling process. Here, valuable components or materials are separated from other constituents of a feed. Sorting can be divided into different categories based on the physical properties used for separation [7]. A separation process can be characterised by a so-called Tromp curve, also known as a partition curve T(ξ) [8]. The partition curve describes the amount of material of a specific particle property ξ transferred from the feed (F) into the concentrate (C). This specific particle property can be the particle size in sieving [9], the particle density in jigging [9], or the settling velocity in air classification. To calculate the partition curve, the property distribution must be known for both products (concentrate and reject) or one product and the feed material.
T ( ξ ) = q C ( ξ ) q F ( ξ ) R m , C
Here, qC(ξ) and qF(ξ) are the density distributions of the characteristic feature ξ and the recovery of mass Rm,C which is defined as:
R m , C = m C m ges · 100   %
The mass recovery Rm,C characterises the mass output mC in the concentrate C in relation to the total mass mges. On the basis of the partition curve, it is possible to evaluate the separation process by means of the median cut size T(ξ) = 50% and the separation efficiency κ (slope of the partition function). The separation efficiency is often calculated as follows [10,11]:
κ = ξ 25 ξ 75
Thereby applies T(ξ25) = 25 % and T(ξ75) = 75%.
One category of separation is gravity sorting which separates particles according to their density, shape and size by using the relative motion of the particles and a fluid. Therefore, the core part of gravity sorting is the force balance between field, flow and inertia forces of a particle. Due to this balance, particles move on settling velocity-dependent trajectories which are used for size classification and shape or density depending sorting [7,12,13].
Furthermore, density separators are classed by the feeding system, flow regime, general design features and operation mode (continuous or batch) [14]. Depending on the used fluid used, the process can be either wet (e.g. water) or dry (air). An advantage of dry operation is a higher cost efficiency since wet operation requires the treatment and deposition of process water and its deposit [15]. Moreover, dry-operated apparatuses can be easily used for mobile and semi-mobile applications which avoids problems with process water treatment and its disposal [16]. Some of the machines for dry gravity separation are also known as air classifiers. The classification is a sorting according to the size of the particles. Independent of the operation mode, the feed material is separated into the light product (along with the fluid flow) and the heavy product which follows the direction of the force field [17,18,19].
Other operation modes are upstream/counterflow or crossflow separation depending on the directions of fluid flow and acting force field [20]. Counterflow classifiers are the simplest form of air classifiers, characterised by the vertical tube-like process space and an air stream directed upwards. Although the simple design of this classifier is an advantage, the disadvantages are low separation efficiencies and accumulation of particles whose settling velocity equal the velocity of fluid in the separation zone [16]. In cross-flow classifiers, the feed material moves crosswise to the main flow of the fluid and the particles are deflected further as their settling velocity decreases. In contrast to upstream separators, more than two products can be generated [12]. However, cross-flow classifiers also suffer from a certain sorting inefficiency [21].
Zigzag air classifiers unite the advantages and overcome most of the disadvantages of upstream or crossflow air separators. Therefore, this separator type is subject of the present review. In addition to its designs and modes of operation, the applications and state of knowledge are summarized and discussed.

2. Design and Mode of Operation
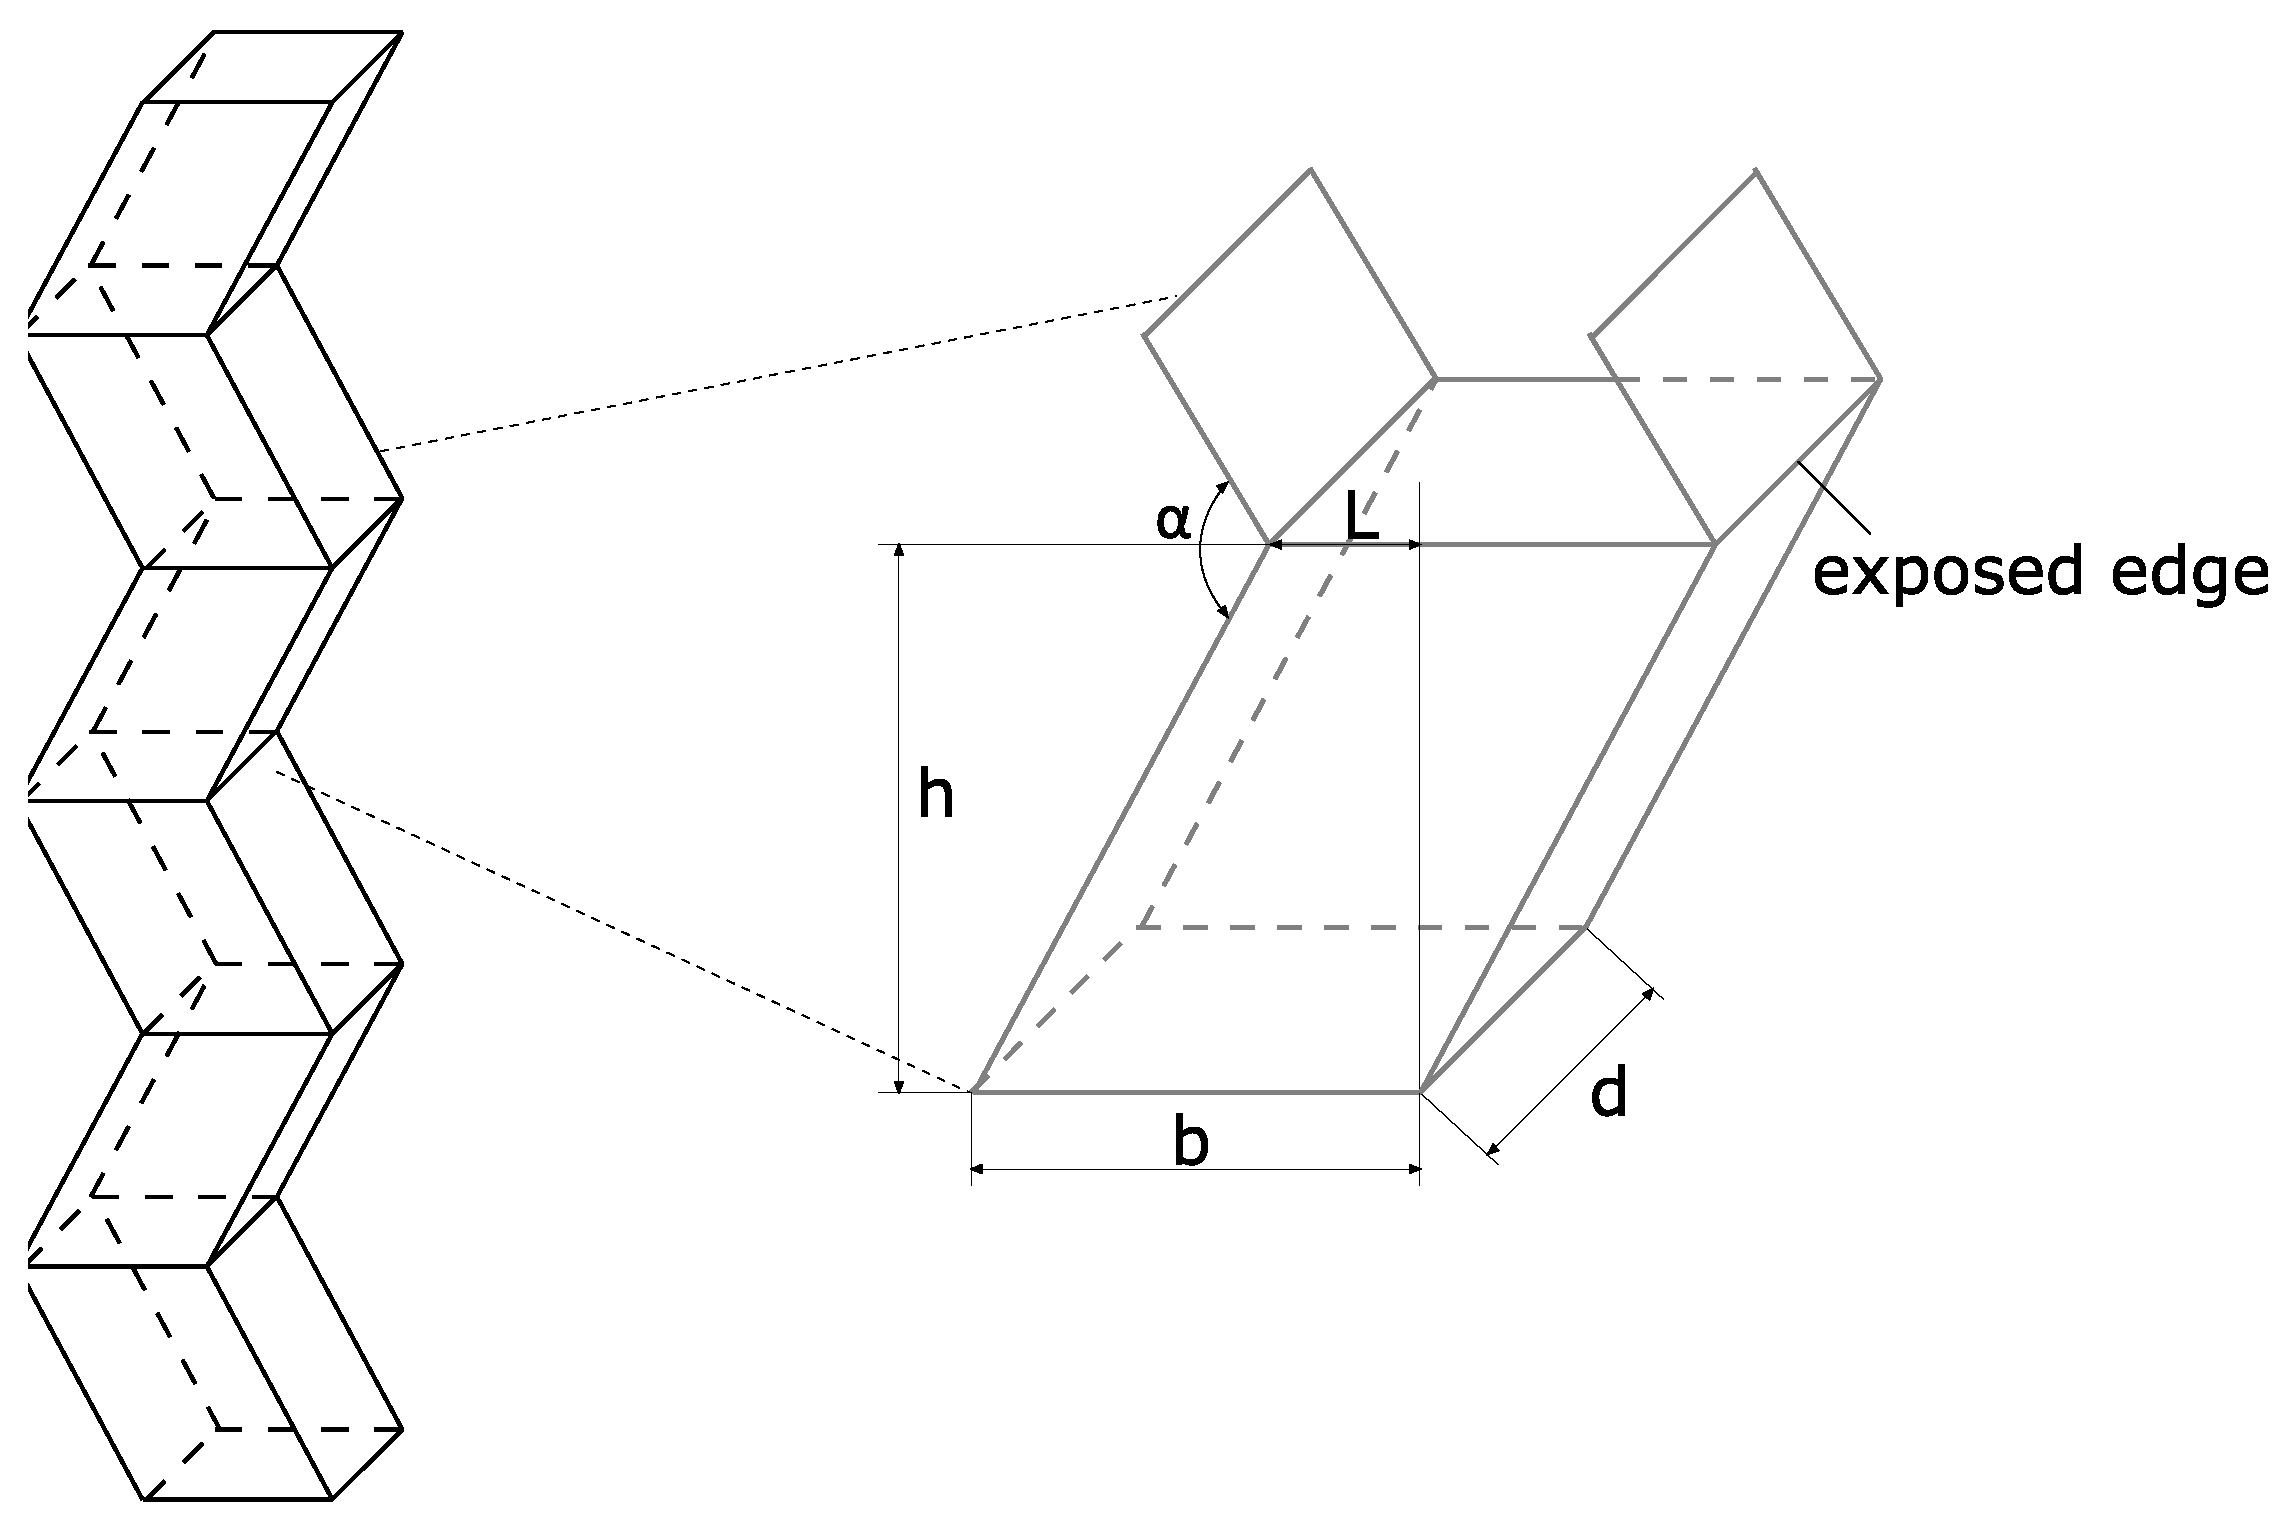
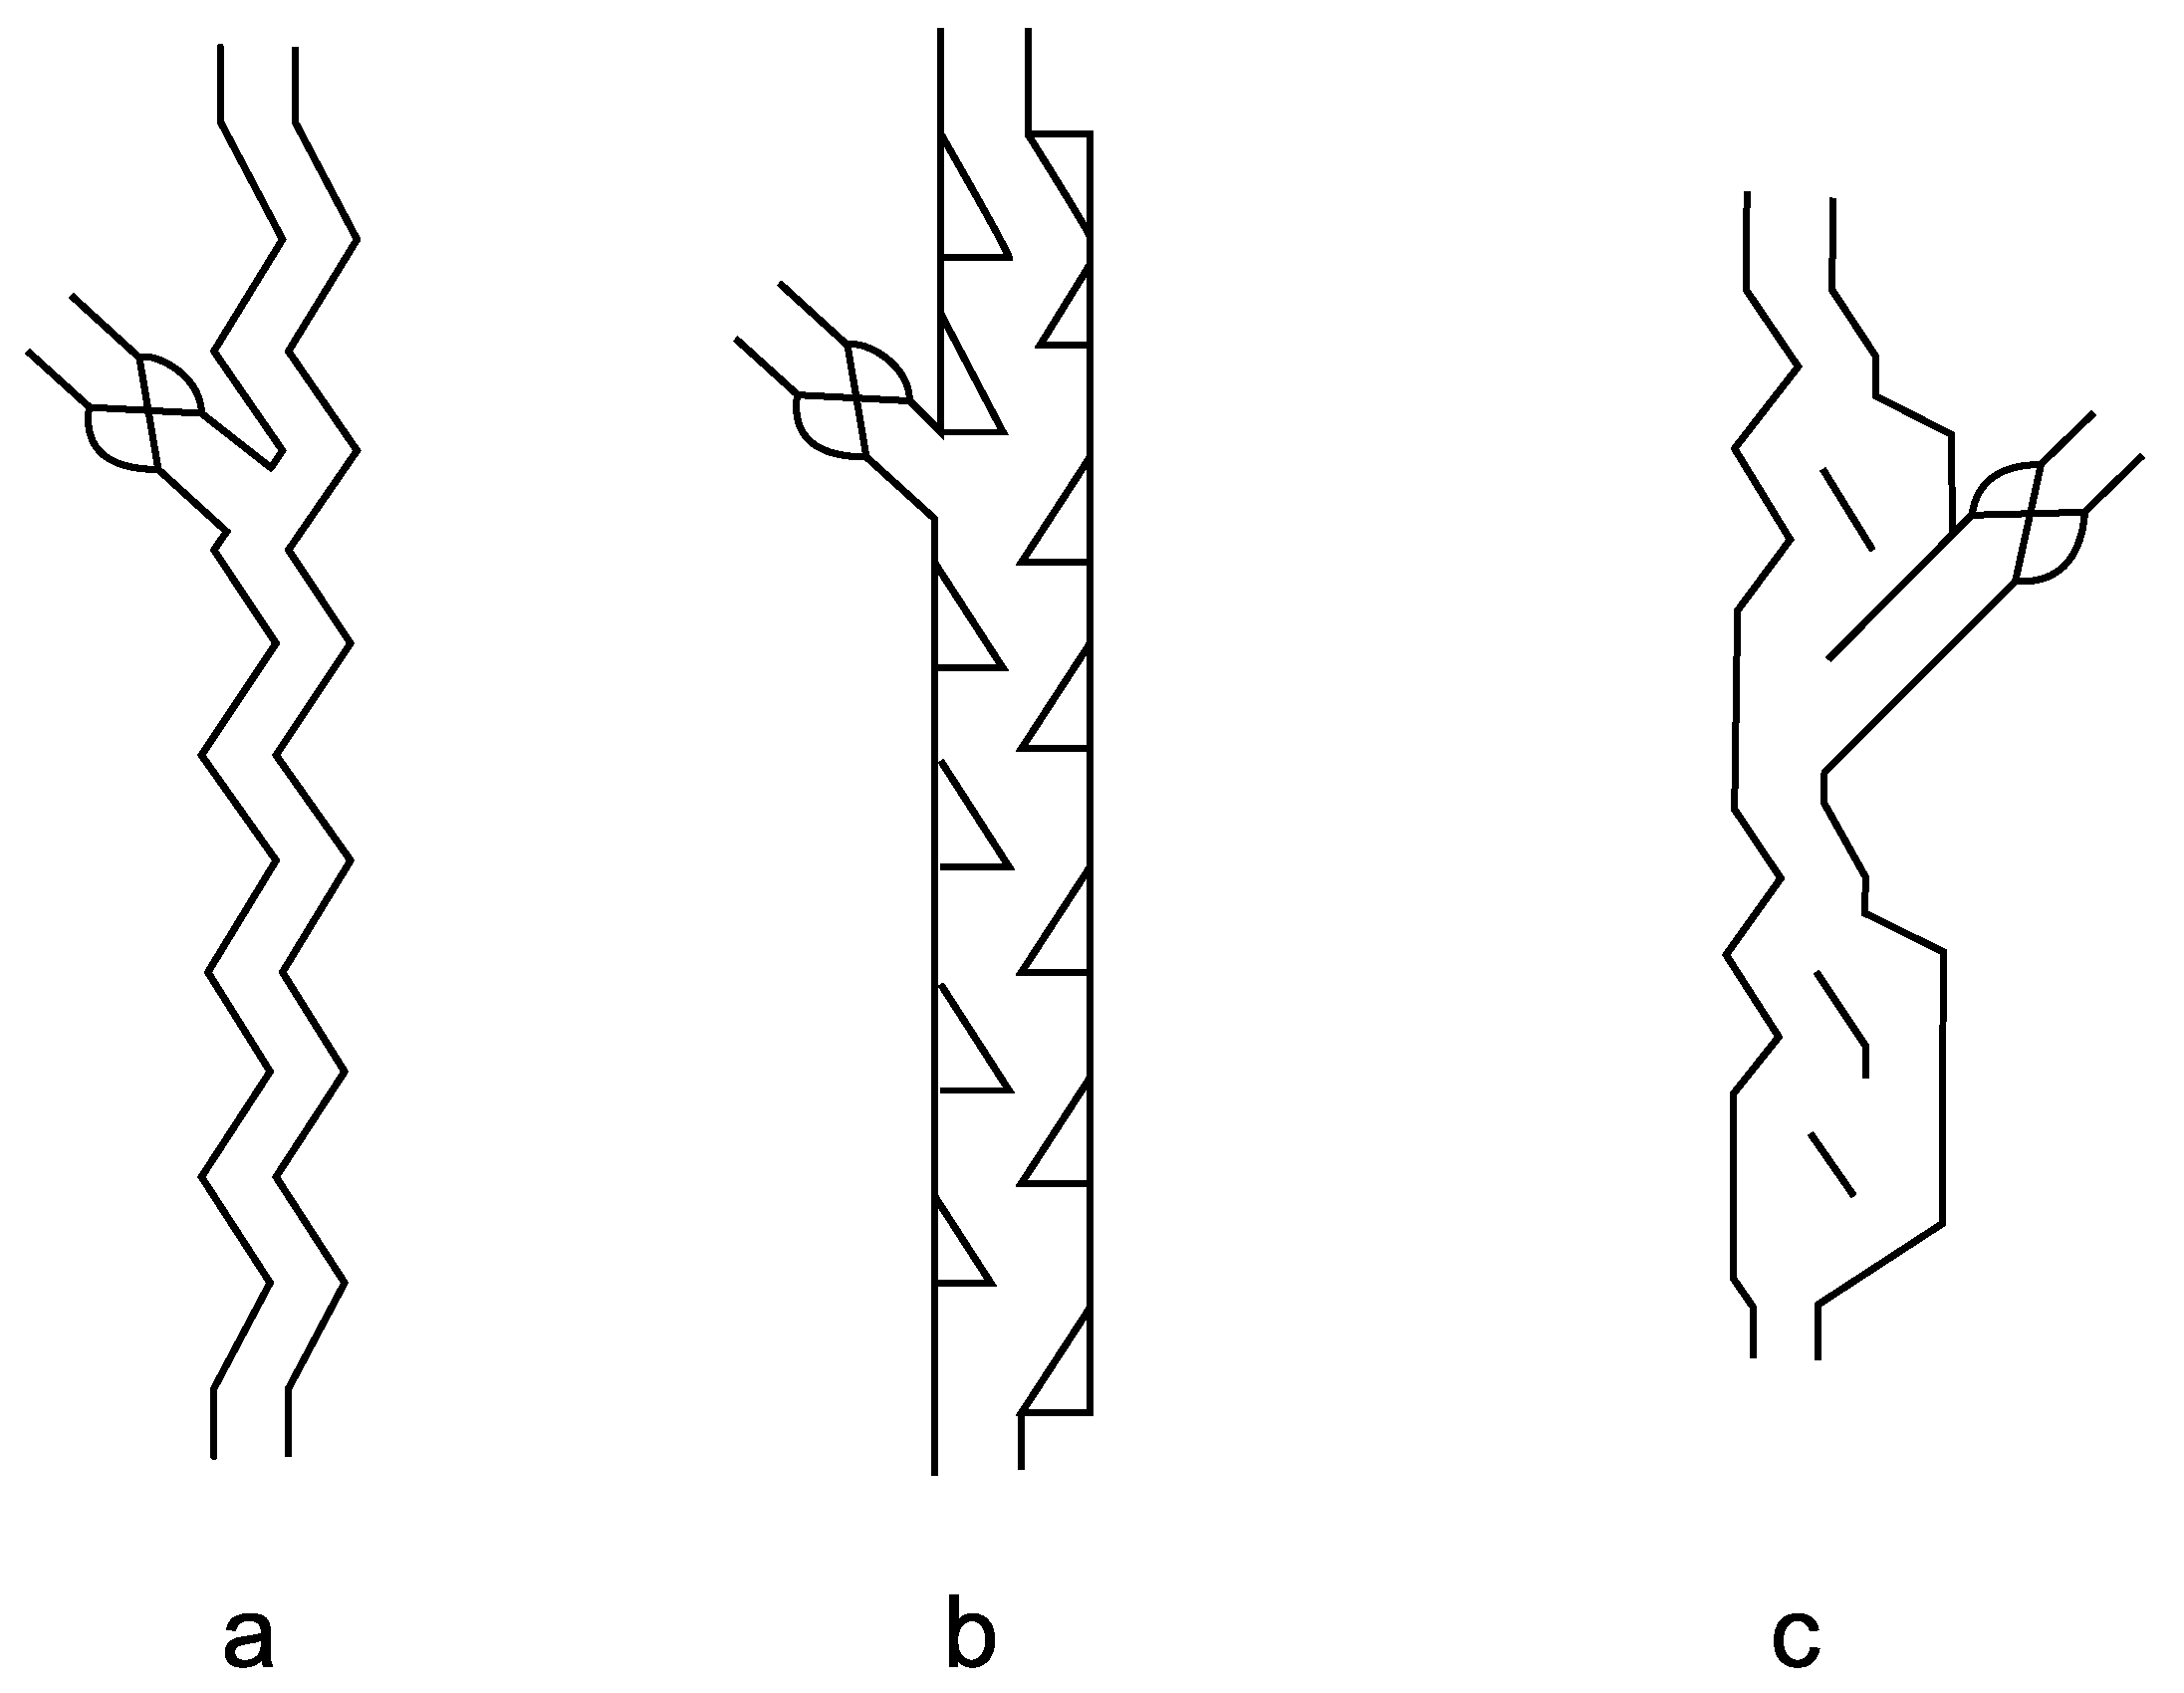
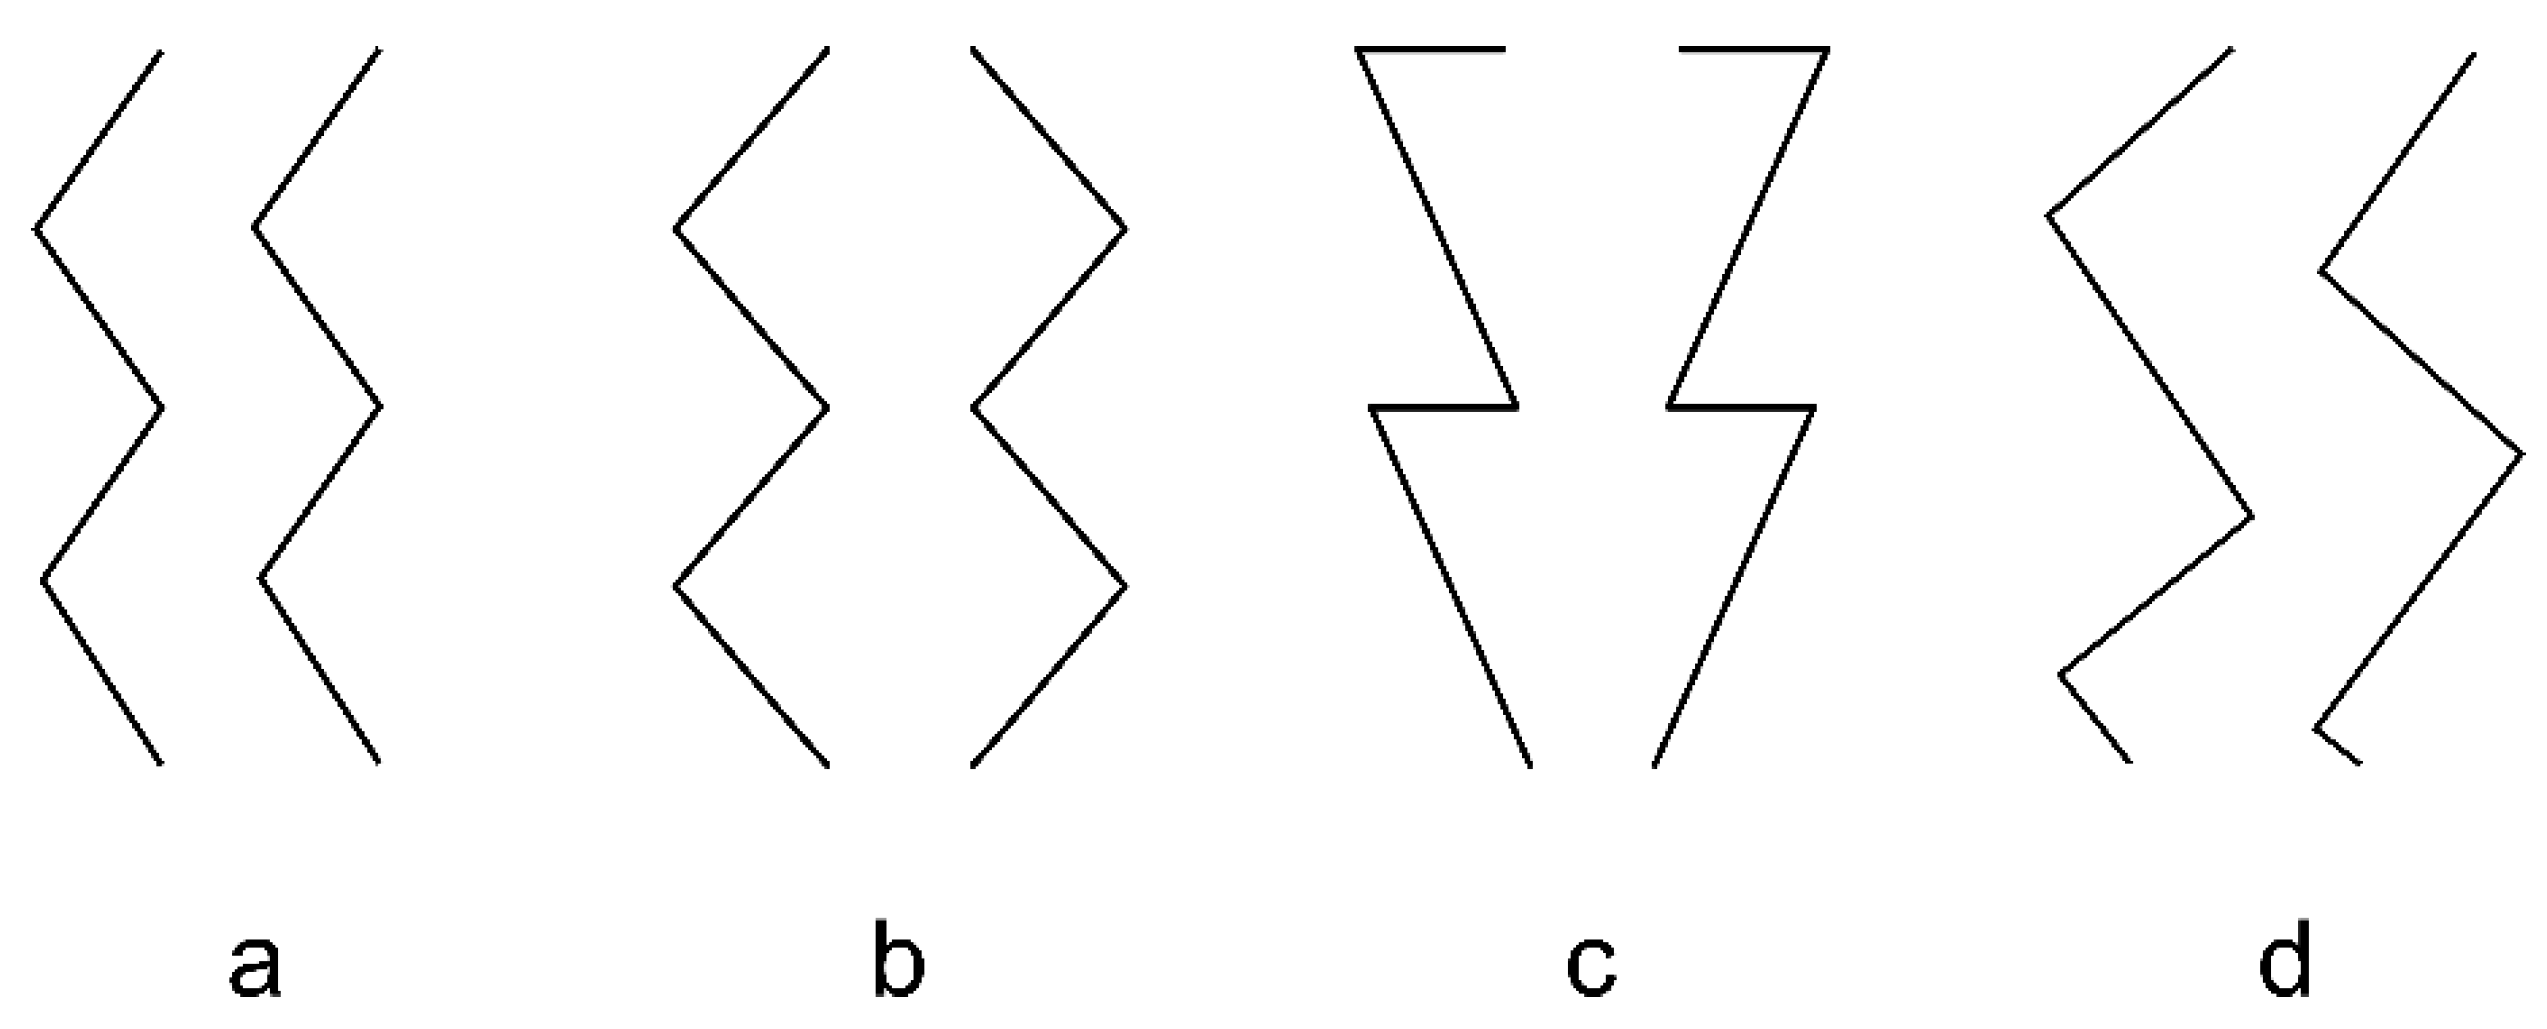
2.1. General Design

The main component of a ZZ-classifier is a characteristic, segmented channel. The ZZ classifier was first mentioned by Stebbins in 1932 in a patent (A.H: Stebbins: US Patent 1861248) [22]. Figure 1 illustrates a typical zigzag channel with its characteristic geometric parameters height (h), width (b), depth (d), horizontal distance (L) of the exposed edges, and step angle (α). Different geometries are documented for industry and research. In industry, a stage has an angle of 120°. Companies like JÖST [23], Trennso [24], Hosakawa Alpine [25], Hamatec [26], and RecyclingWorld [27] offer ZZ with this geometry. However, the other geometric parameters vary depending on the manufacturer. Although the distance between the exposed edges of the channel (see Fig 1) usually differs, most of the ZZ classifiers offered tend to have a distance greater than L > 0. Alternatively, the edges lie directly on top of each other (L ≈ 0). Overlapping classifier edges (L < 0) are rare and can be found only in special applications [28]. Decisive for the throughput are the dimensions of the cross-section (b/d) which is usually scaled to the channel depth d. In industry, a ratio b/d of less than or equal to 1 is usually used. For higher mass throughputs, smaller ratios are also used [29].

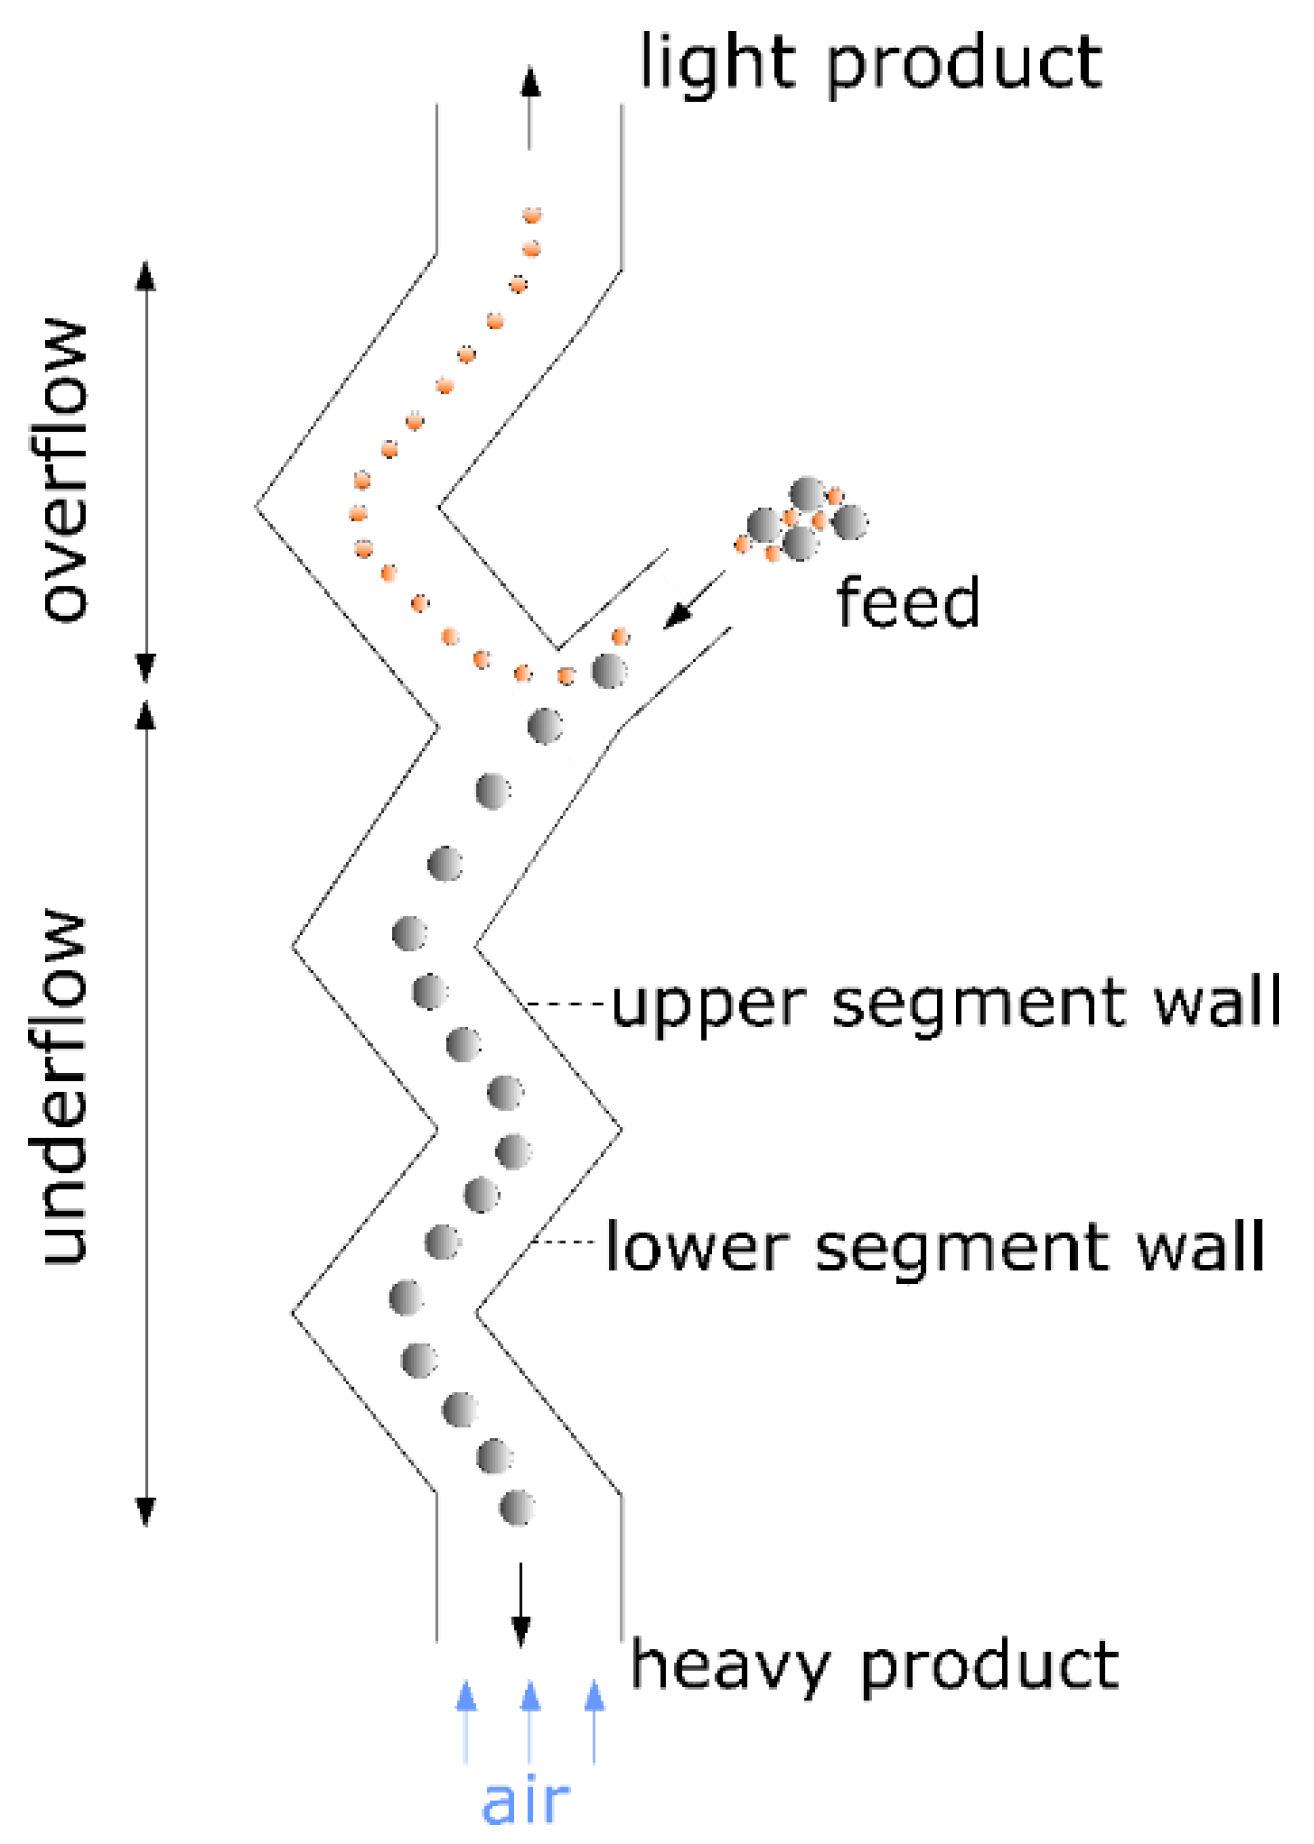
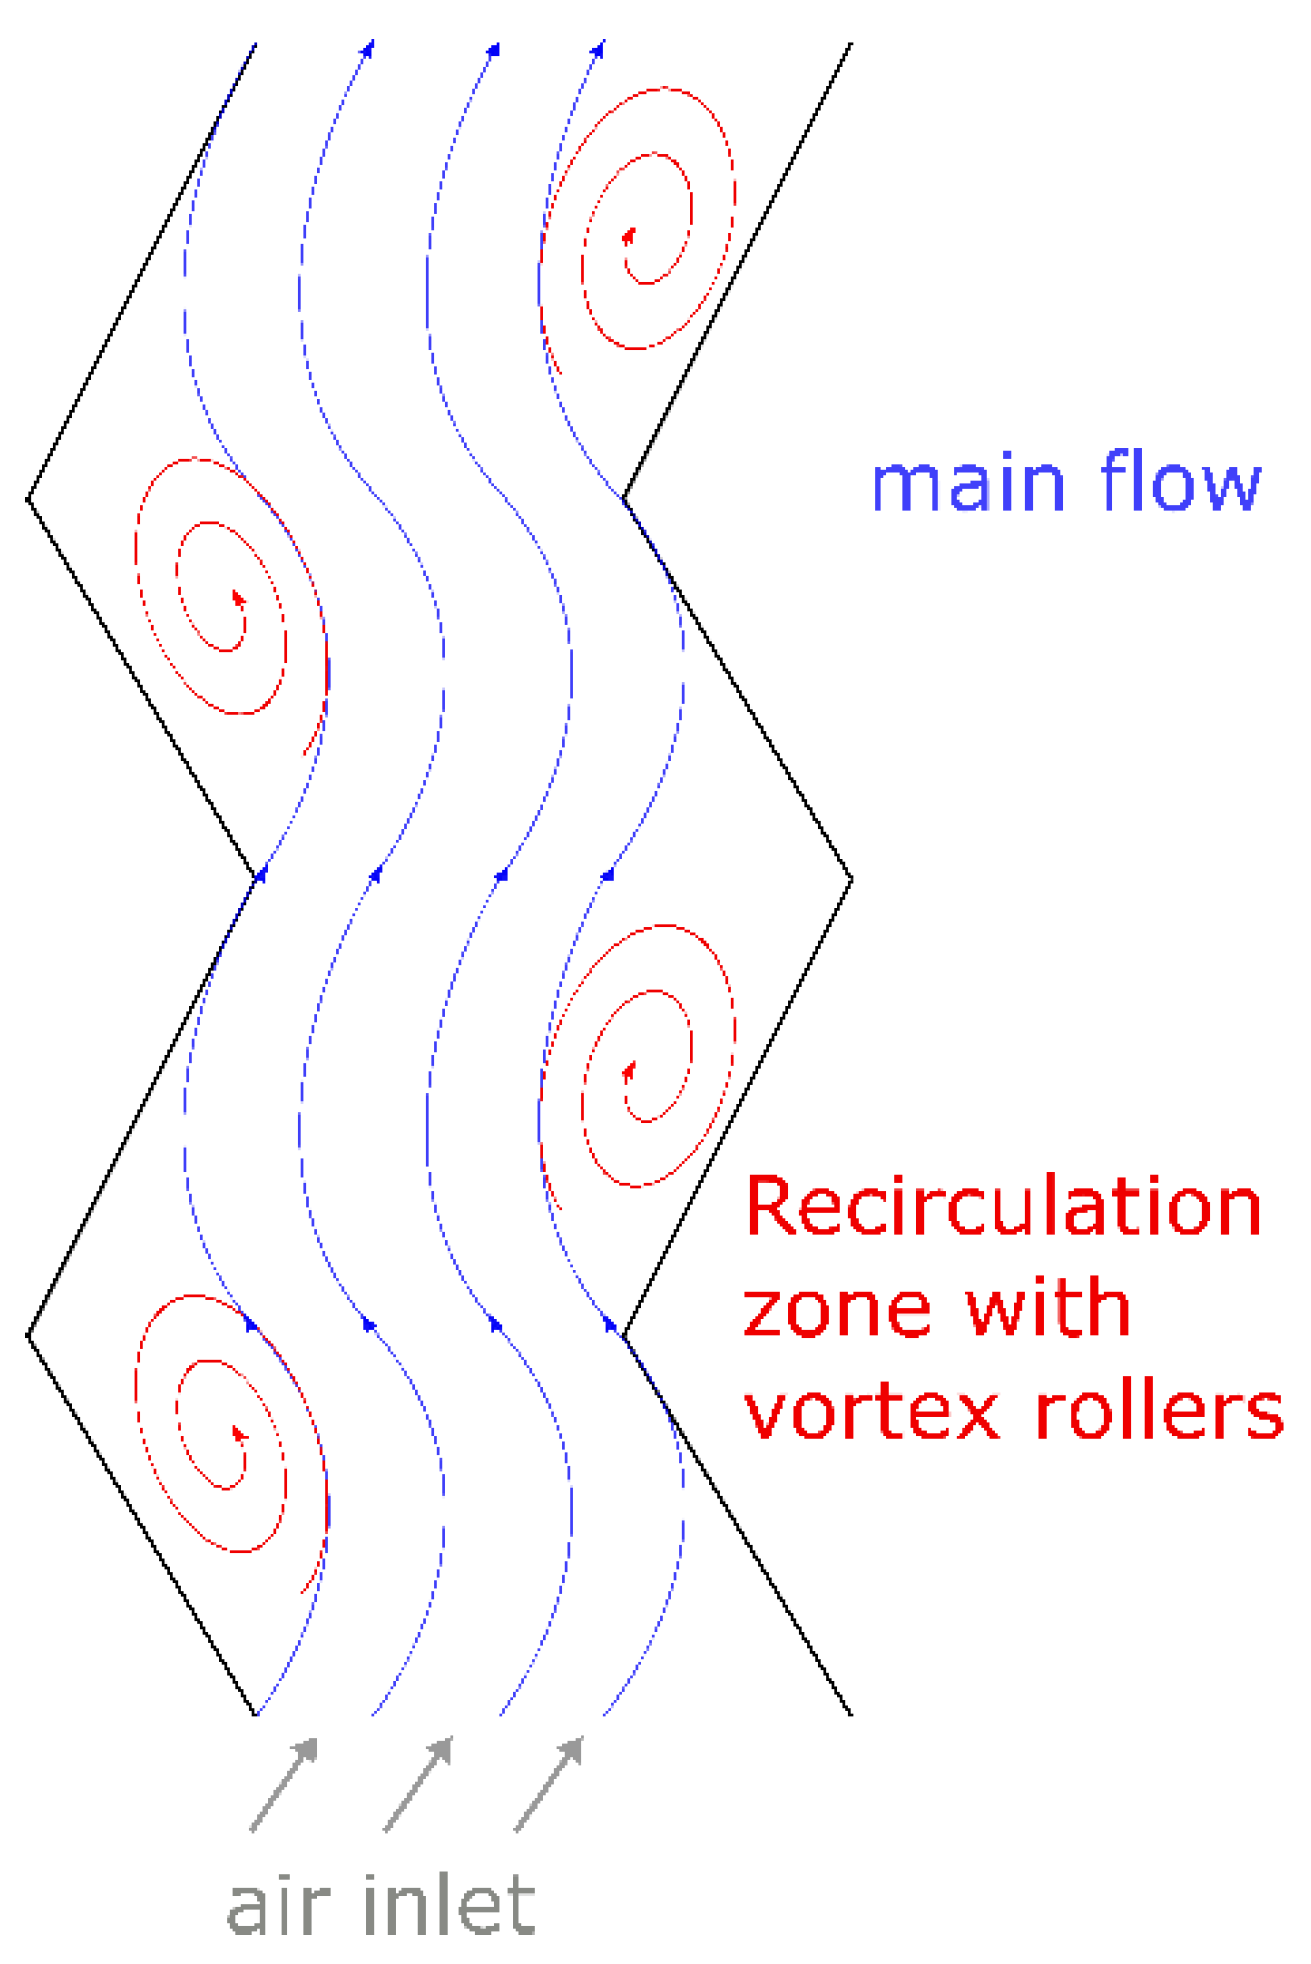
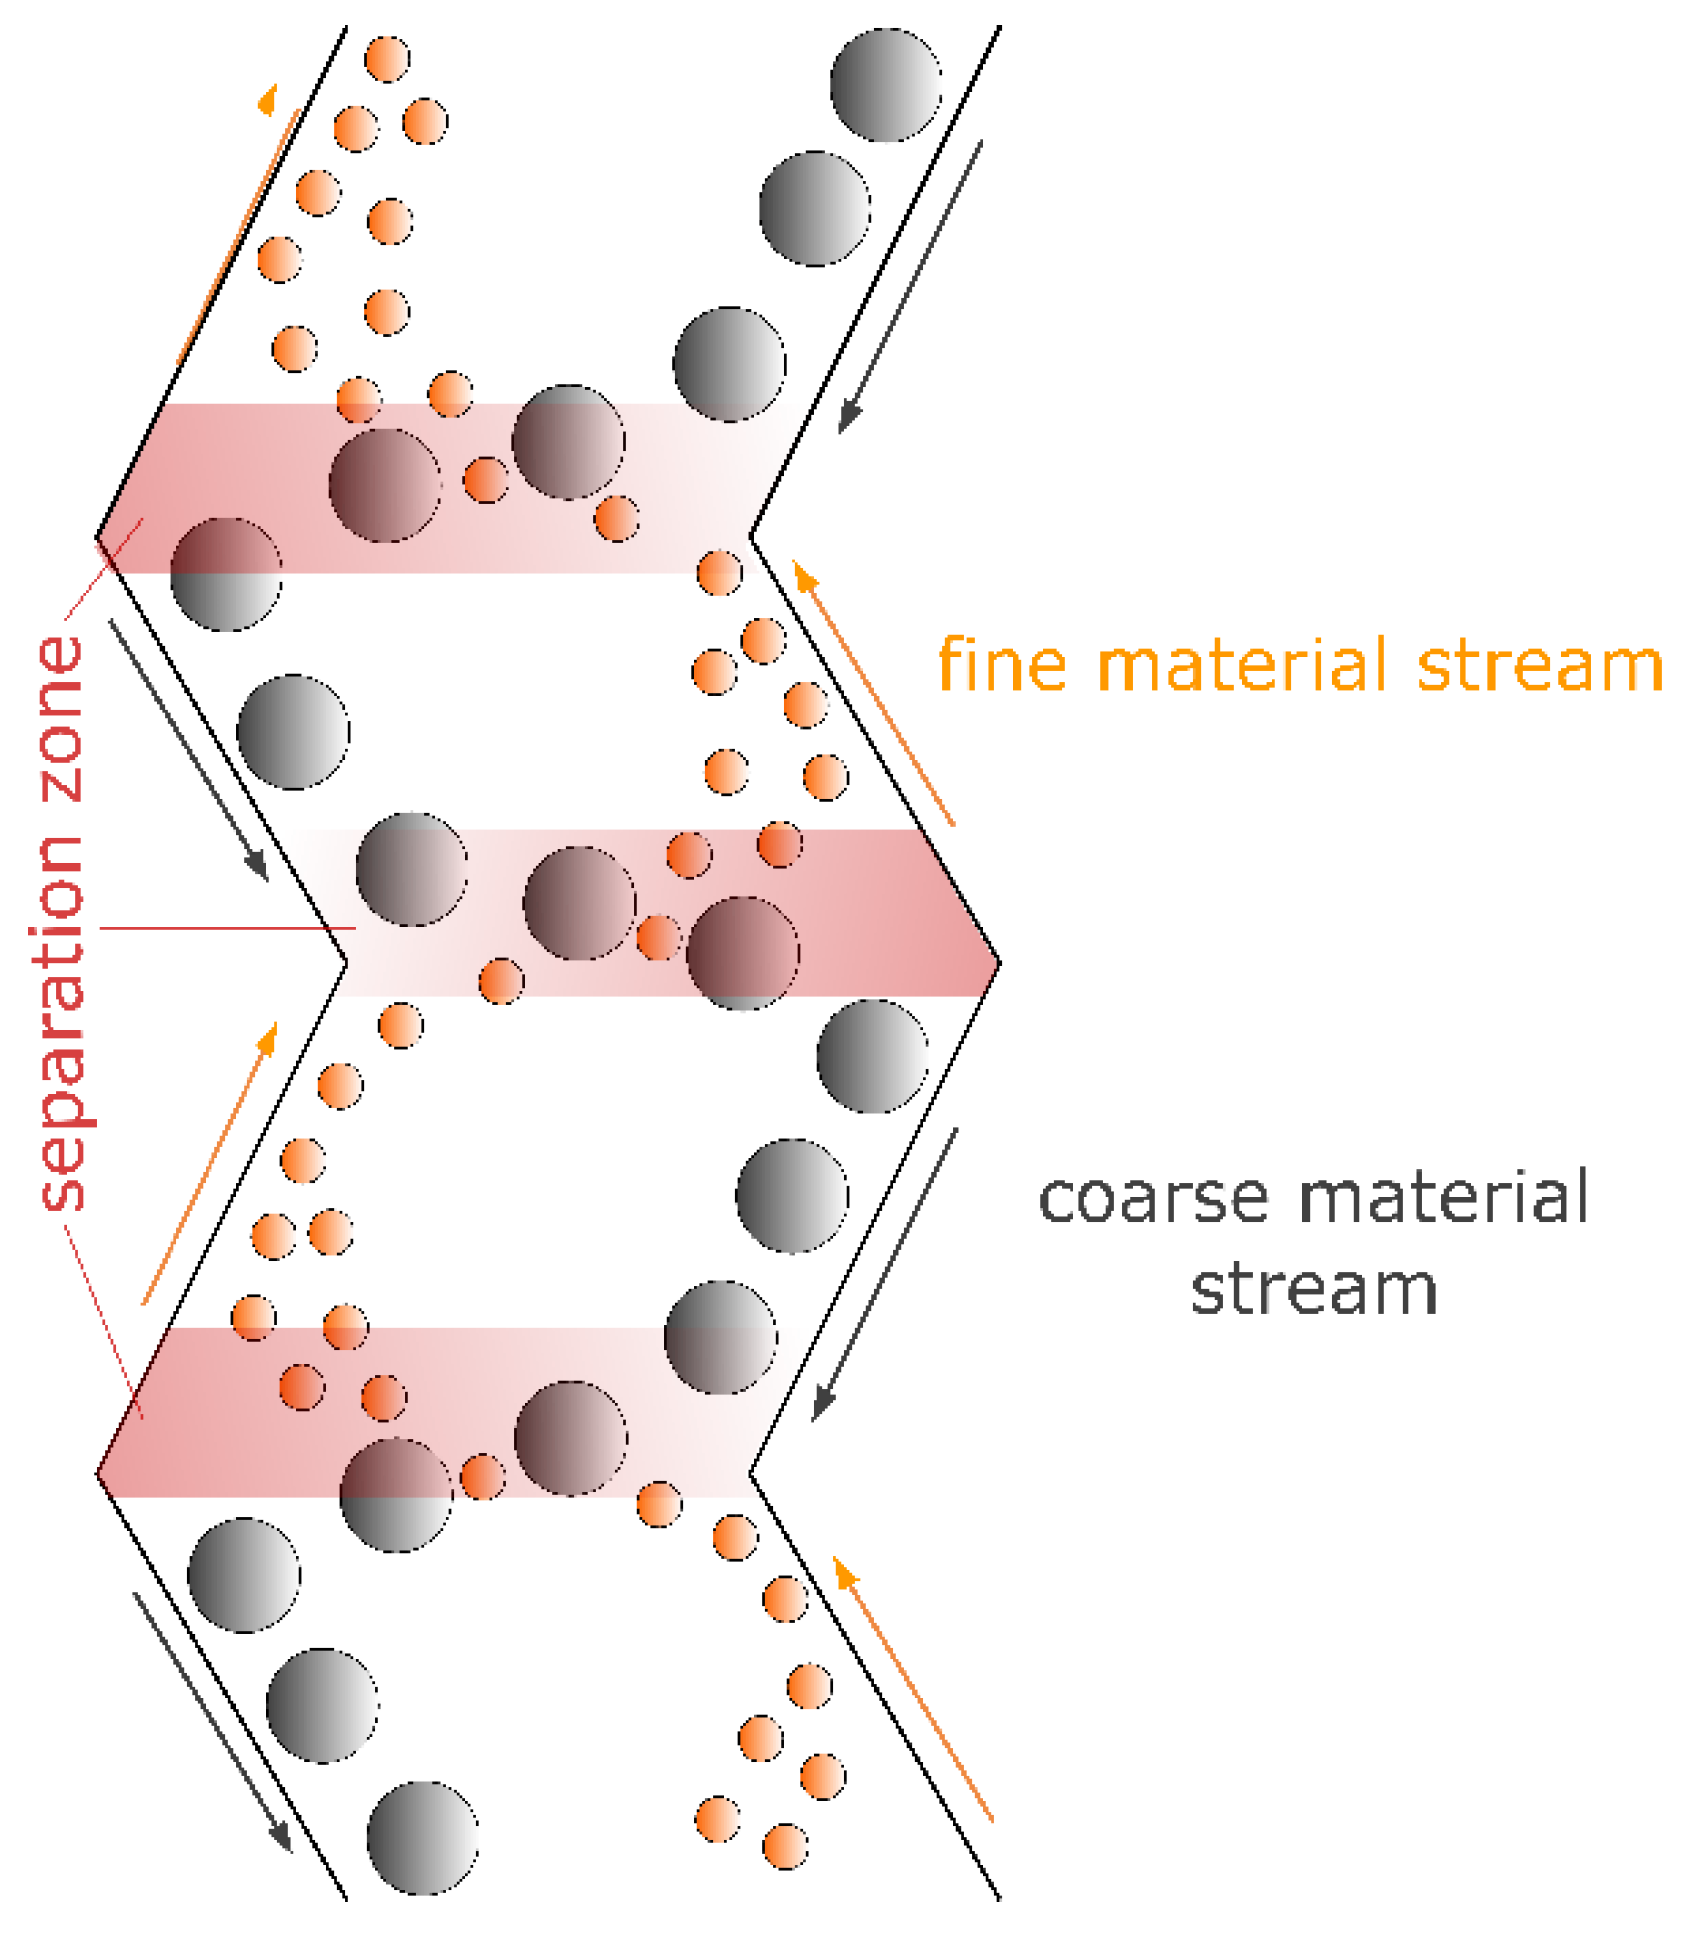
2.2. Mode of Operation

As shown in Figure 2, a mixed feed material is fed into the ZZ channel [30]. On the one hand, heavy, dense and/or compact particles will fall down the channel in the direction of the heavy product outlet. On the other one, fine, light and/or non-compact particles are carried upwards by the air flow in the direction of the light product outlet. Therefore regarding the product outlets, the classifier is considered a counter-flow classifier [31].
Due to the characteristic form of the ZZ channel, the particles oriented to heavy product outlet will hit the lower segment wall and either rebound and continue falling or start sliding down the wall. At the edge of each segment, those particle trajectories cross the fluid flow. Therefore, the ZZ classifiers are also referred to as cross-flow separators in the other literature At each edge of the ZZ classifier, the particles are fluidised on their way to one of the product outlets, where, the particles are fluidized again and separated according to their size, shape and density. This offers the distinct advantage over upstream classifiers with straight channel geometries since the ZZ channels aligns several separating units in series increasing the total separation efficiency of the apparatus [32].
Another feature of the ZZ geometry are the "vortex rolls" [33], which occur in the convex parts of the segments [30,34]. These vortex rolls (Figure 3) generate the so-called recirculation zones where the air flow detaches from the lower channel wall behind an edge [35]. As a result, the “main flow” (Figure 3) has the highest air velocities [36,37,38] and vortices form between the wall and main flow [31]. As described above, particulate material is not lifted in this recirculation zone by a directed air flow butcontinues to move downwards, e.g. by sliding down the lower wall due to gravity (Figure 4). Material close to the separation criteria (e.g. cut size) will be recirculated repeatedly in vortex roll the until it is randomly discharged in one of the products [31].
In addition to separation, the vortices can cause deagglomeration from being supported by wall friction and impact forces through the interaction of particles with the wall [41]. All those deagglomerating effects contribute to the comparatively high separation efficiency of ZZ classifiers [31]. In addition, the separation efficiency increases by increasing the number of stages, i.e., the number of fluidisation events in the apparatus.
An air cyclone has to be installed next to the ZZ channel in order to remove the light product from the air flow [28]. The cut sizes of ZZclassifiers amount to 0.1–10 mm [30,33] depending on the particle density and shape. The specific throughput is typically between 5 and 15 t/(m2 h) [36,37]. The throughput can be easily increased by operating several classifiers in parallel [42,43].
Moreover, there are other factors that influence the separation mechanism (cut size, selectivity) and thus the quality of the separation. Flow fields and therefore process performance in air classifiers are usually significantly influenced by secondary flows. These are caused by walls bounding the separation zone [31]. The secondary effects include particle rotation as well as oscillating of particles, especially for flat particles tumbling [39]. Besides, interactions of particles with each other or between particles and the wall influence the process, of which collisions, friction, sticking and vicinity effects are examples. But particle-airflow interactions also influence the process result [30]. For example, excessive loading of the gas flow can lead to swarm effects [14].
Over the years, different variations of the geometry were developed, which were supposed to circumvent the influences mentioned by the geometry in the best possible way. However, the variations shown below could only be used for special cases and are not state of the art today. The Duke and Utah channels (Figure 5) were developed and are mainly used in the USA [29]. The Utah throat attempts to increase the intensity of the eddies through its geometry and thus supports deagglomeration. The Duke throat attempts to solve the problem of reagglomeration that occurs with the conventional and Utah designs. This is achieved by providing a clear path for the rising material and a separate chute for the descending material. Furthermore, additional air supply stages as well as variants for the production of more than two products have been developed [30]. In addition, chutes with a circular cross-section are also possible, as are variations of the chute using flattened corners and baffles. Moreover, the design of the air inlet influences the flow regime at the bottom of the ZZ channel promoting back-mixing effects and thus reducing the separation efficiency [39]. The design of the air outlet at the upper part of the ZZ channel influences the particle removal rate due to exit effects of the air flow. When the channel narrows, the flow accelerates, resulting in a faster discharge of particles [39].

2.3. Advantages and Disadvantages of the Classifier Concept

The ZZ classifier is mainly used as a sorting but sometimes also as classifying device, mainly because of its simple design, low CAPEX and OPEX as well as good separation characteristics [28]. As already mentioned, the channel geometry offers a sufficient variability (e.g. channel depth or stage angle) to adapt the device to specific conditions or material properties [30]. Furthermore, the classifier offers a multi-stage separation in a single channel with one single air stream [39]. Due to the repetitive sorting of rising and descending particles, the particles undergo repetitive individual sorting stages [39]. This cascade of sorting zones results in the high separation efficiency of the classifier, which is κ = 0.59–0.8 [18,31,32,33,44]. In addition, it is possible to cover a wide range of cut sizes going from ten to microns and a broad range of particle density and shape for sorting [36].
However, disadvantages of the ZZ classifier are problems with inhomogeneous feed materials. Variations of size, shape, and density can cause segregation and funnel flow in the feed hopper [37,38] decreasing the separation efficiency due to fluctuating feed compositions. Unknown dynamics during the process can lead to insufficient reliability of ZZ operation [36,45]. In addition, particle interactions contribute to reduce the efficiency in separation [45]. Increasing the number of stages has a positive effect on the separation efficiency. However, it also increases the height of the apparatus as well as the pressure drop [14] and energy consumption [36,38,46]. High settling velocities of individual particles cause additional complications, as high air velocities are required for separation. These lie in the highly turbulent flow regime, whereby turbulent remixing negatively influences the sorting result [45].
According to Senden [39], a negative influence also arises from the geometry of the duct in general. The resulting turbulence leads to back-mixing in several parts of the apparatus and additionally to stochastic disturbances such as particle wall and particle particle interactions. Since there is no defined directional movement of the particles, it is difficult to predict the individual particle behaviour and thus the separation result only on the basis of the particle properties. In addition, the repeated crossing of air flow and uplifted particles with the trajectories of larger and/or heavier particles causes mixing and thus decreases the separation efficiency [14].

2.4. Fields of Application

The ZZ classifier is mainly used in the field of recycling of solid waste materials. This can be explained by the already mentioned high selectivity in a wide range of sizes and densities as well as the advantageous dispersion of material in the process chamber. A ZZ classifier is usually operated at feed rates of 5–15 t/m2h [44]. In addition, a solid to air ratio of up to 2 kg/m3 can still lead to stable separation at a separation efficiency of 0.8 [28]. Air velocity of 2 m/s is industrially considered the lower limit, industrially, whereas 1 m/s is the lower limit of laboratory applications [28].
The ZZ classifier can be used for classification (e.g. classification of choppy, fibrous and flat material) and sorting of primary and secondary raw materials [30], especially in the tobacco and tea industry, where the device is used to separate stalks and leaves [44]. In addition, vegetables are separated from grains, husks and shells or stones [44,47]. Furthermore the ZZ classifier is applied during the processing of spices and herbs as well as in the textile industry for the separation of fibres and finished textiles [42].
Another major field of application is the processing of municipal and industrial solid waste [22,39,48,49,50,51,52]. Here, ZZ classifiers have been established for composting plants and separating foils [53] and harder materials such as glass, stones, and metal pieces from compostable material [17,54]. In the recycling of building materials, impurities such as paper, plastics, foils and wood chips [15,16,55] are separated from mineral constituents. Also, the recycling and purification of thermal insulation systems (mainly polystyrene) [56] and thermoset composites is a common application [57].
Another field of application is the processing of electronic scrap [17,58]. For example, copper wires are separated from the insulation in cable recycling [35,42,44,58]. Plastics, wood, fibres, glass, and rubber [35,58] are separated from metal scrap (e.g. in recycling of fridges). And in the recycling of printed circuit boards, fine metallic and non-metallic particles are separated [59,60,61,62]. The ZZ classifier is also used in car recycling producing the so-called shredder light fraction [58,63,64], which is a mixture of chopped light polymeric materials.
In general, in plastics recycling, metal is sorted from plastics and different types of plastics can be separated. The ZZ is also used for the recycling of PET bottles [65], or bottle capsules [13], as well as for dedusting plastic granulate [44]. Although more than 100 years old, latest studies show that the ZZ classifier is still up to date and will be a solid pillar for future recycling topics, e.g. the recycling of electric vehicles components. One example in this field is the recycling of lithium-ion batteries [66,67]. Here, the ZZ was already used in several pilot studies for the separation of current collector foils from cell housing and separator foils [68,69,70].

3. Research to Date

The following chapter shows the existing research on the ZZ air classifier. This is categorized into experimental studies on one side and evaluation of models of the separation behavior of the air classifier on the other side.

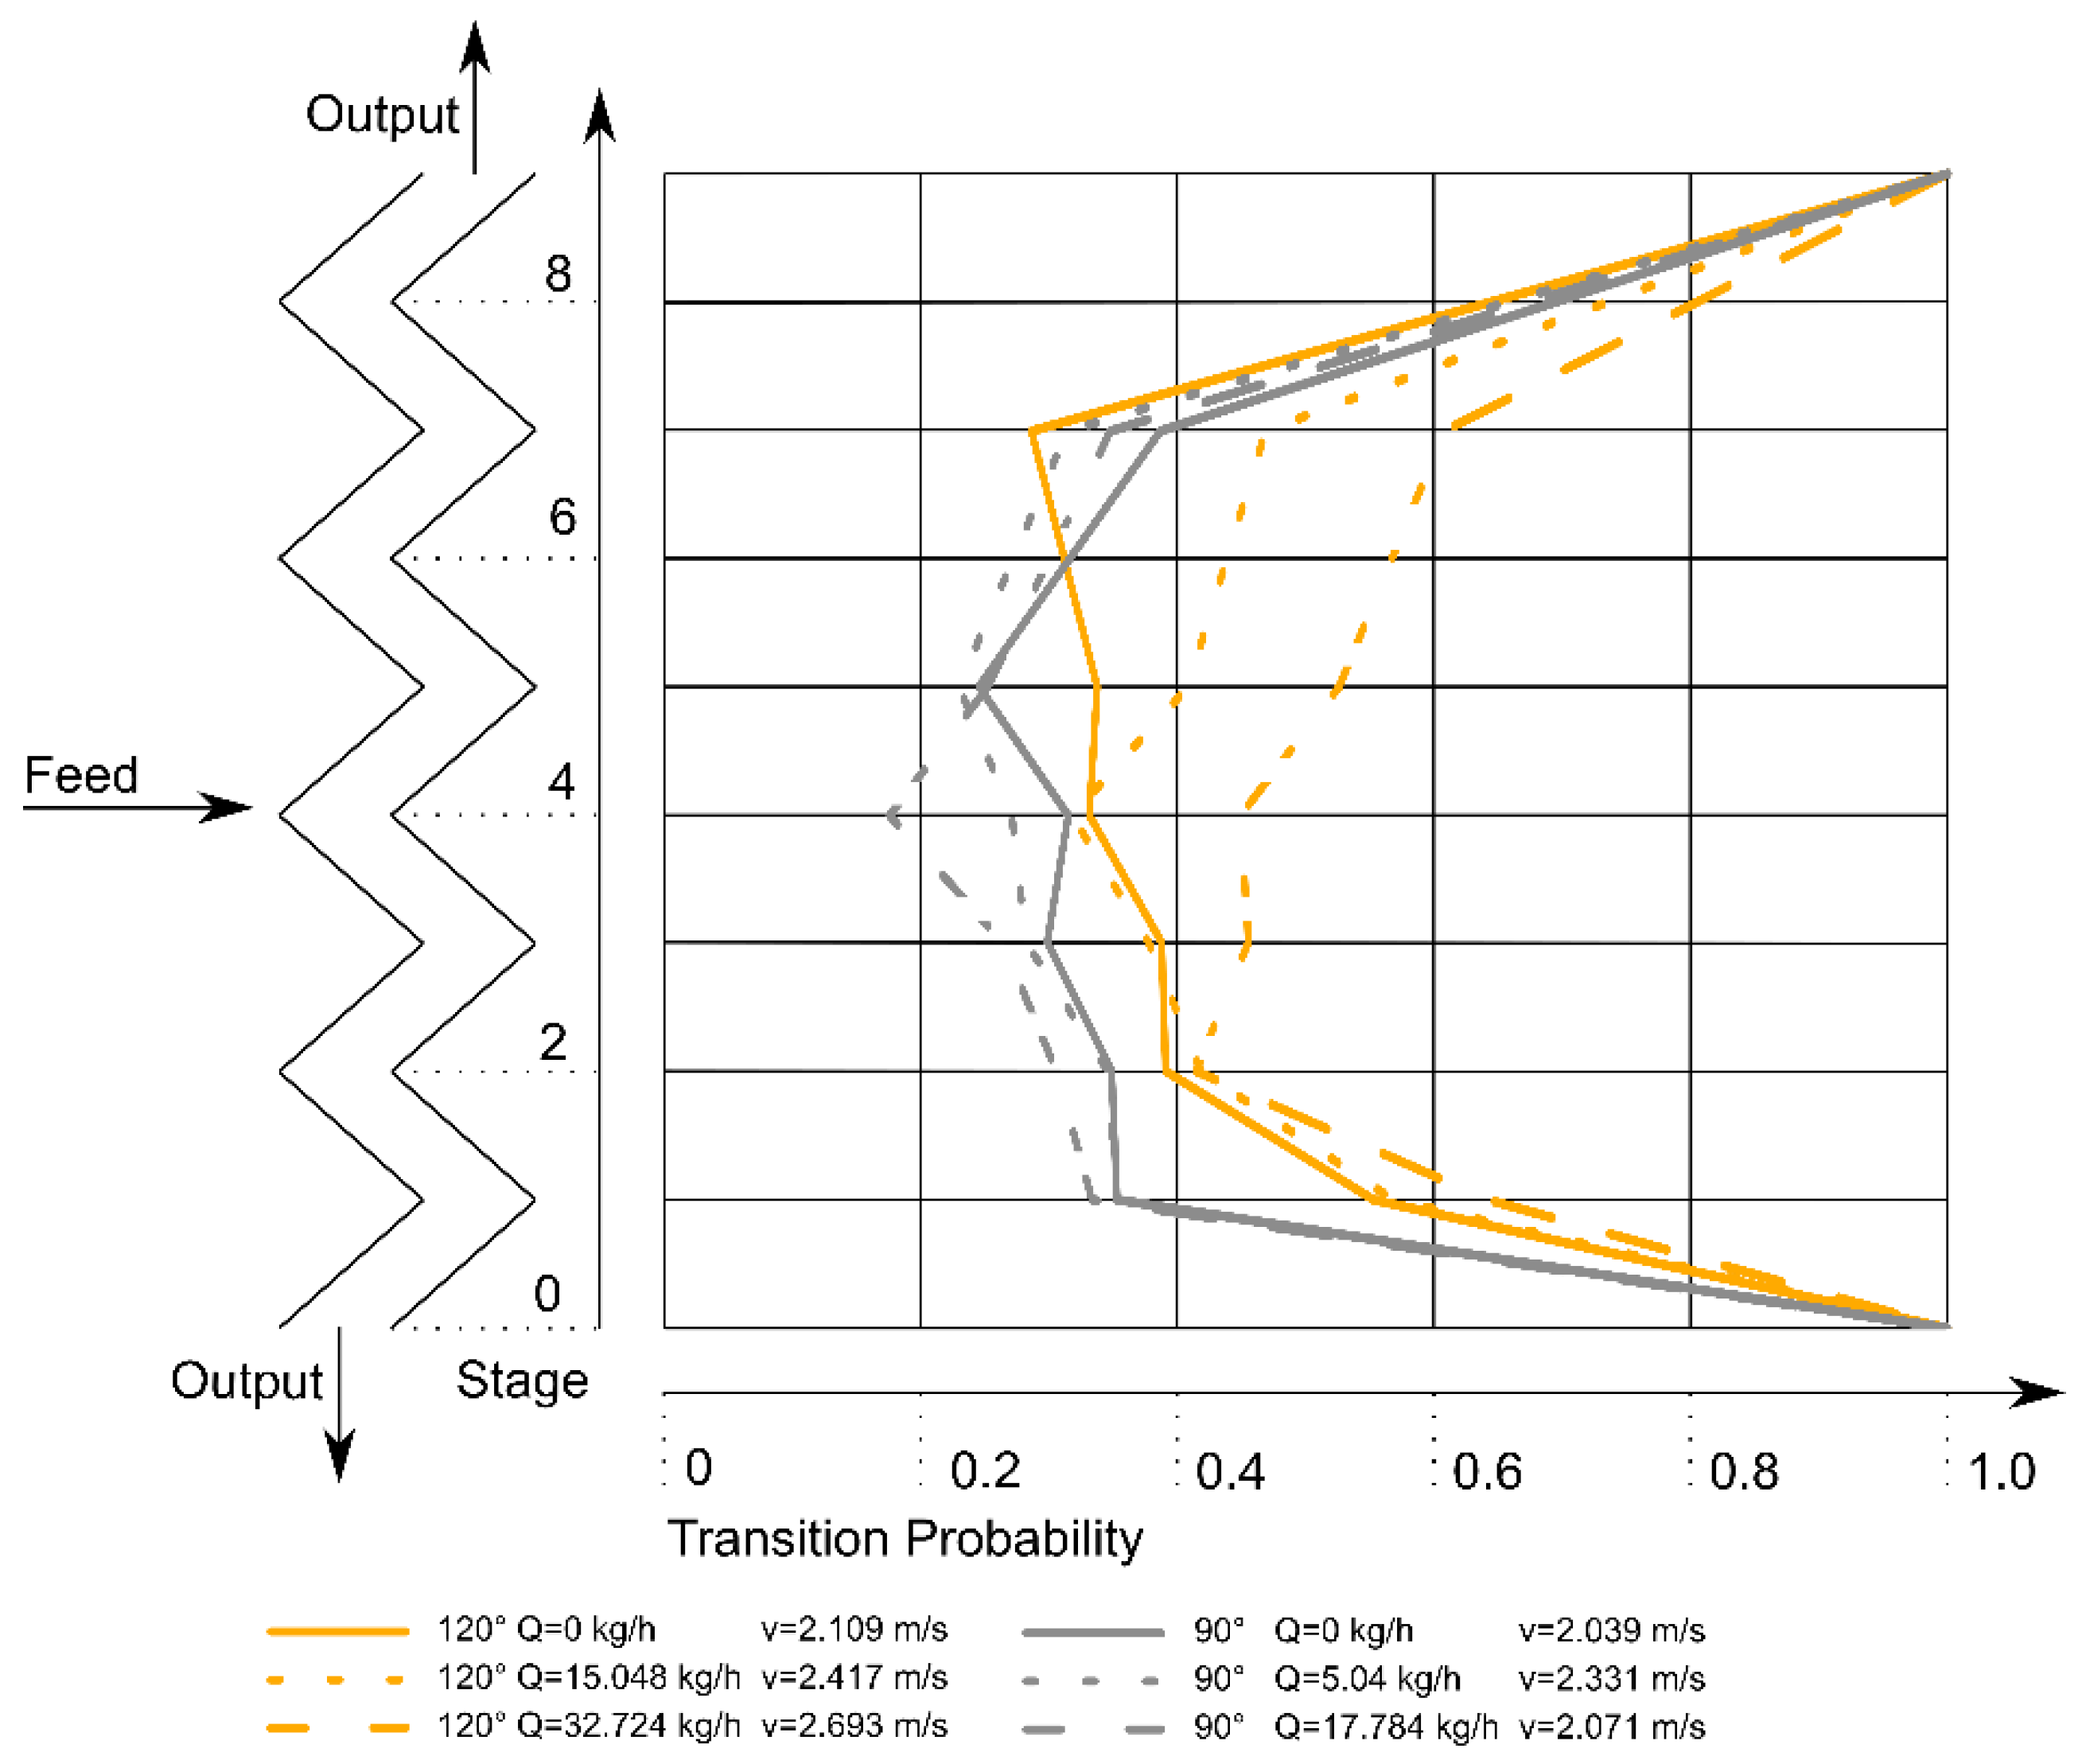
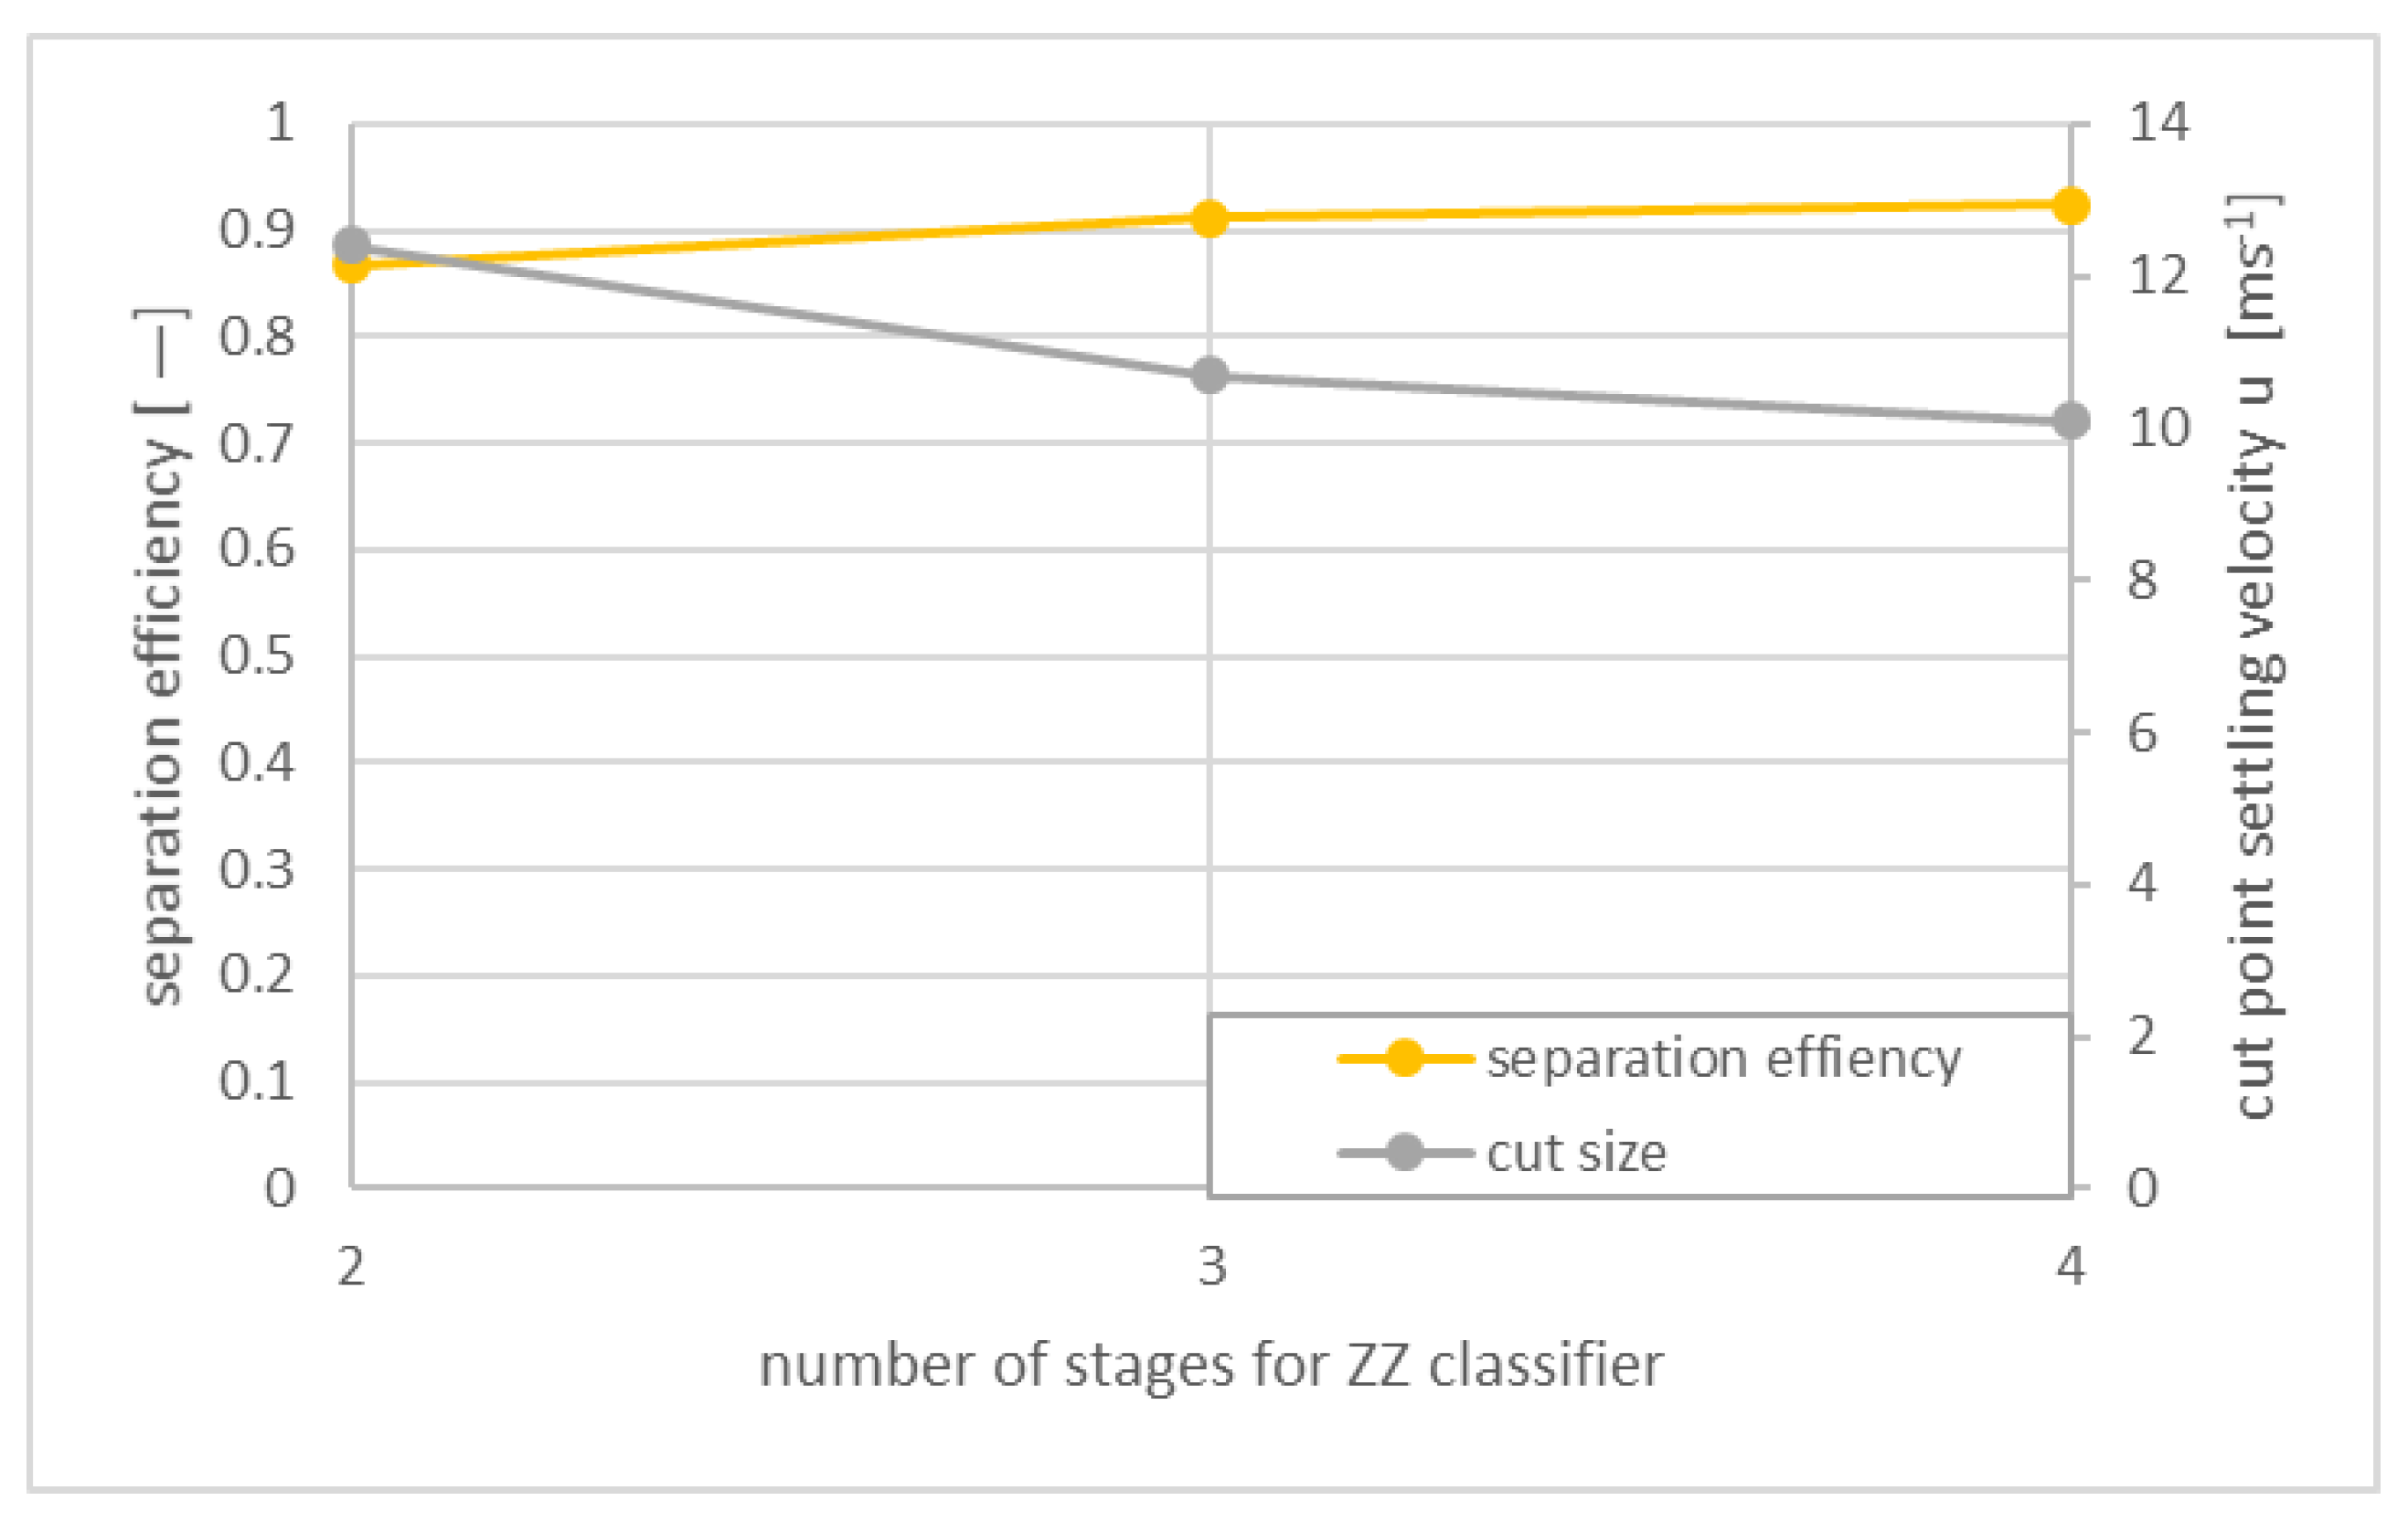
3.1. Experimental Studies

Table 1 gives an overview of the materials in the experimental investigation.
The first experimental and mathematical investigations of the ZZ classifier were published by Kaiser [30] in 1963. He dealt with the flow regimes in the channel and the influences on the separation process. Through his investigation, he found that the ZZ classifier does not only separate according to the sinking velocity, butthat the separation is influenced by the impact and sliding behaviour of the grain due to shape, elasticity and coefficient of friction. Moreover, he stated out that the separation limit is independent from the feed load.
Fastov et al. [34] investigated the separation of ground red bricks, which simulate an easy flowing material, and chalk (simulating a loose material tending to agglomerate). The stage angle was varied at 90, 120 and 150°, respectively, along with different ratios of stage height (H) to channel width (b) (90/90, 90/60, 90/45). The tests showed that only an angle of 90° is of interest, although no reasons are given for this hypothesis. The experiments showed that the separation limit depends on feed load. These results are contrary to those of Kaiser. An optimum for the brick powder was found at 90° and H/b 90/60 and for chalk at 90° and H/b 90/90, respectively.. However, no explanation is given as to why this is the best configuration.
The most extensive study on step geometry until now was written by Senden [39]. Unfortunately, the study is limited to low particle concentration. In this work, the step angle was varied in the steps 90, 120 and 150°, respectively, and the channel depth d was between 51.8 and 141.4 mm. In addition, changes were made to the feed position in segments 1, 3, 5, or 7 (counting from bottom to top), respectively. The test material was chequered paper of different lengths and thicknesses as well as polystyrene balls with a diameter of 4.5 mm. The air velocity was varied between 0.6 and 3.9 m/s.
The aim of Senden’s investigation was to evaluate the performance of the individual stages and to evaluate the particle movement in the stages, as the basis of a stochastic model. For this purpose, single particle experiments were carried out examining repeatedly whether a particle was discharged into the light or heavy product. The investigations on residence time for paper particles resulted in a range of 6.5–55 s. The shortest time was measured at 90°, at a channel depth of 20.3 mm, and an air velocity of 1.04 m/s, whereas the longest one was at 150°, 51 mm and 1.42 m/s, respectively. The best combination in terms of separation performance (residence time, separation efficiency) and throughput for municipal solid waste (MSW) was found at 120° and a segment length to depth ratio of 2.
Longer residence times of up to 30 s were measured at 90°, which can be explained by the higher number of transitions between ascending and descending particles. At 90° the descending particles are accelerated perpendicularly to the opposite wall. They hit the wall, bounce back and have to reaccelerate. This effect slows down the transport of particles. Therefore, Senden preferred a stage angle of 120° in terms of separation efficiency and throughput. In general, the experiments show a trend that reducing channel depth increases the separation efficiency. Even though a stage angle of 150° showed the best classifier performance, Senden excludes these experiments with regard to the variations of a ZZ classifier. With 150°, the particle motion strongly derivates from the counter current flow behaviour. Despite the extensive experiments, the investigations must be viewed critically with regard to the interaction of the particles, since only low concentrations prevail. Due to this, Rosenbrandt extended Senden’s investigations.
Rosenbrandt [71] attempted to close the gap with the investigations on higher mass flows of up to 62.3 kg/h, i.e., 2.21 t/h m2. He used the same samples as Senden [39], examined stage angles of 90 and 120°, respectively, as well as different channel depths at higher particle concentrations in order to examine the interactions of the particles with each other and the wall. At a higher particle concentration, the separation efficiency is nearly constant. However, due throughputs are higher at 120° than at 90°, respectively. In addition, the recovery of mass of the heavy product decreases with an increasing feed rate at 90° but stays constant/increases for 120°. The author explains this with the deceleration of particles as described by Senden. At a stage angle of 120°, the opposite phenomenon occurs due to the formation of agglomerates. Furthermore, Rosenbrandt is also the first author to describe that the separation efficiency decreases and the capacity increases when the channel is enlarged and the feed inlet is placed closer to one of the outlets.
Worell et al. [72] studied the separation of lightweight materials (paper and plastics) from metals (aluminium and steel), simulating municipal waste. The authors introduced a concept that is intended to serve as the evaluation of density separation performance. A 100 % efficiency is only given if 100 % of the lightweight material reaches the upper product discharge and 100 % of the heavy material reaches the lower product discharge. With the help of this evaluation method, the results of different channel variations (zigzag, Utah and Duke throat) were evaluated.
Vesilind et al. [52] studied the effect of feed rate on the classifier performance. They used a 50 % mixture of square plastic or aluminium foils at feed rates from 3.9–59.0 kg/h and a stage angle of 120°. As the feed rate increases, the residence time and separation efficiency decrease. The maximum residence time of 130 s is measured at a feed rate of 3.9 kg/h i.e., 0.13 t/h m2 decreasing constantly down to 95 s. According to this, even low concentrations influence the movement of particles and thus the classifier performance. In addition, the investigation showed that maximum particle concentration occurs directly below the feeder and decreases at both exits of the classifier.
Connor et al. [73] investigated stage angles between 105–135° to define an optimal stage angle and to assess the influence of particle size and shape. Test materials were polystyrene particles of different shapes. In accordance to Worell et al. [72], the best product purity was achieved at an angle of 110° for all sizes and shapes of feed particles.
Stage angle, stage height, and feed rate were further investigations by Peirce et al. [53]. Stage angles of 120–180° and stage heights of 10.2–30.6 cm were investigated, whereby the column length and width were held constant. The focus was on single particle experiments with polystyrene balls with a diameter of 2 and 3.6 cm using the Worell et al. [72] procedure. No significant correlations between separation efficiency and stage angle or wall length were found. While the separation of small particles (diameter: 1.8 cm) could be efficiently influenced by chances of the air velocity, larger particles (3.6 cm) did not show the same effect.
Biddulph et al. [74] introduced a new test procedure to compare a conventional ZZ channels and straight channels in theory and experiment. They separated a binary mixture of polystyrene and polypropylene in a 9- and 5-staged ZZ classifier with a step angle of 115° (depth: 190 mm; width: 30 mm). They applied the diffusion convection model for air classifiers with air or water as fluid [45,80].To evaluate the performance of the classifiers, the authors developed a simple method based on the effective diffusivity: the smaller the diffusivity, the better the separation efficiency. However, both ZZ configurations show comparable diffusion coefficients despite different lengths. Based on the test results, the authors concluded that the channel geometry of ZZ reduces the “wall flow” effect compared to straight channels.
Peirce et al. [51] studied different channel geometries (Figure 6) and operation modes of ZZ at different feed rates and channel heights. They compared zigzag, straight, and stepped triangle shapes as well as pulsed, non-pulsed, and passively-pulsed classifiers. The test material was MSW. Regardless of whether zigzag or stacked triangle as well as short or tall sifters were used, higher feed rates resulted in lower separation efficiency, as already noted by Kaiser [30] and Senden [39].
The research group of Tomas [16,55,75,76,77,78] was concerned with the first attempts to separate building waste. They varied air flow rate, absolute pressure drop within the zigzag channel, and relative pressure drop compared to the subsequent filter and measured temperature and relative humidity at significant points. A ZZ classifier with 20 stages was used, which proved to be suitable for separating building waste such as concrete brick mixtures. A maximum separation efficiency of κ = 0.86 was achieved.
Mann et al. [43] investigated the influence of velocities and air load on the separation of sand and gravel. They tested 12 combinations of solid to mass ratios and channel velocity. In addition, the authors found that increasing channel velocity increases the cut size, which is obvious, and decreases the product quality. The ratio of segment height to channel width especially influenced the channel velocity and thus the vortex rollers. The authors recommended to focus further investigations on experiments in conjunction with numerical process simulations in order to obtain a better understanding of the process.
Finally, Schwechten investigated new geometries of the ZZ and patented a hybrid air classifier (Figure 6) [28,79]. In contrast to most screening machines and conventional ZZ classifiers, this classifier enabled cut sizes of down to 100–200 µm, due to a new channel geometry. Here, the channel sides are inclined 30° below the vertical, resulting in overlapping sight edges (L < 0). This avoids the formation of material strands and enables the classification of fines. Despite these changes, the advantages of the conventional ZZ classifier (throughput, air load, separation efficiency, pressure drop, operation costs) were retained.
To summarize, the experimental studies show that the channel shape of the classical ZZ (Figure 6) is the best shape for separation for cut sizes larger than 200 µm. Furthermore, a step angle of 120° is best suited for the separation of materials in the majority of studies. It is also shown that the feed rate is indirectly proportional to the separation efficiency.

3.2. Modelling Approaches

The models shown below in detail are briefly summarized in Table 2 according to their authors and type.
Kaiser [30] published an analytical model which is easy to handle but over-simplified the process and therefore it has only limited significance.
Senden’s model [39] is based on experimentally-determined ascent and descent probabilities, as well as movement patterns of single particles (Table 3). Its stochastic calculations use Markov chains to indicate the probabilities for separation into the light or heavy product in an individual segment. Markov chains are defined by the fact that a comprehensive knowledge of previous events is not necessary [86]. Their forecast of future events is just as good as with knowledge of the entire history of the process. Therefore, the model for one channel segment does not consider the separation in adjacent segments, i.e., whether the particle has entered from above or below. Senden’s model is the only model that allows statements about the influence of stage angle. Nevertheless, it is limited since it does not consider any backmixing or particle interactions.
Table 3. Models of Senden [39], Rosenbrandt [71] and Tomas et al. [55,75,76,77,78].
SendenRosenbrandtTomas and Gröger
T = 1 1 + m = 1 V 1 i = 1 m ( 1 p i p i ) 1 + m = 1 R 1 i = 1 m ( 1 p i p i ) T = F f , 0 Q V T = 1 1 + ( ( V ˙ L V ˙ S ) ( 1 d d T ) ) z
T


V

R

p i
Separation function
Location of feed stage
Number of stages
particle rising probability at stage i (Figure 7)
T


F f , 0
(further calculation needed)
Q V
Separation function
flow rate of falling particles at stage 0
particle feed rate
T


V ˙ L

V ˙ H


d d T z
Separation function
flow rate of light material flow rate of heavy material
particle size
cut size
half number of stages
Figure 7. Transition probability of a particle in stages of the ZZ classifier. Data deriving from [71].
Processes 10 00764 g007
Rosenbrandt [71] extended Senden’s model to higher particle concentrations using a modified “one step memory” model (Table 3), which enables to evaluation of the effect of the number of segments, position of feeder, and residence times for a defined step angle. Furthermore, the transition probabilities and partition curves can be determined. The transition probability is the probability that a particle moves from one stage to the next higher or next lower stage with a single transition. As shown in Figure 7 the model revealed that the probability of a particle to ascent or descent differs in all stages.
Tomas and Gröger [55,75,76,77,78] developed a semi-empirical model which is an extension of the “suspension tapping” hydro classification model by Schubert and Neeße [84] and Schubert et al. [85]. The model (Table 3) describes the separation performance based on a multi-segment approach which uses single-segment grade efficiencies. Like Kaiser’s model [30], this one is easy to handle and limited in its predictions since the complexity of the setup is simplified by only few parameters like number of stages and flow rates. In addition, the application limitations of the model, which is e.g. given by a certain Bodenstein number, are insufficiently propagated and need to be expanded [40].
Gillandt et al. [81] investigated the fluid flow without particles in the ZZ channel with laser Doppler anemometry and compared this to a 2D CFD simulation. Smoke particles traced the main air flow as well as the recirculation zones. The authors tested three turbulence models (Standard-k-ε-, ReNormalisation Group (RNG) -k- ε-, Reynolds-stress-model) all based on a Reynolds-Averaged-Navier-Stokes (RANS) simulation. They favoured the Re Normalisation Group (RNG) -k-epsilon model since it was suitable for low concentrations and for calculating particle trajectories. Using glass beads in a range from 0.1–1 mm the separation behaviour was analysed. However, the simulated cut size was significantly larger and the separation efficiency overestimated in comparison to the experiments. The authors explained this with the insufficient wall impact model and lack of attention to interactions between particles. Based on these investigations, He et al. [87] carried out further single-phase simulations in ZZ without particles. He et al. [88] also investigated mixed waste material phase simulations, which were limited to separation in air classifiers with straight channel geometries.
Otto et al. [89] used a hybrid model to describe separation. He combined the PSM (pipe separation model) of Schubert et al. [90] with an artificial neural network, whereby the network was trained to predict parameters of the PSM for the separation including different temperature and humidity. However, the problem is the comprehensibility of the results, as neither experimental setup, separation results nor qualitative assessment of the prediction quality are shown in detail.
Glöckner et al. [38] investigated the classification of sand in a ZZ with a 120° step angle. In the first tests, Tomas’ model [55,75,76,77,78] showed good agreement with the experimental data. However, the process optimum was hard to determine, since the optimum depends on the process target and for the authors these are both dispersion and selectivity. Therefore, further investigations with CFD modelling have been recommended which were done by Hagemeier et al. [37,82]. Hagemeier et al. used a 3D RANS approach. Three different turbulence models (realizable-k- ε, SST k-ω, and the Reynolds-stress-model) were compared according to pressure loss, cut size and separation efficiency. Unfortunately, all simulations overestimate the investigated parameters. Therefore, the authors did recommend not to simulate the ZZ classifier by these approaches but to use a two-way-coupled DEM-CFD-simulation instead.
Friedrich et al. [83] investigated the classification of glass beads in a size range of 0.8–5mm using a 10-staged ZZ classifier with a stage angle of 120°. The simulation used a one way coupled CFD-DEM comparing different RANS-turbulence models (standard k-ε, RNG-k-ε, realisable-k-ε, standard k-ω, menter-SST-k-ω model). It was shown that the simulated volumetric flux differs less than 10 % from experimental data for the realisable k-ε. However, the simulations showed again a higher separation efficiency than the experiments and the partition curves differed significantly. The authors explain these differences by the neglect of dynamic effects like pulsation of ventilator or the neglects of interactions of particles. The best result gave the realisable k-ε turbulence model, as the cut sizes agreed well.
Mann [40] divided the process into several sub-processes and linked them in Matlab. This enabled him to quantitatively describe the particle behaviour such as the reversal of the particle movement direction below. Mann describes the macroscopic distribution of the particles in the channel, including their residence-time behaviour. This revealed that ZZ classifiers reach a global stationary state after a few seconds. However, a much longer period of time is required before relevant process variables such as cut size, separation efficiency and product purity reach steady state. Mann thus points out a decisive limit of the process model of Tomas and Gröger.
Roloff et al. [91] investigated the particle dynamics in a ZZ classifier using multi-camera shadow imaging at several locations. The experimental materials were glass spheres of 1–4 mm of six different size classes used at variable loads and flow rates. Their four cameras allowed simultaneous imaging of particle populations at four zigzag positions. This novel technique served as a basis to validate multiphase CFD-DEM models or to develop dynamic process models. It was found that the turbulence of air affects particle tracks; the more pronounced the more upstream the stages are located. The results depended also on the particle diameter. The variations of the particle trajectories within the classifier decrease with decreasing particle diameter, because the smaller particles tend to follow the fluid movement and thus travel more directionally than coarse particles. And an increase of air velocity or solid load, i.e., mass flow caused an increased collision rate between the particles.
Bartscher [29] simulated two stages of the ZZ classifier. He compared a 3D finite volume method with the measurements from the particle-tracking, laser Doppler velocimetry. Compared to 2D simulations, this three-dimensional approach allows the study of the shape of the vortex structures in the corners as well as in the edges. The simulation showed that the description and the assumptions for particle transport of heavy particles in the recirculation zones and light particles in the main air flow are highly simplified. Both upward and downward transport take place over most of the channel width, and only small areas can be assigned exclusively to upward and downward transport. In addition, light particles are transported faster than heavy ones. According to the settling velocities of the particles, a transport into the direction of the wrong product outlet occurs due to reduced particle velocities. This slow movement can be occurring in recirculation zones, which extend far into the inner section of the channel.
Bartscher concluded that there is no optimal global stage geometry, but only an optimum relating to specific processing goals. The trend shows that a shift from the cut size to larger particle size is accompanied by a decrease in separation efficiency. In addition, small channel widths and large segment heights homogenise the fluid flow. The greatest separation efficiencies at large stage angles, which are similar to upflow classifiers, are only suitable for well-dispersed goods, as already noted by Senden [39].
Another modelling was carried out by Lukas et al. [36]. The authors use Schubert’s pipe separator model (PSM) [84,85], a solution of the Fokker-Planck equation) for the classification of glass beads in the range of 0–5 mm in two-, three- and four-stage ZZ classifiers. The PSM fits for three- and four-stage ZZ classifiers, but not for two-stage ZZ classifiers. The difference is caused by the particle trajectories assumed, which represent only convective and diffusive transport with constant properties along the entire length of the ZZ channel. In the short overflow distance of a two-stage ZZ classifier, local effects such as wall particle interactions cannot be compensated for, although they are present in all examined geometric configurations. However, the differences in the 2-stage configuration are small, butthe model fits perfectly for the three- and four-stage channels. Furthermore, the experiments and the modelling of these again show that a sharper separation (up to 0.92) and smaller cut size can be achieved with a higher number of steps (Figure 8). The adapted PSM revealed also that the solid’s flow directed upwards is a function of particle load and air velocity.
Lukas et al. [36] combined theoretical developments [40], systematic experiments of particle laden turbulent airflow, and numerical simulations (CFD) [43,91,92]. The aim was to develop a reduced model to be integrated into the DYSSOL programme for simulation [36]. After model fitting, there was good agreement between experiment and model. Nevertheless, further investigations were needed for final predictive numerical studies.
To summarize the model evaluation, the separation behavior can be described in principle. However, there is no model that includes the particle properties like particle interaction in addition to the classifier design. When choosing a model, a decision must currently be made between good manageability (Tomas and Gröger [55,75,76,77,78]) and accuracy (Bartscher [29]). Lukas et al. [36] show first approaches to combine these two by integrating the model into DYSSOL.

4. Conclusions and Outlook

For more than 100 years, the ZZ classifier has proven its value and been used in various applications. The apparatus is suitable for both classification and separation having its main field of application in the recycling of solid wastes. The research focused initially on experimental studies to understand the influence of different materials, channel geometries, and process parameters on the separation result. In addition, new channel geometries were developed and evaluated. However, the process characteristics depend strongly on the aforementioned factors so that an accurate layout of a ZZ classifiers has to rely still on preliminary experimental campaigns.
In order to gain a better understanding of the separation, more attention was later paid to particle movement and particle fluid interaction. With the help of stochastic modelling, attempts were made early to predict the separation result. As to be expected, the models differed both in type, boundary conditions, and objectives. These differences limit the general applicability of the respective models. In general, a direct comparison of the models is usually not possible, as the evaluation methods and measured parameters differ and decisive variables such as size, shape and density of the feed particles are not or only insufficiently specified.
First attempts try to close this gap by providing a general model that determines the separation efficiency and cut size depending on channel geometry, feed material and process parameters. However, this model is still not found and needs to be developed in the coming years. In particular, further attention has to be paid to particle properties (e.g. size, density and shape) and particle interactions (particle particle, particle wall) in order to simulate the particle behaviour more accurately in the classifier channel. This is essential, especially with regard to the separation of secondary raw materials, which have a mostly non-cubical shape and consist of heterogeneous mixtures. In the future, simulations will not be limited by the computing capacity anymore which will allow e.g. DEM CFD coupled evaluation. Finally, it will also be important to develop further adequate online measurement technology to record the particle movements and particle properties in the process chamber, to link this information to numerical simulation.

Author Contributions

Conceptualization, A.K. and T.M.; writing—original draft preparation, A.K.; writing—review and editing, T.M., U.A.P. and A.K.; visualization, A.K.; supervision, T.M., U.A.P.; project administration, A.K. and U.A.P.; funding acquisition, U.A.P. All authors have read and agreed to the published version of the manuscript.

Funding

The research was funded by the German Federal Ministry of Education and Research under the grant number 03XP0337.

Institutional Review Board Statement

Not applicable.

Informed Consent Statement

Not applicable.

Data Availability Statement

Not applicable.

Acknowledgments

The presented contents are based on a project funded by the German Federal Ministry of Education and Research under the grant number 03XP0337. The authors are responsible for the contents of this publication.

Conflicts of Interest

The authors declare no conflict of interest.

References

  1. Werner, D.; Peuker, U.A.; Mütze, T. Recycling chain for spent lithium-ion batteries. Metals 2020, 10, 316. [Google Scholar] [CrossRef] [Green Version]
  2. Wang, X.; Gaustad, G.; Babbitt, C.W.; Bailey, C.; Ganter, M.J.; Landi, B.J. Economic and environmental characterization of an evolving Li-ion battery waste stream. J. Environ. Manag. 2014, 135, 126–134. [Google Scholar] [CrossRef] [PubMed]
  3. Branca, T.A.; Colla, V.; Algermissen, D.; Granbom, H.; Martini, U.; Morillon, A.; Pietruck, R.; Rosendahl, S. Reuse and recycling of by-products in the steel sector: Recent achievements paving the way to circular economy and industrial symbiosis in Europe. Metals 2020, 10, 345. [Google Scholar] [CrossRef] [Green Version]
  4. Capuzzi, S.; Timelli, G. Preparation and melting of scrap in aluminum recycling: A review. Metals 2018, 8, 249. [Google Scholar] [CrossRef] [Green Version]
  5. Thompson, D.; Hyde, C.; Hartley, J.M.; Abbott, A.P.; Anderson, P.A.; Harper, G.D. To shred or not to shred: A comparative techno-economic assessment of lithium ion battery hydrometallurgical recycling retaining value and improving circularity in LIB supply chains. Resour. Conserv. Recycl. 2021, 175, 105741. [Google Scholar] [CrossRef]
  6. Pagliaro, M.; Meneguzzo, F. Lithium battery reusing and recycling: A circular economy insight. Heliyon 2019, 5, e01866. [Google Scholar] [CrossRef] [Green Version]
  7. Schubert, H. On the Fundamentals of Concentration Separation: Separation Criteria-Action Modes-Macroprocesses-Microprocesses. Aufbereitungstechnik 2004, 45, 7–33. [Google Scholar]
  8. Tromp, K.F. Neue Wege für die Beurteilung der Aufbereitung von Steinkohlen. Glückauf 1937, 73, 125–131. [Google Scholar]
  9. Wills, B.A.; Finch, J.A. Wills’ Mineral Processing Technology: An Introduction to the Practical Aspects of Ore Treatment and Mineral Recovery; Butterworth-Heinemann: Oxford, UK, 2015. [Google Scholar]
  10. Leißner, T.; Mütze, T.; Bachmann, K.; Rode, S.; Gutzmer, J.; Peuker, U. Evaluation of mineral processing by assessment of liberation and upgrading. Miner. Eng. 2013, 53, 171–173. [Google Scholar] [CrossRef]
  11. Buchmann, M.; Schach, E.; Tolosana-Delgado, R.; Leißner, T.; Astoveza, J.; Kern, M.; Möckel, R.; Ebert, D.; Rudolph, M.; van den Boogaart, K.G.; et al. Evaluation of magnetic separation efficiency on a cassiterite-bearing skarn ore by means of integrative SEM-based image and XRF–XRD data analysis. Minerals 2018, 8, 390. [Google Scholar] [CrossRef] [Green Version]
  12. Leschonski, K. Windsichter, verfahrenstechnische Maschinen zur Herstellung definierter pulverförmiger Produkte. Jahrbuch 1988, 1, 175–196. [Google Scholar]
  13. Straetmans, K.; Brückmann, R. Trockensortierung mit einem Zick-Zack-Sichter und einem Kegelsichter; Freiberger Forschungsheft: Freiberg, Germany, 1999. [Google Scholar]
  14. Shapiro, M.; Galperin, V. Air classification of solid particles: A review. Chem. Eng. Processing Process Intensif. 2005, 44, 279–285. [Google Scholar] [CrossRef]
  15. Tomas, J. Gravity separation of particulate solids in turbulent fluid flow. Part. Sci. Technol. 2004, 22, 169–187. [Google Scholar] [CrossRef]
  16. Tomas, J.; Gröger, T.; Küchler, C.; Friedrichs, J. Abtrennen von Wertstoffen aus Bauschutt. Chem. Ing. Tech. 1999, 71, 637–642. [Google Scholar] [CrossRef]
  17. Bilitewski, B.; Bilitewski, B.; Gewiese, A.; Härdtle, G.; Marek, K. Vermeidung und Verwertung von Reststoffen in der Bauwirtschaft. Beih. Zu Müll Und Abfall 1995, 30, 40–63. [Google Scholar]
  18. Bernotat, S. Stand der Sichtertechnik―Sichter fur Massenguter. ZKG Int. 1990, 43, 81–90. [Google Scholar]
  19. Binder, U. Der OαK-Querstromsichter. Entwicklung und Betriebsergebnisse. ZKG Int. 1988, 41, 237–242. [Google Scholar]
  20. Schubert, H. Aufbereitung Fester Stoffe; Dt. Verl. für Grundstoffindustrie: Stuttgart, Germany, 1996. [Google Scholar]
  21. Friedrichs, J.; Tomas, J. Aerosortierung von Bauschutt. Arb. -Und Ergeb. Des Sonderforschungsbereiches 1996, 385, 197–250. [Google Scholar]
  22. Technik der Gas/Feststoff-Strömung: Sichten, Abscheiden, Fördern, Wirbelschichten. In Proceedings of the Technik der Gas/Feststoffströmung—Sichten, Abscheiden, Fördern, Wirbelschichten, Köln, Germany, 2–3 December 1986; Available online: http://www.gbv.de/dms/tib-ub-hannover/016765354.pdf (accessed on 28 January 2022).
  23. JÖST. Available online: https://www.joest.com/ (accessed on 28 January 2022).
  24. Trennso. Available online: https://www.tst.de/ (accessed on 28 January 2022).
  25. Hosakawa Alpine. Available online: https://www.hosokawa-alpine.de/mechanische-verfahrenstechnik/ (accessed on 28 January 2022).
  26. Hamatec. Available online: https://www.hamatec.de/ (accessed on 28 January 2022).
  27. Recycling World GmbH. Available online: https://www.recyclingworld.ch/ (accessed on 28 January 2022).
  28. Schwechten, D.; Straetmans, K. A New Type of Zig-Zag Classifier for Dedusting, Separation and Sorting in the Fines Range. Aufbereitungstechnik 2003, 44, 43–44. [Google Scholar]
  29. Bartscher, S. Numerische und Experimentelle Untersuchung des Sortiervorgangs im Zick-Zack-Sichter; Schriftenreihe zur Aufbereitung und Veredlung; Shaker Verlag: Düren, Germany, 2019. [Google Scholar]
  30. Kaiser, F. Der Zickzack-Sichter-ein Windsichter nach neuem Prinzip. Chem. Ing. Tech. 1963, 35, 273–282. [Google Scholar] [CrossRef]
  31. Leschonski, K. Probleme der Strömungstrennverfahren, dargestellt am Beispiel der Windsichtung. Aufbereitungstechnik 1972, 12, 751–759. [Google Scholar]
  32. Rumpf, H.; Leschonski, K. Prinzipien und neuere Verfahren der Windsichtung. Chem. Ing. Tech. 1967, 39, 1231–1241. [Google Scholar] [CrossRef]
  33. Schubert, H. Aufbereitung Mineralischer Rohstoffe, 4th ed.; VEB Deutscher Verlag für Grundstoffindustrie: Leipzig, Germany, 1989. [Google Scholar]
  34. Fastov, B.; Valuiskii, P.F.; Lebedev, V.N.; Oskalenko, G.N. Testing of the zigzag classifier for granulated materials. Chem. Pet. Eng. 1975, 11, 477–479. [Google Scholar] [CrossRef]
  35. Böhme, S. Zur Stromtrennung Zerkleinerter Metallischer Sekundärrohstoffe, in Freiberger Forschungsheft; Deutscher Verlag für Grundstoffindustrie: Leipzig, Germany, 1989. [Google Scholar]
  36. Lukas, E.; Roloff, C.; Mann, H.; Kerst, K.; Hagemeier, T.; van Wachem, B.; Thévenin, D.; Tomas, J. Experimental Study and Modelling of Particle Behaviour in a Multi-Stage Zigzag Air Classifier, in Dynamic Flowsheet Simulation of Solids Processes; Springer: Berlin/Heidelberg, Germany, 2020; pp. 391–410. [Google Scholar]
  37. Hagemeier, T.; Glöckner, H.; Roloff, C.; Thévenin, D.; Tomas, J. Simulation of Multi-Stage Particle Classification in a Zigzag Apparatus. Chem. Eng. Technol. 2014, 37, 879–887. [Google Scholar] [CrossRef]
  38. Gloeckner, H.; Hagemeier, T.; Roloff, C.; Thévenin, D.; Tomas, J. Experimental investigation on the multistage particle classification in a zigzag air classifier. In Proceedings of the World Congress on Engineering, London, UK, 2–4 July 2014. [Google Scholar]
  39. Senden, M.M.G. Stochastic models for individual particle behavior in straight and zig zag air classifiers. PhD Thesis, Technical University Eindhoven, Eindhoven, The Netherlands, 30 March 1979. [Google Scholar]
  40. Mann, H. Experimentelle Untersuchung, Modellierung und Dynamische Simulation der Mehrstufigen Turbulenten Partikel-Querstromklassierung. Ph.D. Thesis, Otto-von-Guericke-Universität Magdeburg, Magdeburg, Germany, 2016. [Google Scholar]
  41. Sweeney, P. An Investigation of the Effects of Density, Size and Shape upon the Air Classification of Municipal Type Solid Waste; Final report; Civil and Environmental Engineering Development Office: Tyndall, FL, USA, 1977. [Google Scholar]
  42. Stieß, M. Mechanische Verfahrenstechnik-Partikeltechnologie 1; Springer-Verlag: Berlin/Heidelberg, Germany, 2008. [Google Scholar]
  43. Mann, H.; Roloff, C.; Hagemeier, T.; Thévenin, D.; Tomas, J. Model-based experimental data evaluation of separation efficiency of multistage coarse particle classification in a zigzag apparatus. Powder Technol. 2017, 313, 145–160. [Google Scholar] [CrossRef]
  44. Furchner, B.; Zampini, S. Air Classifiying. Ullmann’s Encyclopedia of Industrial Chemistry; Wiley-VCH: Weinheim, Germany, 2012; p. 215. [Google Scholar]
  45. Biddulph, M.W. Design of vertical air classifiers for municipal solid waste. Can. J. Chem. Eng. 1987, 65, 571–580. [Google Scholar] [CrossRef]
  46. Schubert, H. Handbuch der Mechanischen Verfahrenstechnik; John Wiley & Sons: Hoboken, NJ, USA, 2012. [Google Scholar]
  47. Lewis, M. Solids separation processes. Sep. Processes Food Biotechnol. Ind. Princ. Appl. 1996, 27, 243. [Google Scholar]
  48. Alter, H.; Natof, S.L.; Woodruff, K.L.; Freyberger, W.L.; Michaels, E.L. Classification and concentration of municipal solid waste. In Proceedings of the Fourth Mineral WasteUtilization Symposium, Chicago, IL, USA, 13–14 April 1974. [Google Scholar]
  49. Howell, S.G. A ten year review of plastics recycling. J. Hazard. Mater. 1992, 29, 143–164. [Google Scholar] [CrossRef]
  50. Colon, F. Recycling of paper. Conserv. Recycl. 1976, 1, 129–136. [Google Scholar] [CrossRef]
  51. Everett, J.W.; Peirce, J.J. The development of pulsed flow air classification theory and design for municipal solid waste processing. Resour. Conserv. Recycl. 1990, 4, 185–202. [Google Scholar] [CrossRef]
  52. Vesilind, P.A.; Henrikson, R.A. Effect of feed rate on air classifier performance. Resour. Conserv. 1981, 6, 211–221. [Google Scholar] [CrossRef]
  53. Peirce, J.J.; Wittenberg, N. Zigzag configurations and air classifier performance. J. Energy Eng. 1984, 110, 36–48. [Google Scholar] [CrossRef]
  54. Görner, K. Abfallwirtschaft und Bodenschutz: Mit 171 Tabellen; VDI-Buch, Görner, K., Eds.; Springer: Berlin/Heidelberg, Germany, 2002. [Google Scholar]
  55. Tomas, J.; Gröger, T. Mehrstufige turbulente Aerosortierung von Bauschutt. Aufbereit.-Tech. 1999, 40, 379–386. [Google Scholar]
  56. Heller, N.; Flamme, S. Entwicklung und Modellierung von Entsorgungswegen für WDVS-Abfälle. In Mineralische Nebenprodukte und Abfälle 4: Flaschen, Schlacken, Stäube und Baurestmassen; TK-Verlag: Neuruppin, Germany, 2017. [Google Scholar]
  57. Palmer, J.; Ghita, O.; Savage, L.; Evans, K. Successful closed-loop recycling of thermoset composites. Compos. Part A Appl. Sci. Manuf. 2009, 40, 490–498. [Google Scholar] [CrossRef]
  58. Martens, H.; Goldmann, D. Recyclingtechnik; Springer: Berlin/Heidelberg, Germany, 2011. [Google Scholar]
  59. Kumar, V.; Lee, J.-C.; Jeong, J.; Jha, M.K.; Kim, B.-S.; Singh, R. Recycling of printed circuit boards (PCBs) to generate enriched rare metal concentrate. J. Ind. Eng. Chem. 2015, 21, 805–813. [Google Scholar] [CrossRef]
  60. Kumar, V.; Lee, J.-C.; Jeong, J.; Jha, M.K.; Kim, B.-S.; Singh, R. Novel physical separation process for eco-friendly recycling of rare and valuable metals from end-of-life DVD-PCBs. Sep. Purif. Technol. 2013, 111, 145–154. [Google Scholar] [CrossRef]
  61. Yoo, J.-M.; Jeong, J.; Yoo, K.; Lee, J.C.; Kim, W. Enrichment of the metallic components from waste printed circuit boards by a mechanical separation process using a stamp mill. Waste Manag. 2009, 29, 1132–1137. [Google Scholar] [CrossRef]
  62. Havlik, T.; Orac, D.; Berwanger, M.; Maul, A. The effect of mechanical–physical pretreatment on hydrometallurgical extraction of copper and tin in residue from printed circuit boards from used consumer equipment. Miner. Eng. 2014, 65, 163–171. [Google Scholar] [CrossRef]
  63. Schubert, G.; Jäckel, H.-G.; Grunert, V. Verfahren und Anlage zur Aufbereitung der Schredderleichtfraktion aus Aufbereitung metallhaltiger Abfälle. Patent DE10334646. Patent DE10334646, 27 April 2006. [Google Scholar]
  64. Kox, W.M.A.; Senden, M.M.G. Theory and Practical Application of Multicomponent Separation in Solid Waste Technology. Resour. Conserv. 1982, 1, 75–94. [Google Scholar] [CrossRef]
  65. Friedlander, T.; Kuyumcu, H.Z.; Rolf, L. Untersuchungen zur Sortierung von PET-Flakes nach der Teilchenform. Aufbereit. Tech. -Miner. Processing 2006, 47, 24–43. [Google Scholar]
  66. Kwade, A.; Diekmann, J. Recycling of Lithium-Ion Batteries; The LithoRec Way; Springler International Publishing AG: Cham, Switzerland, 2018. [Google Scholar]
  67. Georgi-Maschler, T.; Friedrich, B.; Weyhe, R.; Heegn, H.; Rutz, M. Development of a Recycling Process for Li-ion Batteries. J. Power Sources 2012, 207, 173–182. [Google Scholar] [CrossRef]
  68. Wuschke, L.; Jäckel, H.-G.; Borsdorff, D.; Werner, D.; Peuker, U.A.; Gellner, M. Zur mechanischen Aufbereitung von Li-Ionen-Batterien. BHM Berg-Und Hüttenmännische Mon. 2016, 161, 267–276. [Google Scholar] [CrossRef]
  69. Wuschke, L. Mechanische Aufbereitung von Lithium-Ionen-Batteriezellen, 1st ed.; Freiberger Forschungshefte/A.; Technische Universität Bergakademie Freiberg: Freiberg, Germany, 2018. [Google Scholar]
  70. Wuschke, L.; Jäckel, H.G.; Peuker, U.A.; Gellner, M. Recycling of Li-ion batteries—A challenge. Recovery 2015, 4, 48–59. [Google Scholar]
  71. Rosenbrand, G.G. The separation performance and capacity of zigzag air classifiers at high particle feed rates. PhD Thesis, Technical University Eindhoven, Eindhoven, The Netherlands, 25 March 1986. [Google Scholar]
  72. Worrell, W.A.; Vesilind, P.A. Testing and evaluation of air classifier performance. Resour. Recovery Conserv. 1979, 4, 247–259. [Google Scholar] [CrossRef]
  73. Connor, M. Optimizing the Configuration of a Zig-zag Air Classifier. in Chemeca 83: Chemical Engineering Today; Coping with Uncertainty. In Proceedings of the Eleventh Australian Chemical Engineering Conference, Sydney, NSW, Australia, 4–7 September 1983. [Google Scholar]
  74. Biddulph, M.W.; Connor, M.A. A method of comparing the performance of air classifiers. Resour. Conserv. Recycl. 1989, 2, 275–286. [Google Scholar] [CrossRef]
  75. Tomas, J.; Gröger, T. Assessment of multistage turbulent cross-flow aeroseparation of building rubble. In Developments in Mineral Processing; Elsevier: Amsterdam, The Netherlands, 2000; Volume 13, p. C7-34. [Google Scholar]
  76. Tomas, J.; Gröger, T. Assessment of a multistage gravity separation in turbulent air flow. In Handbook of Powder Technology; Elsevier: Amsterdam, The Netherlands, 2001; Volume 10, pp. 761–769. [Google Scholar]
  77. Tomas, J.; Gröger, T. Verfahrenstechnische Bewertung einer Mehrstufigen Querstrom-Aerosortierung Mineralischer Stoffe; Univ., Fak. für Verfahrens-und Systemtechnik: Magdeburg, Germany, 2000. [Google Scholar]
  78. Tomas, J.; Schreier, M.; Gröger, T. Liberation and separation of valuables from building material waste. Chem. Eng. Technol. Ind. Chem.-Plant Equip.-Process Eng.-Biotechnol. 2000, 23, 809–814. [Google Scholar] [CrossRef]
  79. Schwechten, D. Steigrohrwindsichter mit Zickzack-Kanal; Hosokawa Alpine AG: Augsburg, Germany, 1997. [Google Scholar]
  80. Biddulph, M. Mixing effects in a simple air classifier. AIChE J. 1986, 32, 317–320. [Google Scholar] [CrossRef]
  81. Gillandt, I.; Fritsching, U.; Riehle, C. Zur mehrphasigen Strömung in einem Zick-Zack-Sichter. Forsch. Im Ing. 1996, 62, 315–321. [Google Scholar] [CrossRef]
  82. Hagemeier, T.; Glöckner, H.; Roloff, C.; Thévenin, D.; Tomas, J. CFD-DPM simulation of multi-stage particle classification in a zigzag apparatus. In Proceedings of the 13th European Symposium on Comminution & Classification, Braunschweig, Germany, 9–12 September 2013. [Google Scholar]
  83. Friedrich, J.; Winkler, T.; Lieberwirth, H. Numerische und experimentelle Untersuchung eines Zickzack-Sichters. Chem. Ing. Tech. 2014, 6, 906–909. [Google Scholar] [CrossRef]
  84. Neeße, T.; Schubert, H. Modellierung und verfahrenstechnische Dimensionierung der turbulenten Querstromklassierung Teil I–IV. Chem. Tech. 1975, 27–29. [Google Scholar]
  85. Schubert, H.; Boehme, S.; Neesse, T.; Espig, D. Classification in Turbulent Two-Phase Flows. Aufbereit.-Tech. 1986, 27, 295–306. [Google Scholar]
  86. Brémaud, P. Discrete Probability Models and Methods: Probability on Graphs and Trees, Markov Chains and Random Fields, Entropy and Coding; Springer: Berlin/Heidelberg, Germany, 2017; Volume 78. [Google Scholar]
  87. He, Y.; Wang, H.; Duan, C.; Song, S. Airflow fields simulation on passive pulsing air classifiers. J. South. Afr. Inst. Min. Metall. 2005, 105, 525–531. [Google Scholar]
  88. He, Y.; Duan, C.; Wang, H.; Zhao, Y.; Tao, D. Separation of metal laden waste using pulsating air dry material separator. Int. J. Environ. Sci. Technol. 2011, 8, 73–82. [Google Scholar] [CrossRef] [Green Version]
  89. Otto, O.; Hartmann, K. Hybrides Modell eines Sichters auf der Basis künstlicher neuronaler Netze. Chem. Ing. Tech. 1996, 68, 1578–1581. [Google Scholar] [CrossRef]
  90. Schubert, H.; Boehme, S.; Neesse, T.; Espig, D. Classification in turbulent two-phase flows. In Proceedings of the 1st World Congress on Particle Technology, Nuremberg, Germany, 3 April 1986. Part IV. [Google Scholar]
  91. Roloff, C.; Lukas, E.; van Wachem, B.; Thévenin, D. Particle dynamics investigation by means of shadow imaging inside an air separator. Chem. Eng. Sci. 2019, 195, 312–324. [Google Scholar] [CrossRef]
  92. Roloff, C.; Mann, H.; Tomas, J.; Thévenin, D. Flow investigation of a zigzag air classifier. In Proceedings of the 16th International Conference on Fluid Flow Technologies, Budapest, Hungary, 1–4 September 2015. [Google Scholar]
Figure 1. Structure and geometric parameters of a zigzag channel.
Processes 10 00764 g001
Figure 2. Characteristic terms for ZZ classifiers.
Processes 10 00764 g002
Figure 3. Flow regime in the ZZ. According to [39].
Processes 10 00764 g003
Figure 4. Solids flows and separation zones in the ZZ. According to [21,40].
Processes 10 00764 g004
Figure 5. Variation of ZZ classifier geometry: (a) zigzag (b) Utah (c) Duke according to [39].
Processes 10 00764 g005
Figure 6. Forms of ZZ classifier investigated by Peirce et al. and Schwechten et al. according to [28,51]: (a) ZZ non pulsed, (b) ZZ passive pulsed, (c) stacked triangle passive pulsed, (d) Hybrid air classifier. (Reprinted from Publication The development of pulsed flow air classification theory and design for municipal solid waste processing, 4, Jess, W.; Everett, J. Jeffrey Peirce, Resources, Conservation and Recycling, 185–202., Copyright (2021), with permission from Elsevier).
Processes 10 00764 g006
Figure 8. Separation sharpness and cut point velocity for different number of stages. Data reprocessed from [36].
Processes 10 00764 g008
Table 1. Overview on treated (model) materials in the experimental investigation of the ZZ classifier.
AuthorsProducts
Fastov et al. [34]red brick, chalk
Senden [39]paper, polystyrene balls
Rosenbrandt [71]paper, polystyrene balls
Worell et al. [72]paper, plastics, aluminium, steel
Vesilind et al. [52]plastics, aluminium
Connor et al. [73]polystyrene
Peirce et al. [53]polystyrene balls
Biddulph et al. [74]polystyrene, polypropylene
Peirce et al. [51]municipal solid waste (MSW)
Tomas and Gröger et al. [55,75,76,77,78]building waste (concrete, brick)
Mann et al. [40,43]sand, gravel
Schwechten et al. [28,79]silicia flour
Table 2. Overview of modelling with the ZZ Classifier.
AuthorsType of Modelling
Kaiser [30]Stochastic model
Senden [39]Stochastic model based on Markoff chains
Rosenbrandt [71]Development of Senden model to higher particle load
Tomas and Gröger et al. [55,75,76,77,78]Analytical model based on turbulent crossflow separation
Gillandt et al. [81]CFD simulation (2D)
Mann et al. [40,43]empirical correlations modelling based on empirical correlations
Hagemeier and Glöckner et al. [37,82]CFD simulation (3D)
Friedrich et al. [83]CFD simulation (3D)
Bartscher [29]CFD simulation (3D)
Lukas et al. [36]analytical model based on turbulent crossflow separation in hydrocyclones [84,85]
Publisher’s Note: MDPI stays neutral with regard to jurisdictional claims in published maps and institutional affiliations.

