
Vertical Distributions and Bioavailabilities of Heavy Metals in Soil in An-Tea Plantations in Qimen County, China

Abstract
1. Introduction
2. Materials and Methods
2.1. Study Area
2.2. Collection and Processing of Samples
2.3. Standard Substances for Soil Composition Analysis
2.4. Sample Analysis
2.5. Determination of HMs by ICP-MS
2.6. Data Processing and Statistical Analyses
3. Results
3.1. HM Distributions in Tea Plantation Soil
3.2. Vertical Distributions of the HM Fractions
3.2.1. Chromium
3.2.2. Cadmium
3.2.3. Nickel
3.2.4. Zinc
3.2.5. Arsenic
3.2.6. Lead
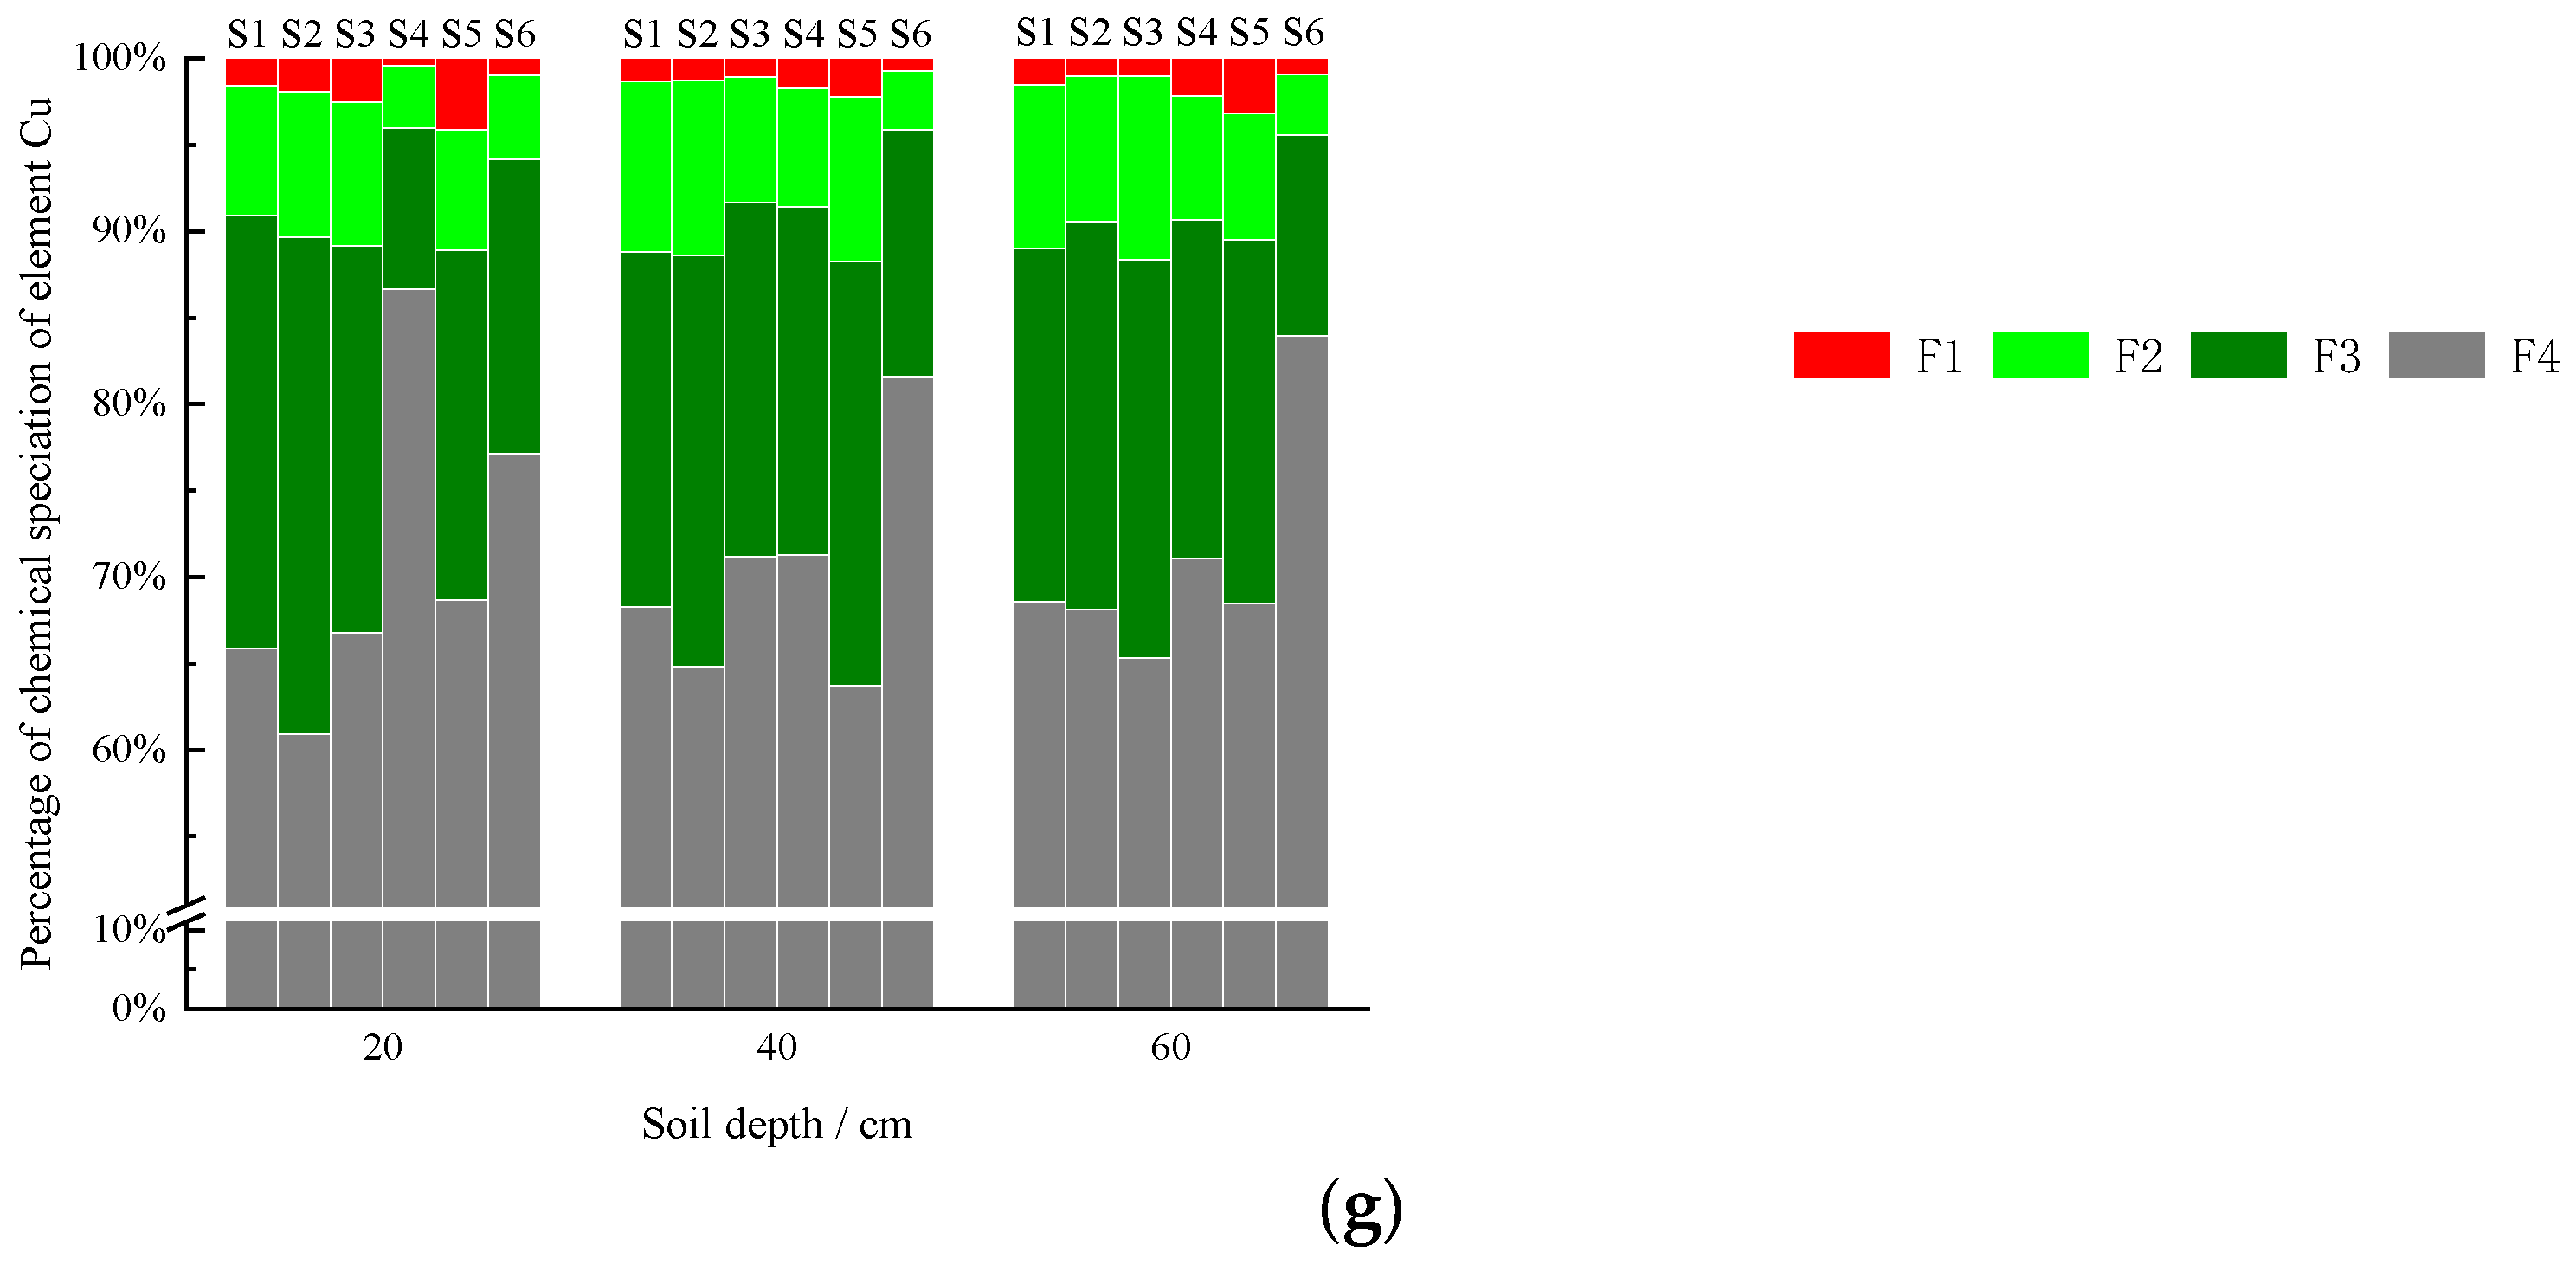
3.2.7. Copper
4. Discussion
4.1. Bioavailabilities of HMs in Tea Plantation Soil
4.2. Relationships between HM Concentrations in Tea Leaves and Soil
5. Conclusions
Supplementary Materials
Author Contributions
Funding
Institutional Review Board Statement
Informed Consent Statement
Data Availability Statement
Acknowledgments
Conflicts of Interest
References
- Deng, Z.; Tao, B.; Li, X.; He, J.; Chen, Y. Effect of green tea and black tea on the metabolisms of mineral elements in old rats. Biol. Trace Elem. Res. 1998, 65, 75–86. [Google Scholar] [CrossRef]
- Soomro, M.T.; Zahir, E.; Mohiuddin, S.; Khan, A.N.; Naqvi, I.I. Quantitative assessment of metals in local brands of tea in Pakistan. Pak. J. Biol. Sci. PJBS 2008, 11, 285–289. [Google Scholar] [CrossRef] [PubMed][Green Version]
- Acosta, J.A.; Arocena, J.M.; Faz, A. Speciation of arsenic in bulk and rhizosphere soils from artisanal cooperative mines in Bolivia. Chemosphere 2015, 138, 1014–1020. [Google Scholar] [CrossRef] [PubMed]
- Akpor, O.B.; Muchie, M. Remediation of heavy metals in drinking water and wastewater treatment systems: Processes and applications. Int. J. Phys. Sci. 2010, 5, 1807–1817. [Google Scholar] [CrossRef]
- Gao, X.L.; Zhou, F.X.; Chen, C.-T.A. Pollution status of the Bohai Sea: An overview of the environmental quality assessment related trace metals. Environ. Int. 2014, 62, 12–30. [Google Scholar] [CrossRef]
- Pénilla, S.; Bordas, F.; Bollinger, J.-C. Sequential heavy metals extraction from polluted solids: Influence of sulfate overconcentration. J. Colloid Interface Sci. 2005, 292, 20–28. [Google Scholar] [CrossRef]
- Sun, J.; Yu, R.; Hu, G.; Jiang, S.; Zhang, Y.; Wang, X. Bioavailability of heavy metals in soil of the Tieguanyin tea garden, southeastern China. Acta Geochim. 2017, 36, 519–524. [Google Scholar] [CrossRef]
- Unsal, Y.E.; Soylak, M.; Tuzen, M. Evaluation of metal concentrations of soil samples from Yahyali-Kayseri, Turkey. Fresenius Environ. Bull. 2014, 23, 2488–2491. [Google Scholar]
- Altundag, H.; Albayrak, S.; Dundar, M.S.; Tuzen, M.; Soylak, M. Investigation of the influence of selected soil and plant properties from Sakarya, Turkey, on the bioavailability of trace elements by applying an in vitro digestion model. Biol. Trace Elem. Res. 2015, 168, 276–285. [Google Scholar] [CrossRef]
- Rodriguez, L.; Ruiz, E.; Alonso-Azcárate, J.; Rincón, J. Heavy metal distribution and chemical speciation in tailings and soils around a Pb–Zn mine in Spain. J. Environ. Manag. 2009, 90, 1106–1116. [Google Scholar] [CrossRef]
- Sungur, A.; Vural, A.; Gundogdu, A.; Soylak, M. Effect of antimonite mineralization area on heavy metal contents and geochemical fractions of agricultural soils in Gümüşhane Province, Turkey. Catena 2020, 184, 104255. [Google Scholar] [CrossRef]
- Botsou, F.; Sungur, A.; Kelepertzis, E.; Soylak, M. Insights into the chemical partitioning of trace metals in roadside and off-road agricultural soils along two major highways in Attica’s region, Greece. Ecotoxicol. Environ. Saf. 2016, 132, 101–110. [Google Scholar] [CrossRef]
- Kelepertzis, E. Accumulation of heavy metals in agricultural soils of Mediterranean: Insights from Argolida basin, Peloponnese, Greece. Geoderma 2014, 221, 82–90. [Google Scholar] [CrossRef]
- Khalil, H.E.; Hamiani, O.E.; Bitton, G.; Ouazzani, N.; Boularbah, A. Heavy metal contamination from mining sites in South Morocco: Monitoring metal content and toxicity of soil runoff and groundwater. Environ. Monit. Assess. 2008, 136, 147–160. [Google Scholar] [CrossRef]
- Pueyo, M.; Mateu, J.; Rigol, A.; Vidal, M.; López-Sánchez, J.F.; Rauret, G. Use of the modified BCR three-step sequential extraction procedure for the study of trace element dynamics in contaminated soils. Environ. Pollut. 2008, 152, 330–341. [Google Scholar] [CrossRef]
- Mossop, K.F.; Davidson, C.M. Comparison of original and modified BCR sequential extraction procedures for the fractionation of copper, iron, lead, manganese and zinc in soils and sediments. Anal. Chim. Acta 2003, 478, 111–118. [Google Scholar] [CrossRef]
- Sungur, A.; Soylak, M.; Ozcan, H. Investigation of heavy metal mobility and availability by the BCR sequential extraction procedure: Relationship between soil properties and heavy metals availability. Chem. Spec. Bioavailab. 2014, 26, 219–230. [Google Scholar] [CrossRef]
- China National Intellectual Property Administration. Notice of the General Administration of Public Security of the People’s Republic of China on Approving the Implementation of Geographical Indication Product Protection for Products such as Thin Skinned Walnuts in Leijiadian. Available online: https://dlbzsl.hizhuanli.cn:8888/Product/Detail/481 (accessed on 13 March 2022).
- Koch, K.R.; Pougnet, B.; De Villiers, S.; Monteagudo, F. Increased urinary excretion of Al after drinking tea. Nature 1988, 333, 122. [Google Scholar] [CrossRef]
- Sun, J.; Yu, R.; Yan, Y.; Hu, G.; Qiu, Q.; Jiang, S.; Cui, J.; Wang, X.; Ma, C. Isotope tracers for lead and strontium sources in the Tieguanyin tea garden soils and tea leaves. Chemosphere 2020, 246, 125638. [Google Scholar] [CrossRef]
- Niranjana, K.; Viswanath, S. Root characteristics of tea [Camellia sinensis (L.) O. Kuntze] and silver oak [Grevillea robusta (A. Cunn)] in a mixed tea plantation at Munnar, Kerala. J. Trop. Agric. 2008, 46, 25–31. [Google Scholar]
- Wu, J.N.; Liu, W.J.; Chen, C.F. Can intercropping with the world’s three major beverage plants help improve the water use of rubber trees? J. Appl. Ecol. 2016, 53, 1787–1799. [Google Scholar] [CrossRef]
- Gan, Z.T.; Yao, T.; She, X.S.; Zhang, P.Q.; Wang, S.Q.; Wang, Y.; Tan, Y.Y.; Qi, N. Simultaneous determination of multiple elements of tea garden soil using inductively coupled plasma mass spectrometry. In Proceedings of the IWRED 2019, Guangzhou, China, 8–10 March 2019. [Google Scholar] [CrossRef]
- General Administration of Quality Supervision, Inspection and Quarantine of the People’s Republic of China; Standardization Administration of the People’s Republic of China. Soil and Sediment Sequential Extraction Procedure of Speciation of 13 Trace Elements; Standardization Administration of the People’s Republic of China: Beijing, China, 2010.
- Ministry of Ecology and Environment the People’s Republic of China; State Administration for Market Regulation. Soil Environmental Quality and Risk Control Standard of Agricultural Land Soil Pollution; (Trial) (GB 15618-2018); Ministry of Ecology and Environment the People’s Republic of China: Beijing, China, 2018.
- He, H.; Shi, L.; Yang, G.; You, M.; Vasseur, L. Ecological risk assessment of soil heavy metals and pesticide residues in tea plantations. Agriculture 2020, 10, 47. [Google Scholar] [CrossRef]
- Wen, B.; Zhang, X.; Ren, S.; Duan, Y.; Fang, W. Characteristics of soil nutrients, heavy metals and tea quality in different intercropping patterns. Agrofor. Syst. 2019, 94, 963–974. [Google Scholar] [CrossRef]
- Wen, B.; Li, L.; Duan, Y.; Zhang, Y.; Shen, J.; Xia, M.; Wang, Y.; Fang, W.; Zhu, X. Zn, Ni, Mn, Cr, Pb and Cu in soil-tea ecosystem: The concentrations, spatial relationship and potential control. Chemosphere 2018, 204, 92–100. [Google Scholar] [CrossRef] [PubMed]
- Zhang, H. Analysis of the Spatial Variation and Evaluatoin on Soil Fertility and Heavy Metal of Typical Green Tea Plantations. Master’s Thesis, Chinese Academy of Agricultural Sciences, Beijing, China, 2015. (In Chinese). [Google Scholar]
- Sun, C.; Zhang, Z.; Cao, H.; Xu, M.; Xu, L. Concentrations, speciation, and ecological risk of heavy metals in the sediment of the Songhua River in an urban area with petrochemical industries. Chemosphere 2019, 219, 538–545. [Google Scholar] [CrossRef] [PubMed]
- Sun, X.J.; Zhang, Q.G.; Kang, S.C.; Guo, J.M.; Li, X.F.; Yu, Z.L.; Zhang, G.S.; Qu, D.M.; Huang, J.; Cong, Z.Y.; et al. Mercury speciation and distribution in a glacierized mountain environment and their relevance to environmental risks in the inland Tibetan Plateau. Sci.Total Environ. 2018, 631–632, 270–278. [Google Scholar] [CrossRef] [PubMed]
- Liu, Y.L.; Zhang, L.J.; Han, X.F.; Zhuang, T.F.; Shi, Z.X.; Lv, X.Z. Spatial variability and evaluation of soil heavy metal contamination in the urban-transect of Shanghai. Environ. Sci. 2012, 33, 599–605. (In Chinese) [Google Scholar] [CrossRef]
- Zhang, J.; Guo, X.Y.; Zeng, Y.; Deng, J.C. Spatial distribution and pollution assessment of heavy metals in river sediments from lake Taihu Basin. Environ. Sci. 2019, 40, 2202–2210. (In Chinese) [Google Scholar] [CrossRef]
- Fang, Z.Q. Pollution Characteristics of Heavy Metal in Soil from Lead and Zinc Mine and Its Stabilization Study. Ph.D. Thesis, China University of Mining & Technology, Beijing, China, 2016. (In Chinese). [Google Scholar]
- Sun, J.; Tao, H.; Yang, S.W.; Geng, X.L.; Wei, Y.X. Development characteristics and prevention measures of geological hazards in mountain area of southe Anhui Province. Hydrogeol. Eng. Geol. 2011, 38, 98–101. (In Chinese) [Google Scholar] [CrossRef]
- Zhao, Y.C.; Xu, X.F.; Cui, C.G. Case study of the inpact of mesoscale topography on the Meiyu frontal rainstorm. Plateau Meteor. 2012, 31, 1268–1282. (In Chinese) [Google Scholar] [CrossRef]
- Luo, Y.P. Tea Cultivation, 5th ed.; China Agriculture Press: Beijing, China, 2015. (In Chinese) [Google Scholar]
- Chen, W.L.; Ge, C.M.; Ye, T.; Zhang, R.; Sun, Q.Y.; Zhang, J.X. Review of tea plant (Camellia sinensis) root growth and its influencing factors. Subtrop. Plant Sci. 2020, 49, 148–156. (In Chinese) [Google Scholar] [CrossRef]
- She, X.S.; Gan, Z.T.; Yao, T.; Wang, S.Q.; Wang, Y. Bioconcentration and distribution of heavy metal elements in the soil⁃tea plant systems of An-tea producing areas. J. Nanjing For. Univ. (Nat. Sci. Ed.) 2020, 44, 102–110. (In Chinese) [Google Scholar] [CrossRef]


| Steps | T/°C | Pressure/MPa | t/min |
|---|---|---|---|
| 1 | 150 | 15 | 3 |
| 2 | 180 | 25 | 3 |
| 3 | 200 | 30 | 3 |
| 4 | 220 | 35 | 15 |
| Working Parameters | Conditions | Working Parameters | Conditions | Working Parameters | Conditions |
|---|---|---|---|---|---|
| RF power | 1500 W | Cooling water flow rate | 3.73 L/min | Flow rate of cooling gas | 13 L/min |
| Flux of atomize | 1 L/min | Vacuum sampling depth | 10 mm | Vacuum | 10−7 MPa |
| Assistant gas flow | 0.8 L/min | Peristaltic pump speed | 40 RPM | Times of repetition | 3 |
| Item | Depth | Zn (mg·kg−1) | Cr (mg·kg−1) | Pb (mg·kg−1) | As (mg·kg−1) | Cu (mg·kg−1) | Ni (mg·kg−1) | Cd (mg·kg−1) | pH | TOC (g·kg−1) |
|---|---|---|---|---|---|---|---|---|---|---|
| 0–20 cm | 47.02–261.13 | 28.59–91.78 | 11.48–63.12 | 11.93–48.31 | 9.16–29.90 | 6.99–22.79 | 0.10–0.39 | 3.07–5.90 | 17.05–50.41 | |
| Min−Max | 20–40 cm | 51.36–210.34 | 28.25–88.18 | 10.81–56.83 | 10.17–55.50 | 9.89–26.78 | 10.87–28.09 | 0.08–0.31 | 3.14–5.74 | 10.59–50.22 |
| 40–60 cm | 51.51–316.67 | 22.29–89.15 | 10.35–53.14 | 11.07–44.68 | 9.40–37.76 | 9.50–24.09 | 0.04–0.37 | 3.95–5.45 | 17.45–58.38 | |
| 0–20 cm | 107.97 ± 52.3 a,A | 47.60 ± 14.4 a,B | 29.32 ± 13.1 a,C | 24.20 ± 10.8 a,C | 18.10 ± 2.8 a,C | 14.74 ± 4.0 a,C | 0.23 ± 0.2 a,D | 4.64 ± 0.9 a | 32.75 ± 12.8 a | |
| Mean ± S | 20–40 cm | 100.61 ± 40.0 a,A | 52.86 ± 15.2 a,B | 28.79 ± 11.4 a,C | 24.00 ± 11.8 a,C | 17.93 ± 4.8 a,C | 17.22 ± 4.9 a,b,C | 0.21 ± 0.2 a,D | 4.46 ± 1.3 a | 29.15 ± 14.6 a |
| 40–60 cm | 104.03 ± 57.1 a,A | 53.79 ± 19.5 a,B | 28.41 ± 11.3 a,C | 24.34 ± 9.2 a,C | 17.88 ± 7.3 a,C | 15.77 ± 4.3 b,C | 0.23 ± 0.2 a,D | 4.40 ± 0.7 a | 38.48 ± 14.7 a | |
| Limit Standard * [25,26] | 200.00 | 150.00 | 70.00 | 40.00 | 50.00 | 60.00 | 0.30 | - | - | |
| Region | Zn | Cr | Pb | As | Cu | Ni | Cd |
|---|---|---|---|---|---|---|---|
| Qimen * | 104.20 | 51.41 | 28.84 | 24.18 | 17.97 | 15.91 | 0.22 |
| Anxi [26] | 76.90 | 15.80 | 49.20 | 3.99 | 15.70 | 6.50 | 0.04 |
| Fuzhou [26] | 151.30 | 31.70 | 73.50 | 5.66 | 86.00 | 17.80 | 0.16 |
| Suzhou [27] | 198.13 | 82.58 | 83.96 | 5.57 | 19.72 | 29.15 | 0.12 |
| Nanjing [28] | 62.80 | 83.74 | 34.65 | ND | 17.16 | 31.71 | ND |
| Belt | Depth/cm | Cr | Cd | Ni | Zn | As | Pb | Cu |
|---|---|---|---|---|---|---|---|---|
| S1 | 0–20 | 2.08 ± 0.35 | 16.34 ± 3.63 | 4.30 ± 1.68 | 1.99 ± 0.13 | 1.31 ± 0.46 | 44.84 ± 9.16 | 9.07 ± 0.60 |
| 20–40 | 0.52 ± 0.03 | 15.33 ± 3.80 | 2.65 ± 0.61 | 9.96 ± 0.72 | 1.59 ± 0.33 | 46.46 ± 7.78 | 11.19 ± 1.24 | |
| 40–60 | 0.61 ± 0.03 | 16.95 ± 2.59 | 3.50 ± 0.44 | 9.55 ± 0.73 | 2.03 ± 0.68 | 54.59 ± 5.01 | 10.98 ± 0.49 | |
| S2 | 0–20 | 2.48 ± 0.14 | 20.04 ± 2.41 | 2.98 ± 0.82 | 9.29 ± 0.66 | 1.24 ± 0.28 | 45.48 ± 4.36 | 10.34 ± 0.87 |
| 20–40 | 2.17 ± 0.42 | 14.64 ± 2.38 | 2.07 ± 0.39 | 3.95 ± 0.53 | 2.20 ± 0.24 | 50.30 ± 6.17 | 11.40 ± 0.26 | |
| 40–60 | 2.26 ± 0.02 | 15.81 ± 4.63 | 1.63 ± 0.34 | 1.54 ± 0.13 | 1.29 ± 0.27 | 42.27 ± 2.68 | 9.45 ± 0.32 | |
| S3 | 0–20 | 2.21 ± 0.03 | 14.98 ± 0.28 | 3.00 ± 0.78 | 11.14 ± 1.10 | 1.57 ± 0.32 | 43.73 ± 0.86 | 10.84 ± 1.27 |
| 20–40 | 1.91 ± 0.02 | 14.63 ± 1.85 | 0.89 ± 0.22 | 2.72 ± 0.17 | 1.27 ± 0.43 | 45.41 ± 6.25 | 8.35 ± 0.31 | |
| 40–60 | 2.56 ± 0.11 | 13.52 ± 2.51 | 3.03 ± 1.19 | 5.08 ± 0.55 | 2.01 ± 0.33 | 51.43 ± 4.08 | 11.63 ± 0.65 | |
| S4 | 0–20 | 1.84 ± 0.09 | 12.8 ± 0.44 | 2.17 ± 0.26 | 11.70 ± 0.80 | 0.56 ± 0.08 | 21.43 ± 2.70 | 4.02 ± 0.14 |
| 20–40 | 2.11 ± 0.25 | 18.1 ± 0.81 | 3.60 ± 0.29 | 3.08 ± 0.19 | 7.80 ± 3.15 | 41.30 ± 8.25 | 8.57 ± 0.88 | |
| 40–60 | 2.32 ± 0.21 | 9.54 ± 1.72 | 0.85 ± 0.26 | 9.70 ± 1.15 | 1.70 ± 0.50 | 40.92 ± 3.48 | 9.35 ± 0.36 | |
| S5 | 0–20 | 0.60 ± 0.02 | 39.70 ± 9.29 | 1.05 ± 0.16 | 25.92 ± 1.46 | 1.61 ± 0.59 | 54.85 ± 1.83 | 11.12 ± 0.58 |
| 20–40 | 0.61 ± 0 | 13.13 ± 3.06 | 0.26 ± 0.06 | 6.68 ± 0.98 | 1.69 ± 0.42 | 47.89 ± 8.43 | 11.72 ± 1.55 | |
| 40–60 | 0.56 ± 0.11 | 19.77 ± 1.86 | 0.02 ± 0 | 10.90 ± 1.18 | 1.75 ± 0.38 | 51.01 ± 1.99 | 10.50 ± 1.30 | |
| S6 | 0–20 | 0.58 ± 0.08 | 9.17 ± 1.43 | 0 ± 0 | 9.90 ± 0.58 | 0.78 ± 0.13 | 40.42 ± 6.59 | 5.84 ± 0.91 |
| 20–40 | 0.58 ± 0.07 | 9.56 ± 1.11 | 0 ± 0 | 9.09 ± 1.36 | 0.89 ± 0.34 | 38.96 ± 1.98 | 4.16 ± 0.12 | |
| 40–60 | 0.52 ± 0.07 | 11.19 ± 3.08 | 0.21 ± 0.03 | 20.73 ± 2.13 | 0.84 ± 0.29 | 38.42 ± 6.04 | 4.41 ± 0.30 |
| Element | Belt | F1 | F2 | F3 | F4 | F1 + F2 + F3 + F4 | ||||||||||
|---|---|---|---|---|---|---|---|---|---|---|---|---|---|---|---|---|
| 20 | 40 | 60 | 20 | 40 | 60 | 20 | 40 | 60 | 20 | 40 | 60 | 20 | 40 | 60 | ||
| S1 | 0.998 * | 0.999 * | 0.250 | 0.674 | −0.671 | −0.672 | −0.675 | −0.675 | −0.675 | −0.675 | 0.302 | 0.302 | −0.674 | 0.264 | 0.243 | |
| S2 | 0.149 | −0.988 | 0.247 | 0.775 | −0.931 | −0.932 | −0.782 | −0.931 | 0.931 | 0.782 | 0.782 | −0.931 | 0.782 | 0.754 | −0.931 | |
| Cr | S3 | 0.952 | −0.206 | −0.731 | 0.722 | 0.725 | −0.731 | −0.727 | −0.727 | −0.727 | 0.727 | 0.727 | −0.727 | 0.728 | 0.727 | −0.728 |
| S4 | −0.848 | −0.005 | 0.012 | −0.854 | 0.861 | 0.862 | −0.012 | −0.013 | −0.012 | 0.012 | 0.012 | 0.012 | 0.001 | 0.036 | 0.036 | |
| S5 | 0.753 | −0.708 | 0.957 | −0.649 | −0.644 | −0.651 | −0.338 | 0.338 | 0.646 | −0.646 | −0.646 | 0.646 | −0.664 | −0.623 | 0.646 | |
| S6 | 0.313 | 0.661 | 0.648 | −0.775 | 0.779 | 0.774 | 0.775 | 0.775 | −0.775 | 0.159 | −0.159 | −0.159 | 0.172 | −0.132 | −0.18 | |
| S1 | 0.033 | 0.032 | 0.859 | 0.871 | 0.867 | −0.864 | 0.864 | 0.865 | −0.866 | −0.001 | −0.001 | 0 | 0.496 | 0.329 | −0.238 | |
| S2 | - | - | - | - | - | - | - | - | - | - | - | - | - | - | - | |
| Cd | S3 | 0.871 | 0.87 | 0.866 | 0.871 | −0.865 | −0.873 | 0.004 | 0.015 | 0.006 | 0.866 | 0.866 | 0.866 | 0.822 | 0.798 | 0.793 |
| S4 | 0.865 | 0.876 | 0.881 | −0.855 | −0.852 | −0.864 | −0.865 | 0.858 | 0.867 | 0.866 | 0.866 | 0.866 | 0.812 | 0.917 | 0.92 | |
| S5 | −0.865 | 0.885 | 0.858 | −0.863 | 0.866 | 0.851 | 0.002 | 0.862 | 0.867 | 0.866 | −0.866 | 0.866 | 0.702 | −0.792 | 0.899 | |
| S6 | −0.854 | −0.857 | 0.86 | 0.023 | −0.019 | −0.051 | −0.001 | −0.005 | 0.002 | −0.866 | −0.866 | −0.866 | −0.835 | −0.806 | −0.922 | |
| S1 | 0.958 | 0.957 | −0.956 | 0.228 | 0.729 | −0.73 | −0.957 | −0.957 | −0.957 | −0.957 | −0.957 | −0.957 | −0.958 | −0.955 | −0.958 | |
| S2 | 0.697 | 0.696 | −0.697 | 0.97 | −0.969 | 0.97 | 0.272 | 0.272 | 0.697 | 0.273 | −0.273 | 0.697 | 0.29 | −0.274 | 0.705 | |
| Ni | S3 | 0.603 | −0.604 | −0.602 | −0.992 | −0.992 | 0.992 | −0.39 | −0.39 | −0.39 | −0.39 | 0.39 | −0.39 | −0.387 | 0.375 | −0.386 |
| S4 | −0.695 | 0.696 | 0.697 | −0.282 | −0.274 | - | 0.274 | 0.274 | −0.274 | −0.274 | −0.274 | 0.274 | −0.276 | −0.261 | 0.283 | |
| S5 | 0.41 | 0.581 | −0.539 | - | − | - | −0.408 | 0.995 | −0.995 | 0.995 | 0.995 | −0.995 | 0.998 * | 0.995 | −0.995 | |
| S6 | - | - | 0.271 | - | − | - | 0.707 | 0.706 | 0.707 | −0.707 | 0.707 | −0.698 | −0.707 | 0.707 | −0.696 | |
| S1 | 0.991 | −0.991 | −0.991 | −0.379 | −0.379 | −0.379 | 0.991 | 0.991 | 0.991 | −0.379 | −0.379 | −0.379 | −0.279 | −0.311 | −0.356 | |
| S2 | 0.807 | 0.108 | −0.108 | −0.807 | −0.807 | 0.915 | −0.915 | −0.915 | −0.915 | 0.807 | 0.915 | 0.915 | 0.739 | 0.887 | 0.957 | |
| Zn | S3 | −0.981 | −0.981 | −0.981 | 0.981 | 0.981 | 0.981 | 0.981 | 0.981 | −0.659 | 0.981 | −0.981 | −0.981 | 0.981 | −0.981 | −0.99 |
| S4 | −0.352 | 0.352 | −0.352 | 0.352 | −0.352 | 0.352 | −0.352 | −0.352 | −0.352 | −0.352 | −0.352 | −0.352 | −0.352 | −0.352 | −0.352 | |
| S5 | −0.767 | 0.767 | 0.767 | −0.939 | −0.939 | −0.939 | −0.767 | 0.767 | 0.767 | −0.939 | 0.767 | 0.767 | −0.994 | 0.735 | 0.744 | |
| S6 | 0.299 | −0.299 | −0.299 | 0.677 | 0.677 | 0.677 | −0.976 | −0.976 | −0.976 | 0.677 | −0.976 | −0.976 | 0.602 | −0.958 | −0.955 | |
| S1 | - | - | - | 0.861 | 0.861 | −0.86 | −0.006 | 0.01 | −0.009 | −0.87 | −0.87 | 0.862 | −0.868 | −0.871 | 0.86 | |
| S2 | - | - | - | - | - | - | - | - | - | - | - | - | - | - | - | |
| As | S3 | −0.952 | - | 0.207 | 0.74 | −0.742 | 0.741 | −0.74 | 0.739 | −0.742 | 0.952 | 0.952 | 0.952 | 0.952 | 0.952 | 0.953 |
| S4 | - | 0.24 | 0.255 | 0.96 | −0.96 | −0.961 | 0.961 | −0.961 | −0.961 | −0.24 | −0.24 | 0.24 | −0.233 | −0.248 | 0.231 | |
| S5 | −0.869 | −0.985 | −0.861 | 0.001 | −0.866 | 0.866 | 0.001 | −0.002 | −0.001 | 0 | 0 | 0 | −0.001 | −0.004 | 0.003 | |
| S6 | - | 0.512 | −0.569 | 0.403 | −0.405 | −0.4 | −0.408 | 0.4 | 0.399 | −0.592 | −0.592 | −0.592 | −0.591 | −0.592 | −0.593 | |
| S1 | −0.768 | −0.769 | −0.938 | 0.768 | −0.939 | 0.939 | 0.171 | −0.768 | 0.768 | −0.768 | 0.939 | −0.939 | −0.216 | −0.903 | 0.981 | |
| S2 | 0.391 | 0.392 | −0.391 | −0.391 | 0.391 | 0.391 | −0.602 | 0.602 | −0.602 | 0.391 | −0.391 | 0.391 | −0.999 * | 0.543 | 0.062 | |
| Pb | S3 | 0.288 | 0.288 | −0.684 | 0.289 | 0.289 | 0.685 | −0.289 | 0.289 | 0.289 | 0.364 | 0.289 | −0.289 | 0.352 | 0.289 | 0.555 |
| S4 | −0.741 | −0.741 | 0.741 | −0.741 | 0.741 | −0.741 | −0.741 | −0.741 | −0.741 | 0.741 | −0.741 | −0.741 | 0.741 | −0.741 | −0.741 | |
| S5 | −0.866 | −0.866 | −0.866 | 0.866 | −0.866 | −0.866 | 0 | 0 | −0.866 | 0.866 | 0.866 | 0 | 0.675 | −0.988 | −0.986 | |
| S6 | 0.978 | 0.978 | 0.978 | 0.309 | −0.309 | 0.309 | 0.669 | 0.978 | −0.978 | −0.309 | −0.978 | −0.978 | 0.044 | −0.199 | −0.997 * | |
| S1 | 0.989 | 0.619 | 0.637 | 0.989 | 0.989 | 0.622 | 0.989 | 0.989 | −0.989 | −0.989 | −0.622 | 0.622 | −0.989 | −0.218 | 0.344 | |
| S2 | 0.129 | −0.128 | 0.128 | 0.795 | −0.128 | −0.128 | −0.795 | −0.795 | 0.128 | 0.128 | −0.128 | −0.128 | 0.08 | −0.29 | −0.128 | |
| Cu | S3 | −0.475 | 0.475 | −1.000 * | −0.476 | −0.475 | −0.476 | −0.476 | −0.476 | −0.476 | 0.476 | 0.476 | 1.000 * | 0.476 | 0.476 | 0.962 |
| S4 | 0.917 | 0.917 | 0.918 | −0.917 | −0.917 | 0.917 | 0.917 | −0.917 | 0.872 | −0.917 | 0.917 | 0.917 | −0.917 | 0.917 | 0.908 | |
| S5 | −0.959 | −0.959 | −0.96 | 0.959 | 0.959 | −0.959 | 0.235 | −0.959 | 0.959 | 0.959 | −0.959 | 0.235 | 0.9 | −0.959 | 0.252 | |
| S6 | 0.994 | 1.000 ** | 0.985 | −0.988 | −0.988 | −0.988 | 0.628 | 0.988 | −0.988 | 0.36 | −0.988 | −0.988 | 0.476 | −0.987 | −0.988 | |
Publisher’s Note: MDPI stays neutral with regard to jurisdictional claims in published maps and institutional affiliations. |
© 2022 by the authors. Licensee MDPI, Basel, Switzerland. This article is an open access article distributed under the terms and conditions of the Creative Commons Attribution (CC BY) license (https://creativecommons.org/licenses/by/4.0/).
Share and Cite
Xu, J.; Wang, S.; Yao, T.; She, X.; Gan, Z. Vertical Distributions and Bioavailabilities of Heavy Metals in Soil in An-Tea Plantations in Qimen County, China. Processes 2022, 10, 664. https://doi.org/10.3390/pr10040664
Xu J, Wang S, Yao T, She X, Gan Z. Vertical Distributions and Bioavailabilities of Heavy Metals in Soil in An-Tea Plantations in Qimen County, China. Processes. 2022; 10(4):664. https://doi.org/10.3390/pr10040664
Chicago/Turabian StyleXu, Jingcheng, Siqiang Wang, Ting Yao, Xinsong She, and Zhuoting Gan. 2022. "Vertical Distributions and Bioavailabilities of Heavy Metals in Soil in An-Tea Plantations in Qimen County, China" Processes 10, no. 4: 664. https://doi.org/10.3390/pr10040664
APA StyleXu, J., Wang, S., Yao, T., She, X., & Gan, Z. (2022). Vertical Distributions and Bioavailabilities of Heavy Metals in Soil in An-Tea Plantations in Qimen County, China. Processes, 10(4), 664. https://doi.org/10.3390/pr10040664