Abstract
The process of designing a longwall powered support is extremely complex and requires many operations related to the creation of a complete machine. The powered support section is one of the basic elements of the longwall system. It acts as protection for the working space and takes part in the process of excavating and transporting the spoil. The implementation of the support that meets the guidelines of the manufacturer and user requires an endurance analysis at the design stage conducted according to the regulations in force. The main objective of this research, pursued by the authors, was to perform the analysis of the ultimate strength of selected elements of the designed powered support section. The research was carried out with the use of special software that uses the finite element method. This article presents the analysis of the strength limits conducted with the help of the finite element method, determining the strength of selected elements of the longwall support section. The solutions proposed by the authors include changes in the structure and properties of the material in the design process. The aim of the proposed solution was to obtain a model with strength value that meets safety standards. The research results are a valuable source of knowledge for designers. Solutions of this type set examples for spatial models of the longwall support section being designed currently. The analysis presented in the article, together with the results of the research and the conclusions resulting from them, may improve the safety and effectiveness of powered supports.
1. Introduction
Currently, the dynamically developing area of automation and robotization of machines in accordance with the idea of modern technologies [1,2,3] brings about changes in the processes of their design and production. These changes force producers to use modern methods and techniques [4,5,6], influencing the improvement of safety and reduction of costs and time [7,8,9]. At the stage of design, the fulfillment of these assumptions allows using model research [10,11] on virtual objects with the use of numerical methods [12,13,14]. Numerical modeling techniques based on differential equations [15] enable the creation of a virtual three-dimensional model. The model, thanks to dedicated software, can be subjected to processes determining changes in the behavior of physical parameters, including determination of yield strengths. Determining the yield strengths is an important issue from the point of view of designing machine structure elements [16,17,18,19], as it entails the determination of the state of stress and deformations resulting from the impact of external forces [14,16]. At this stage, it is also worth taking into account the working environment of the designed machines [20,21,22].
Numerical tests of powered support sections conducted by using the finite element method in the design process shorten the time of creating a prototype [23,24,25]. They enable the use of various design variants [26,27] in order to choose the most optimal solution based on the analysis [28,29]. Thanks to this, the final product, in this case a powered support, will meet the quality and safety requirements [30,31]. Due to the significant role of powered support in the production process, it is important for it to exhibit a high safety index [32,33,34]. The support sections are responsible for securing the longwall excavation against the fall of roof rocks and for moving the mining machine along the face conveyor towards the face of the wall [35,36,37]. It is one of the three main machines included in the longwall complex, which forms a set of mutually dependent machines [38,39,40].
Elements of the support section are constructed according to specific safety standards that the support must meet [40,41,42,43]. The powered support section consists of basic elements (Figure 1), which include all the parts carrying load caused by the pressure of roof rocks [44]. The additional elements are the parts that do not transfer the load resulting from the pressure of the roof rocks, but are necessary for the functioning of the support [45]. The working environment of the longwall support in underground mining plants is extremely difficult and dangerous. Complicated natural (environmental) conditions make the process of coal mining inextricably associated with both natural and mechanical hazards—resulting from improper use of machines and devices. The accumulation of many threats, such as methane, rock bursts, the risk of gas and rock outbursts, inclination of underlay, depth of the selected deposit, water leaks, tectonic disturbances, and coal and rock cracks force machine designers to take into account these extremely difficult mining and geological conditions [46].
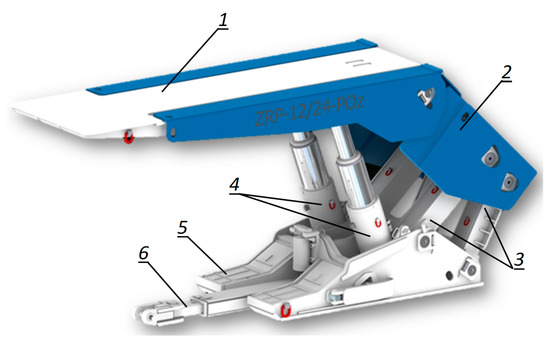
Figure 1.
Section of the powered roof support: 1—canopy, 2—shield support, 3—lemniscate tie rods, 4—leg, 5—floor base, 6—shifting system.
The powered support section opposes the occurrence of dynamic phenomena in the rock mass, the effect of which is the formation of tremors. The tremors occurring in the rock mass can be divided into natural and mining, i.e., caused by improper roof control [47]. The conditions of cooperation between the support and the rock mass are analyzed on the basis of the processes related to the subsidence of the roof layers. This method has been widely used to determine the factor characterizing the maintenance of the roof. The support is influenced by some dynamic phenomena occurring in the rock mass, such as vibrations, rapid clamping of the adjacent rocks, impact of crushed and ejected rocks and an increase in load force resulting from a fractured rock mass. All this collaboration is extremely complex. It depends on many mining and geological factors influencing the value of the load on the powered support by the rock mass. These parameters, apart from the previously mentioned depth of the works, are structure and strength of the surrounding rocks, exploitation history, height, length, span of the wall and water accumulation [47].
At the stage of designing, planning and conducting research on a powered support section, each of the elements should be thoroughly analyzed prior to the interaction between the support and the rock mass under real conditions [48,49,50]. The design stage is based on the selection of adequate technical solutions and on determining mutual dependency between them in order to obtain the final effect [51,52].
The first stage involves the preparation of a flat model, which is subject to analysis in order to determine its geometric and kinetostatic features [53]. The performed analysis must meet the design guidelines. The data are analyzed in the form of dimensioned elements of the powered support section. The second stage covers the scope of strength analysis and determination of boundary conditions. An adequately prepared model is generated in dedicated software [54], where it is subjected to stimulation. The third stage includes the preparation of the prototype and testing in a notified body [47,53].
After obtaining a positive opinion from the research laboratory, the production of powered support begins. The importance of the powered support section in the entire process [55,56] triggers the need to conduct a series of tests using modern methods [57,58,59] to optimize its strength parameters with the aim of improving safety in accordance with the PN-EN standards, as well as improving quality, efficiency and reduction of production cost.
This publication presents model strength tests of powered support sections with the use of numerical calculations. This work contains the examples of design solutions for the formation of the support in accordance with the standards and safety regulations. The analysis also took into account the working environment [60] of the machine and the conditions of interaction with other machines.
The purpose of this article is to determine the strength limits of the elements of powered support sections by means of numerical calculations. The tests will make it possible to get rid of defects and will allow design features to be given to the machine as early as at the design stage. Such activities will take into account the reduction of the costs of creating a prototype in accordance with the manufacturer’s and the user’s guidelines.
2. Materials and Methods
The load acting on the body may cause deformation of the structure. In case of reaching a load value exceeding the permissible values of individual elements of the structure, it may lead to destruction or irreversible deformation. The impact of the occurring deformations and stress depends on multiple factors regarding the type of material, the force affecting the structures and the condition of the machine [61,62,63].
Operations using calculation methods simulate the effect of load force on individual elements of the machine structure. These elements are subjected to load carrying capacity assessment, that is, strength assessment and deformation assessment, in accordance with the standards, regulations and manufacturer’s recommendations [64,65]. All these operations are meant to guarantee safety [66] and rigidity as well as limitation of economic losses of the machine. The computational methods use the principles of solid mechanics, where they use mathematical calculations [66,67] to describe the influence of the load by determining the state of deformations and stress of the machine and mutual interactions, taking into account the material properties of the structure [68,69]. The determination of the properties of continuity, homogeneity, isotropy and elasticity of the material allows specifying mathematical dependencies [70]. When it takes into account the mechanical properties of the material and the analysis of computational methods, the machine’s operation is able to limit the formation of permanent deformations.
According to the guidelines concerning the strength of the materials, the body subjected to a load force is deformed. The deformations can be divided into elastic and plastic. The elastic deformations do not change the shape of the structure elements after removing the load force affecting the mechanical properties. In case of plastic deformation, the permanent deformation which affects the structure from the very beginning occurs. Only after reaching the permissible values, called the limit of elasticity, it damages the structure [71]. When focusing on deformations in steel structures, it is taken into consideration that due to the deformation mechanisms, the material is a part of the elastic–plastic group.
The deformation intensity, which is a measure of deformation, determines the changes in the dimensions of the length and is given by the formula:
where:
—deformation (%);
l—distance between the assumed points before material deformation (mm);
—the sum of the distance between the points created after the deformation of the material (mm), and changes in the dimensions of the angle:
where:
γ—value of the deformation angle (°);
—points marked on the material before deformation;
—the difference in the position of the points marked on the material after deformation.
The change in length is the result of a loosening of the body structure, and the change in form is the result of a slip, i.e., shifting the layer of atoms one after another. The state of deformation in the vicinity of the point, e.g., O, will be described by the quantities ε and γ in all directions, with point O as the reference point [72,73,74]. In addition, the deformations can be purely of the volumetric type while meeting the following conditions:
where:
—measures of component angles (°).
where:
—components of the deformations (%);
and purely figural under the following conditions:
where:
—cos angles of deformation components;
—the sum of the displacement (mm).
where:
—components of the deformations (%).
The powered support section is constructed in such a way that the structural elements balance the load force, affecting its operational elements. The rock mass, which in addition is an anisotropic body, and the activities related to the functioning of the machine, have an influence on the operation of the support. The force load is divided into permanent, variable and resulting from the environment. It is obvious that during the analysis from the set of possible load combinations, one should take into account the sets of load force causing the most unfavorable systems of force and moments, both for the components and the entire structure [72,73,74].
2.1. Calculation Model for the Limit of Elasticity
The calculation model for the limits of elasticity takes into account the stress of the force impacting the powered support and shows the creation of elastic deformations in the model. The position of elementary body particles exposed to external force has an influence on the stress value. In addition, deformations are conditioned by the characteristics of the material from which the structure is made. This leads to following arbitrary formulas:
where:
—stress values (MPa);
—values of the deformation function (%).
Data on the functions f of the interdependencies of σ on ε are obtained by conducting adequate strength tests, in accordance with the standards and regulations for the safe use of machines and devices [74].
Elastic–plastic materials, in this case elements of the powered support section, are subjected to the following tests:
- Static load tests:
- -
- Under bending load capacity test;
- -
- Under compressive and tensile load capacity test;
- -
- Elements for mounting props and cylinders under compressive and pulling load capacity test;
- -
- Working load capacity;
- -
- In the case of a mine crib support with a horizontal load;
- -
- In the case of a shielding support with a horizontal load;
- -
- With an asymmetric load.
- Cyclic endurance tests:
- -
- Bending;
- -
- Twisting [45].
From the tests of the dependence σ = f(ε), certain material properties, called the material strength properties, can be observed if they relate to the entire test or the material elasticity properties and if they refer to the area of elastic deformations.
2.2. Calculation Model for the Yield Point
The implementation of the computational model including the yield limits allows one to obtain the values describing the average properties of the material at the design stage and describes with a certain accuracy the phenomena that occur in the material in reality. Exceeding the yield point leads to permanent deformations as a result of which the machine is damaged and prevents its further functioning in the longwall excavation. The yield point is one of the values of a material’s endurance [61].
The diagram of the limits of elasticity (Figure 2) presents the way in which a given material behaves when impacted by load force. The values of the behavior of the tested steel were superimposed on the basic values of the elasticity limits of a given material by presenting a preview of the moment of exceeding the permissible values of elasticity and plasticity of structural elements of the powered support section. The operation was carried out for the purpose of comparison.
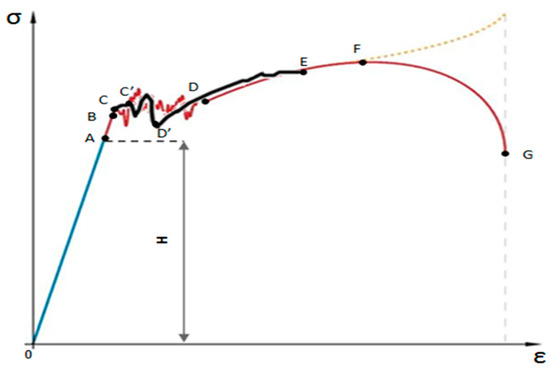
Figure 2.
Graph of the strength limits of the tested material, where A—proportionality limit, B—elasticity limit, C—yield point, C’—yield point for steel, D—material hardening, D’—steel hardening, E—temporary steel endurance, F—ad hoc endurance, G—breaking the material, H—Hook’s Law, Blue Line—scope of Hook’s Law, Red Line—range of nonlinear unsteady and plastic deformations, Yellow Line—Stress with consideration of the constriction, Black Line—The range of nonlinear intractable and ductile deformations for steel.
The limit of proportionality determines the moment (A) in which there was no change in the structure of material and that maintains the linearity between deformation and stress. In contrast, the elasticity limit (B) shows the lack of linearity between stress and deformation. The sample deforms but returns to its original shape. This means that the elastic energy is completely returned. For the yield point (C) and for steel (C’), at the moment of applying stress, the plastic deformation becomes visible, which after removing the stress does not return to its original state. The area between points CD, and for the value of steel C’-D’, is the material flow moment. Strengthening of the material (D) and steel (D’) takes place at the moment of a certain inhibition of the creation of slips. During this time, from point D and D’, it is necessary to increase the stress in order to increase the deformation or destruction of the material. The phenomenon of temporary strength for steel (E) and for reference material (F) is the point of state at which the stress is no longer homogeneous.
Point (G) marks the point of rupture, the loss of physical properties of the material. The range we are interested in for material strength is the one highlighted in blue (Blue Line). This is the range of elastic deformation of a material, i.e., where the material will return to its form after the external force disappears. The range (Red/Black Line) defines the elastic limits. In this area, if the stresses exceed the permissible value, permanent deformation will occur in the material. The range (Yellow Line) defines the absence of a momentary increase in stress; we have the material transitions to a plastic state. When the stress is further increased, it causes a nonlinear increase in strain until a noticeable local constriction called a neck occurs.
In the tested samples, there is a concentration of slips in one place, visualized in the form of a local narrowing [57,64]. Avoiding the phenomenon in point E, F requires the designer to take measures to prevent exceeding the permissible values in order to meet the safety requirements of the support structure.
Taking into account the above calculation models for the limits of elasticity and plasticity of the support, the support was subjected to numerical tests. The model determines geometric and kinetostatic features. The model of the 3D section is made in dedicated software [54]. It defines the design guidelines and material properties for the production of individual elements of the support at the design stage. The simulation included applying load force on individual elements, and it indicated strategic places where there was the greatest probability of exceeding the permissible values. Withdrawal from the design procedures may lead to permanent damage, the result of which is the inability to use the support section for further operation.
3. Results
Based on the data regarding the powered support, which are presented in Table 1, model tests of strength limits of its elements were performed with the use of dedicated software [54]. The tested powered support is a two-rack chock shield support with a lemniscate mechanism for guiding the canopy. The basic parameters of the support are shown below.

Table 1.
Parameters of the tested section of powered support.
While conducting the project research, a modern prototyping system was used [53]. The assumed result of the design research is achieving the highest possible strength values of the structure elements of the powered support tested section in the 3D model, which is shown in Figure 3. For this purpose, a model of the support section was developed and due to existing experience and knowledge, was enriched with elements and features allowing achieving the appropriate level of safety according to the standards [67] of the prototype.
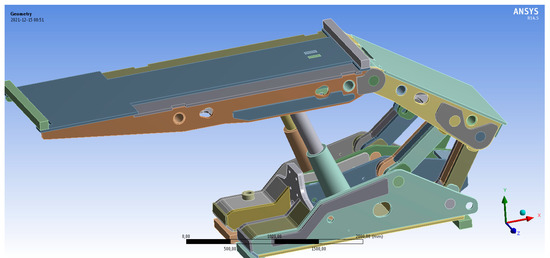
Figure 3.
The 3D model of the support section.
3.1. Development of a Model for Analysis
The first stage of the numerical analysis of the powered support section was to prepare a flat model in order to determine its geometric and kinetostatic features. After determining the dimensions of the structure, taking into account the operation range, the support’s model was validated, and the geometry of the kinematic chain was calculated [56]. The physical parameters of the support were determined: load carrying capacity, internal forces affecting the support, the angle of the canopy, the angle of friction and the force affecting the shield support, respectively. Taking into account the calculations of the flat model [53], the 3D model was made in special software, shown in Figure 4, enabling a computer-based solution of the problem [54].
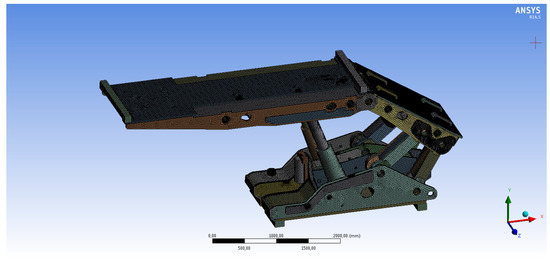
Figure 4.
The 3D model of the support section with a numerical grid.
This software made it possible to verify visually and kinematically the operation of the support in its full height range [58,75]. It also helped to verify a possible collision of the support’s components with other machines of the longwall complex. The analysis had to meet the design guidelines. The data were subjected to numerical calculations in the form of dimensioned elements of the powered support section. The geometry of the calculation area was set, then a numerical grid covering the calculation area was generated (Figure 4) and the type of boundary conditions was determined [54].
The 3D model prepared in this way made it possible to calculate the strength value of the support section at any point in the calculation area.
3.2. Research Analysis of the Research Model
The conducted analysis of the model of a powered support section assumed the application of forces acting on its elements with the minimum to maximum value, in accordance with the guidelines included in the standards [76]. The methods of applying load force and the number of cycles, which must be performed by the support before being allowed to operate, have been defined [47,53] according to the standard [76]. The requirements set by the standard guidelines reflect the load requirements in real conditions. The support was subjected to simulation (Figure 5) in dedicated software, which allowed for the calculation of reduced stress at a selected point according to the Huber–Mises–Hencky hypothesis. This hypothesis assumes that the measure of the stress of material subjected to load force is the energy of the shear deformation associated with the change in the shape of material [54,75].
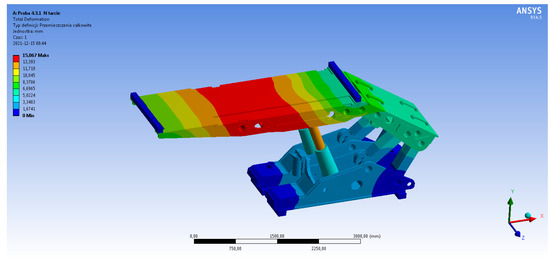
Figure 5.
Load force simulation of the support’s canopy.
The results obtained in the simulation of the canopy element did not meet the safety requirements defined by the standards [76] and the manufacturer. In order to improve the strength of the canopies, geometric adjustments were made, which allowed for more effective use of the material and increased its strength. The effect of these operations is presented in Figure 6.
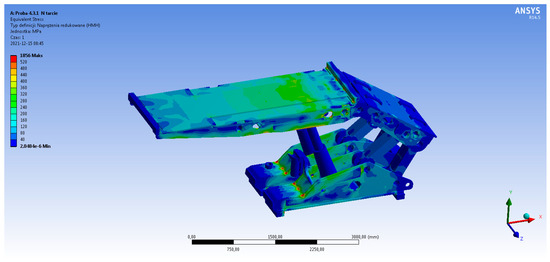
Figure 6.
Load force simulation of the support’s canopy—correction.
Properly selected elements were fastened in place with beam nodes and a grid was created (Figure 7). The force values were successively assigned at the appropriate angle. The result of the strength analysis was the creation of a map drawn on a finite element grid. These maps illustrated the number of cycles after which a crack will occur in a given area (Figure 8).
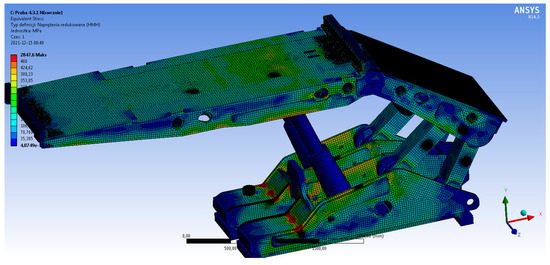
Figure 7.
Stress analysis on a finite element grid.
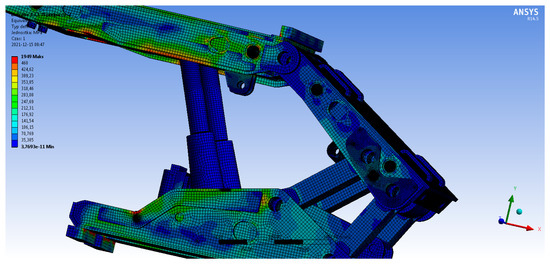
Figure 8.
Stress analysis on a finite element grid—support’s canopy.
The results of the analysis showed places exposed to plasticization or material breaking in the part of the canopy and floor [61,71]. These points are located in the places where elements connect, such as welds and notches of individual elements of the support section (Figure 9 and Figure 10).
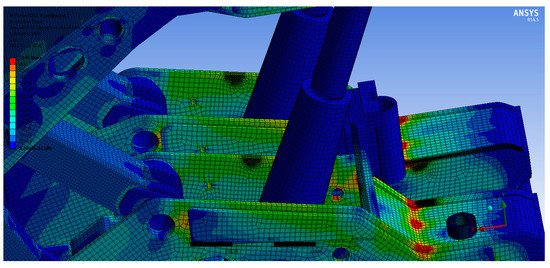
Figure 9.
Stress analysis on a finite element grid—floor.
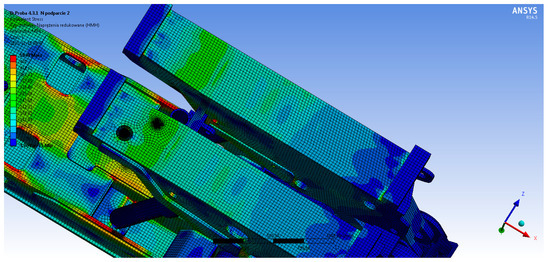
Figure 10.
Stress analysis on a finite element grid—floor.
The strength analysis is able to determine a possible change in terms of structure or material [47]. The procedures related to the change of material or geometric and construction elements required repeating computational analysis to obtain a result that meets the requirements. The purpose of the analysis is to define guidelines ensuring failure-free operation of the powered support section, taking into account at the same time the costs of production and operation. The performed tests are supposed to reflect the underground operating conditions of the powered support section.
The result of the performed design activities is the creation of a prototype of the housing section, which is subjected to laboratory tests. These tests are carried out in accordance with the requirements of the Machinery Directive and other standards [45]. A positive test result would be the basis for the implementation of the prototype and the commencement of the bench tests.
4. Discussion
Initially, the research was based on giving the prepared flat model geometric and kinetostatic features in order to create a spatial model of the powered support section. The 3D model was subjected to calculations specifying the limits of elasticity and plasticity. For this purpose, the method of numerical calculations was used, taking into account the basic formulas included in the article. The calculations were made with the use of dedicated software, which allowed us to model and simulate the effect of stress [54]. The elements of the powered support section were subjected to load force that may occur in real conditions.
Before starting the model endurance tests, the working hypothesis was enriched with specification of the type of material used and the location of additional structural elements. The hypothesis resulted from the experience of designers and the knowledge acquired while designing powered supports with similar parameters.
The canopy of the powered support section was subjected to simulation, as shown in Figure 6. Higher strength values of this element were achieved. The type of material the support would be made of has been changed, thus meeting safety standards. The effect of this operation is shown in Figure 7. The section elements are connected in space with nodes and a grid is created (Figure 8). This narrows the area of applying the force affecting particular places in the model machine. The force values applied at an appropriate angle were used to perform an endurance analysis of the given cycles after which possible changes in the elasticity or plasticity limits of the material would occur. The tests were performed until the model met the permissible number of cycles, which were required by the safety standards. During the analysis, the places marked in red turned out to be (Figure 9 and Figure 10) most exposed to stress in real conditions. The resulting model, having been subjected to numerical analysis while meeting the manufacturer’s guidelines and regulations, is the result of making a prototype, which was previously subjected to bench tests. The development of the study model and the analysis of the results during the conducted research were divided into several stages, which are shown in Figure 11:
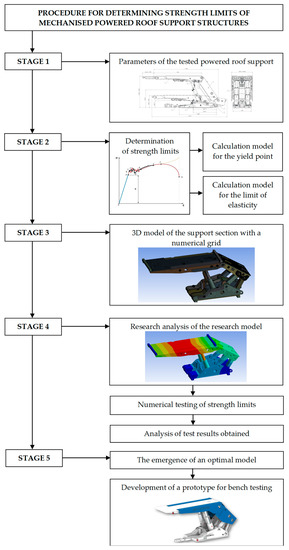
Figure 11.
Steps in the analysis conducted.
5. Conclusions
The analyzed spatial model of the powered support presupposed additional structural elements and given material properties in order to increase the strength. These factors were specified by numerical calculations. The places most exposed to possible damage resulting from exceeding the allowable stress values were designated. The data from the performed support’s load force cycles showed that the machine meets the strength requirements.
The main disadvantage of the MES test performed is the need to control the numerical error. This error can be due to grid density, changes in boundary conditions and material properties, time step, and others. This drawback, however, is acceptable for all numerical methods. The limitations were due to the ability to analyze the test model, with only one program to determine the strength limits.
The keynote of the model endurance tests was to achieve safety and quality requirements while reducing production costs. The structural elements of the machine were designed in such a way that they would be able to meet the requirements of safety standards. The reduction of production costs included the implementation of one prototype subjected to bench tests in a research laboratory. It is possible only when the model is properly designed.
The performance of model endurance tests already at the design stage showed us the advantages and disadvantages of the structure. Eliminating defects and providing design features made it possible to obtain the optimal model. On the basis of the numerical model, a prototype was created, which was successfully subjected to bench tests.
Author Contributions
Conceptualization, D.S. and K.T.; methodology, D.S. and S.Z.; software, K.T.; validation, J.P., H.G. and J.G.; formal analysis, D.S.; investigation, D.S.; resources, K.T. and J.G.; data curation, S.Z. and D.S.; writing—original draft preparation, D.S., K.T. and S.Z.; writing—review and editing, D.S. and S.Z.; visualization, K.T.; supervision, D.S.; project administration, D.S. and S.Z.; funding acquisition, D.S. and S.Z. All authors have read and agreed to the published version of the manuscript.
Funding
This research received no external funding.
Institutional Review Board Statement
The study was conducted according to the guidelines of the Declaration.
Informed Consent Statement
Not applicable.
Data Availability Statement
Not applicable.
Conflicts of Interest
The authors declare no conflict of interest.
References
- Bortnowski, P.; Gładysiewicz, L.; Król, R.; Ozdoba, M. Energy Efficiency Analysis of Copper Ore Ball Mill Drive Systems. Energies 2021, 14, 1786. [Google Scholar] [CrossRef]
- Wajs, J.; Trybała, P.; Górniak-Zimroz, J.; Krupa-Kurzynowska, J.; Kasza, D. Modern Solution for Fast and Accurate Inventorization of Open-Pit Mines by the Active Remote Sensing Technique—Case Study of Mikoszów Granite Mine (Lower Silesia, SW Poland). Energies 2021, 14, 6853. [Google Scholar] [CrossRef]
- Wodecki, J.; Góralczyk, M.; Krot, P.; Ziętek, B.; Szrek, J.; Worsa-Kozak, M.; Zimroz, R.; Śliwiński, P.; Czajkowski, A. Process Monitoring in Heavy Duty Drilling Rigs—Data Acquisition System and Cycle Identification Algorithms. Energies 2020, 13, 6748. [Google Scholar] [CrossRef]
- Borkowski, P.J. Comminution of Copper Ores with the Use of a High-Pressure Water Jet. Energies 2020, 13, 6274. [Google Scholar] [CrossRef]
- Góralczyk, M.; Krot, P.; Zimroz, R.; Ogonowski, S. Increasing Energy Efficiency and Productivity of the Comminution Process in Tumbling Mills by Indirect Measurements of Internal Dynamics—An Overview. Energies 2020, 13, 6735. [Google Scholar] [CrossRef]
- Zimroz, P.; Trybała, P.; Wróblewski, A.; Góralczyk, M.; Szrek, J.; Wójcik, A.; Zimroz, R. Application of UAV in Search and Rescue Actions in Underground Mine—A Specific Sound Detection in Noisy Acoustic Signal. Energies 2021, 14, 3725. [Google Scholar] [CrossRef]
- Ziętek, B.; Banasiewicz, A.; Zimroz, R.; Szrek, J.; Gola, S. A Portable Environmental Data-Monitoring System for Air Hazard Evaluation in Deep Underground Mines. Energies 2020, 13, 6331. [Google Scholar] [CrossRef]
- Krauze, K.; Mucha, K.; Wydro, T.; Pieczora, E. Functional and Operational Requirements to Be Fulfilled by Conical Picks Regarding Their Wear Rate and Investment Costs. Energies 2021, 14, 3696. [Google Scholar] [CrossRef]
- Kotwica, K.; Stopka, G.; Kalita, M.; Bałaga, D.; Siegmund, M. Impact of Geometry of Toothed Segments of the Innovative KOMTRACK Longwall Shearer Haulage System on Load and Slip during the Travel of a Track Wheel. Energies 2021, 14, 2720. [Google Scholar] [CrossRef]
- Kumar, R.; Singh, A.K.; Mishra, A.K.; Singh, R. Underground mining of thick coal seams. Int. J. Min. Sci. Technol. 2015, 25, 885–896. [Google Scholar] [CrossRef]
- Jixiong, Z.; Spearing, A.J.S.; Xiexing, M.; Shuai, G.; Qiang, S. Green coal mining technique integrating mining-dressing-gas draining-backfilling-mining. Int. J. Min. Sci. Technol. 2017, 27, 17–27. [Google Scholar]
- Bazaluk, O.; Slabyi, O.; Vekeryk, V.; Velychkovych, A.; Ropyak, L.; Lozynskyi, V. A Technology of Hydrocarbon Fluid Production Intensification by Productive Stratum Drainage Zone Reaming. Energies 2021, 14, 3514. [Google Scholar] [CrossRef]
- Adach-Pawelus, K.; Pawelus, D. Influence of Driving Direction on the Stability of a Group of Headings Located in a Field of High Horizontal Stresses in the Polish Underground Copper Mines. Energies 2021, 14, 5955. [Google Scholar] [CrossRef]
- Zabiciak, A.; Michalczyk, R. Wyznaczenie Stanów Naprężeń i Odkształceń w Mechanistycznych Projektowaniu Nawierzchni Poddatnych (Computation of Stress and Strain States for Mechanistic Design of Flexible Pavements). 2011. Available online: https://www.researchgate.net/publication/263414437 (accessed on 30 January 2022).
- Klishin, V.I.; Klishin, S.V. Coal Extraction from Thick Flat and Steep Beds. J. Min. Sci. 2010, 46, 149–159. [Google Scholar] [CrossRef]
- Dlouhá, D.; Dubovský, V. The improvement of the lake Most evaporation estimates. Inż. Miner. 2019, 21, 159–164. [Google Scholar]
- Bazaluk, O.; Velychkovych, A.; Ropyak, L.; Pashechko, M.; Pryhorovska, T.; Lozynskyi, V. Influence of Heavy Weight Drill Pipe Material and Drill Bit Manufacturing Errors on Stress State of Steel Blades. Energies 2021, 14, 4198. [Google Scholar] [CrossRef]
- Woźniak, D.; Hardygóra, M. Method for laboratory testing rubber penetration of steel cords in conveyor belts. Min. Sci. 2020, 27, 105–117. [Google Scholar] [CrossRef]
- Bajda, M.; Błażej, R.; Hardygóra, M. Optimizing splice geometry in multiply conveyor belts with respect to stress in adhesive bonds. Min. Sci. 2018, 25, 195–206. [Google Scholar] [CrossRef]
- Grzesiek, A.; Zimroz, R.; Śliwiński, P.; Gomolla, N.; Wyłomańska, A. A Method for Structure Breaking Point Detection in Engine Oil Pressure Data. Energies 2021, 14, 5496. [Google Scholar] [CrossRef]
- Patyk, M.; Bodziony, P.; Krysa, Z. A Multiple Criteria Decision-Making Method to Weight the Sustainability Criteria of Equipment Selection for Surface Mining. Energies 2021, 14, 3066. [Google Scholar] [CrossRef]
- Janus, J.; Krawczyk, J. Measurement and Simulation of Flow in a Section of a Mine Gallery. Energies 2021, 14, 4894. [Google Scholar] [CrossRef]
- Huang, P.; Spearing, S.; Ju, F.; Jessu, K.V.; Wang, Z.; Ning, P. Control Effects of Five Common Solid Waste Backfilling Materials on In Situ Strata of Gob. Energies 2019, 12, 154. [Google Scholar] [CrossRef]
- Prostański, D. Empirical Models of Zones Protecting Against Coal Dust Explosion. Arch. Min. Sci. 2017, 62, 611–619. [Google Scholar] [CrossRef]
- Mo, S.; Tutuk, K.; Saydam, S. Management of floor heave at Bulga Underground Operations—A case study. Int. J. Min. Sci. Technol. 2019, 29, 73–78. [Google Scholar] [CrossRef]
- Juganda, A.; Strebinger, C.; Brune, J.F.; Bogin, G.E. Discrete modeling of a longwall coal mine gob for CFD simulation. Int. J. Min. Sci. Technol. 2020, 30, 463–469. [Google Scholar] [CrossRef]
- Dlouhá, D.; Dubovský, V.; Pospíšil, L. Optimal calibration of evaporation models against Penman-Monteith Equatíon. Water 2021, 13, 1484. [Google Scholar] [CrossRef]
- Dubovský, V.; Dlouhá, D.; Pospíšil, L. The calibration of evaporation models against the Penman-Monteith equation on lake Most. Sustainability 2021, 13, 313. [Google Scholar] [CrossRef]
- Hu, S.; Ma, L.; Guo, J.; Yang, P. Support-surrounding rock relationship and top-coal movement laws in large dip angle fully-mechanized caving face. Int. J. Min. Sci. Technol. 2018, 28, 533–539. [Google Scholar]
- Szurgacz, D.; Zhironkin, S.; Cehlár, M.; Vöth, S.; Spearing, S.; Liqiang, M. A Step-by-Step Procedure for Tests and Assessment of the Automatic Operation of a Powered Roof Support. Energies 2021, 14, 697. [Google Scholar] [CrossRef]
- Świątek, J.; Janoszek, T.; Cichy, T.; Stoiński, K. Computational Fluid Dynamics Simulations for Investigation of the Damage Causes in Safety Elements of Powered Roof Supports—A Case Study. Energies 2021, 14, 1027. [Google Scholar] [CrossRef]
- Rajwa, S.; Janoszek, T.; Prusek, S. Influence of canopy ratio of powered roof support on longwall working stability—A case study. Int. J. Min. Sci. Technol. 2019, 29, 591–598. [Google Scholar] [CrossRef]
- Xiaozhen, W.; Jialin, X.; Weibing, Z.; Yingchun, L. Roof pre-blasting to prevent support crushing and water inrush accidents. Int. J. Min. Sci. Technol. 2012, 22, 379–384. [Google Scholar]
- Szurgacz, D. Dynamic Analysis for the Hydraulic Leg Power of a Powered Roof Support. Energies 2021, 14, 5715. [Google Scholar] [CrossRef]
- Buyalich, G.; Buyalich, K.; Byakov, M. Factors Determining the Size of Sealing Clearance in Hydraulic Legs of Powered Supports. E3S Web Conf. Second. Int. Innov. Min. Symp. 2017, 21, 3018. [Google Scholar] [CrossRef]
- Buyalich, G.; Byakov, M.; Buyalich, K. Factors Determining Operation of Lip Seal in the Sealed Gap of the Hydraulic Props of Powered Supports. E3S Web Conf. IIIrd Int. Innov. Min. Symp. 2018, 41, 1045. [Google Scholar] [CrossRef]
- Buyalich, G.; Byakov, M.; Buyalich, K.; Shtenin, E. Development of Powered Support Hydraulic Legs with Improved Performance. E3S Web Conf. VIrd Int. Innov. Min. Symp. 2019, 105, 3025. [Google Scholar] [CrossRef]
- Wang, J.; Wang, Z. Systematic principles of surrounding rock control in longwall mining within thick coal seams. Int. J. Min. Sci. Technol. 2019, 29, 591–598. [Google Scholar] [CrossRef]
- Ji, Y.; Ren, T.; Wynne, P.; Wan, Z.; Zhaoyang, M.; Wang, Z. A comparative study of dust control practices in Chinese and Australian longwall coal mines. Int. J. Min. Sci. Technol. 2016, 25, 687–706. [Google Scholar] [CrossRef]
- Peng, S.S.; Feng, D.; Cheng, J.; Yang, L. Automation in U.S. longwall coal mining: A state-of-the-art review. Int. J. Min. Sci. Technol. 2019, 29, 151–159. [Google Scholar] [CrossRef]
- Ralston, J.C.; Reid, D.C.; Dunn, M.T.; Hainsworth, D.W. Longwall automation: Delivering enabling technology to achieve safer and more productive underground mining. Int. J. Min. Sci. Technol. 2015, 25, 865–876. [Google Scholar] [CrossRef]
- Ralston, J.C.; Hargrave, C.O.; Dunn, M.T. Longwall automation: Trends, challenges and opportunities. Int. J. Min. Sci. Technol. 2017, 27, 733–739. [Google Scholar] [CrossRef]
- Stoiński, K.; Mika, M. Dynamics of Hydraulic Leg of Powered Longwall Support. J. Min. Sci. 2003, 39, 72–77. [Google Scholar] [CrossRef]
- Frith, R.C. A holistic examination of the load rating design of longwall shields after more than half a century of mechanised longwall mining. Int. J. Min. Sci. Technol. 2015, 26, 199–208. [Google Scholar] [CrossRef]
- CSN-EN 1804-1; Machines for Underground Mining. Safety Requirements for Powered Roof Support—Part 1: Support Units and General Requirements. Czech Office for Standards, Metrology and Testing: Praha, Czech Republic, 2020.
- Doroszuk, B.; Król, R. Conveyor belt wear caused by material acceleration in transfer stations. Min. Sci. 2019, 26, 189–201. [Google Scholar] [CrossRef]
- Stoiński, K. Mining Roof Support in Hazardous Conditions of Mining Tremors; Collective Work for Editing Kazimierza Stoińskiego; The Central Mining Institute: Katowice, Poland, 2018. [Google Scholar]
- Zhao, X.; Li, F.; Li, Y.; Fan, Y. Fatigue Behavior of a Box-Type Welded Structure of Hydraulic Support Used in Coal Mine. Materials 2015, 8, 6609–6622. [Google Scholar] [CrossRef]
- Zhou, R.; Meng, L.; Yuan, X.; Qiao, Z. Research and Experimental Analysis of Hydraulic Cylinder Position Control Mechanism Based on Pressure Detection. Machines 2022, 10, 1. [Google Scholar] [CrossRef]
- Juárez-Ferreras, R.; González-Nicieza, C.; Menéndez-Díaz, A.; Álvarez-Vigil, A.E.; Álvarez-Fernández, M.I. Measurement and analysis of the roof pressure on hydraulic props in longwall. Int. J. Coal Geol. 2008, 75, 49–62. [Google Scholar] [CrossRef]
- Toraño, J.; Diego, I.; Menéndez, M.; Gent, M. A finite element method (FEM)—Uzzy logic (Soft Computing)—Virtual reality model approach in a coalface longwall mining simulation. Autom. Constr. 2008, 17, 413–424. [Google Scholar] [CrossRef]
- Ren, H.; Zhang, D.; Gong, S.; Zhou, K.; Xi, C.; He, M.; Li, T. Dynamic impact experiment and response characteristics analysis for 1:2 reduced-scale model of hydraulic support. Int. J. Min. Sci. Technol. 2021, 31, 347–356. [Google Scholar] [CrossRef]
- Qiao, S.; Zhang, Z.; Zhu, Z.; Zhang, K. Influence of cutting angle on mechanical properties of rock cutting by conical pick based on finite element analysis. J. Min. Sci. 2021, 28, 161–173. [Google Scholar]
- ANSYS. Approval for Use in Accordance with the License. Released to the User of the Company. 2016. Available online: https://www.ansys.com/2021.01.28 (accessed on 30 January 2022).
- Król, R.; Kisielewski, W. Research of loading carrying idlers used in belt conveyor-practical applications. Diagnostyka 2014, 15, 67–74. [Google Scholar]
- Szurgacz, D.; Zhironkin, S.; Vöth, S.; Pokorný, J.; Spearing, A.J.S.; Cehlár, M.; Stempniak, M.; Sobik, L. Thermal Imaging Study to Determine the Operational Condition of a Conveyor Belt Drive System Structure. Energies 2021, 14, 3258. [Google Scholar] [CrossRef]
- Bajda, M.; Hardygóra, M. Analysis of Reasons for Reduced Strength of Multiply Conveyor Belt Splices. Energies 2021, 14, 1512. [Google Scholar] [CrossRef]
- Gładysiewicz, L.; Król, R.; Kisielewski, W.; Kaszuba, D. Experimental determination of belt conveyors artificial friction coefficient. Acta Montan. Slov. 2017, 22, 206–214. [Google Scholar]
- Kawalec, W.; Suchorab, N.; Konieczna-Fuławka, M.; Król, R. Specific energy consumption of a belt conveyor system in a continuous surface mine. Energies 2020, 13, 5214. [Google Scholar] [CrossRef]
- Pokorny, J.; Dlouhá, D.; Kucera, P. Study of the necessity of use virtual origin in assessment of selected fire plume characteristics. MM Sci. J. 2016, 5, 1424–1428. [Google Scholar] [CrossRef]
- Brzoska, Z. Strength of Materials; PWN: Warsaw, Poland, 1972; pp. 33–49. [Google Scholar]
- Leyko, J. General Mechanics; PWN: Warsaw, Poland, 2021; pp. 53–59. [Google Scholar]
- Uth, F.; Polnik, B.; Kurpiel, W.; Baltes, R.; Kriegsch, P.; Clause, E. An innovate person detection system based on thermal imaging cameras dedicate for underground belt conveyors. Min. Sci. 2019, 26, 263–276. [Google Scholar] [CrossRef]
- Dlouhá, D.; Pokorný, J.; Dlouhá, K. Necessity of knowledge about math in safety engineering. In Proceedings of the 14th Conference E-Learning: Unlocking the Gate to Education around the Globe, Prague, Czech Republic, 20–21 June 2019; pp. 380–386. [Google Scholar]
- Dlouhá, D.; Kozlová, K. Knowledge assessment of student’s high school mathematics. In Proceedings of the 17th Conference on Applied Mathematics (APLIMAT 2019), Bratislava, Slovak Republic, 5–7 February 2019; Volume 1, pp. 243–252. [Google Scholar]
- Hamříková, R.; Dlouhá, D. Video tutorials for students of the master’s program. In Proceedings of the 12th Conference Open Education as a Way to a Knowledge Society, Prague, Czech Republic, 26–27 June 2017; pp. 446–451. [Google Scholar]
- Ji, Y.; Zhang, Y.; Huang, Z.; Shao, Z.; Gao, Y. Theoretical analysis of support stability in large dip angle coal seam mined with fully-mechanized top coal caving. Min. Sci. 2020, 27, 73–87. [Google Scholar] [CrossRef]
- Kawalec, W.; Błażej, R.; Konieczna, M.; Król, R. Laboratory Tests on e-pellets effectiveness for ore tracking. Min. Sci. 2018, 25, 7–18. [Google Scholar] [CrossRef]
- Baiul, K.; Khudyakov, A.; Vashchenko, S.; Krot, P.V.; Solodka, N. The experimental study of compaction parameters and elastic after-effect of fine fraction raw materials. Min. Sci. 2020, 27, 7–18. [Google Scholar] [CrossRef]
- Dlouhá, D.; Hamříková, R. Interactive distance materials of mathematics for VŠB-TU Ostrava. In Proceedings of the 13th Conference Overcoming the Challenges and the Barriers in Open Education, Prague, Czech Republic, 25–26 June 2018; pp. 67–72. Available online: https://www.fast.vsb.cz/230/cs/Veda-a-vyzkum/Publikace/2018/ (accessed on 30 January 2022).
- Andrzejewski, S. Mechanical Engineer’s Guidebook; Scientific and Technical Publishing House: Warsaw, Poland, 1968; pp. 73–89. [Google Scholar]
- Dlouhá, D.; Hamříková, R. Our experience with the involvement of students in the creation of study materials. In Proceedings of the 17th Conference on Applied Mathematics (APLIMAT 2019), Bratislava, Slovak Republic, 5–7 February 2019; Volume 1, pp. 301–308. [Google Scholar]
- Pokorny, J.; Mozer, V.; Malerova, L.; Dlouhá, D.; Wilkinson, P. A simplified method for establishing safe available evacuation time based on a descending smoke layer. Commun. Sci. Lett. Univ. Zilina 2018, 20, 28–34. [Google Scholar] [CrossRef]
- Misiak, J. Technical Mechanics; Scientific and Technical Publishing House: Warsaw, Poland, 1999; pp. 22–41. [Google Scholar]
- Siemieniec, A.; Wolny, S. Strength of Materials; Academy of Mining and Metallurgy Publishing House: Krakow, Poland, 1996; pp. 87–96. [Google Scholar]
- CSN-EN 1804-2; Machines for Underground Mining—Safety Requirements for Hydraulic Powered Roof Support—Part 2: Power Set Legs and Rams. Czech Office for Standards, Metrology and Testing: Praha, Czech Republic, 2020.


Publisher’s Note: MDPI stays neutral with regard to jurisdictional claims in published maps and institutional affiliations. |
© 2022 by the authors. Licensee MDPI, Basel, Switzerland. This article is an open access article distributed under the terms and conditions of the Creative Commons Attribution (CC BY) license (https://creativecommons.org/licenses/by/4.0/).