Article

Fractional Order PID Design for a Proton Exchange Membrane Fuel Cell System Using an Extended Grey Wolf Optimizer

by
Mohammed Yousri Silaa
1,*,
Oscar Barambones
1,*,
Mohamed Derbeli
1,
Cristian Napole
1,* and
Aissa Bencherif
2
1
Engineering School of Vitoria, University of the Basque Country UPV/EHU, Nieves Cano 12, 01006 Vitoria, Spain
2
Telecommunications Signals and Systems Laboratory (TSS), Amar Telidji University of Laghouat, BP 37G, Laghouat 03000, Algeria
*
Authors to whom correspondence should be addressed.
Processes 2022, 10(3), 450; https://doi.org/10.3390/pr10030450
Submission received: 31 January 2022 / Revised: 15 February 2022 / Accepted: 18 February 2022 / Published: 23 February 2022
(This article belongs to the Special Issue Modeling Approaches in Fuel Cells and Electrolyzers)

Abstract

:
This paper presents a comparison of optimizers for tuning a fractional-order proportional-integral-derivative (FOPID) and proportional-integral-derivative (PID) controllers, which were applied to a DC/DC boost converter. Grey wolf optimizer (GWO) and extended grey wolf optimizer (EGWO) have been chosen to achieve suitable parameters. This strategy aims to improve and optimize a proton exchange membrane fuel cell (PEMFC) output power quality through its link with the boost converter. The model and controllers have been implemented in a MATLAB/SIMULINK environment. This study has been conducted to compare the effectiveness of the proposed controllers in the transient, accuracy in tracking the reference current, steady-state, dynamic responses, overshoots, and response time. Results showed that the combination EGWO-FOPID had significant advantages over the rest of the optimized controllers.

1. Introduction

Nowadays, energy research mainly covers two issues. The first one is linked to the risk of depletion of fossil and fissile resources; the other is environmental. The sources used today are with limited reserves, for both fossil fuels (hydrocarbons, coal, etc.) and fissile fuels (uranium). The use of these energy sources also generates undesirable side effects: emission of greenhouse gases in the case of hydrocarbons and production of waste that is difficult to treat in the case of nuclear power [1,2]. Faced with the decrease in conventional energy resources, it has become essential to find energy alternatives with the same properties as hydrocarbons in terms of storage and transport [3]. In this context, hydrogen turns out to be an earnest candidate, even if it is only an energy carrier and not a primary resource. Hydrogen, which does not exist naturally, can indeed be synthesized through renewable energies. In addition, its function as an energy carrier, its storability can be exploited to meet the requirements set by energy consumers [4]. The fuel cells emerge as the missing link by transforming chemical energy into electrical energy with high efficiency [5]. Hence, they use the chemical energy of hydrogen and oxygen to generate electricity without pollution, and the other products are just plain water, and heat [6]. Scientists have already developed different types of fuel cells, characterized by the nature of the gases and electrolytes used, thereby determining their operating characteristics. Of all the existing families of fuel cells, the proton exchange membrane fuel cell (PEMFC) achieved the most attention from the researchers, which is considered the best appropriate for the automotive sector [7] and numerous fields [8,9,10]. The strong points of this fuel cells type are the relatively fast dynamic compared to other power generators and low operating temperature, from 40 °C to 100 °C, which facilitates its integration in a vehicle without specific thermal insulation [11,12]. As is common, hydrogen cells are nonlinear systems which are affected by mutable factors such as gases pressures and fluctuations of temperatures which eventually, reflect the output power. Consequently, to ensure an efficient power conversion from the PEMFC to the external circuit, an adaptation element is required, and this can be done by inserting an electronic device between the power generator and the electrical load. This device is a static DC/DC converter equipped with an insulated gate bipolar transistor (IGBT) or metal oxide semiconductor field effect transistor (MOSFET) controlled by a command law [13]. This candidate connection is one of the most widely used power electronics circuits thanks to its high conversion efficiency and adjustable output voltage [14]. These DC/DC converters are electronic devices designed to regulate the output voltage against the input voltage and load current changes through the control of pulse width modulation PWM of the switch. This leads to the requirement of more advanced control methods to meet actual demand. Many control methods are developed in the literature to control DC-DC converters. For instance, authors of [15] applied a controller type proportional integral (PI) based on Ziegler–Nichols (ZN) tuning method to a DC/DC boost converter in order to stabilize the PEMFC output current. The proposed controller guarantees better performance in terms of rising time, settling time, steady-state error, and robustness even with large load variations. However, due to the obtained results, sharps undershoot of 3 A and overshoot of 8 A appears, which results from the obtained ZN method aggressive parameters. The authors of [16] implemented two different conventional control based on PI and PID in order to optimize the DC-DC buck converter performance. The control scheme was based on the ZN tuning method and genetic algorithm (GA). Simulation results showed that the PI and PID controllers using the GA gave satisfactory results in terms of rising time, steady-state error, settling time, low overshoot and low undershoot better than the provided by the conventional ZN tuning method. The authors of [17] implemented the GWO tuning for PID controller for DC/DC boost converter under a GA-PID and PSO-PID. Simulation results showed that the proposed GWO-PID has a low root mean squared error (RMSE) compared to the other algorithms. The authors of [18] controlled a DC/DC converter type buck based on PID combined with sliding mod (PID-SMC) in comparison to conventional sliding mode. The obtained simulation results showed that the proposed controller is better than the conventional SMC controller in terms of dynamic, static performance, and strong robustness under the periodically and irregularly load resistances. The authors of [19] applied a backstepping approach to a DC/DC boost converter in order to keep the PEMFC power system work at an optimum power point. The comparison against the PI showed that the backstepping approach gives fast and sufficient converging to the operating power point. The authors of [20] applied a total sliding-mode control (TSMC) for the voltage control of a DC/DC boost converter. Simulation results proved that the TSMC have low transient response time and high robustness in comparison with the conventional PI control and the SMC. The authors of [21] applied a quasi continuous high order sliding mode controller (QC-HOSM) to a DC/DC boost converter linked to PEMFC in order to reduce the chattering effects of the conventional sliding mode. Experimental results showed that the proposed control technique can achieve a chattering reduction up to 84 % . The authors of [22] applied a robust integral fast terminal sliding mode combined with digital filter to a DC/DC boost converter in order to reduce the unwanted oscillation to improve the output power quality of the PEMFC. Experimental results showed that the proposed controller has significant advantages in term of rising time, robustness and a chattering reduction up to 91 % could be achieved. With respect to state of the art, the main contribution of this paper is the design and implementation of a fractional order proportional-integral-derivative optimized by an extended grey wolf optimizer (EGWO-FOPID) for enhancing the performance of the PEM fuel cell system. Comparison study with proportional-integral-derivative optimized by grey wolf optimizer (GWO-PID), fractional order proportional-integral-derivative optimized by grey wolf optimizer (GWO-FOPID), and proportional-integral-derivative optimized by an extended grey wolf optimizer (EGWO-PID), has been carried out in MATLAB/Simulink to validate the advantages of the proposed algorithm. Comparison results have demonstrated that the proposed controller can stabilize the PEMFC power system over the entire operating conditions and even in the presence of significant load variations. It has also been demonstrated that the proposed controller maintains the system’s robustness and provides better accuracy over the other controllers.
The remainder of the paper is organized as follows. In Section 2, we discuss the fuel-cell type proton exchange membrane, as well as the mathematical equations related to its work that show the performance of the cell. Section 3 is devoted to the control methodology design for the optimization of the PEMFC power system. Section 4 focuses on the simulation results.

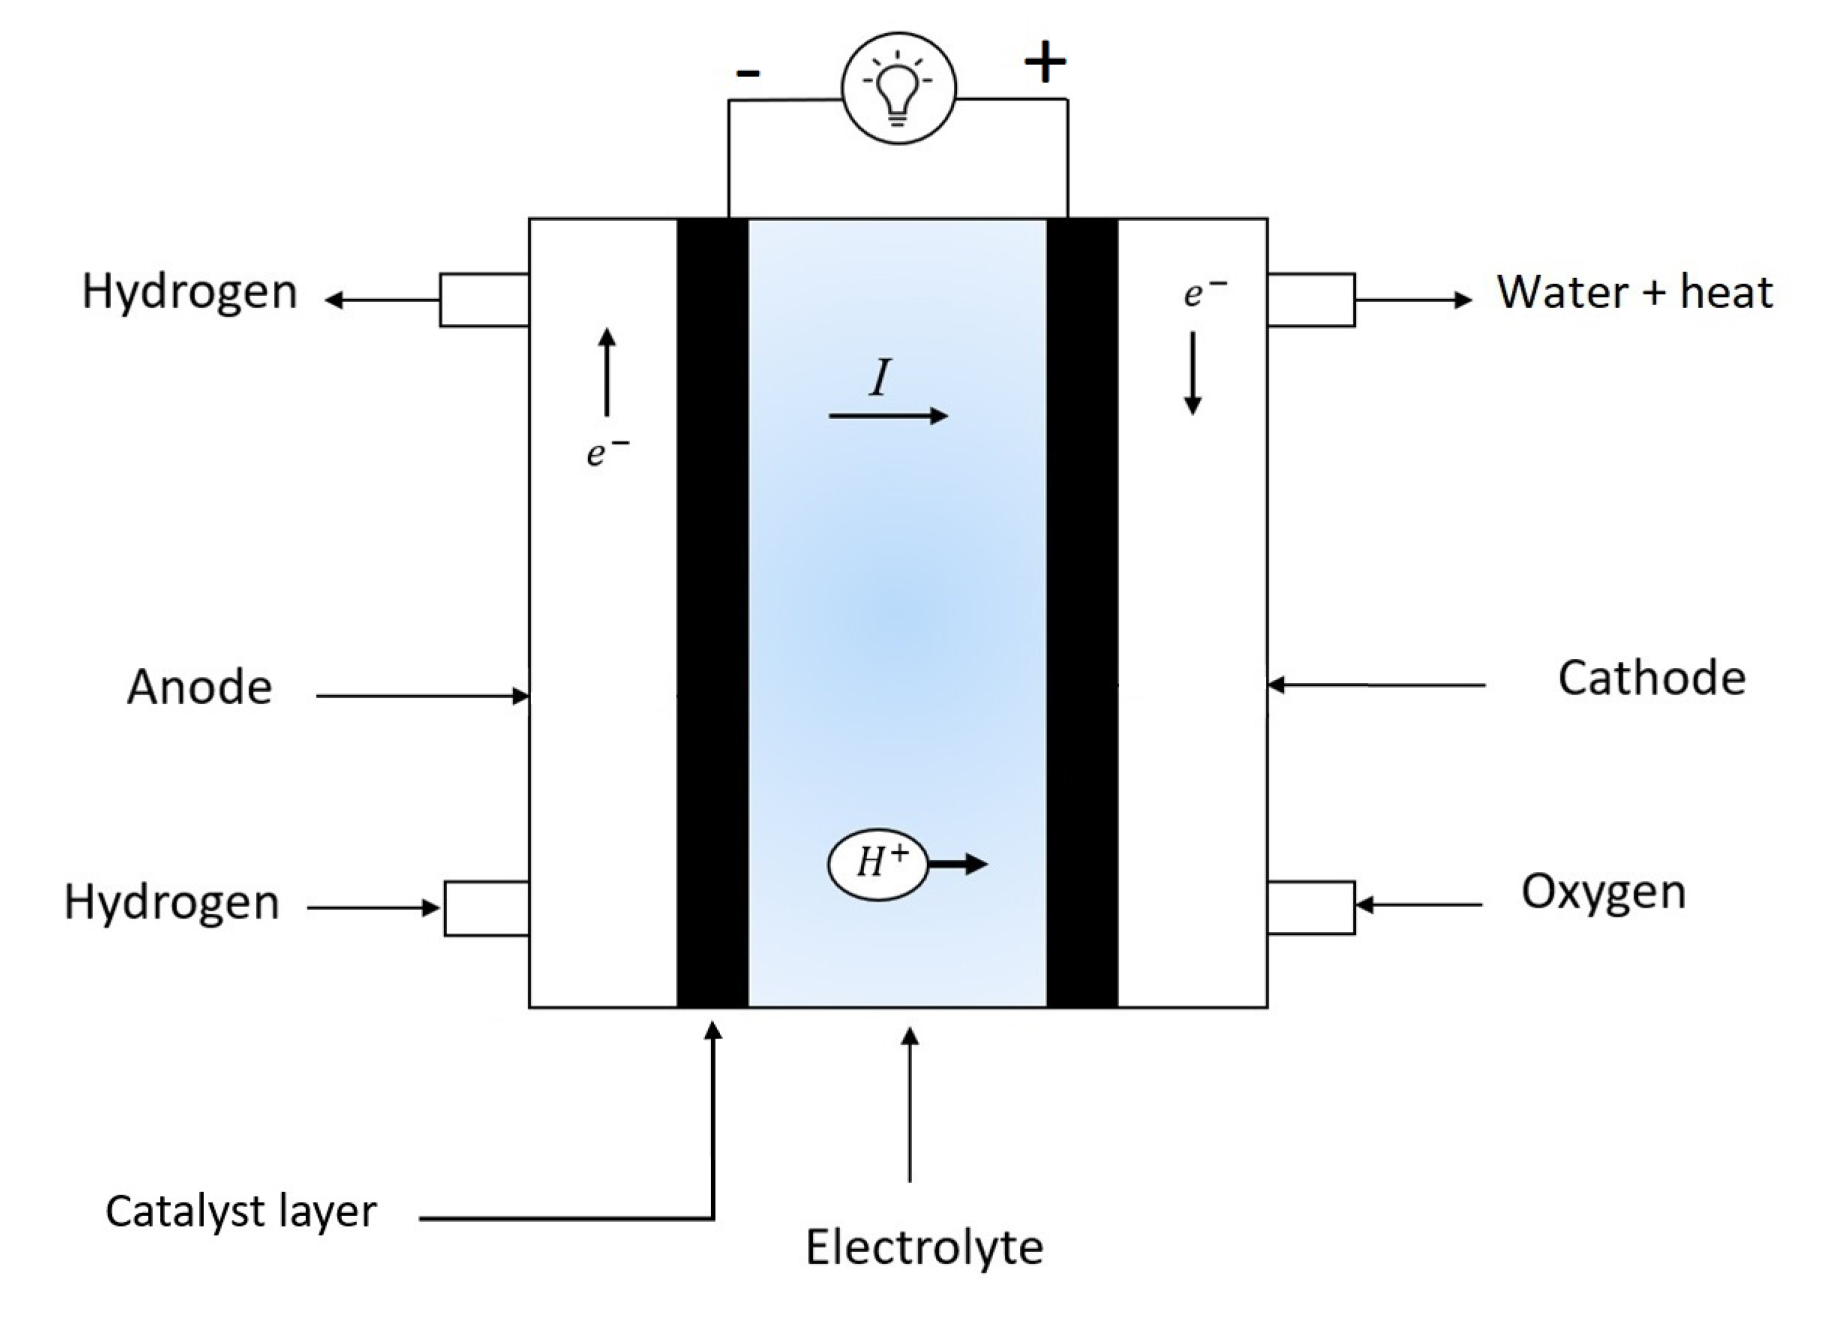
2. PEM Fuel Cell Modeling

As shown in Figure 1. A PEM fuel cell is a generator of electrical energy. It directly converts the chemical energy of the fuel (hydrogen) into electrical energy using the catalyst [23,24,25]. It is a system that produces no pollution and virtually no noise since it does not have any moving mechanical components, such as turbines and motors. In addition, an electric current is produced as long as the cell is jointly supplied with fuel (hydrogen) and oxidizer (oxygen in the air) [25]. That is what differentiates it from different power generators and other cells. The chemical reaction at the level of the PEMFC can be represented in the following Equations (1)–(3) [26,27].
Anode : 2 H 2 4 H + + 4 e
Cathode : 4 H + + O 2 + 4 e 2 H 2 O
Overall reaction : 2 H 2 + O 2 2 H 2 O + Energy + Heat
A single PEM fuel cell voltage V F C is the sum of four terms: the no-load voltage E N e r , the activation overvoltage V a c t (or activation drop), the ohmic overvoltage V o h m (or ohmic drop) and the overvoltage concentration V c o n (or drop in concentration), which are defined by the following expression [28]:
V F C = E N e r V a c t V o h m V c o n c

2.1. Nernst Potential

The chemical energy released can be calculated by the change in Gibbs free energy ( g f ), which is the difference between the energy of the products and the energy of the reactants. In the case of the PEMFC the variation of this free energy is given in Equation (5) [29,30]:
g f = ( g f ) p r o d u c t s ( g f ) r e a c t a n t s = ( g f ) 2 H 2 O ( g f ) 2 H 2 ( g f ) O 2
The variation of Gibbs free energy depends on temperature and pressure as given in Equation (6) [31]:
g f = g f 0 R T l n P H 2 P 1 2 O 2 P H 2 O
where g f is the variation of Gibbs free energy at standard conditions pressure 1 (bar), which depends on the temperature T expressed in Kelvin. P H 2 , P O 2 and P H 2 O are the pressures of hydrogen, oxygen and water vapor, respectively. R is the universal gas constant (8.31451 J·kg 1 ·K 1 ). For every hydrogen mole, two electrons pass by the external electrical circuit, and the electrical work is equal to the change in Gibbs free energy if the system has no lossless, the electrical work performed is given in Equation (7) [32]:
g f = n F E
where F is Faraday’s constant (96,485 Coulombs/mole), which represents the electric charge of an electron mole. n corresponds to the number of moles of electrons in the reaction. E is the open circuit voltage of the PEMFC. The PEMFC open circuit voltage can therefore be expressed as Equation (8) [31]:
E N e r = g f 2 F = g f 0 2 F + R T 2 F l n P H 2 P 1 2 O 2 P H 2 O
In practice, the operation of PEMFC is accompanied by losses, part of the chemical energy is converted into heat. The term g f 2 F varies depending on the operating point. It is equal to 1.229 volts at the standard state (25 °C) and 1 bar. We can express the tension E in the form [33]:
E N e r = 1.299 0.85 · 10 3 · ( T 298.15 ) + 4.3085 · 10 5 T l n ( P H 2 ) + 1 2 · l n ( P O 2 )

2.2. The Activation Polarization

The activation losses occur due to the kinetics of the reactions taking place at the electrode. They can be calculated using Equation (10) [34].
V a c t = ζ 1 + ζ 2 · T + ζ 3 · T · l n ( C O 2 ) + ζ 4 · T · l n ( I )
where the parameters ζ 1 , ζ 2 , ζ 3 and ζ 4 are parametric coefficients determined by the constructor, I is the current of the PEMFC, and C O 2 is the oxygen concentration in the catalysts (mol· cm 3 ) and it could be calculated using Equation (11) [34,35].
C O 2 = P O 2 5.08 · 10 6 · e ( 498 T )

2.3. The Ohmic Losses

The ohmic losses occur due to the electrical resistance of the different elements of the PEMFC. They have two origins: the internal resistance of the electrolyte membrane R m e m and the resistance that occurred due to the contact between the bipolar plates and the carbon electrodes R c o n . These losses can be calculated using Equation (12) [34]:
V o h m = I · ( R m e m + R c o n )
where
R m e m = σ m e m · l A
The parameter σ m e m is the specific resistance of the membrane ( Ω · cm), A is the single cell active surface in cm 2 , l is the membrane thickness in (cm). The following expression for the specific resistance is used [34,36]:
σ m e m = 181.6 [ 1 + 0.03 ( I A ) + 0.062 ( T 303 ) 2 · ( I A ) 2.5 ] [ δ 0.634 3 ( I A ) ] · exp [ 4.18 ( T 303 ) / T ]
The parameter δ is an amenable parameter with a maximum value of 23. This parameter depends on the membrane fabrication process and is a function of the relative humidity and the stoichiometric rate of the inlet hydrogen gas pressures the anode. Under ideal humidity conditions ( 100 % ), this parameter may have a value ranging from 14 to 20.

2.4. The Concentration Polarization

The concentration losses are caused by the variation in the concentration of reactants. These losses can be calculated using Equation (15) [34,36]; where ψ , J and J m a x are, respectively, a constant parameter, the current density and the maximum current density.
V c o n = ψ · l n 1 J J m a x

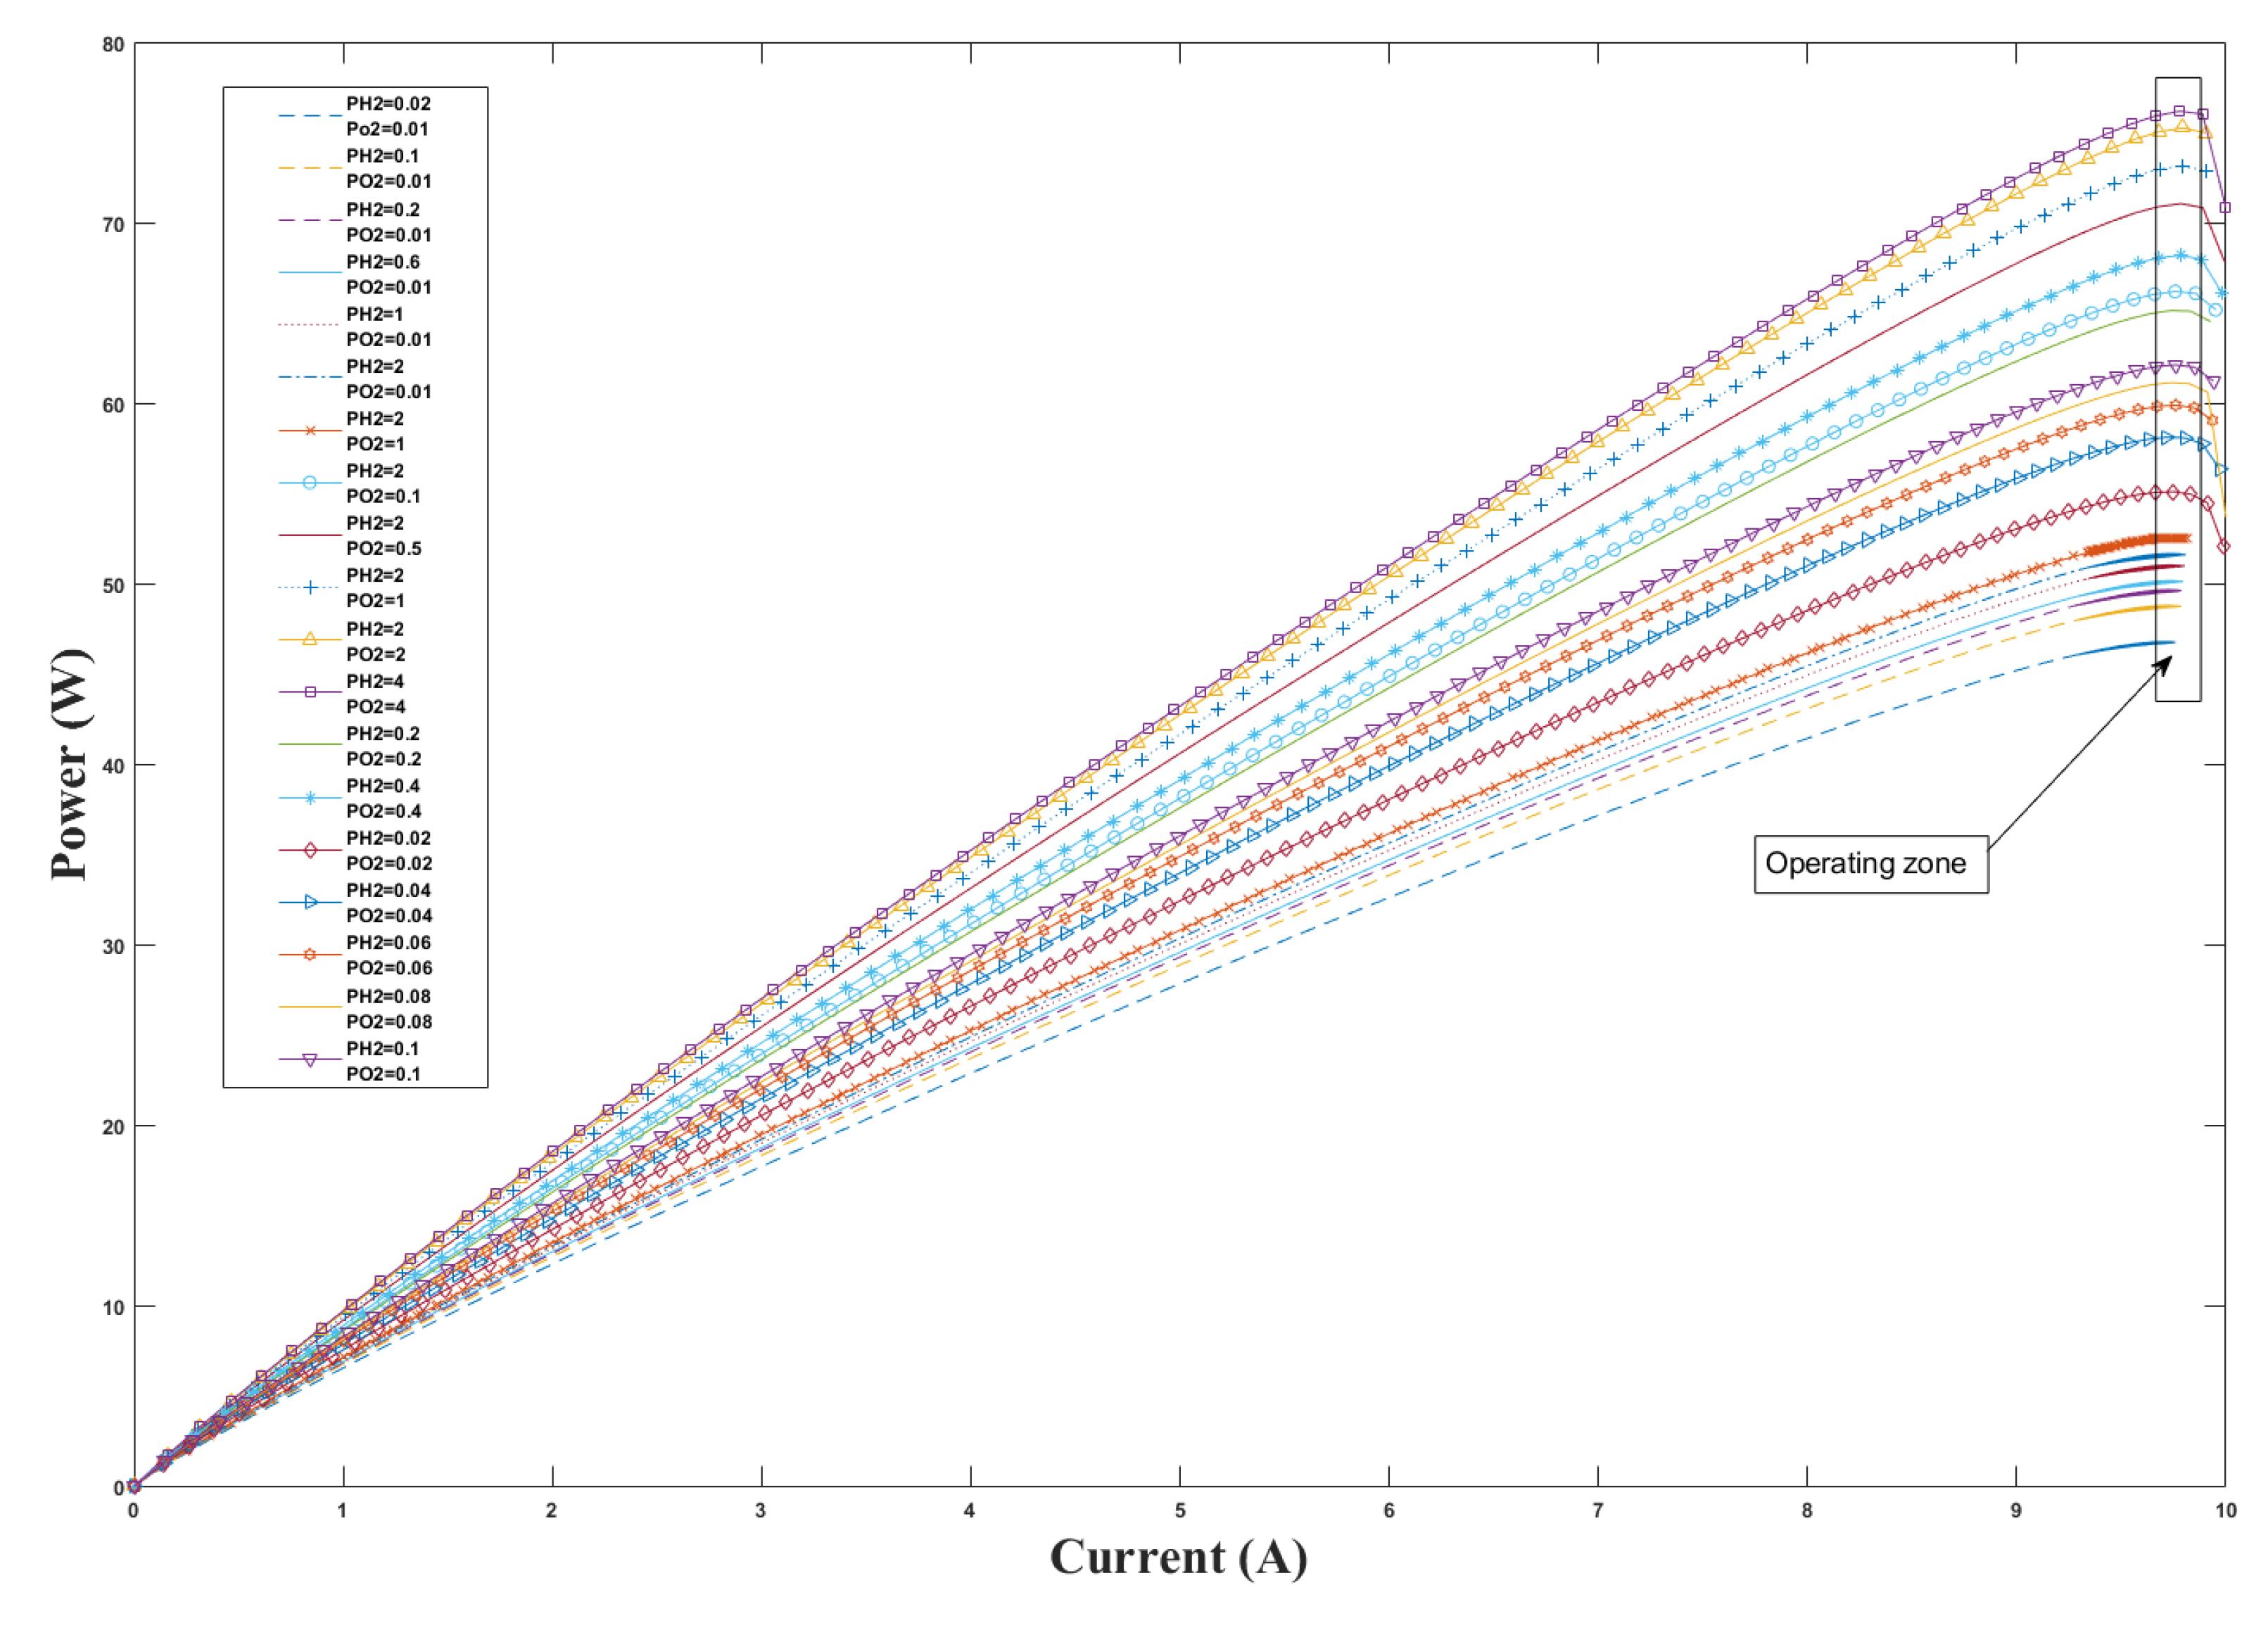
2.5. PEM Fuel Cell Stack Output Power

The output voltage under the load is approximately 0.6–0.7 V [37,38]. Therefore, it is necessary to have cells in series, which finally form a “stack” to achieve the sufficient voltage and the amount of power needed. The power generated by the PEMFC stack can be calculated using Equation (9); where N c represents the number of cells used in the stack [36].
P s t a c k = V F C · I · N c
The data and characteristics of the PEMFC considered in the simulation are shown in Table 1.

3. Control Design Methodology

The voltage delivered by the PEMFC is continuous and of low amplitude. In order to raise it into a higher value, a step-up converter is used. In general, the step-up converter is the easiest way to increase the voltage of a DC power supply, and promises high efficiency [39]. This section determines the converter structure adopted and presents some existing control techniques that allow the PEMFC to operate at an adequate power point. As shown in Figure 2, the closed loop consists of a PEMFC power system, a DC/DC boost converter, a control technique and finally a load.

3.1. Boost Converter State Space Modeling

Supposed that the boost converter operates in the continuous conduction mode (CCM) [40] which includes two sequences depending on whether the controllable switch is closed or open as shown in Figure 3. In order to model the converter, one applies the laws of Kirchhoff to the electric circuits characterizing the two operating sequences [41,42].
First sequence is characterized by u = 1 , the switch closed and the diode open. The equations which govern the converter are given by:
d i L d t = 1 L ( V F C ) d V o d t = 1 R C ( V o )
If we set x = [ x 1 , x 2 ] T = [ i L , V o ] T , then the expression (17) can be written:
x ˙ 1 x ˙ 2 = 0 0 0 1 R C . x 1 x 2 + 1 L 0 V F C
The second operating sequence is characterized by u = 0 , the switch open and the diode closed. The system of equations which governs the converter in the “off” state is presented below:
d i L d t = 1 L ( V F C V o ) d V o d t = 1 C ( i L i o )
If we set x = [ x 1 , x 2 ] T = [ i L , V o ] T , then the expression (19) can be written:
x ˙ 1 x ˙ 2 = 0 1 L 1 C 1 R C . x 1 x 2 + 1 L 0 V F C
In state space description, if the state equations of two modes are described as following [41]:
x ˙ = A 1 x + B 1 u ( S w i t c h 1 ) x ˙ = A 2 x + B 2 u ( S w i t c h 0 )
Then the average state space model is given by:
x ˙ = A ¯ x + B ¯ u
where, A ¯ = A 1 d + A 2 ( 1 d ) and B ¯ = B 1 d + B 2 ( 1 d ) .
Averaging the state space matrix of two different working modes using Equations (18), (20)–(22), we get the average model as a function of the duty cycle [41,43].
x ˙ 1 x ˙ 2 = 0 ( 1 d ) L ( 1 d ) C 1 R C . x 1 x 2 + 1 L 0 V F C y = 0 1 . x 1 x 2

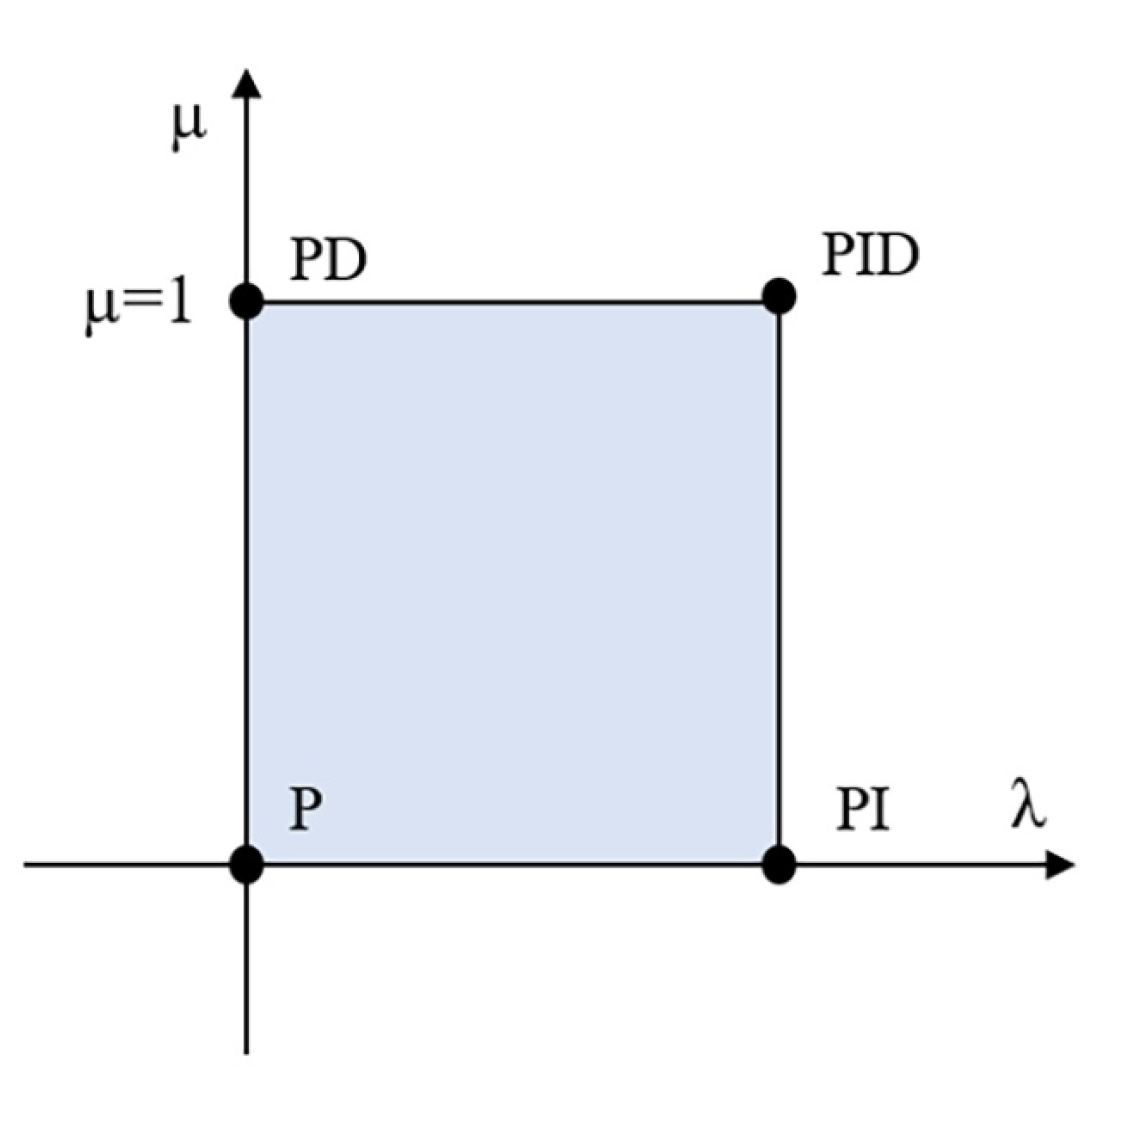
3.2. Fractional Order PID Controller

In 1999, Podlubny [44] proposed the P I λ D μ controller, a generalization of the classical PID controller, comprising a fractional integration of order λ and a fractional derivation of order μ , thus widening the field of application of fractional calculus to the command theory, which has directed several researchers to a new line of research which is the adjustment of the fractional-order P I λ D μ controller [44]. The following form gives the output equation of the fractional-order controller in the time domain:
u = k p e ( t ) + k i D t λ e ( t ) + k d D t μ e ( t )
where k p is the proportional constant, k i is the integrating constant, k d is the differentiating constant, λ is the fractional order of the integrating action, and μ is the fractional order of the differentiating action.
By comparison with the conventional PID controller [45], fractional-order controllers have in addition two other parameters noted λ and μ , which present the order of integration and derivation, respectively. Depending on the variation of these two parameters, we can distinguish different possibilities of fractional order controller [44].
As indicated in Figure 4, the fractional order P I λ D μ controller generalizes the classical P I D controller and extends it from the point to a plane. This expansion could provide much more flexibility in the design of PID control. Clearly, by choosing ( λ , μ ) = ( 1 , 1 ) , a classic P I D corrector can be recovered and using ( λ , μ ) = ( 1.0 ) and ( λ , μ ) = ( 0.1 ) , we get controllers classic P I and P D , respectively. In other words, all these types of classical, n controllers are special cases of the fractional P I λ D μ controller given in Equation (24).

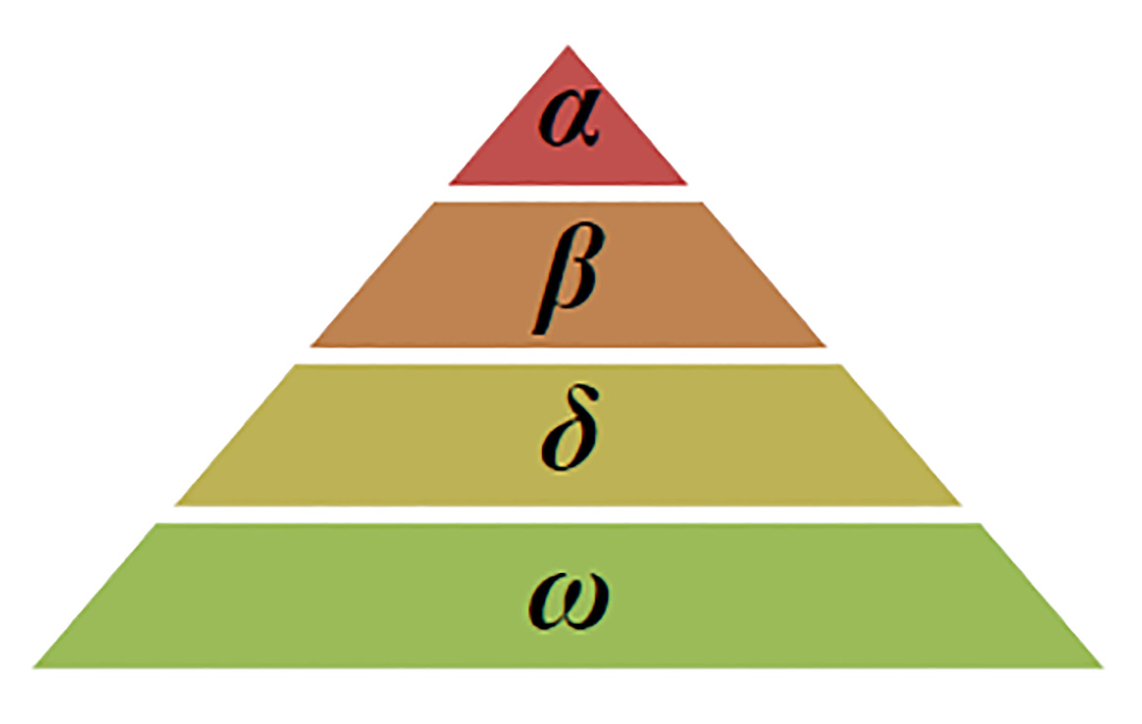
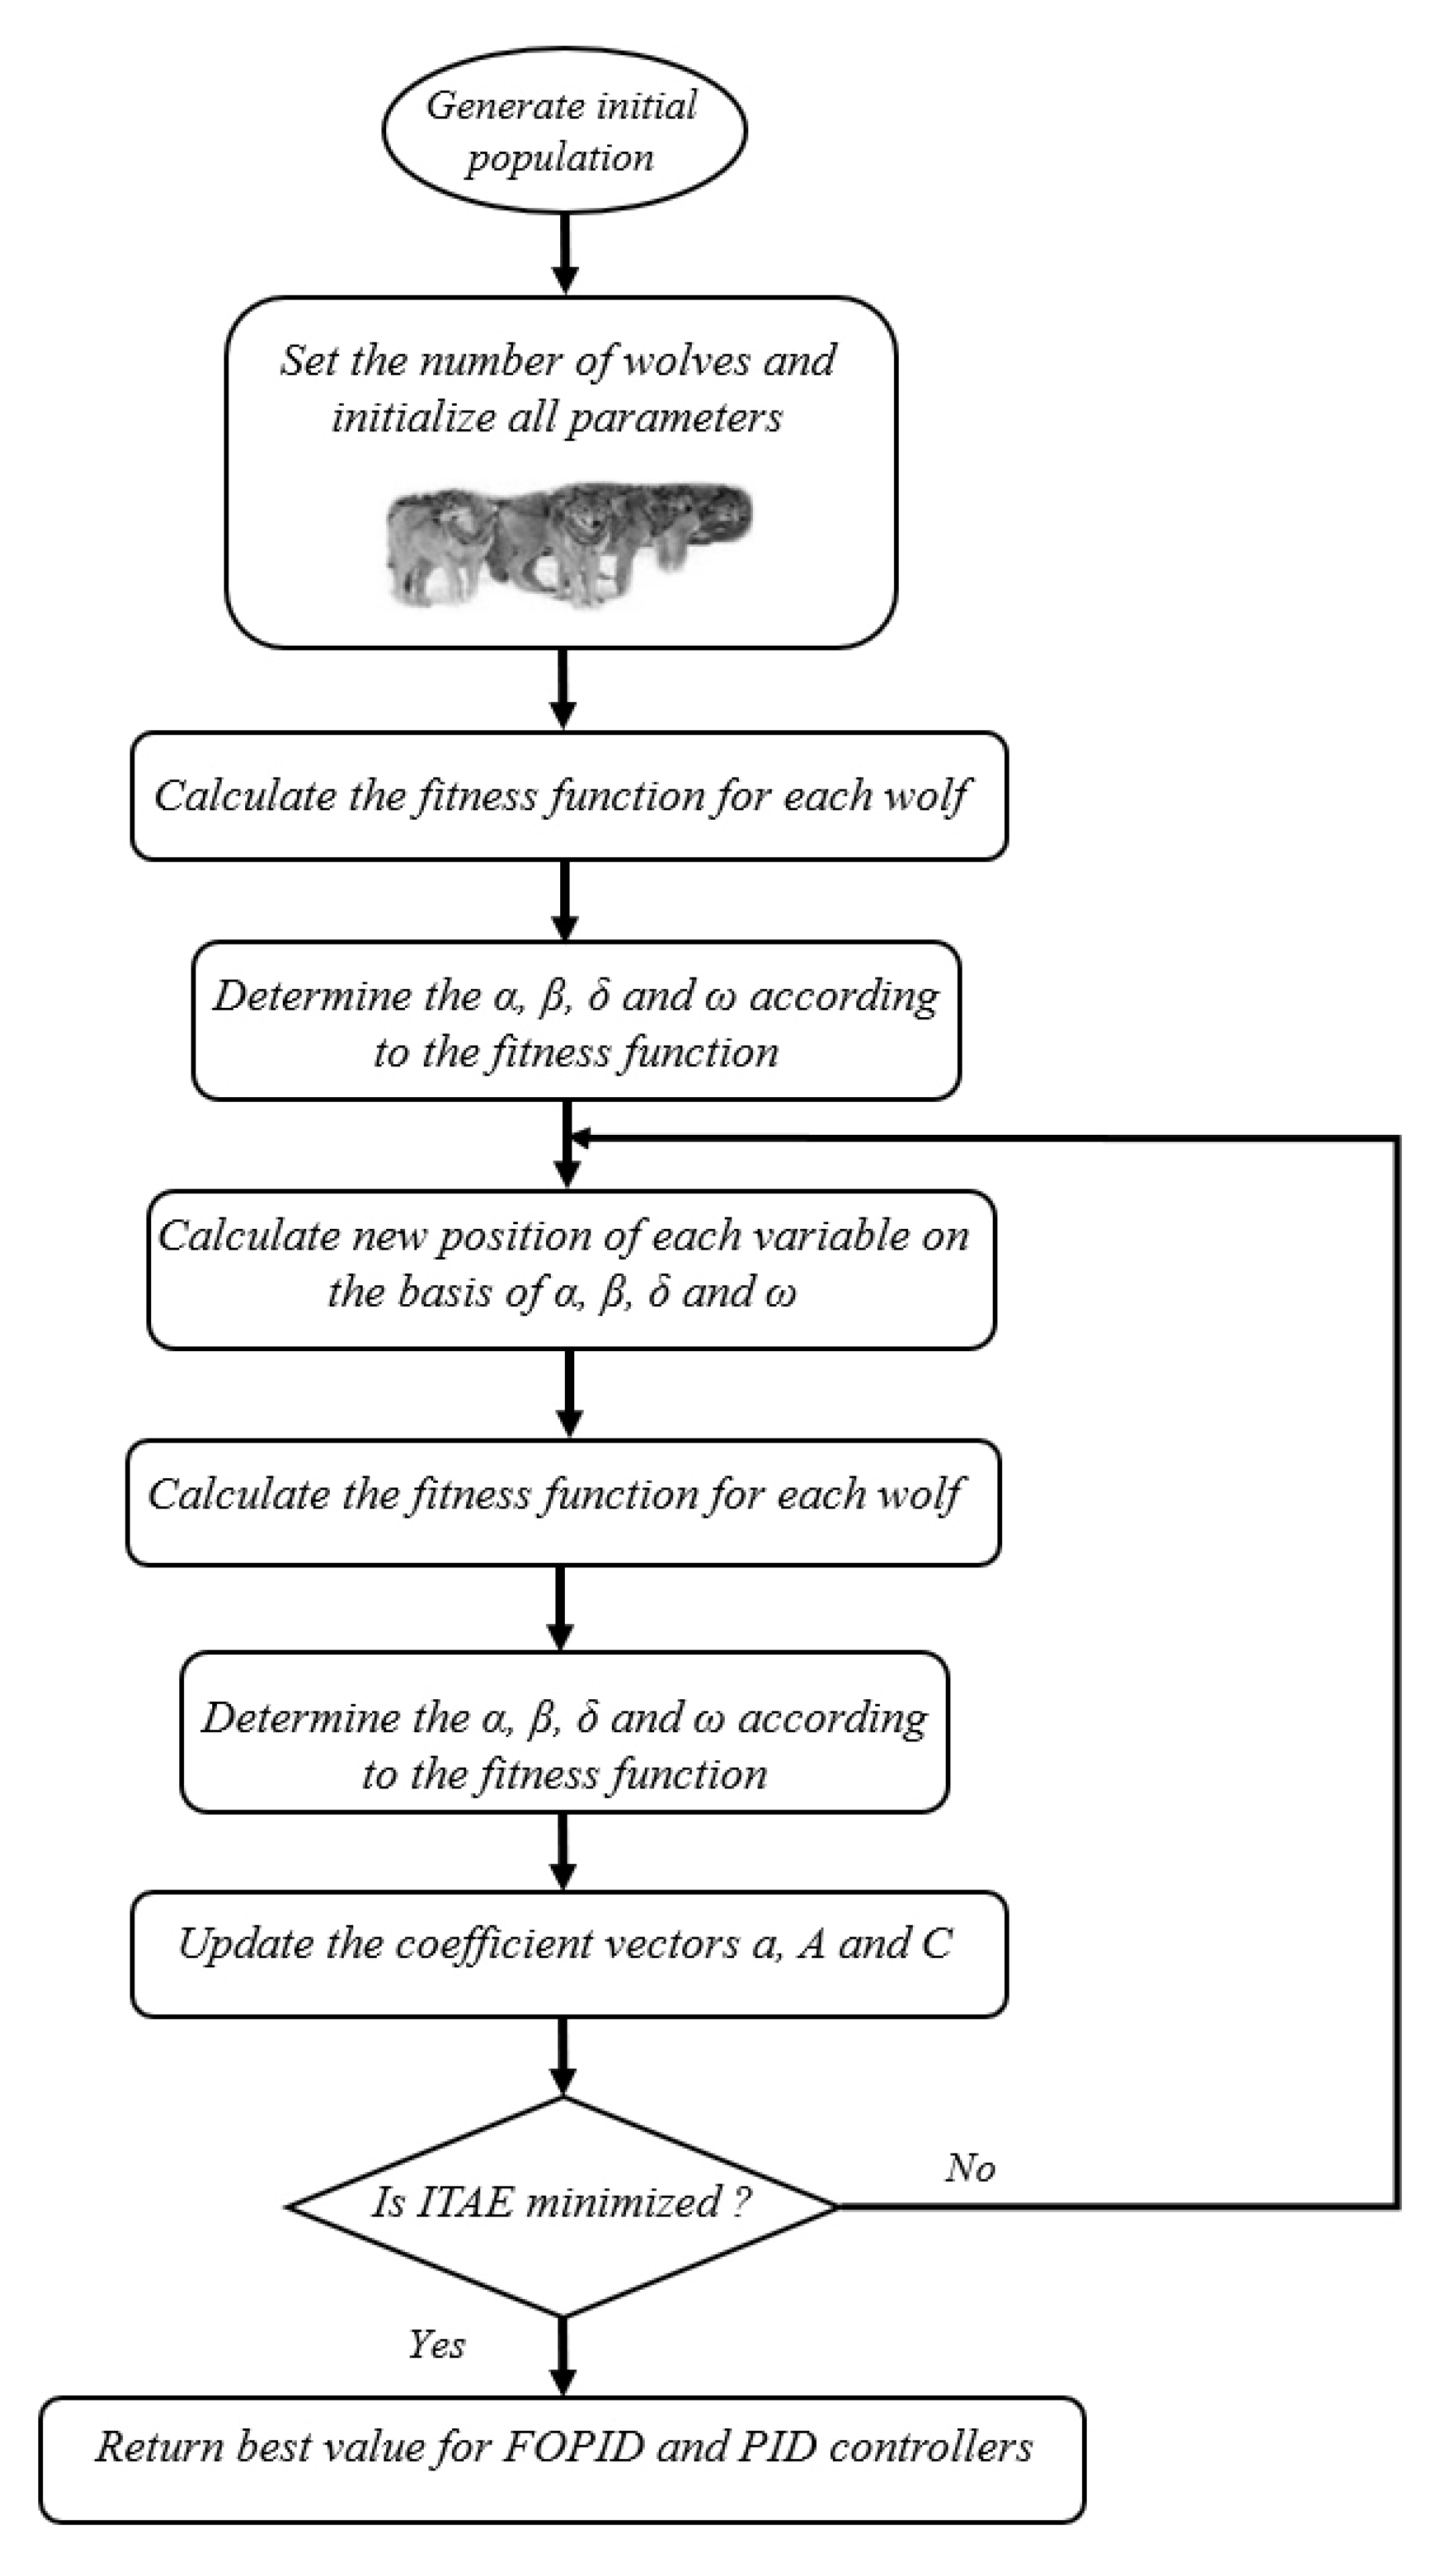
3.3. Optimization Using EGWO Method

The grey wolf optimizer (GWO) is an intelligent swarm technique developed in 2014 by Seyedali Mirjalili [46], which mimics the leadership hierarchy of wolves that are well known for their group hunting. In this algorithm, the population is divided into four groups: alpha ( α ) , beta ( β ) , delta ( δ ) and omega ( ω ) . The first three most vital wolves guide the last weak wolves ω to promising areas of the search space. One of the exciting realities of the social life of these wolves is their rigorous social hierarchical structure in the group, as shown in Figure 5.
The hunting strategy and wolves’ social hierarchy are modeled to design the GWO optimization algorithm. This algorithm includes the following steps [46,47]:
  • Social hierarchy
  • Prey search (exploration)
  • Follow, hunt and approach the prey
  • Pursue, circle and harass the prey until they stop moving
  • Attack on the prey
Figure 6 gives the flowchart of the GWO optimization method. The mathematical Equations which govern the GWO algorithm can be summarized as follows:
D = | C X p ( t ) X ( t ) |
X ( t + 1 ) = | X p ( t ) A D |
where t indicates the current iteration, A and C are vectors coefficients, X p the position vector of the prey, X is the position vector.
The vectors, A and C are calculated as follows:
A = 2 a ( t ) r 2 a ( t )
C = 2 r 1
where, a linear incline vector decreased from 2 to 0, and r 1 r 2 are random vectors in [ 0.1 ] .
D α = | C 1 X α ( t ) X ( t ) |
D β = | C 2 X β ( t ) X ( t ) |
D δ = | C 3 X δ ( t ) X ( t ) |
X ( t + 1 ) = X 1 + X 2 + X 3 3
where, X α ( t ) represents the position of the α , X β ( t ) indicates the position of the β , X δ ( t ) is the position of δ , C 1 3 are random vectors and X indicates the position of the current solution.
The extended GWO is the same as the original, where the difference is adding three parameters ( α E , β E and δ E ) called the emphasis coefficients to the updated position of Equation (32). Therefore, the extended, updated position can be expressed as Equation (33) [48,49]:
X ( t + 1 ) = α E X 1 + β E X 2 + δ E X 3 3
where,
α E > β E > δ E
In this paper, the EGWO and GWO algorithms are implemented to tune the FOPID and PID controllers parameters in the offline mode in order to ensure an optimal control performance under the variations of the operating conditions. The first step is to initialize a random wolf population based on the upper and lower bounds of the variables, uniformly distributed in the search space D, and fix the stop criterion. Second, evaluate the objective function for each wolf. Third, choose the first three best wolves and save them under α , β and δ . Fourth, update the position of the rest of the population (wolves). Fifth, update of parameters a, A and C. If the stopping criterion is not satisfied, go to the second step; otherwise, the program ends, and the optimal solution is produced. In the simulation, the population size is the number of search agents, which is 30 and the number of iterations equal to 40 and 200 for EGWO and GWO, respectively. The emphasis coefficients used in the EGWO are chosen as α E = 1.2 , β E = 1.1 , and δ E = 0.9 .
The implementation of the EGWO Algorithm-based optimization control scheme for DC-DC converter is to minimize ITAE while, proportional gain k p , integral gain k i and derivative gain k d for the PID controller, in addition λ and μ for the FOPID are taken as decision variables. According to Ziegler Nichols technique [19] and Podlubny [44], the variations ranges of the FOPID and PID decision variables used in the simulation are given in Table 2.
The Integral of time multiplied by absolute error O = I T A E is chosen as an objective function as shown in Equation (34) [50,51]:
O = 0 t e ( t ) d t
where
e ( t ) = I r e f I L

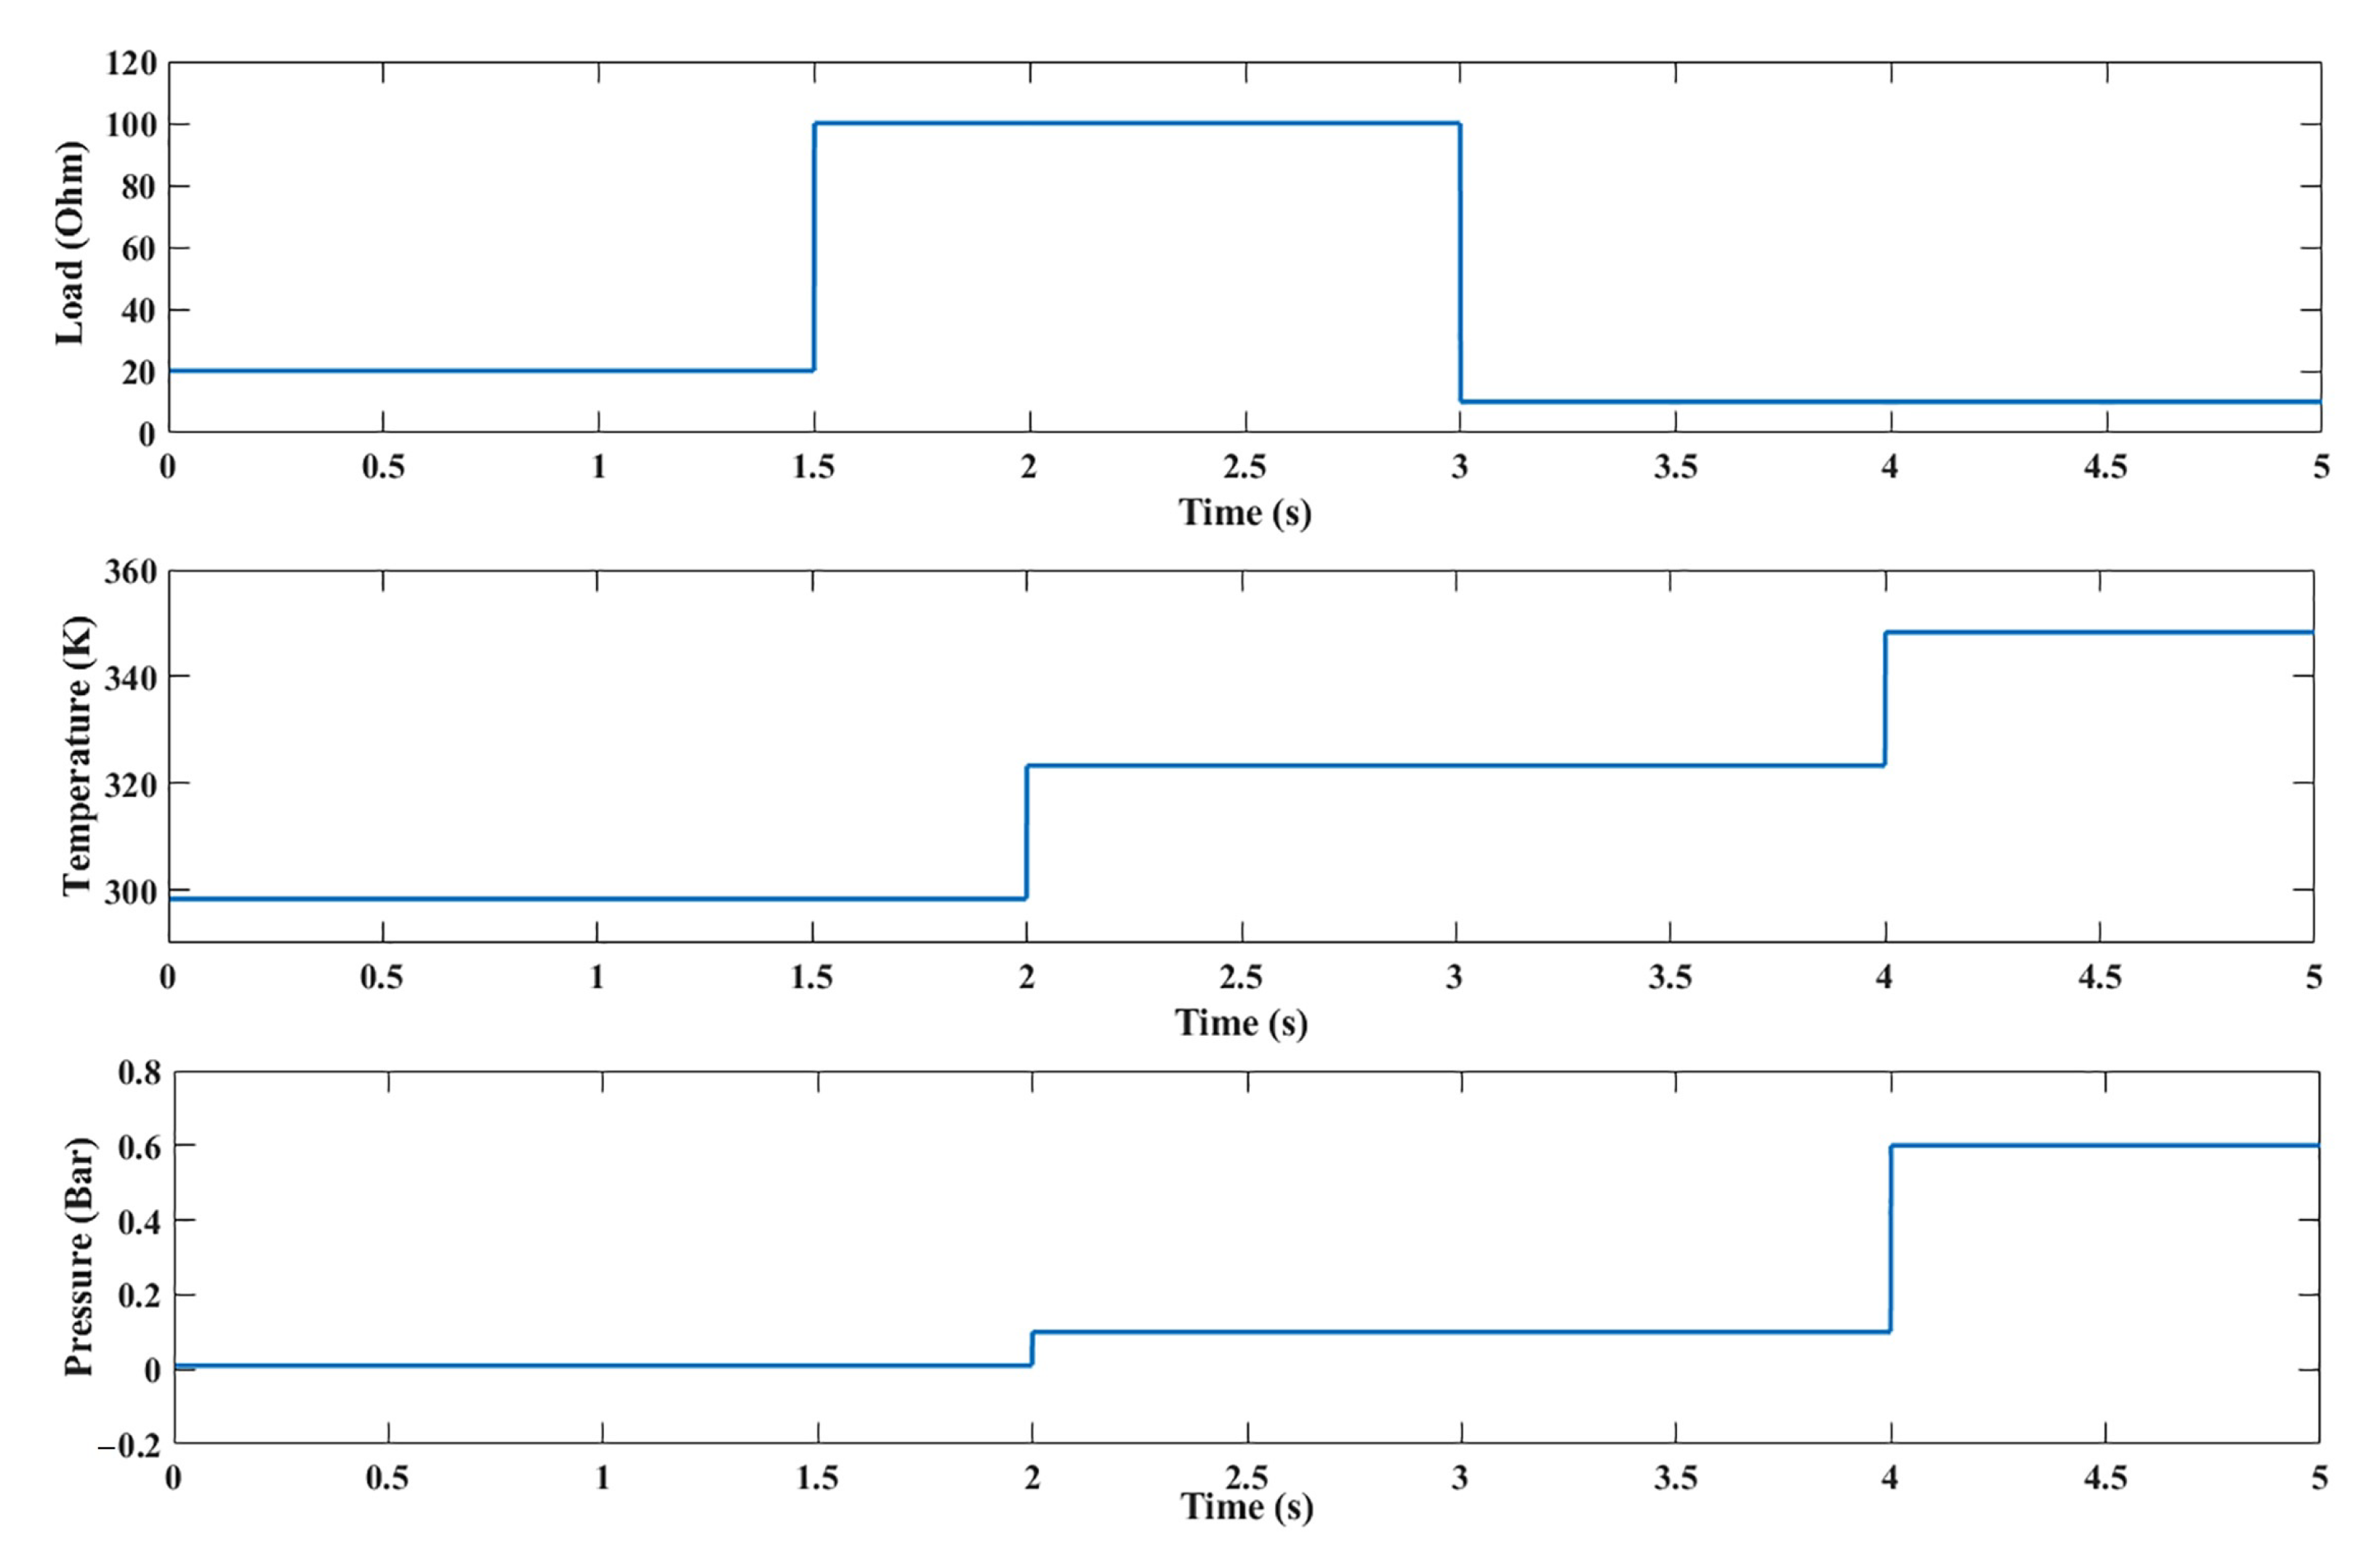
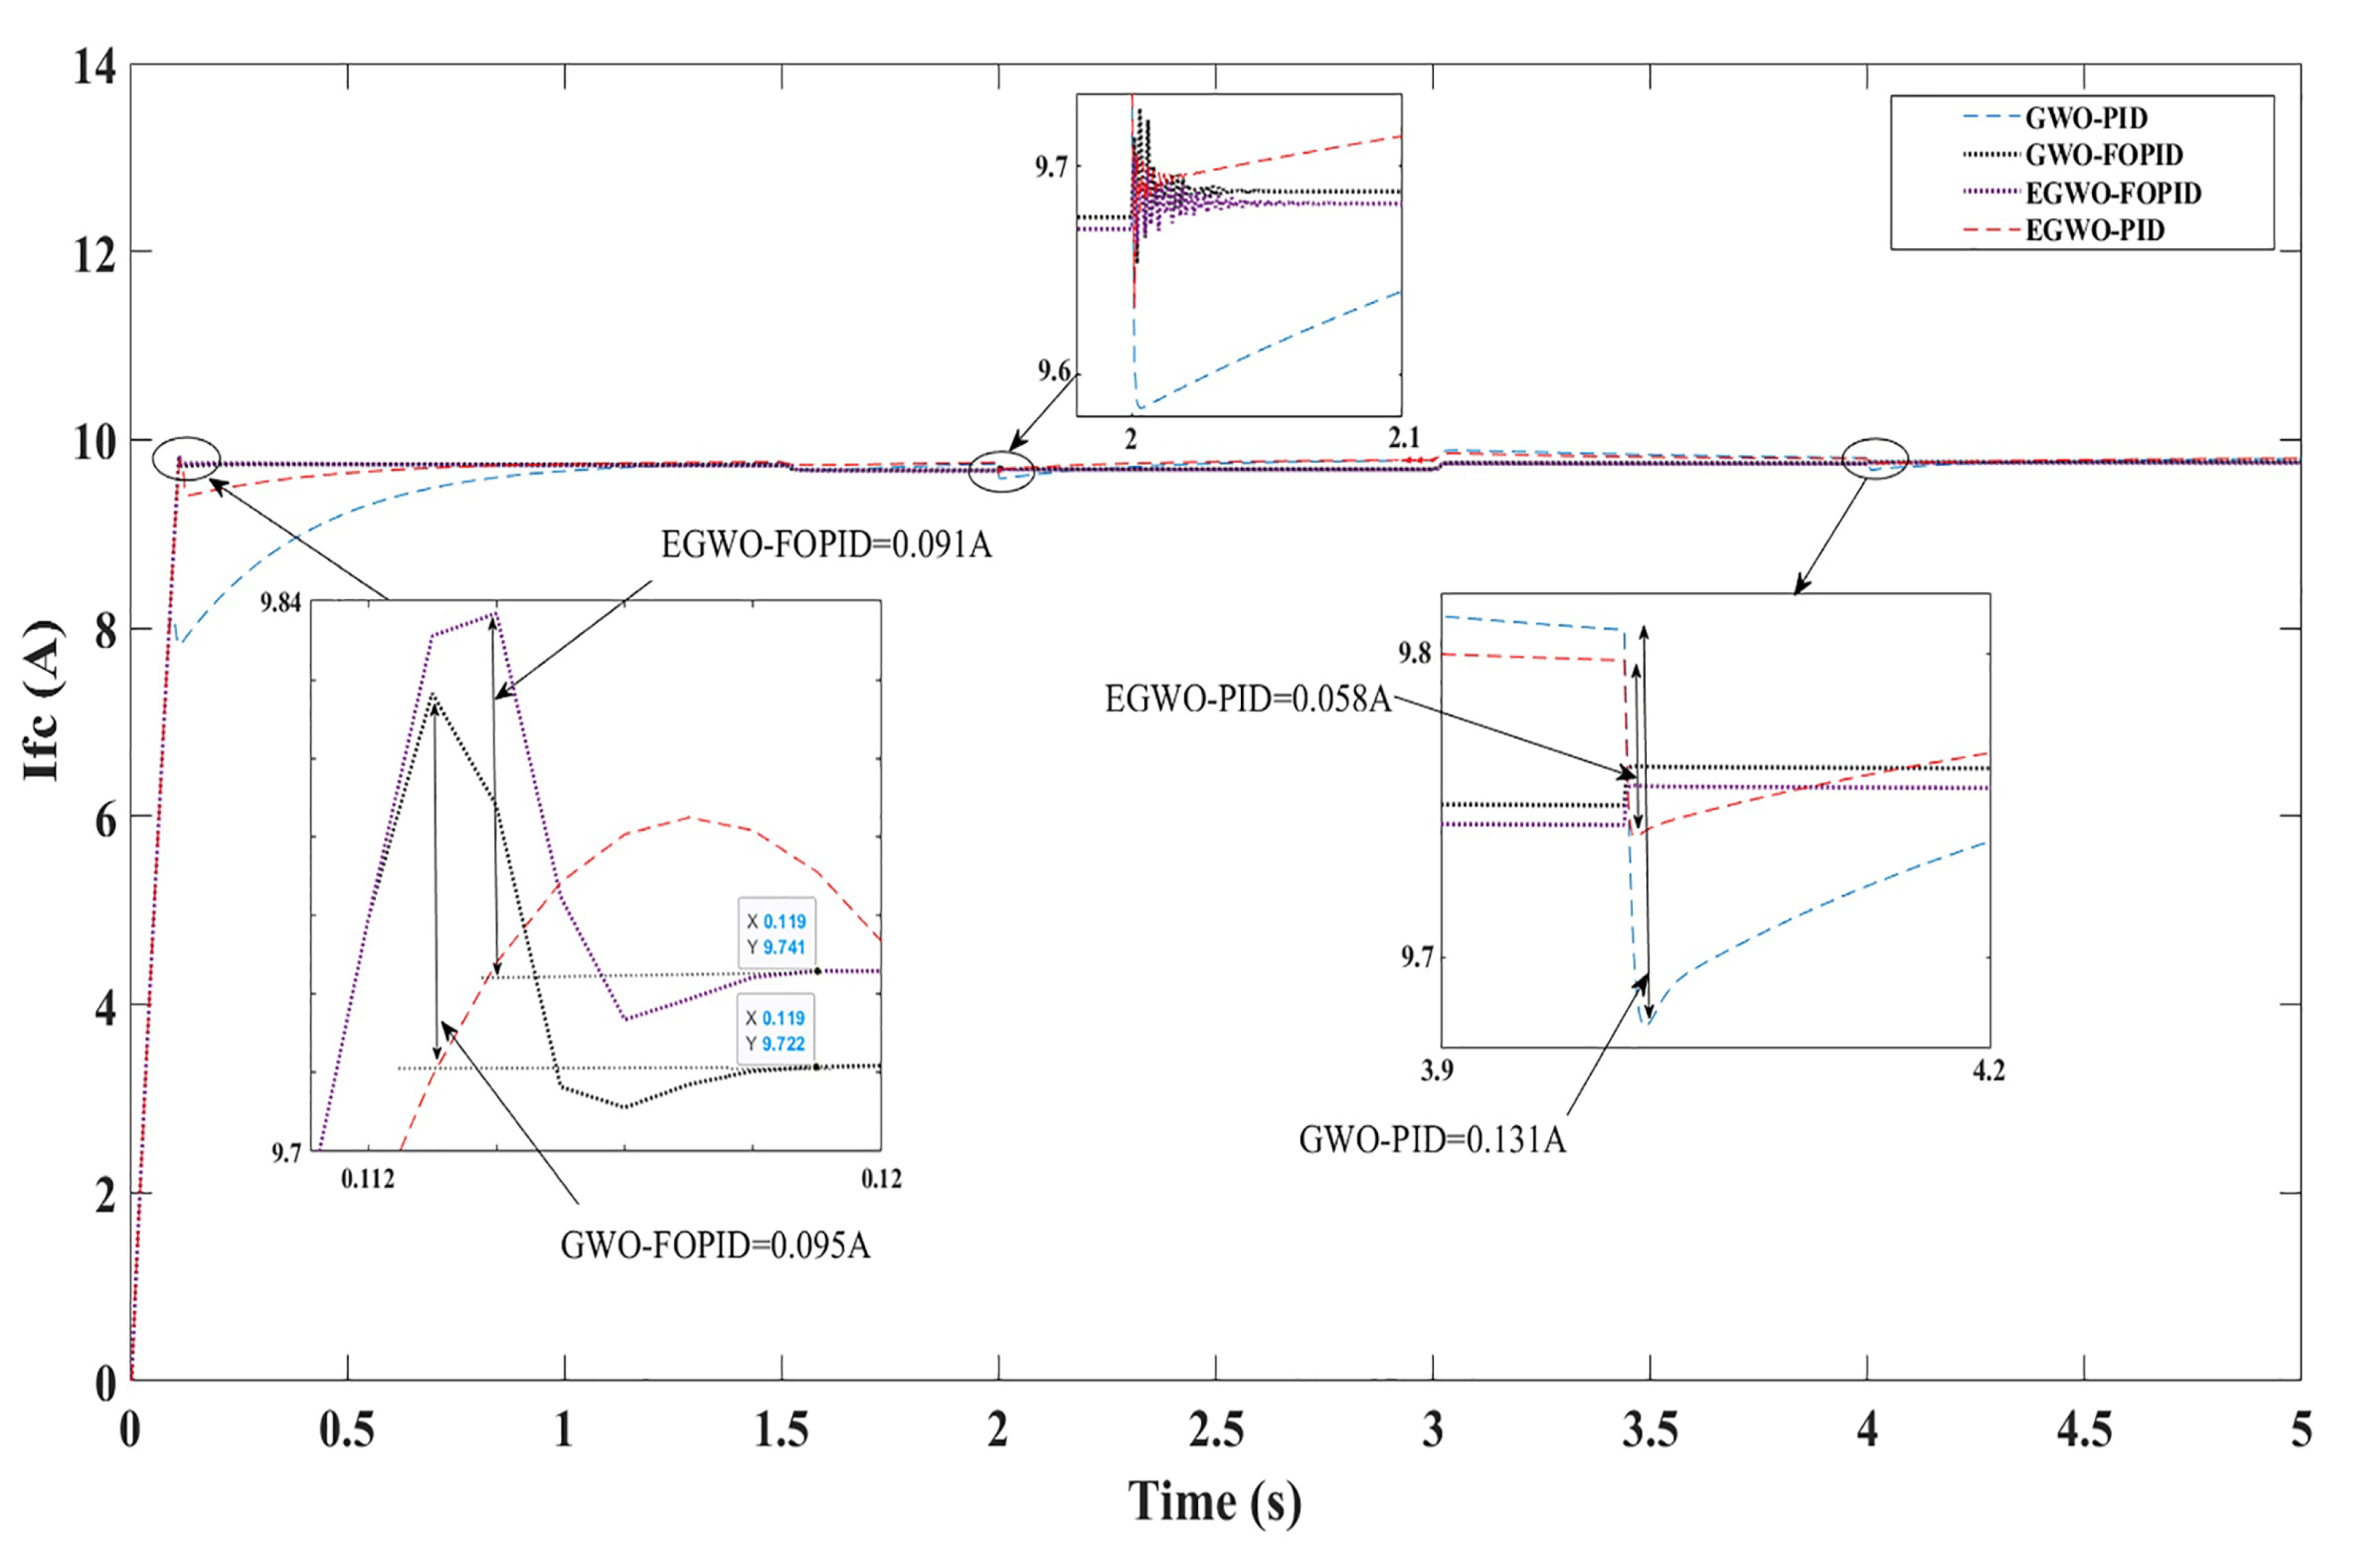
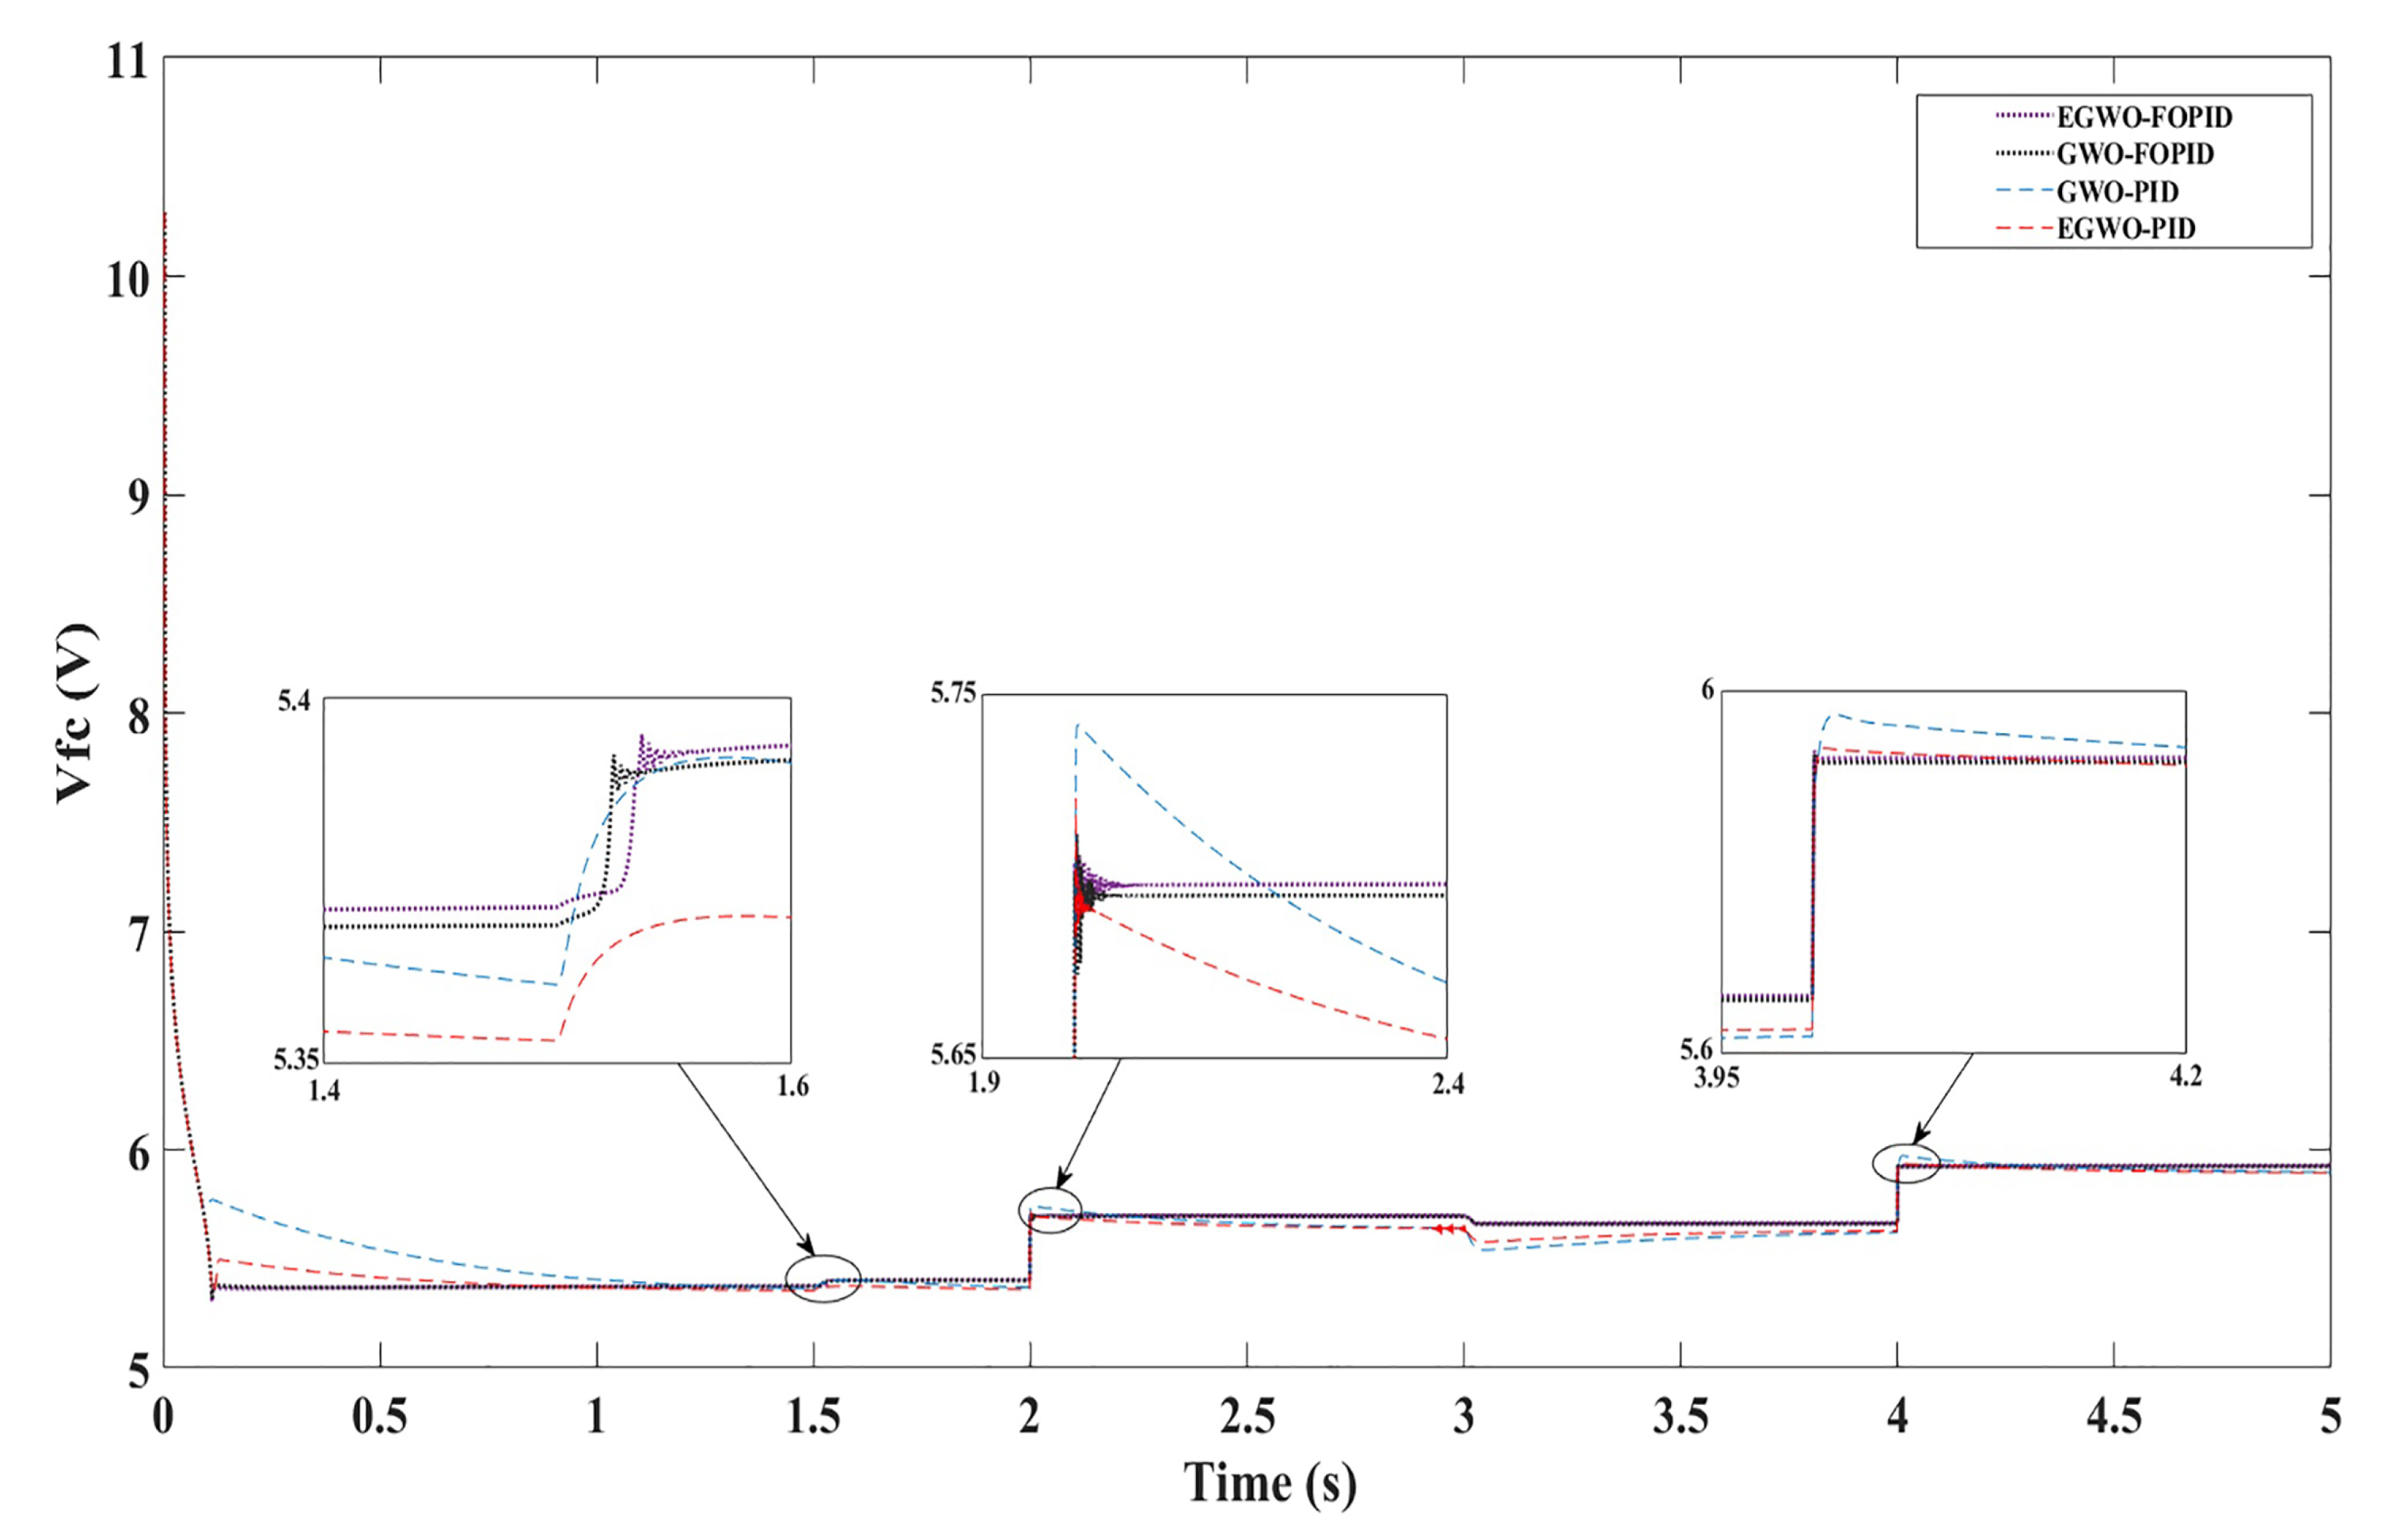
4. Simulation Results

Aiming to keep and hold the PEMFC works at a desired current equal to 9.74 A of the operating zone, which corresponds to the maximum power generated by the cell, a control algorithm based on EGWO-FOPID is applied to the DC/DC boost converter under the MATLAB/SIMULINK environment. The DC/DC boost converter, which we want to control, these parameters are C = 1500 · 10 6 F and L = 69 · 10 3 H .
The PEMFC polarization curve under different hydrogen and oxygen gas pressure is represented in Figure 7.
In order to test the robustness of the proposed controllers, variable loads are applied from 20 Ω to 100 Ω , at time t = 1.5 s and a variable resistance from 100 Ω to 20 Ω at time of t = 3 s. The H 2 gas pressure is varied from 0.1 bar at t = 2 s and 0.6 bar at t = 2 s, where the temperatures are varied from 25 °C to 50 °C at time of 2 s and from 50 °C to 75 °C at time of 4 s as shown in Figure 8.
The obtained parameters gain for the proposed controllers which used in our study are enlisted in Table 3.
Figure 9 shows the PEMFC stack output current signal under EGWO-FOPID, GWO-FOPID, EGWO-PID and GWO-PID. It is clearly seen that the EGWO-FOPID has faster and high performance in tracking the reference current than the other approaches, while the EGWO-FOPID has shown at the beginning an overshoot of 0.091 A and high current accuracy equal to 9.741 A with an error 0.001 A between the output current and the desired in comparison with the GWO-FOPID, which gives an overshoot equal to 0.095 A and current accuracy equal to 9.722 A with an error equal to 0.018 A, which is an acceptable result to having the second grade of performance. As seen in Figure 9, at t = 4 s the EGWO-PID shows an undershoot of 0.058 A in comparison with 0.131 A for the original GWO-PID.
Figure 10 shows the PEMFC stack output voltage signal under EGWO-FOPID, GWO-FOPID, EGWO-PID and GWO-PID. According to Figure 10, it is clearly seen that by using the EGWO-FOPID and GWO-FOPID, the operation point is achieved quickly with great precision and global stability of the closed-loop system performance. In addition, they offer high robustness even for large load variation. On the other hand, it is noticeable that the drawback of the EGWO-PID and GWO-PID controllers also appears in a low start-up, high response time and low accuracy in tracking the desired value.
The PEMFC stack output power signal is shown in Figure 11 under EGWO-FOPID, GWO-FOPID, EGWO-PID and GWO-PID. According to this Figure, gradual and smooth movement to the desired value are obtained by EGWO-FOPID and GWO-FOPID controllers with considerable accuracy for the EGWO-FOPID. In addition, it noticed that there is a superiority for the EGWO-FOPID and GWO-FOPID in terms of response time and robustness in comparison with EGWO-PID and GWO-PID. Hence, at t = 1.5 s the GWO-PID shows a power undershoot of 0.02 W and at t = 3 s shows a power undershoot of 0.36 W. On the other hand, at t = 1.5 s, the EGWO-PID shows a power undershoot of 0.02 W and at t = 3 s shows a power undershoot of 0.17 W. According to these results, it is noticed that the EGWO-FOPID and GWO-FOPID bear the sharp load variation. In addition, from the results, the FOPID controller designed using the EGWO and GWO algorithms exhibits superior performance over the traditional PID, whose parameters are obtained by the EGWO and GWO.
Figure 12 shows the output boost converter signals behaviour under EGWO-FOPID, GWO-FOPID, EGWO-PID and GWO-PID. According to this figure, it is noticeable that smooth and gradual movements to the desired value are obtained using EGWO-FOPID and GWO-FOPID algorithms compared to EGWO-PID and GWO-PID.
As a result, the advantage of a modern optimization approach is seen as a complementary solution to improve the performance of the conventionally designed FOPID and PID controllers, which has a great impact on the output quality. However, there are many techniques that can be used as optimization tools, and the EGWO is one of the recent and effective optimization tools that has a fast convergence to the optimal value within 40 iterations while the GWO reached this point within 200 iterations.

5. Conclusions

This paper discusses a novel method for the design of a fractional order PID controller for a boost converter using the extended grey wolf optimizer (EGWO) algorithm. The proposed system showed a fast convergence and smooth dynamic response. It was noticed that the EGWO optimization algorithm had a high impact on the response time, as well as the loss function value. The performance of the FOPID control system with the EGWO algorithm was compared with the GWO-FOPID, GWO-PID, and EGWO-PID algorithms for the same cost function, also another comparison was done between a PID and FOPID which showed the obvious superiority of the FOPID. As a conclusion, the proposed control algorithm gave faster convergence to the optimal solution even for large load variations in comparison to all the other methods.

Author Contributions

Conceptualization, M.Y.S.; methodology, M.Y.S.; software, M.Y.S.; validation, M.Y.S. and M.D.; formal analysis, M.Y.S. and M.D.; investigation, M.Y.S. and M.D.; resources, O.B.; data curation, M.Y.S. and M.D.; writing—original draft preparation, M.Y.S.; writing—review and editing, M.Y.S., M.D., O.B., C.N. and A.B.; visualization, M.Y.S. and A.B.; supervision, O.B.; project administration, O.B.; funding acquisition, O.B. All authors have read and agreed to the published version of the manuscript.

Funding

The authors wish to express their gratitude to the Basque Government, through the project EKOHEGAZ (ELKARTEK KK-2021/00092), to the Diputación Foral de Álava (DFA), through the project CONAVANTER, and to the UPV/EHU, through the project GIU20/063, for supporting this work.

Institutional Review Board Statement

Not applicable.

Informed Consent Statement

Not applicable.

Data Availability Statement

Not applicable.

Conflicts of Interest

The authors declare no conflict of interest.

Abbreviations

The following abbreviations are used in this manuscript:
GWOgrey wolf optimizer
EGWOextended grey wolf optimizer
PIproportional integral
PIDproportional integral derivative
GAgenetic algorithm
PSOparticle swarm optimization
QC-HOSMquasi continuous high order sliding mode
FOPIDfractional-order proportional integral derivative
PEMFCproton exchange membrane fuel cells
IGBTinsulated gate bipolar transistor
MOSFETmetal oxide semiconductor field effect transistor
ZNziegler-nichols
RMSEroot mean squared error
TSMCtotal sliding-mode control
CCMcontinuous conduction mode

References

  1. Calvo, L.M.; Domingo, R. Influence of Maintenance Actions in the Drying Stage of a Paper Mill on CO2 Emissions. Processes 2021, 9, 1707. [Google Scholar] [CrossRef]
  2. Ou, T.; Peng, H.; Su, M.; Shi, Q.; Tang, J.; Chen, N.; Chen, D. Fast and Efficient Removal of Uranium onto a Magnetic Hydroxyapatite Composite: Mechanism and Process Evaluation. Processes 2021, 9, 1927. [Google Scholar] [CrossRef]
  3. Yoro, K.O.; Daramola, M.O. CO2 emission sources, greenhouse gases, and the global warming effect. Adv. Carbon Capture 2020, 9, 3–28. [Google Scholar]
  4. Ventura, M. Long term storability of hydrogen peroxide. In Proceedings of the 41st AIAA/ASME/SAE/ASEE Joint Propulsion Conference & Exhibit, Tucson, AZ, USA, 10–13 July 2005; p. 4551. [Google Scholar]
  5. Zhang, Y.; Liu, C.; Wan, Z.; Yang, C.; Li, S.; Tu, Z.; Wu, M.; Chen, Y.; Zhou, W. Performance Enhancement of PEM Fuel Cells with an Additional Outlet in the Parallel Flow Field. Processes 2021, 9, 2061. [Google Scholar] [CrossRef]
  6. Encalada-Dávila, Á.; Espinoza-Andaluz, M.; Barzola-Monteses, J.; Li, S.; Andersson, M. Transport parameter correlations for digitally created PEFC gas diffusion layers by using openPNM. Processes 2021, 9, 1141. [Google Scholar] [CrossRef]
  7. Duan, Z.; Zhang, L.; Feng, L.; Yu, S.; Jiang, Z.; Xu, X.; Hong, J. Research on Economic and Operating Characteristics of Hydrogen Fuel Cell Cars Based on Real Vehicle Tests. Energies 2021, 14, 7856. [Google Scholar] [CrossRef]
  8. Rubio, G.A.; Agila, W.E. A Fuzzy Model to Manage Water in Polymer Electrolyte Membrane Fuel Cells. Processes 2021, 9, 904. [Google Scholar] [CrossRef]
  9. Costamagna, P.; Srinivasan, S. Quantum jumps in the PEMFC science and technology from the 1960s to the year 2000: Part II. J. Power Sources 2001, 102, 253–269. [Google Scholar] [CrossRef]
  10. Bacquart, T.; Moore, N.; Wilmot, R.; Bartlett, S.; Morris, A.S.O.; Olden, J.; Becker, H.; Aarhaug, T.A.; Germe, S.; Riot, P.; et al. Hydrogen for maritime application—Quality of hydrogen generated onboard ship by electrolysis of purified seawater. Processes 2021, 9, 1252. [Google Scholar] [CrossRef]
  11. Li, Q.; Liu, Z.; Sun, Y.; Yang, S.; Deng, C. A review on temperature control of proton exchange membrane fuel cells. Processes 2021, 9, 235. [Google Scholar] [CrossRef]
  12. Barelli, L.; Bidini, G.; Gallorini, F.; Ottaviano, A. Dynamic analysis of PEMFC-based CHP systems for domestic application. Appl. Energy 2012, 91, 13–28. [Google Scholar] [CrossRef]
  13. Yau, Y.T.; Hwu, K.I.; Shieh, J.J. Minimization of output voltage ripple of two-phase interleaved buck converter with active clamp. Energies 2021, 14, 5215. [Google Scholar] [CrossRef]
  14. Faifer, M.; Piegari, L.; Rossi, M.; Toscani, S. An Average Model of DC–DC Step-Up Converter Considering Switching Losses and Parasitic Elements. Energies 2021, 14, 7780. [Google Scholar] [CrossRef]
  15. Derbeli, M.; Farhat, M.; Barambones, O.; Sbita, L. Control of proton exchange membrane fuel cell (pemfc) power system using pi controller. In Proceedings of the 2017 International Conference on Green Energy Conversion Systems (GECS), Hammamet, Tunisia, 23–25 March 2017; pp. 1–5. [Google Scholar]
  16. Namnabat, M.; Poodeh, M.B.; Eshtehardiha, S. Comparison the control methods in improvement the performance of the DC-DC converter. In Proceedings of the 2007 7th Internatonal Conference on Power Electronics, Daegu, Korea, 22–26 October 2007; Volume 13, pp. 246–251. [Google Scholar]
  17. Águila-León, J.; Chiñas-Palacios, C.D.; Vargas-Salgado, C.; Hurtado-Perez, E.; García, E.X. Optimal PID Parameters Tunning for a DC-DC Boost Converter: A Performance Comparative Using Grey Wolf Optimizer, Particle Swarm Optimization and Genetic Algorithms. In Proceedings of the 2020 IEEE Conference on Technologies for Sustainability (SusTech), Santa Ana, CA, USA, 23–25 April 2007; pp. 1–6. [Google Scholar]
  18. Li, H.; Ye, X. Sliding-mode PID control of DC-DC converter. In Proceedings of the 2010 5th IEEE Conference on Industrial Electronics and Applications, Taichung, Taiwan, 15–17 June 2010; pp. 730–734. [Google Scholar]
  19. Derbeli, M.; Barambones, O.; Sbita, L. A robust maximum power point tracking control method for a PEM fuel cell power system. Appl. Sci. 2018, 8, 2449. [Google Scholar] [CrossRef] [Green Version]
  20. Wai, R.J.; Shih, L.C. Design of voltage tracking control for DC–DC boost converter via total sliding-mode technique. IEEE Trans. Ind. Electron. 2010, 58, 2502–2511. [Google Scholar] [CrossRef]
  21. Silaa, M.Y.; Derbeli, M.; Barambones, O.; Cheknane, A. Design and implementation of high order sliding mode control for PEMFC power system. Energies 2020, 13, 4317. [Google Scholar] [CrossRef]
  22. Silaa, M.Y.; Derbeli, M.; Barambones, O.; Napole, C.; Cheknane, A.; Gonzalez De Durana, J.M. An efficient and robust current control for polymer electrolyte membrane fuel cell power system. Sustainability 2021, 13, 2360. [Google Scholar] [CrossRef]
  23. Yang, Q.; Lin, H.; Wang, X.; Zhang, L.Y.; Jing, M.; Yuan, W.; Li, C.M. Dynamically self-assembled adenine-mediated synthesis of pristine graphene-supported clean Pd nanoparticles with superior electrocatalytic performance toward formic acid oxidation. J. Colloid Interface Sci. 2022, 613, 515–523. [Google Scholar] [CrossRef]
  24. Fan, X.; Yuan, W.; Zhang, D.H.; Li, C.M. Heteropolyacid-mediated self-assembly of heteropolyacid-modified pristine graphene supported Pd nanoflowers for superior catalytic performance toward formic acid oxidation. ACS Appl. Energy Mater. 2018, 1, 411–420. [Google Scholar] [CrossRef]
  25. Truong, V.M.; Duong, N.B.; Yang, H. Effect of Gas Diffusion Layer Thickness on the Performance of Anion Exchange Membrane Fuel Cells. Processes 2021, 9, 718. [Google Scholar] [CrossRef]
  26. Morán-Durán, A.; Martínez-Sibaja, A.; Rodríguez-Jarquin, J.P.; Posada-Gómez, R.; González, O.S. PEM fuel cell voltage neural control based on hydrogen pressure regulation. Processes 2019, 7, 434. [Google Scholar] [CrossRef] [Green Version]
  27. Verastegui, J.E.E.; Zamora Antuñano, M.A.; Resendiz, J.R.; García García, R.; Kañetas, P.J.P.; Ordaz, D.L. Electrochemical Hydrogen Production Using Separated-Gas Cells for Soybean Oil Hydrogenation. Processes 2020, 8, 832. [Google Scholar] [CrossRef]
  28. Rezaei, M.; Dampage, U.; Das, B.K.; Nasif, O.; Borowski, P.F.; Mohamed, M.A. Investigating the Impact of Economic Uncertainty on Optimal Sizing of Grid-Independent Hybrid Renewable Energy Systems. Processes 2021, 9, 1468. [Google Scholar] [CrossRef]
  29. Sahli, Y.; Moussa, H.B.; Zitouni, B. Optimization study of the produced electric power by SOFCs. Int. J. Hydrog. Energy 2019, 44, 22445–22454. [Google Scholar] [CrossRef]
  30. Marques, J.G.; Costa, A.L.; Pereira, C. Gibbs free energy (ΔG) analysis for the NaOH (sodium-oxygen-hydrogen) thermochemical water splitting cycle. Int. J. Hydrog. Energy 2019, 44, 14536–14549. [Google Scholar] [CrossRef]
  31. Faddeev, N.; Anisimov, E.; Belichenko, M.; Kuriganova, A.; Smirnova, N. Investigation of the Ambient Temperature Influence on the PEMFC Characteristics: Modeling from a Single Cell to a Stack. Processes 2021, 9, 2117. [Google Scholar] [CrossRef]
  32. Djeziri, M.; Djedidi, O.; Benmoussa, S.; Bendahan, M.; Seguin, J.L. Failure Prognosis Based on Relevant Measurements Identification and Data-Driven Trend-Modeling: Application to a Fuel Cell System. Processes 2021, 9, 328. [Google Scholar] [CrossRef]
  33. Han, J.; Yu, S.; Yun, J. PEMFC Transient Response Characteristics Analysis in Case of Temperature Sensor Failure. Processes 2020, 8, 1353. [Google Scholar] [CrossRef]
  34. Al-Shamma’a, A.A.; Ali, F.A.A.; Alhoshan, M.S.; Alturki, F.A.; Farh, H.M.; Alam, J.; AlSharabi, K. Proton Exchange Membrane Fuel Cell Parameter Extraction Using a Supply–Demand-Based Optimization Algorithm. Processes 2021, 9, 1416. [Google Scholar] [CrossRef]
  35. Derbeli, M.; Farhat, M.; Barambones, O.; Sbita, L. Control of PEM fuel cell power system using sliding mode and super-twisting algorithms. Int. J. Hydrog. Energy 2017, 42, 8833–8844. [Google Scholar] [CrossRef]
  36. Bao, S.; Ebadi, A.; Toughani, M.; Dalle, J.; Maseleno, A.; Yıldızbası, A. A new method for optimal parameters identification of a PEMFC using an improved version of Monarch Butterfly Optimization Algorithm. Int. J. Hydrog. Energy 2020, 45, 17882–17892. [Google Scholar] [CrossRef]
  37. Yuan, W.; Zhang, J.; Shen, P.K.; Li, C.M. Self-assembled CeO2 on carbon nanotubes supported Au nanoclusters as superior electrocatalysts for glycerol oxidation reaction of fuel cells. Electrochim. Acta 2016, 190, 817–828. [Google Scholar] [CrossRef]
  38. PS, P.; Gudi, R.D.; Bhartiya, S. Dynamic modeling and control of an integrated reformer-membrane-fuel cell system. Processes 2018, 6, 169. [Google Scholar]
  39. Wu, Y.E.; Wang, J.W. Novel high-efficiency high step-up DC–DC converter with soft switching and low component voltage stress for photovoltaic system. Processes 2021, 9, 1112. [Google Scholar] [CrossRef]
  40. Gholizadeh, H.; Babazadeh-Dizaji, R.; Hamzeh, M. High-Gain Buck-Boost Converter Suitable for Renewable Applications. In Proceedings of the 2019 27th Iranian Conference on Electrical Engineering (ICEE), Yazd, Iran, 30 April–2 May 2019; pp. 777–781. [Google Scholar]
  41. Tan, R.H.; Hoo, L.Y. DC-DC converter modeling and simulation using state space approach. In Proceedings of the IEEE Conference on Energy Conversion (CENCON), Johor Bahru, Malaysia, 19–20 October 2015; pp. 42–47. [Google Scholar]
  42. Gohar Ali, H.; Vilanova Arbos, R.; Herrera, J.; Tobón, A.; Peláez-Restrepo, J. Non-linear sliding mode controller for photovoltaic panels with maximum power point tracking. Processes 2020, 8, 108. [Google Scholar] [CrossRef] [Green Version]
  43. Derbeli, M.; Barambones, O.; Silaa, M.Y.; Napole, C. Real-time implementation of a new MPPT control method for a DC-DC boost converter used in a PEM fuel cell power system. Actuators 2020, 9, 105. [Google Scholar] [CrossRef]
  44. Podlubny, I. Fractional-order systems and PIλDμ-controllers. IEEE Trans. Autom. Control 2021, 44, 208–214. [Google Scholar] [CrossRef]
  45. Ding, X.; Li, R.; Cheng, Y.; Liu, Q.; Liu, J. Design of and Research into a Multiple-Fuzzy PID Suspension Control System Based on Road Recognition. Processes 2021, 9, 2190. [Google Scholar] [CrossRef]
  46. Mirjalili, S.; Mirjalili, S.M.; Lewis, A. Grey wolf optimizer. Adv. Eng. Softw. 2014, 69, 46–61. [Google Scholar] [CrossRef] [Green Version]
  47. Ding, J.; Chen, G.; Yuan, K. Short-term wind power prediction based on improved grey wolf optimization algorithm for extreme learning machine. Processes 2020, 8, 109. [Google Scholar] [CrossRef] [Green Version]
  48. Komijani, H.; Masoumnezhad, M.; Zanjireh, M.M.; Mir, M. Robust hybrid fractional order proportional derivative sliding mode controller for robot manipulator based on extended grey wolf optimizer. Robotica 2020, 38, 605–616. [Google Scholar] [CrossRef]
  49. Rahmani, M.; Komijani, H.; Rahman, M.H. New sliding mode control of 2-DOF robot manipulator based on extended grey wolf optimizer. Int. J. Control Autom. Syst. 2020, 18, 1572–1580. [Google Scholar] [CrossRef]
  50. Barisal, A.K. Comparative performance analysis of teaching learning based optimization for automatic load frequency control of multi-source power systems. Int. J. Electr. Power Energy Syst. 2015, 66, 67–77. [Google Scholar] [CrossRef]
  51. Zhu, W.; Guo, J.; Zhao, G. Optimal sizing of an island hybrid microgrid based on improved multi-objective grey wolf optimizer. Processes 2020, 8, 1581. [Google Scholar] [CrossRef]
Figure 1. Cross section of a single PEMFC.
Processes 10 00450 g001
Figure 2. Principle of indirect adaptation with control technique.
Processes 10 00450 g002
Figure 3. Basic electrical diagram of the boost converter linked to PEMFC.
Processes 10 00450 g003
Figure 4. Types of controllers according to λ and μ .
Processes 10 00450 g004
Figure 5. Grey wolf hierarchy.
Processes 10 00450 g005
Figure 6. GWO flowchart.
Processes 10 00450 g006
Figure 7. PEMFC polarization curve under different operating temperatures and hydrogen gas pressure.
Processes 10 00450 g007
Figure 8. (Top) Resistance; (middle) Temperature; (bottom) Hydrogen gas pressure.
Processes 10 00450 g008
Figure 9. PEMFC stack output current.
Processes 10 00450 g009
Figure 10. PEMFC stack output voltage.
Processes 10 00450 g010
Figure 11. PEMFC stack output power.
Processes 10 00450 g011
Figure 12. Boost converter output signals.
Processes 10 00450 g012
Table 1. The PEMFC model parameters.
ParameterValue
A162 cm 2
β 23
l175 × 10 6 cm
ψ 0.1 V
R c 0.0003
J m a x 0.062 A·cm 1
N c 10
ζ 1 0.9514 V
ζ 2 −0.00312 V/K
ζ 3 −7.4 × 10 5 V/K
ζ 4 1.87 × 10 4 V/K
Table 2. FOPID and PID upper and lower bounds.
ControllerRange k p k i k d λ μ
FOPIDMin0.0100.10.010.01
Max1212150.950.95
PIDMin0.0100.1--
Max121215--
Table 3. FOPID and PID obtained parameters.
Controller k p k i k d λ μ
GWO-PID2.57420.10008--
GWO-FOPID4.00662.43762.53270.80950.1000
EGWO-PID5.33600.100015--
EGWO-FOPID3.09622.16147.04290.8030.0109
Publisher’s Note: MDPI stays neutral with regard to jurisdictional claims in published maps and institutional affiliations.

