Article

Investigation of the Ambient Temperature Influence on the PEMFC Characteristics: Modeling from a Single Cell to a Stack

Technological Department, Platov South-Russian State Polytechnic University (NPI), 346428 Novocherkassk, Russia
*
Author to whom correspondence should be addressed.
Processes 2021, 9(12), 2117; https://doi.org/10.3390/pr9122117
Submission received: 18 October 2021 / Revised: 20 November 2021 / Accepted: 22 November 2021 / Published: 24 November 2021
(This article belongs to the Special Issue Modeling Approaches in Fuel Cells and Electrolyzers)

Abstract

:
Power supply systems based on air-cooled proton exchange membrane fuel cell (PEMFC) stacks are becoming more popular as power sources for mobile applications. We try to create a PEMFC model that allows for predicting the PEMFC operation in various climatic conditions. A total of two models were developed and used: the membrane electrode assemble (MEA) model and the PEMFC stack model. The developed MEA model allows to determine the influence of external factors (temperature) on the PEMFC power density. The data obtained using the developed model correlate with experimental data at low ambient temperatures (10–30 °C). The difference between the simulation and experimental data is less than 10%. However, the accuracy of the model during PEMFC operation at high (>30 °C) and negative ambient temperatures remains in doubt and requires improvement. The obtained data were integrated into the air-cooled PEMFC stack model. Data of the temperature fields distribution will help to manage the processes in the PEMFC stack. The maximum temperature is slightly above 60 °C, which corresponds to the optimal conditions for the operation of the stack. The temperature gradient across the longitudinal section is very low (<20 °C), which is a positive factor for the chemical reaction. However, the temperature gradient observed across the cross section of the PEMFC stack is 30 °C. The data obtained will help to optimize the mass-dimensional characteristics of air-cooled proton exchange membrane fuel cell and increase their performance. The synergetic effect between the MEA model and the PEMFC stack model can be successfully used in the selection of materials and the development of a thermoregulation system in the PEMFC stack.

1. Introduction

Power supply systems based on air-cooled proton exchange membrane fuel cell (PEMFC) stacks are becoming more popular as power sources for mobile transport applications, robotics, and unmanned aerial vehicles (UAVs), etc. [1]. Typically, the power of such PEMFC stacks is up to a few kW [2]. The PEMFC consists of two parts: bipolar plates (BP) and membrane electrode assembly (MEA). The MEA includes only one cathode and one anode. Each of the electrodes is a catalytic layer applied to carbon paper or cloth (gas diffusion layer (GDL)). Both electrodes are in contact with a proton exchange membrane [3]. Most of the heat generated during PEMFC operation is dissipated into the surrounding atmosphere via forced air convection along the cooling channels in BP. This type of fuel cell is also termed an open cathode fuel cell because the reactant air is directly taken from and removed to the environment.
It is necessary to create a model that takes into account the influence of external factors (temperature and humidity) on the PEMFC power density to predict the PEMFC operation in different climatic conditions. Previously, research has been carried out on the operation of an air-cooled PEMFC using a climatic chamber [4]. The recorded maximum power density was below 0.2 W/cm2. Another group investigated the effect of increased external temperature on the power density of a single PEMFC and a stack consisting of five PEMFCs [5]. The PEMFCs were operated on humidified H2 at 55 °C at the anode, and dry, ambient air at the cathode. The observed maximum current density for the single PEMFC and stack was 0.3 A/cm2 and 0.25 A/cm2, respectively. Other research has focused on modeling mass and heat transfer in air-cooled PEMFC [6,7,8]. Commercial ANSYS Fluent software has been used for computational fluid dynamics studies that included the foretold PEMFC performance. Akbari et al. [9] and Shahsavari et al. [10] developed a single-phase computational model of an air-cooled PEMFC using COMSOL Multiphysics®. The focus was put on a better understanding of the prediction of the maximum stack temperature, the thermal management, and the main temperature gradient.
The influence of external temperatures on the PEMFC start was investigated in the works of Ju H. et al. [11,12] and Tabe Y. et al. [13]. Ju H. et al. developed a multiphase transient model for investigating key transport and physical phenomena during the startup of a PEMFC from subzero temperatures. The proposed PEMFC cold-start model rigorously considers ice formation in the cathode and their complicated interactions with electrochemical reactions, mass, and heat transportation [11,12]. PEMFC cold-start characteristics was investigated experimentally. Microscopic observations were conducted to clarify the freezing mechanism; it has been shown that the freezing mechanism can be classified into two types. The first type freezes due to supercooled water at the interface between the GDL and the catalyst layer near 0 °C. The second type freezes in the cathode catalyst layer at low temperatures, such as −20 °C [13].
The main target of this work was the PEMFC model creation that allows for predicting the PEMFC operation in various climatic conditions. The MEA model was developed, which allow to determine the influence of external factors (temperature) on the PEMFC power density, and the obtained data were integrated into the air-cooled PEMFC stack model.

2. Materials and Methods

The PEMFC model was developed using COMSOL Multiphysics® (Version: 5.6.0.280) and SolidWorks Flow Simulation programs. Firstly, the MEA was modelled by the finite element method in COMSOL Multiphysics®, the obtained data were compared with experimental data and integrated into the PEMFC stack model in SolidWorks Flow Simulation program.

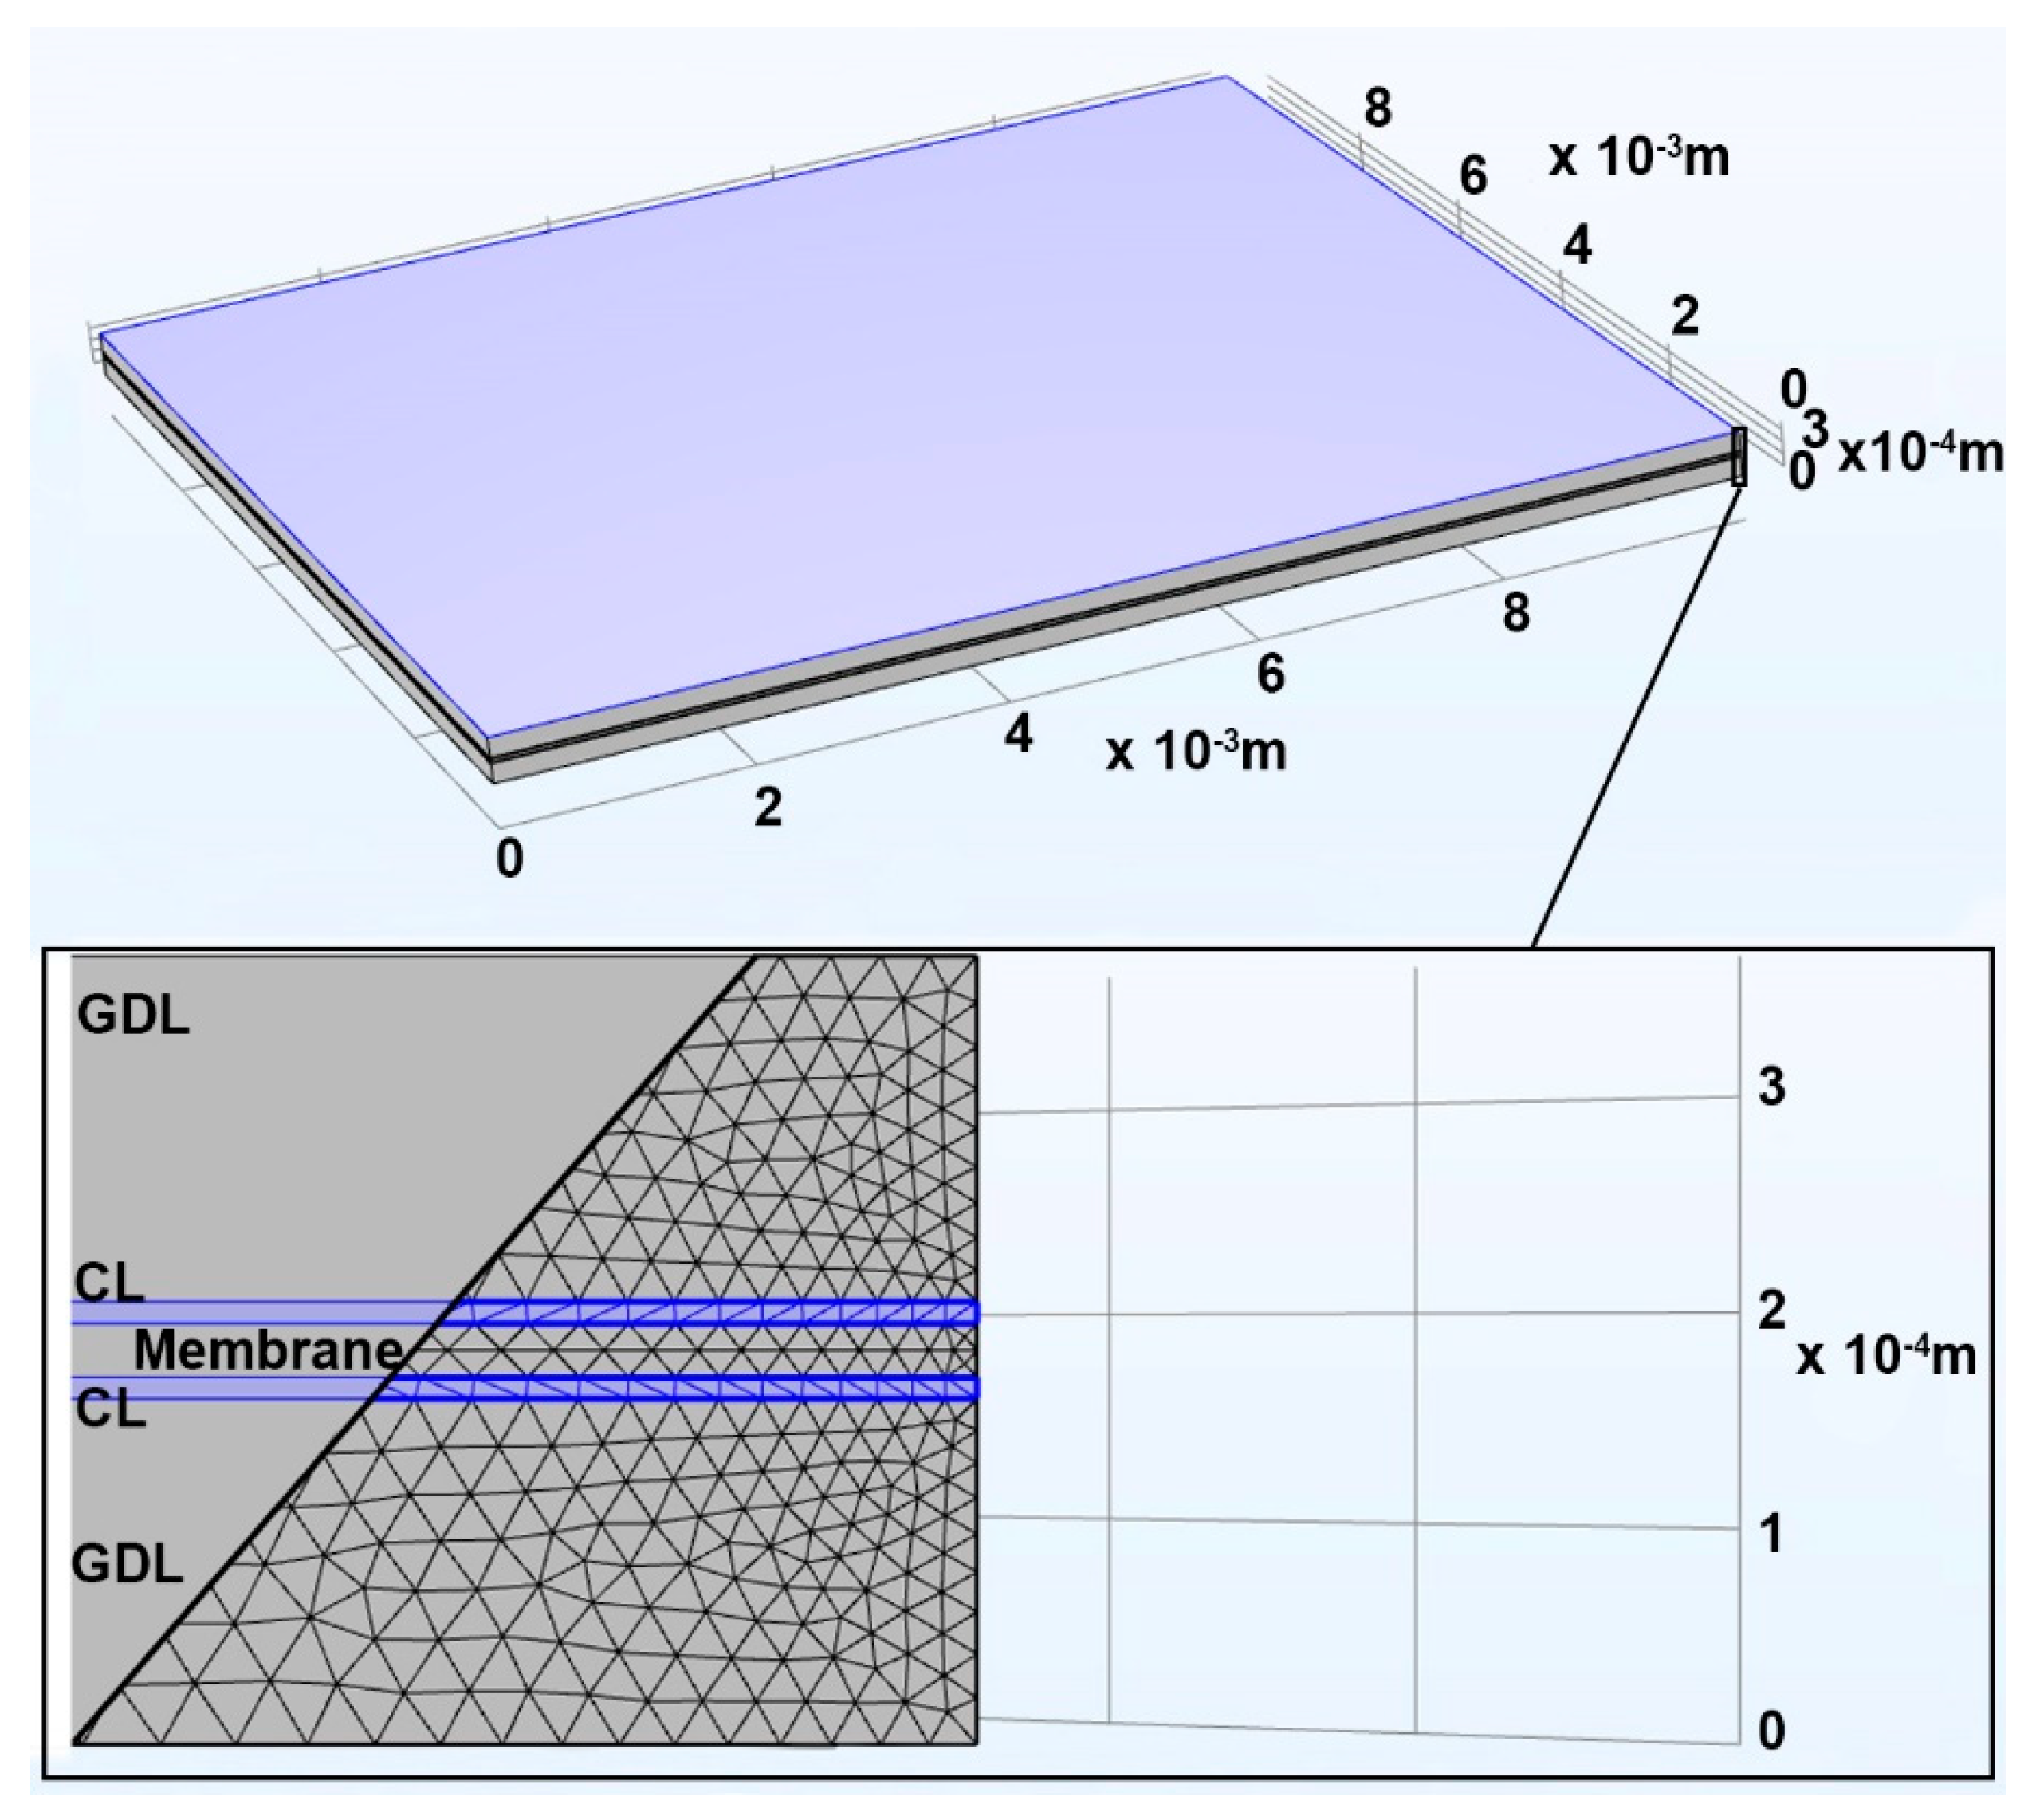
2.1. MEA Simulation Model

The MEA is represented as a series of 5 adjacent homogeneous interval subdomains. This includes the 2 gas diffusion layers (GDLs) with deposited catalyst layers (CLs) and proton exchange membranes (PEM) located between them. The BPs on either end are modeled as MEA boundaries. The MEA model geometry is shown in Figure 1. The simulations were carried out for an MEA. In this case, the MEA was divided into 2,293,362 nodes and 13,224,400 elements.
The air-cooled PEMFC principle: O2 from the air is combined with H2 to produce electricity and H2O. A certain amount of waste heat is produced due to overpotentials that predominantly occur at the PEMFC CLs and inside the PEM. The H2 combustion reaction is split into two electrochemical half-reactions in PEMFCs [14]:
H 2 2 H + + 2 e
2 H + + 1 2 O 2   + 2 e   H 2 O
The reversible potential of unit fuel cell is given by the Nernst equation [15]:
Δ ϕ 0 = Δ G 2 F + R T 2 F l n [ ( p H 2 P r e f ) ( p O 2 P r e f ) 1 / 2 ]
where ∆G is change in Gibbs free energy due chemical reaction at cathode and anode, F is the Faraday constant, T is the temperature, R the gas constant, pH2 = χH2P and pO2 = χO2P are the partial pressures of hydrogen and oxygen, and Pref = 1 atm is the reference pressure. Oxygen reduction reaction (ORR) and hydrogen oxidation reaction (HOR) in cathode and anode CLs can be described by Butler–Volmer kinetics. The rate of HOR and ORR in the CLs is thus locally given by [3]:
i = i 0 a ( e x p [ β 2 F R T   η ] e x p [ ( 1 β ) 2 F R T   η ] )
with (positive) activation overpotential
η = { Δ ϕ Δ ϕ 0   i n   a n o d e   c a t a l y s t   l a y e r   ( A C L ) Δ ϕ 0 Δ ϕ   i n   c a t h o d e   c a t a l y s t   l a y e r   ( C C L )
∆𝜙 = 𝜙e − 𝜙p is the Galvani potential difference between the proton and electron conducting phases (Table 1). The reversible potential difference ∆𝜙0 is divided into
Δ ϕ 0 = { T Δ S H O R 2 F R T 2 F l n [ p H 2 P r e f ]   i n   A C L Δ H T Δ S O R R 2 F + R T 4 F l n [ p O 2 P r e f ]   i n   C C L
with total reaction entropy ∆S = ∆SHOR + ∆SORR. Positive i corresponds to a source of positive charge or mass in the continuity equations (Table 2).
Transport processes of charge, energy, gas species, and water are described using coupled second-order partial differential equations (PDEs) (Table 1). Ohm’s law is used to describe the flux of electrons (je) in the CLs and in the GDLs. The similar equation is used for the flux of protons (jp) within the electrolyte phase of the catalyst layers and the PEM. The classical porous-electrode theory of Newman was used and adapted for this. [16]. Ohm’s law governs how the flow of electrons (je) and protons (jp) is controlled by a gradient of different phase potentials (𝜙e and 𝜙p) that coexist in the catalyst layer.
The model by Springer et al. [17] was used for the description of water balance in the PEM. The number of H2O molecules per acid group (λ) in the ionomer allows one to represent the degree of its humidification. The molar flux of dissolved H2O (jλ) is composed of the sum of its two components: electro-osmotic drag (jλ~jp~−𝜙p) and reverse diffusion caused by the moisture gradient (jλ~−λ).
Fourier’s law allows to describe the heat flux (jT), which is the main method of energy transfer in the membrane-electrode assembly [18].
We used unsaturated flow theory [19] to describe the transport of liquid water. Liquid water flux is controlled by a gradient of the water saturation of pore space ∇s. This requires the specification of material properties such as the differential relationship between the saturation and capillary pressure (∂pc/∂s) and the saturation-dependent hydraulic permeability (k).
The last 3 equations are dedicated to the gas species transport in membrane-electrode assembly. It is sufficient to consider oxygen on the cathode side, hydrogen only on the anode side, and water vapor in both gas mixtures, if gas crossover across PEM is disregarded. The simplest transport model for the gases transport is Fick’s law (jx =CDxχx) [20]. The dominant transport mechanism is interred diffusion of the gas species caused by a uniform gas pressure (P) in a steady state. Thermal diffusion is disregarded. The ideal gas law is used to calculate the interstitial gas concentration C = P/RT.
Continuity equations for all fluxes are expressed in Table 1. Source term (S) is equating to the divergence of each flux (j).
A summary of all source term and phase transitions definitions is given in Table 2. A detailed description of the phase transitions processes associated with hydrogen oxidation, oxygen reduction and water formation in the catalyst layers is considered in one-dimensional PEMFC model taken as a basis [21].
The set of boundary conditions for this model is presented in Table 3.
The set of cell dimensions and operating conditions for this model is presented in Table 4. It shows the values of thickness, ionomer volume fraction, pore volume fraction, pore tortuosity, absolute permeability, thermal and electrical conductivity of the MEA components.
The set of operating conditions of the base case for this model is presented in Table 5.

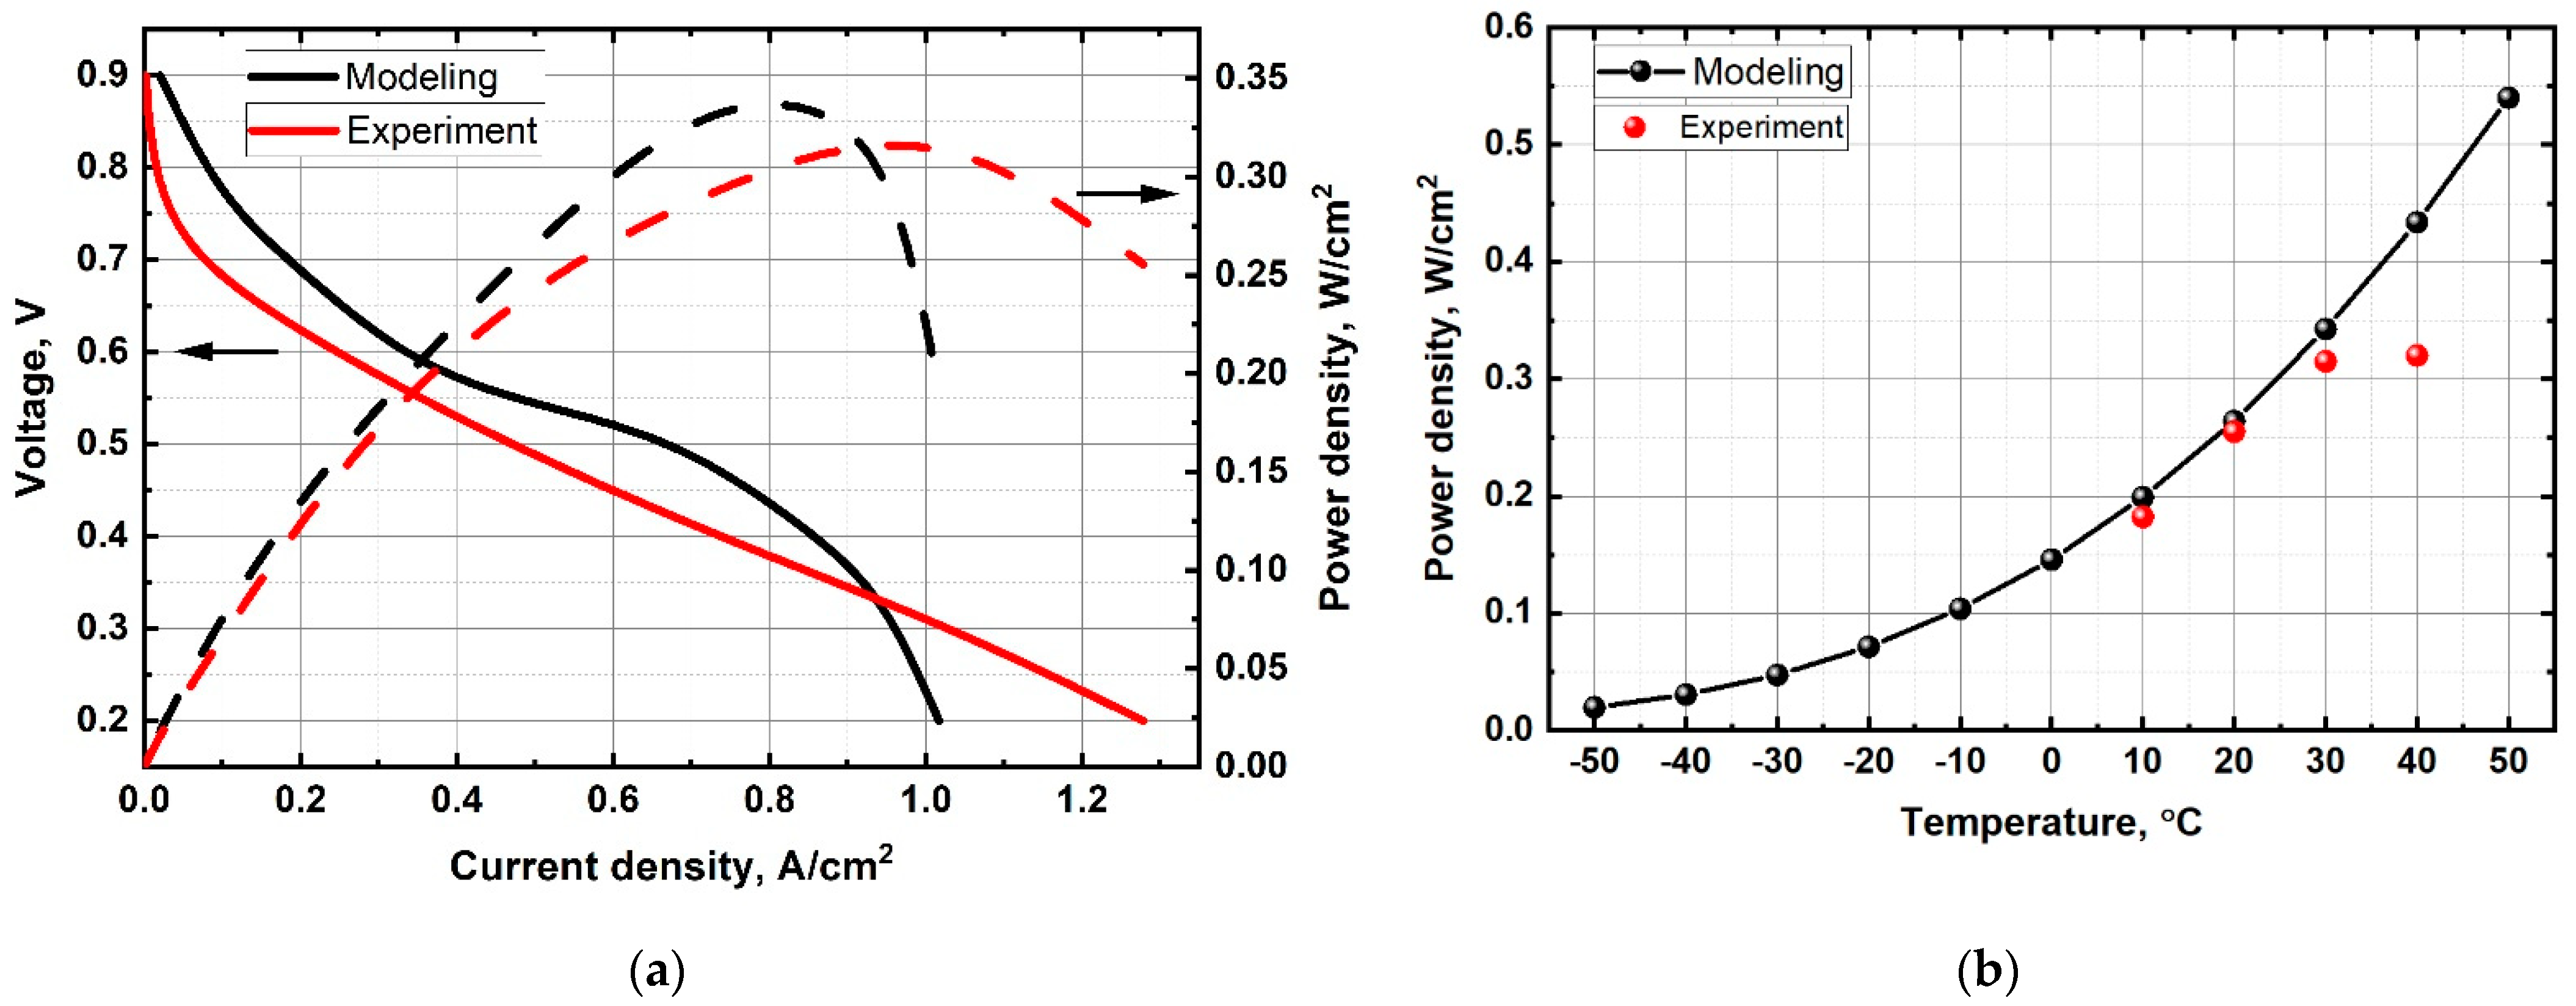
2.2. PEM Fuel Cell Hardware Experimental Data

The catalyst inks for MEA were prepared with an ionomer (10 wt% Nafion dispersion) isopropanol and pure H2O with the use of an ultrasonic bath for 1 h. The catalyst inks were directly sprayed onto the GDL (Freudenberg H23C3) at 80 °C to prepare the MEA. The membrane was connected to 2 GDL (Freudenberg H23C) and annealed by hot pressing at 130 °C and 80 kg/cm2 for 3.5 min. PEMFC hardware (active geometric area of 4 cm2) was used to study the MEA. The Pt/C catalysts were used both at the cathode and anode CLs of MEA. The Pt loading of the cathode and anode CLs were 0.8 mg/cm2 and 0.4 mg/cm2, respectively. The hydrogen humidity was 100%, oxygen (air), and was used as an oxidizing agent. Gas pressure in the system: H2—1.5 atm., air—1.5 atm. The MEA electrochemical characteristics were determined using a P-45-X potentiostat-galvanostat (Elins, Russia). The MEA was prepared in a potentiostatic mode at a voltage of 0.4 V for several hours before recording the volt-ampere curve. The study of the MEA power characteristics was carried out in a potentiostatic step mode in the voltage range of 0.9–0.2 V; the transition to the next voltage was carried out only after the establishment of a current stationary value at a given potential.

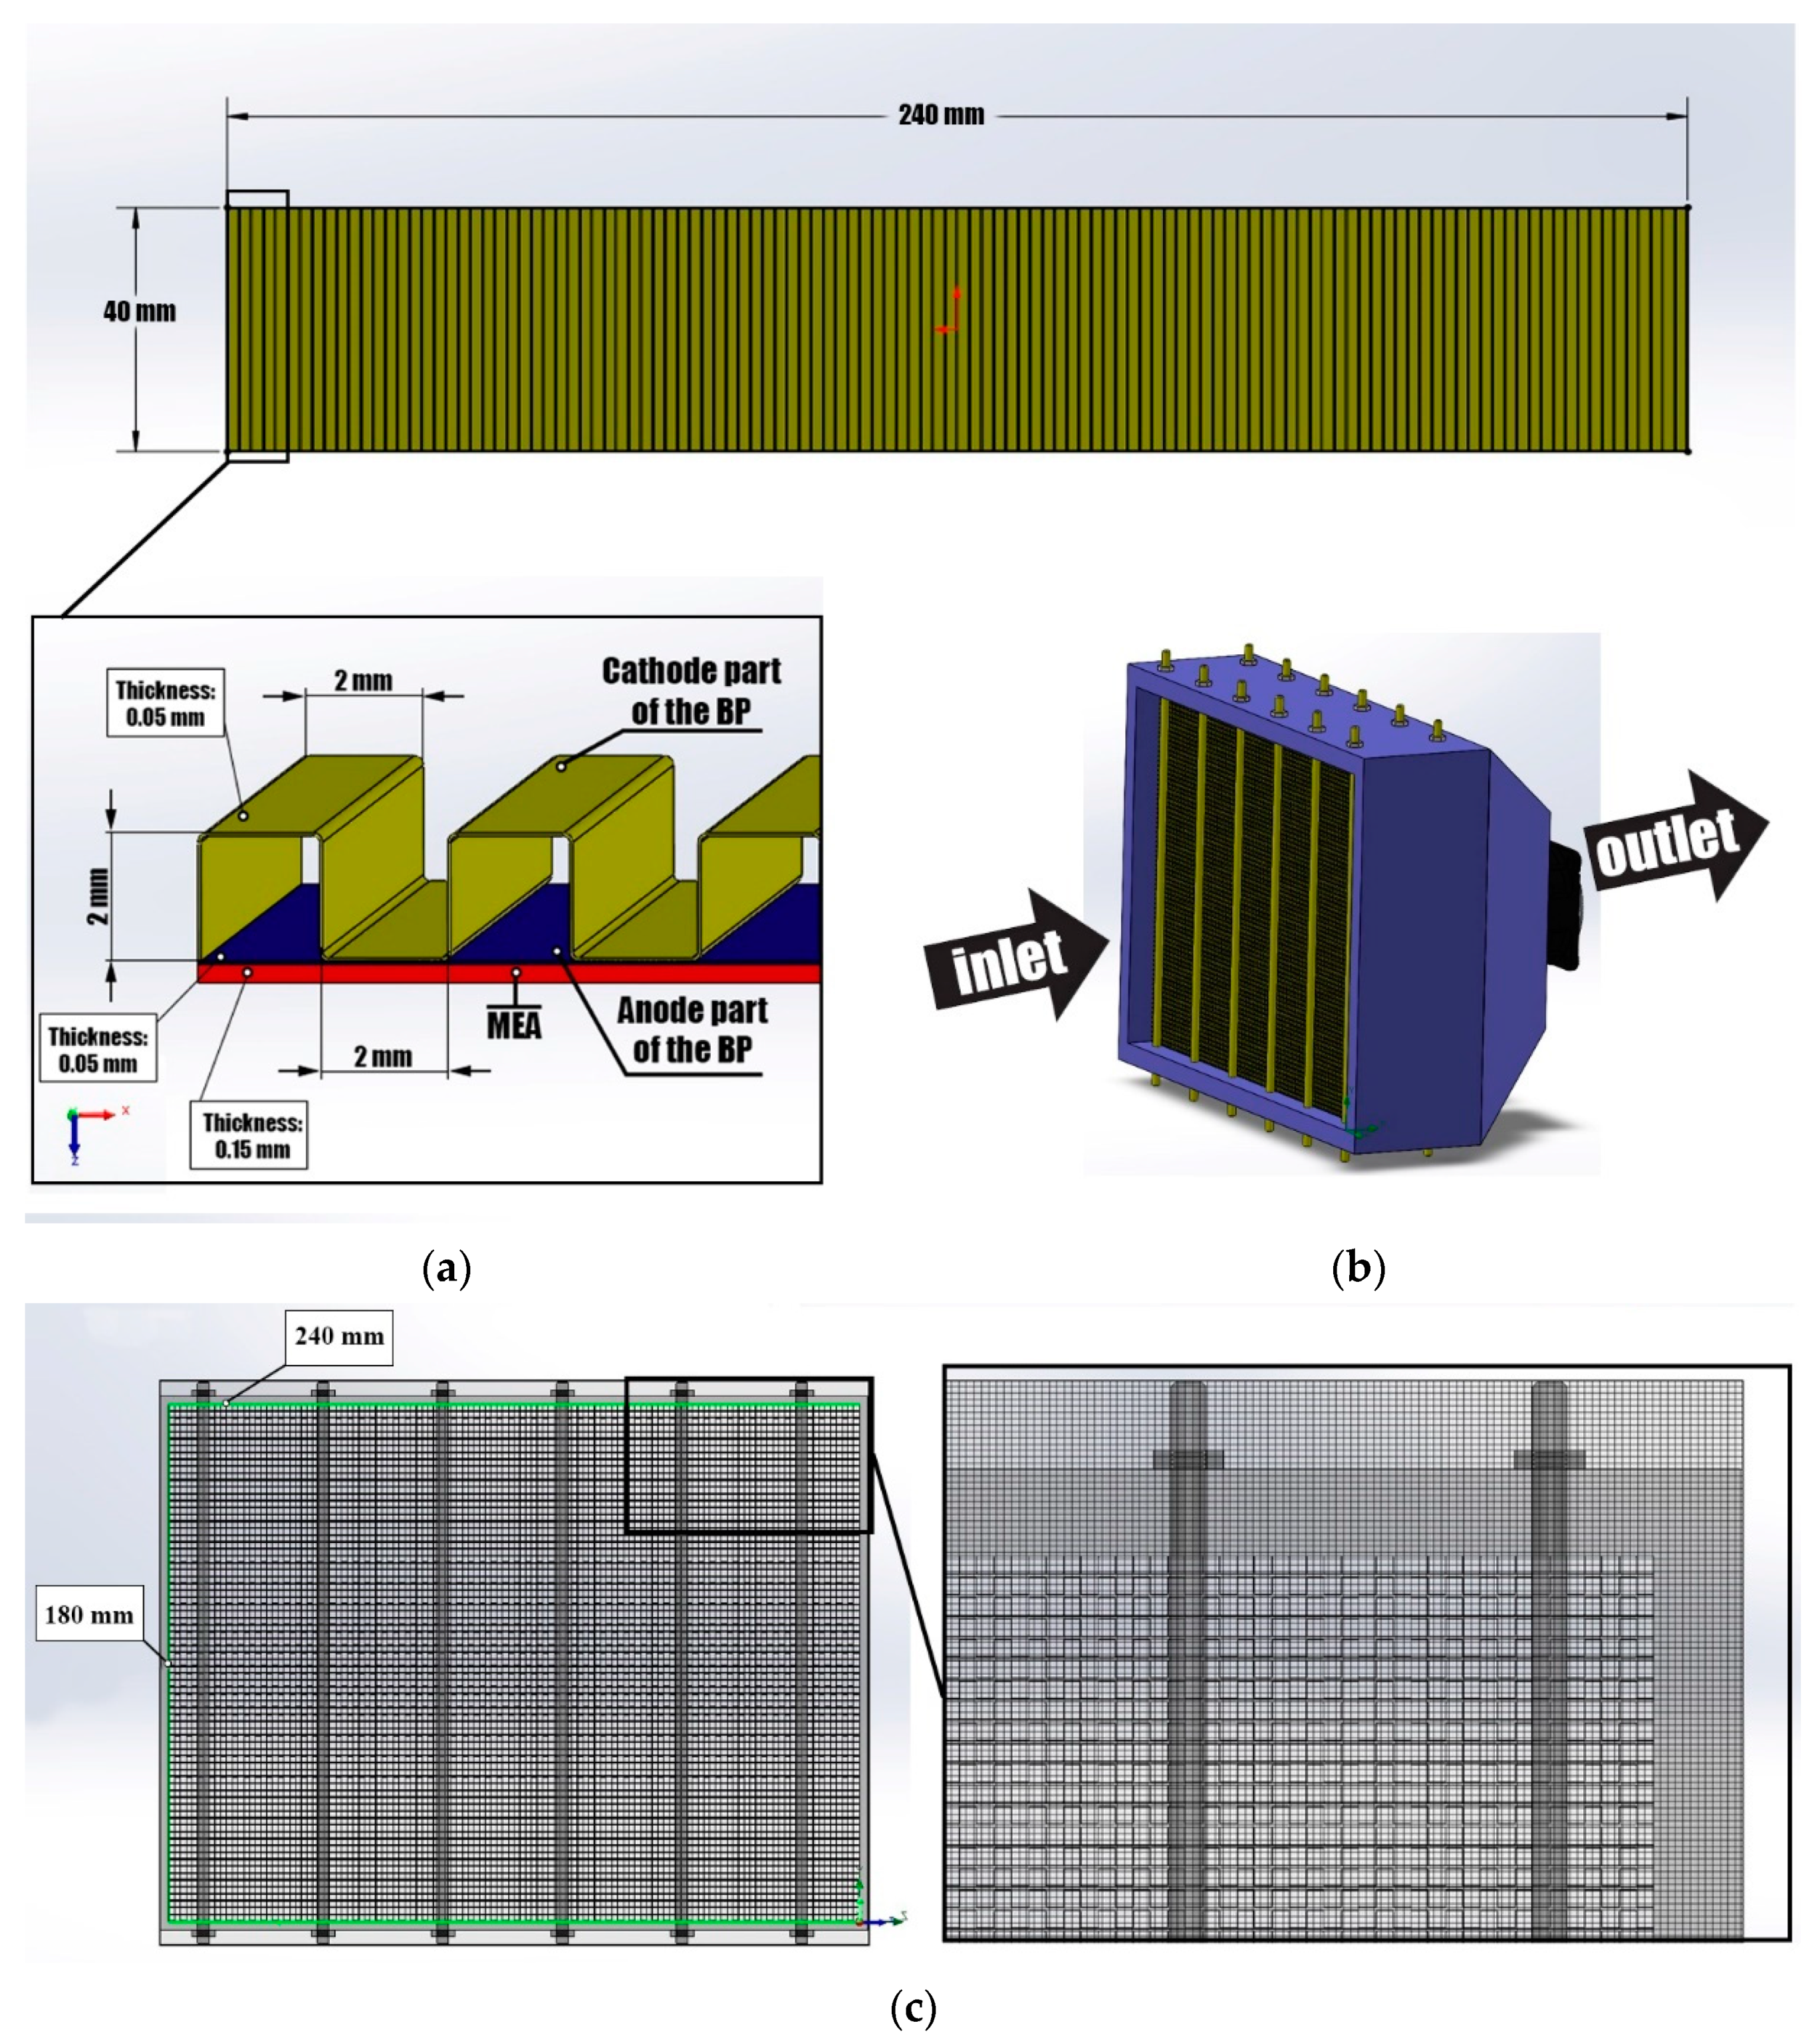
2.3. PEMFC Stack Simulation Model

Thermo-fluid simulations of the air-cooled PEMFC stack were performed in the SolidWorks Flow Simulation program. Flow Simulation simulates the process by discretizing space and time, in such a way that the geometry of the process is divided into calculated cells, and the process time into calculated time intervals. The Navier–Stokes equation is solved for each individual computational cell. The equation is a system of partial differential equations describing the motion of a viscous Newtonian fluid. The finite element method is used to solve this system. The more elements the model is broken into, the more accurate the calculations become, but more computational resources are required to solve these equations. The grid parameters, boundary conditions, heat-generating elements, and their heat dissipation power were set for the simulation. The design of the PEMFC stack consists of the following elements:
Air-cooled PEMFC stack;
Number of PEMFC in stack—75 units;
Fuel cell consists of a MEA and BP;
Material of BP is titanium;
BP size—40 × 240 mm;
BP consists of 2 parts (cathode and anode);
Anode part of the BP has smooth configuration;
Cathode part of the BP has a channels configuration—pitch—2 mm; height—2 mm; width—2 mm;
2 end-plates provided at the longitudinal, opposing ends of the PEMFC stack;
Plurality of tie rods, passing through a peripheral region of each end plate for positioning the PEMFC stack between the 2 end-plates;
2 fans with confuser for supplying an oxidizing agent and cooling a PEMFC stack;
Fittings for supplying fuel (H2), electrical leads.
The simulations were carried out for a PEMFC stack. In this case, the stack was divided into 6,818,466 cells:
Fluid cells—3,352,729 units;
Solid cells—3,465,737 units;
Fluid cells contacting solids—2,500,284 units;
The simulations were carried out under the following conditions:
Cooling and oxidizer agent –air;
Flow rate of cooling and oxidizer agent—0.008 m3/s;
Heat emission as a result of H2 oxidation—50% of the nominal stack power;
Heat transfer coefficient from PEMFC stack to outside –0*;
Atmospheric pressure—1 atm, 101,325 Pa (in the inlet of the PEMFC stack);
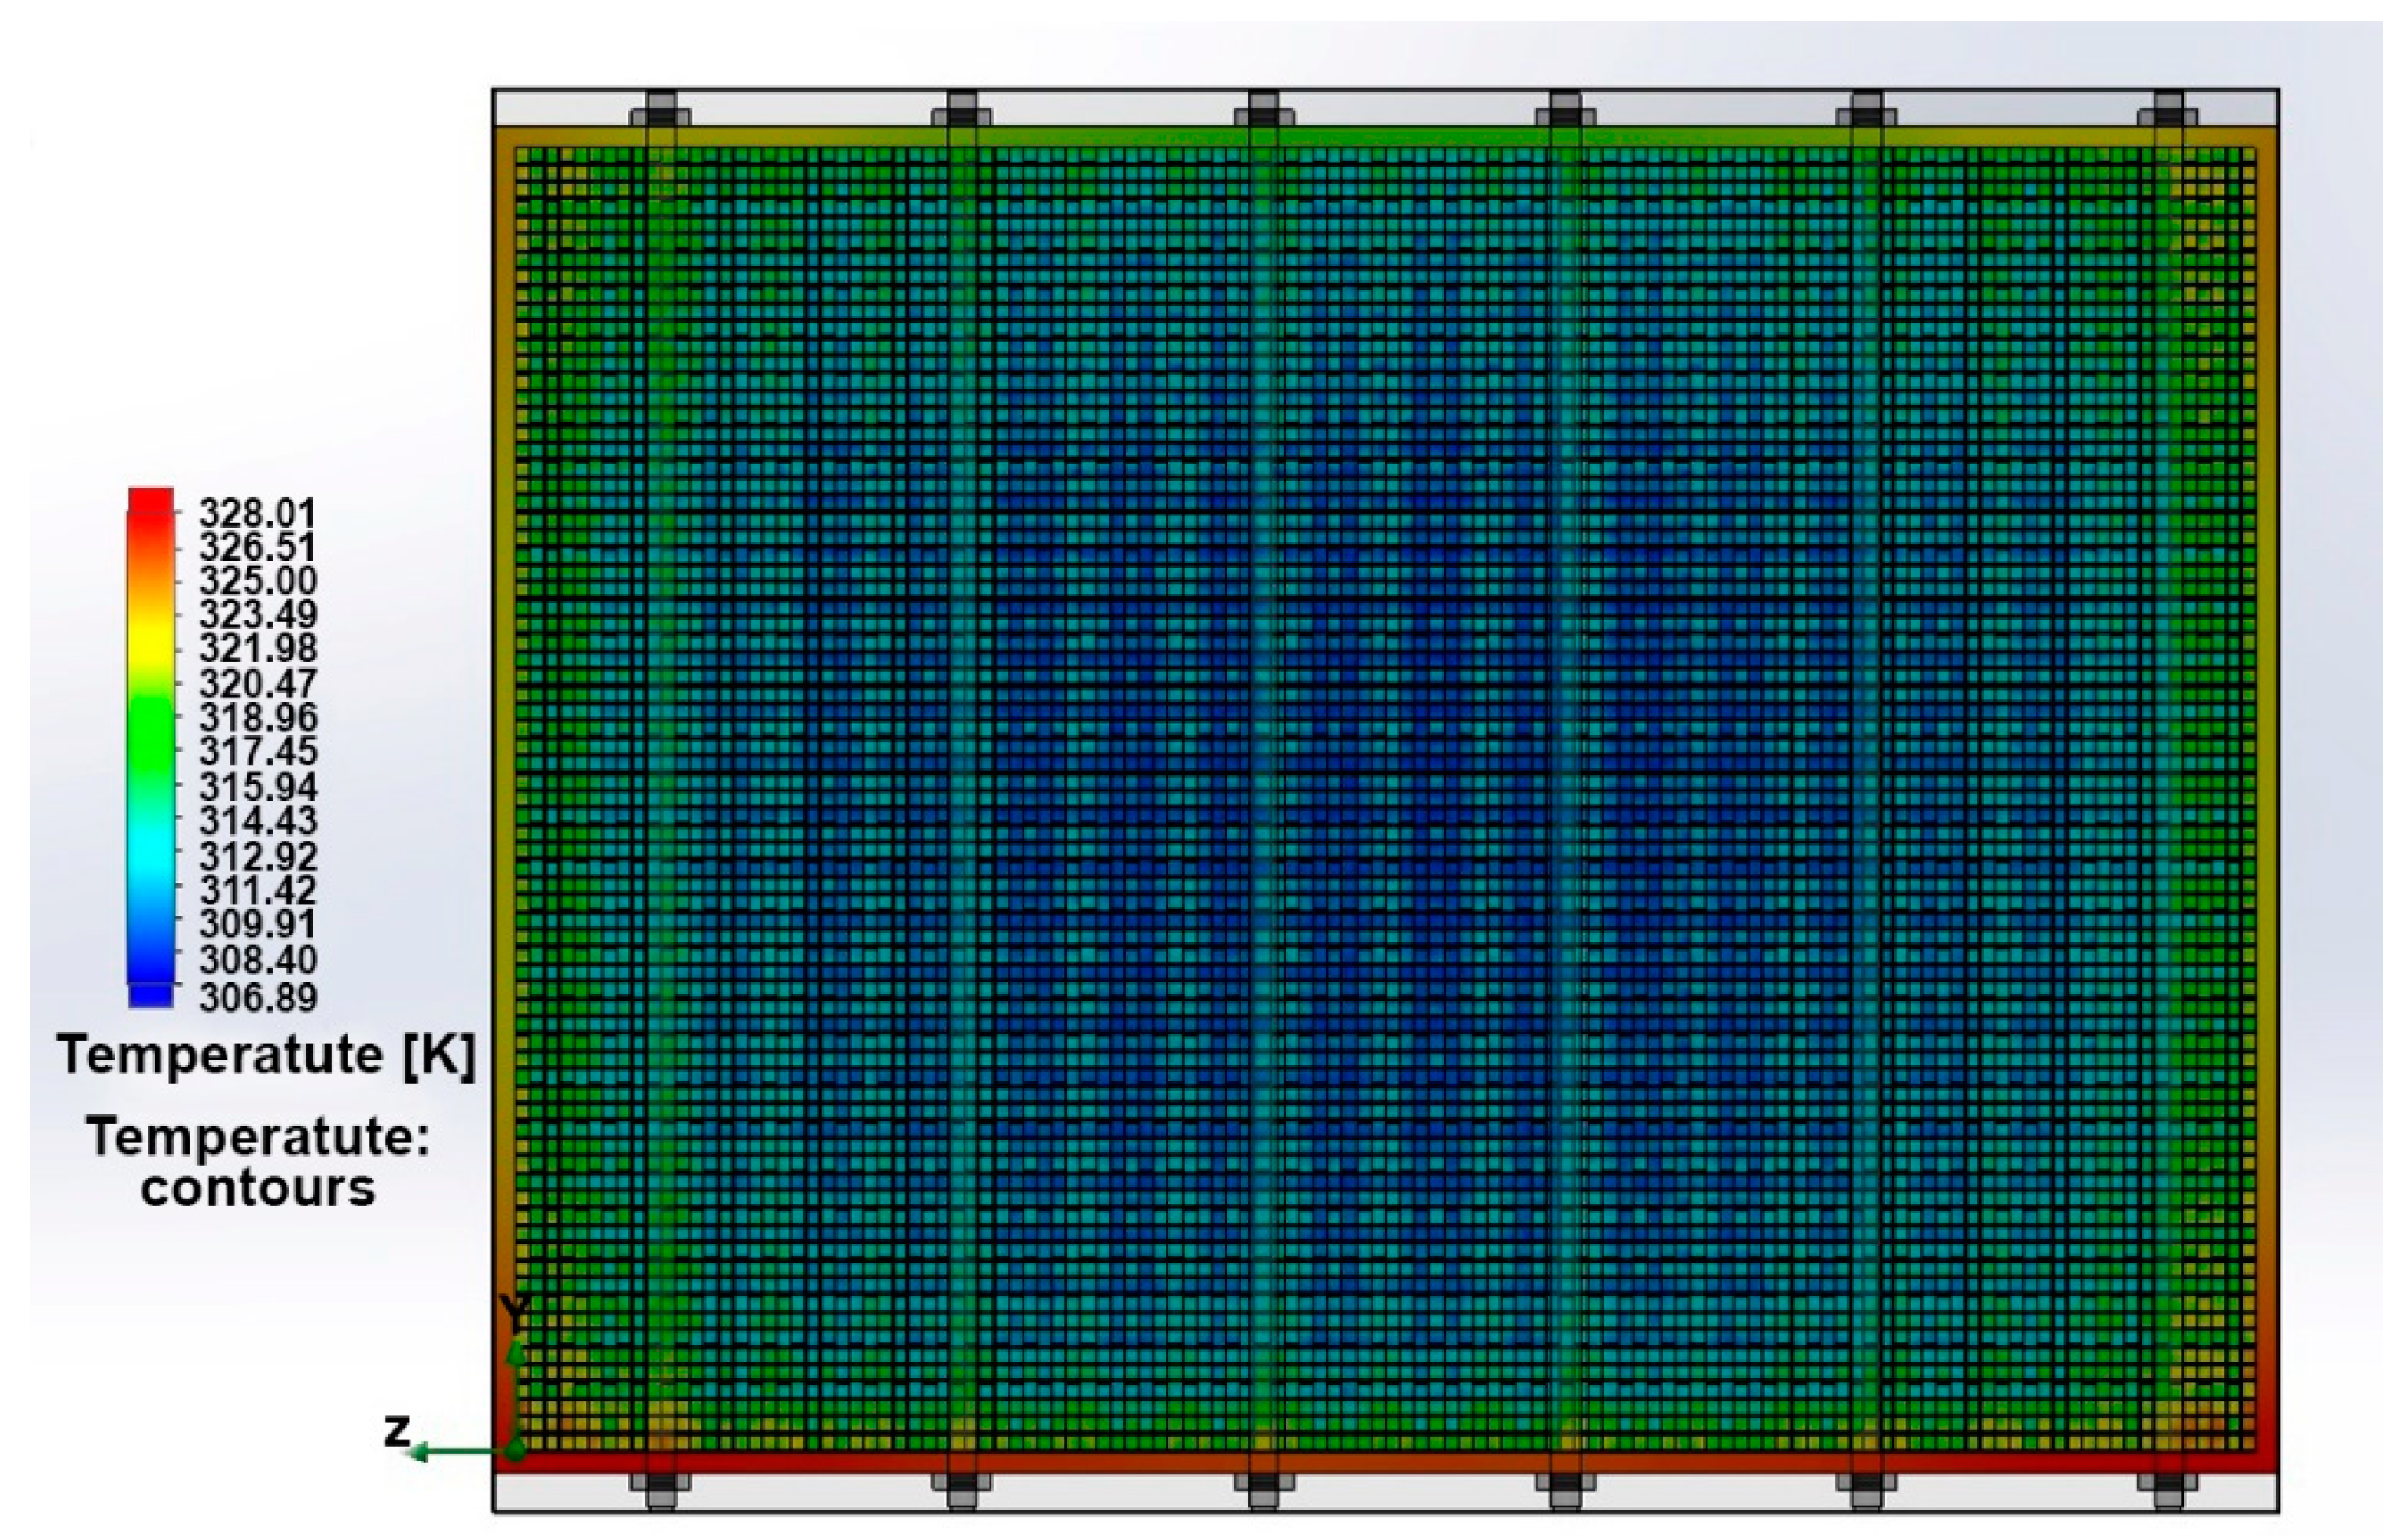
Ambient temperature—30 °C.
*—The heat transfer coefficients from PEMFC stack to outside depend on many factors (material of the PEMFC stack body, surface roughness, and whether there is additional temperature control system, etc.). It is very difficult to determine them accurately enough. Therefore, it was assumed that the heat transfer coefficients from PEMFC stack to outside is zero in this model.

3. Results and Discussion

Voltammetric and power characteristics obtained using the model and experiment are shown in Figure 2. The maximum values of the MEA power characteristics at an ambient temperature of 30 °C in the model and experiment were 0.34 W/cm2 and 0.315 W/cm2, respectively. Figure 2a shows that losses are associated with activation polarization in the 0.9–0.6 V region and consequently associated with the ORR kinetics. The ohmic losses region (0.6–0.5 V) is characterized by a linear voltage—flowing current dependence due to the influence of the electrolyte and electrodes resistance to the ions and electrons transfer. At high current densities, losses associated with mass transfer dominate, which is mainly characterized by the gases supply through the porous structures of the GDLs and CLs.
The imperfection of the model leads to a difference between experimental data and model data (Figure 2b). The model does not take into account some physical and chemical processes occurring during the PEMFC operation. These processes can have a significant impact on the PEMFC power characteristics under certain operating conditions. The difference is due to the fact that the model does not account the effects of gas and heat convections, gas species permeation and pressure-driven hydraulic permeation of H2O through the PEM, thermo-osmosis [21], non-uniformity in material properties (wettability and porosity), mechanical deformation, multi-step reaction kinetics, change of Tafel slope [27] caused by the platinum oxide formation, effects in thin, porous layers [28,29], or unsteady phenomena, etc.
The influence of electrical resistance, thermal contact resistance [30], formation and melting of ice have a particularly strong effect on the PEMFC power characteristics at high and low ambient temperatures, respectively. The difference in power characteristics between the model and experimental data becomes even greater when the ambient temperature rises above 25 °C. This is due to an increase in the resistance of current collectors when working with the fuel cell hardware and metal BPs in the PEMFC stack. The metals resistivity increases when heated (due to an increase in the speed of atoms movement in the conductor material with increasing temperature). In addition, the simulation results show the possibility of PEMFC operation at negative temperatures, because the model does not take into account the processes of ice formation and melting. The ice formation in the MEA leads to the absence of PEM proton conductivity and to the violation of its integrity under real PEMFC operating conditions. Thus, it is necessary to think over the heating system or the recuperation of the generated heat, or both, when developing the PEMFC stack, in order to solve the icing problem.
The obtained data and dependencies were used in the PEMCF stack model (power—1.5 kW) using the SolidWorks Flow Simulation program (Figure 3). Previously, we used this model to study the distribution of the oxidizer agent flows and temperature fields in dependence with location of the cooling and oxidizer supply system in the PEMFC stack [31]. The PEMFC stack consists of 75 single fuel cells (Figure 3b). The single fuel cell consists of an MEA and a bipolar plate. The bipolar plate consists of a cathode and anode parts, that have symmetrical centers and technological holes for supplying reagents (Figure 3a). The cathode part is made as a corrugated metal plate with distribution channels of rectangular cross-sections, through which the cooling and oxidizer agent (air) is supplied. The distribution channels are as follows: configuration-pitch—2 mm, height—2 mm, width—2 mm. The anode part is flat. The connection of the cathode and anode parts is made along the bipolar plate contour at its contact points. The connection of the MEA and BP is made along the contour using a special sealant, and so this area does not participate in the electrochemical reaction. The size of a single fuel cell is 40 × 240 mm and has an electrochemical reaction zone of 69 cm2. The electrochemical reaction zone of the PEMFC stack was 5175 cm2. Figure 3c show image of the PEMFC stack model with the mesh.
The air movement and supply of clean air is carried out by mechanical means. The cooling and oxidizer supply system is made in the form of two fans installed in the PEMFC stack body at a distance of 60 mm from the stack exit. When the cooling and oxidizer supply system is activated, air flows are evenly distributed over the entire inner surface of the PEMFC stack in BP gas distribution channels. Thus, on the front side of the PEMFC stack, the cooling and oxidizer agent is taken in and evenly distributed along the distribution channels, and air comes out from the exit from the PEMFC stack, which already takes part in the process of obtaining energy from hydrogen.
Figure 4 shows the temperature field’s distribution in PEMFC stack, taking into account previously obtained data.
A total of two fans are included in the cooling and oxidizer supply system. It may cause swirls and disturbances of the oxidizer flow due to the blades rotation that do not always have an optimal design. The PEMFC stack tie rods are opposite its exit and entry, which also may contribute swirl and disturbance to the oxidizer flow. Self-humidification happens during operation in a stack steady-state work mode. The thermophysical properties of cooling and oxidizer agent at a calculated temperature range (0 °C –50 °C) are nearly independent of humidity [32]. The simulation was carried out for the most severe operating PEMFC stack conditions of zero cooling and oxidizer agent humidity.
Figure 5a,b shows the velocity field in the stack longitudinal section without and with streamlines. Streamlines make it possible to see the presence or absence of gas turbulence and stagnant zones. The movement of the oxidizer occurs uniformly along the PEMFC stack channels, and minor eddies in the area of the pins do not have a significant effect on the supply of the oxidizer to the PEMFC stack.
The temperature fields in the longitudinal and in the cross section of the stack at the inlet and outlet from the PEMFC stack are shown in Figure 6a–c. It can be seen that the stack has a maximum temperature at the outlet in the area of the fan’s aerodynamic shadow. The maximum temperature is 66 °C, which corresponds to the optimal conditions for stack operation. The temperature gradient across the longitudinal section is very low (<20 °C), which is a positive factor for chemical reaction. However, there is a large difference in the temperature gradient observed across the cross section of the PEMFC stack. The temperature difference between the inlet and outlet of the stack was 30 °C. The difference is caused by the fan aerodynamic shadow, but this effect can be eliminated by installing larger diameter fans. If the temperature in the cross section changes significantly, then the chemical reactions rate will also change in different parts of the fuel cell, because they are sensitive to temperature changes. Due to the uneven temperature distribution in the PEMFC stack, its output characteristics can be significantly reduced. If the PEMFC stack local temperature reaches the membrane destruction temperature (>110 °C), then the membrane may break through; and in this case, the fuel and the oxidizer may mix and, as a result, the PEMFC stack will ignite. The data also indicate that the temperature fluctuations are always present due to the unsteady nature of the flow and modeling of the air as ideal gas, resulting in convective flow and vortex genesis in the wake region behind the stack. The particle flow trajectories in the stack longitudinal section (Figure 6d) also reflect the absence of turbulence in the BP channels and in the area between the PEMFC stack and the fan.

4. Conclusions

In this paper, we try to create the PEMFC model that allows for predicting the PEMFC operation in various climatic conditions. A combined approach was applied using several simulation programs: COMSOL Multiphysics® to develop the MEA model and SolidWorks Flow Simulation to develop the PEMFC stack model. The developed MEA model allowed to determine the influence of external factors (temperature) on the PEMFC power density. The data obtained using the developed model correlate with experimental data at low ambient temperatures (10–30 °C). However, the accuracy of the model during PEMFC operation at high (>30 °C) and negative ambient temperatures remains in doubt and requires improvement. The obtained data were integrated into the air-cooled PEMFC stack model. The maximum temperature of the PEMFC stack is 66 °C, which corresponds to the optimal conditions for the stack operation. The temperature gradient across the longitudinal section is very low (<20 °C), which is a positive factor for the chemical reaction. However, the temperature gradient observed across the PEMFC stack cross section has a larger difference. The temperature difference between the inlet and outlet of the PEMFC stack was 30 °C. The difference is caused by the fan aerodynamic shadow, but this effect can be eliminated by installing larger diameter fans. Data of the temperature field’s distribution will support the management of the processes in the air-cooled PEMFC stack. The data received will support the optimization of the mass-dimensional parameters of air-cooled PEMFC and increase its specific characteristics. The synergetic effect between the MEA model and the PEMFC stack model can be successfully used in the materials selection and for the development of a thermoregulation system in the PEMFC stack, taking into account the use in various climatic conditions. The data can be used in the design of the energy systems for mobile transport applications, robotics, and unmanned aerial vehicles, etc.

Author Contributions

Methodology, A.K.; formal analysis, M.B.; investigation, E.A.; data curation, N.F.; writing—original draft preparation, N.F.; writing—review and editing, N.F.; visualization, E.A.; supervision, A.K.; project administration, N.S. All authors have read and agreed to the published version of the manuscript.

Funding

The article was prepared based on the results obtained during the implementation of the state assignment to carry out research on the project “Hydrogen fuel cells for small unmanned aerial vehicles: modeling, development, research” through the Ministry of Science and Higher Education of the Russian Federation (scientific code FENN-2020-0020).

Institutional Review Board Statement

Not applicable.

Informed Consent Statement

Not applicable.

Acknowledgments

This work was conducted using equipment at the Center for Shared Scientific Equipment “Nanotechnology” of the Platov South-Russian State Polytechnic University (NPI).

Conflicts of Interest

The authors declare no conflict of interest.

Nomenclature

aActive surface area density [1/m]
aaPrefactor in ka [m/s]
adPrefactor in kd [m/s]
algLiquid-gas interfacial area density prefactor [1/m]
CTotal interstitial gas concentration [mol/m3]
DXFickean diffusion coefficient of gas X [m2/s]
DX,refDiffusivity of X at reference conditions [m2/s]
DλDiffusion coefficient of dissolved water [m2/s]
FFaraday constant (96,485.333 C/mol)
fWater volume fraction in ionomer [–]
GGibbs free energy difference [J/mol]
HEnthalpy of formation of liquid water [J/mol]
HadWater ab-/desorption enthalpy [J/mol]
HecEvaporation/condensation enthalpy [J/mol]
ICell current density [A/m2]
iElectrochemical reaction rate [A/m3]
i0Exchange current density [A/m2]
jeElectronic flux [A/m2]
jpProtonic flux [A/m2]
jTHeat flux [W/m2]
jλFlux of dissolved water [mol/m2s]
jXFlux of gas X [mol/m2s]
jsLiquid water flux [mol/m2s]
kThermal conductivity [W/mK]
kaWater absorption transfer coefficient [m/s]
kcWater condensation transfer coefficient [m/s]
kdWater desorption transfer coefficient [m/s]
keWater evaporation transfer coefficient [m/s]
LLayer thickness [m]
MwMolar mass of water [kg/mol]
nInterfacial unit normal vector [–]
PAbsolute gas pressure [Pa]
PAGas pressure in anode gas channel [Pa]
PCGas pressure in cathode gas channel [Pa]
PrefReference pressure (1 atm, 101,325 Pa)
PsatSaturation water vapor pressure [Pa]
pcCapillary pressure [Pa]
pXPartial pressure of gas X [Pa]
RGas constant (8.31446 J/mol K)
RPEMMembrane resistance [Ωm2]
rEquivalent capillary radius [m]
RHRelative gas humidity [–]
RHARelative humidity in anode gas channel [–]
RHCRelative humidity in cathode gas channel [–]
sLiquid water saturation [–]
sCSaturation at cathode GDL/GC interface [–]
simImmobile liquid water saturation [–]
sredReduced liquid water saturation [–]
SFSubstantial reaction rate [mol/m3s]
SeElectron reaction rate [A/m3]
SpProton reaction rate [A/m3]
STHeat source [W/m3]
ST,eJoule heat source of electrons [W/m3]
ST,pJoule heat source of protons [W/m3]
ST,rReaction heat source [W/m3]
ST,adWater ab-/desorption heat source [W/m3]
ST,ecEvaporation/condensation heat source [W/m3]
SλDissolved water reaction rate [mol/m3s]
SXReaction rate of gas X [mol/m3s]
SsLiquid water reaction rate [mol/m3s]
SadWater ab-/desorption source [mol/m3s]
SecEvaporation/condensation source [mol/m3s]
SReaction entropy [J/mol K]
SHORHydrogen oxidation reaction entropy [J/mol K]
SORROxygen reduction reaction entropy [J/mol K]
TAbsolute temperature [K]
TATemperature of anode plate and GC [K]
TCTemperature of cathode plate and GC [K]
TrefReference temperature (80 °C, 353.15 K)
TMean MEA temperature [K]
UCell voltage [V]
VmAcid equivalent volume of membrane [m3/mol]
VwMolar volume of liquid water [m3/mol]
xThrough-plane coordinate [m]
xXMole fraction of gas X [–]
χ H 2 O A Water vapor mole fraction in anode GC [–]
χ H 2 O C Water vapor mole fraction in cathode GC [–]
χ H 2 A Hydrogen mole fraction in anode GC [–]
χ O 2 C Oxygen mole fraction in cathode GC [–]
χ s a t Saturation water vapor mole fraction [–]
α H 2 Mole fraction of hydrogen in dry fuel gas [–]
α O 2 Mole fraction of oxygen in dry oxidant gas [–]
βHalf-reaction symmetry factor [–]
γSurface tension of water [N/m]
γcWater condensation rate [1/s]
γeWater evaporation rate [1/s]
εiIonomer volume fraction [–]
εpPore space volume fraction (porosity) [–]
ηActivation overpotential [V]
θEffective contact angle [deg]
kHydraulic permeability [m2]
kabsAbsolute (intrinsic) permeability [m2]
λIonomer water content [–]
λeqEquilibrium ionomer water content [–]
λMean ionomer water content [–]
μDynamic viscosity of liquid water [Pa s]
ξElectro-osmotic drag coefficient [–]
𝜎eElectric conductivity [S/m]
𝜎pProtonic conductivity [S/m]
τPore tortuosity [–]
𝜙eElectrode phase potential [V]
𝜙pElectrolyte phase potential [V]
∆𝜙Galvani potential difference [V]
∆𝜙0Reversible potential difference [V]

References

  1. Zhao, C.; Xing, S.; Chen, M.; Liu, W.; Wang, H. Optimal design of cathode flow channel for air-cooled PEMFC with open cathode. Int. J. Hydrogen Energy 2020, 45, 17771–17781. [Google Scholar] [CrossRef]
  2. Barbir, F. PEM Fuel Cells: Theory and Practice; Academic Press: Cambridge, MA, USA, 2012. [Google Scholar]
  3. O’hayre, R.; Cha, S.W.; Colella, W.; Prinz, F.B. Fuel Cell Fundamentals; John Wiley & Sons: Hoboken, NJ, USA, 2016. [Google Scholar]
  4. Jeong, S.U.; Cho, E.A.; Kim, H.-J.; Lim, T.-H.; Oh, I.-H.; Kim, S.H. A study on cathode structure and water transport in air-breathing PEM fuel cells. J. Power Sources 2006, 159, 1089–1094. [Google Scholar] [CrossRef]
  5. Wu, J.; Galli, S.; Lagana, I.; Pozio, A.; Monteleone, G.; Yuan, X.Z.; Martin, J.; Wang, H. An air-cooled proton exchange membrane fuel cell with combined oxidant and coolant flow. J. Power Sources 2009, 188, 199–204. [Google Scholar] [CrossRef]
  6. Sasmito, A.P.; Birgersson, E.; Mujumdar, A.S. A novel flow reversal concept for improved thermal management in polymer electrolyte fuel cell stacks. Int. J. Therm. Sci. 2012, 54, 242–252. [Google Scholar] [CrossRef]
  7. Sasmito, A.; Lum, K.; Birgersson, E.; Mujumdar, A. Computational study of forced air-convection in open-cathode polymer electrolyte fuel cell stacks. J. Power Sources 2010, 195, 5550–5563. [Google Scholar] [CrossRef]
  8. Sasmito, A.P.; Birgersson, E.; Lum, K.; Mujumdar, A. Fan selection and stack design for open-cathode polymer electrolyte fuel cell stacks. Renew. Energy 2012, 37, 325–332. [Google Scholar] [CrossRef]
  9. Akbari, M.; Tamayol, A.; Bahrami, M. Thermal assessment of convective heat transfer in air-cooled PEMFC stacks: An experimental study. Energy Procedia 2012, 29, 1–11. [Google Scholar] [CrossRef] [Green Version]
  10. Shahsavari, S.; Desouza, A.; Bahrami, M.; Kjeang, E. Thermal analysis of air-cooled PEM fuel cells. Int. J. Hydrogen Energy 2012, 37, 18261–18271. [Google Scholar] [CrossRef]
  11. Ko, J.; Ju, H. Comparison of numerical simulation results and experimental data during cold-start of polymer electrolyte fuel cells. Appl. Energy 2012, 94, 364–374. [Google Scholar] [CrossRef]
  12. Chippar, P.; Ju, H. Evaluating cold-start behaviors of end and intermediate cells in a polymer electrolyte fuel cell (PEFC) stack. Solid State Ion. 2012, 225, 85–91. [Google Scholar] [CrossRef]
  13. Tabe, Y.; Saito, M.; Fukui, K.; Chikahisa, T. Cold start characteristics and freezing mechanism dependence on start-up temperature in a polymer electrolyte membrane fuel cell. J. Power Sources 2012, 208, 366–373. [Google Scholar] [CrossRef] [Green Version]
  14. Zhang, J. (Ed.) PEM Fuel Cell Electrocatalysts and Catalyst Layers: Fundamentals and Applications; Springer Science & Business Media: Berlin, Germany, 2008. [Google Scholar]
  15. Chavan, S.L.; Talange, D.B. Modeling and performance evaluation of PEM fuel cell by controlling its input parameters. Energy 2017, 138, 437–445. [Google Scholar] [CrossRef]
  16. Newman, J.; Tiedemann, W. Porous-electrode theory with battery applications. AIChE J. 1975, 21, 25–41. [Google Scholar] [CrossRef] [Green Version]
  17. Springer, T.E.; Zawodzinski, T.A.; Gottesfeld, S. Polymer electrolyte fuel cell model. J. Electrochem. Soc. 1991, 138, 2334. [Google Scholar] [CrossRef]
  18. Bhaiya, M.; Putz, A.; Secanell, M. Analysis of non-isothermal effects on polymer electrolyte fuel cell electrode assemblies. Electrochim. Acta 2014, 147, 294–309. [Google Scholar] [CrossRef]
  19. Natarajan, D.; Van Nguyen, T. A two-dimensional, two-phase, multicomponent, transient model for the cathode of a proton exchange membrane fuel cell using conventional gas distributors. J. Electrochem. Soc. 2001, 148, A1324. [Google Scholar] [CrossRef]
  20. Plawsky, J.L. Transport Phenomena Fundamentals; CRC Press: Boca Raton, FL, USA, 2020. [Google Scholar]
  21. Vetter, R.; Schumacher, J.O. Free open reference implementation of a two-phase PEM fuel cell model. Comput. Phys. Commun. 2019, 234, 223–234. [Google Scholar] [CrossRef]
  22. Burheim, O.S.; Pharoah, J.G.; Lampert, H.; Vie, P.J.S.; Kjelstrup, S. Through-plane thermal conductivity of PEMFC porous transport layers. J. Fuel Cell Sci. Technol. 2011, 8, 2. [Google Scholar] [CrossRef]
  23. Khandelwal, M.; Mench, M.M. Direct measurement of through-plane thermal conductivity and contact resistance in fuel cell materials. J. Power Sources 2006, 161, 1106–1115. [Google Scholar] [CrossRef]
  24. El-Kharouf, A.; Mason, T.J.; Brett, D.; Pollet, B.G. Ex-situ characterisation of gas diffusion layers for proton exchange membrane fuel cells. J. Power Sources 2012, 218, 393–404. [Google Scholar] [CrossRef] [Green Version]
  25. Yi, J.S.; Van Nguyen, T. Multicomponent transport in porous electrodes of proton exchange membrane fuel cells using the interdigitated gas distributors. J. Electrochem. Soc. 1999, 146, 38. [Google Scholar] [CrossRef]
  26. Gode, P.; Jaouen, F.; Lindbergh, G.; Lundblad, A.; Sundholm, G. Influence of the composition on the structure and electrochemical characteristics of the PEFC cathode. Electrochim. Acta 2003, 48, 4175–4187. [Google Scholar] [CrossRef]
  27. Weber, A.Z.; Borup, R.L.; Darling, R.M.; Das, P.K.; Dursch, T.J.; Gu, W.; Harvey, D.; Kusoglu, A.; Litster, S.; Mench, M.M.; et al. A critical review of modeling transport phenomena in polymer-electrolyte fuel cells. J. Electrochem. Soc. 2014, 161, F1254. [Google Scholar] [CrossRef] [Green Version]
  28. Holzer, L.; Pecho, O.; Schumacher, J.; Marmet, P.; Büchi, F.; Lamibrac, A.; Münch, B. Microstructure-property relationships in a gas diffusion layer (GDL) for Polymer Electrolyte Fuel Cells, Part II: Pressure-induced water injection and liquid permeability. Electrochim. Acta 2017, 241, 414–432. [Google Scholar] [CrossRef]
  29. Holzer, L.; Pecho, O.; Schumacher, J.; Marmet, P.; Stenzel, O.; Büchi, F.; Lamibrac, A.; Münch, B. Microstructure-property relationships in a gas diffusion layer (GDL) for Polymer Electrolyte Fuel Cells, Part I: Effect of compression and anisotropy of dry GDL. Electrochim. Acta 2017, 227, 419–434. [Google Scholar] [CrossRef]
  30. Vetter, R.; Schumacher, J.O. Experimental parameter uncertainty in proton exchange membrane fuel cell modeling. Part II: Sensitivity analysis and importance ranking. J. Power Sources 2019, 439, 126529. [Google Scholar] [CrossRef] [Green Version]
  31. Anisimov, E.; Faddeev, N.; Smirnova, N. Data on the thermo-fluid simulation of open-cathode fuel cell stack depending on the location of the oxidizer/cooling supply system. Data Brief 2020, 31, 105771. [Google Scholar] [CrossRef]
  32. Tsilingiris, P.T. Thermophysical and transport properties of humid air at temperature range between 0 and 100 °C. Energy Convers. Manag. 2008, 49, 1098–1110. [Google Scholar] [CrossRef]
Figure 1. Geometry of the five—layer MEA model.
Processes 09 02117 g001
Figure 2. (a) Volt-ampere and power characteristics of MEA at an ambient temperature of 30 °C; (b) Dependence of power characteristics of MEA on ambient temperature.
Processes 09 02117 g002
Figure 3. (a) Bipolar plate model; (b) PEMFC stack model; (c) PEMFC stack model with mesh.
Processes 09 02117 g003
Figure 4. The distribution of temperature fields in PEMCF stack model.
Processes 09 02117 g004
Figure 5. (a) The velocity fields of the cooling and oxidizing agent in the longitudinal section of the PEMFC stack without streamlines and (b) with streamlines.
Processes 09 02117 g005
Figure 6. The temperature fields in the cross section (a) at the entry and (b) at the exit, (c) in the longitudinal section from the PEMFC stack; (d) the particle flow trajectories in the longitudinal section of the PEMFC stack.
Processes 09 02117 g006
Table 1. Governing equations.
NameFluxContinuity Equation
Ohm’s law for electrons (𝜙e) j e = σ e ϕ e   j e = S e
Ohm’s law for protons (𝜙p) j p = σ p ϕ p   j p = S p
Water transport in ionomer (λ) j λ = ( D λ / V m ) λ + ( ξ / F ) j p   j λ = S λ
Fourier heat conduction (T) j T = kT   j T = S T
Darcy’s law (liquid water transport) (s) j s = ( κ / μ V w ) ( p s / s ) s   j s = S s
Fickean water vapor diffusion ( χ H 2 O ) j H 2 O = C D H 2 O χ H 2 O   j H 2 O = S H 2 O
Fickean hydrogen diffusion ( χ H 2 ) j H 2 = C D H 2 χ H 2   j H 2 = S H 2
Fickean oxygen diffusion ( χ O 2 ) j O 2 = C D O 2 χ O 2   j O 2 = S O 2
Table 2. Source terms.
SourceAGDLACLPEMCCLCGDL
S e 0-i i0
S p i0-i
S λ S a d 0 S F + S a d
S T S T , e S T , e + S T , p + S T , r + S T , a d S T , p S T , e + S T , p + S T , r + S T , a d + S T , e c S T , e + S T , e c
S s S e c S e c
S H 2 O 0 S a d S a d S e c S e c
S H 2 0 S F
S O 2 S F / 2 0
Table 3. Boundary conditions.
VariableAGDL/AGCACL/AGDLPEM/ACLCCL/PEMCGDL/CCLCGC/CGDL
ϕ e ϕ e = 0 incessancy n   j e = 0 n   j e = 0 incessancy ϕ e = U
ϕ p n   j p = 0 incessancyincessancy n   j p = 0
λ n   j λ = 0 incessancyincessancy n   j λ = 0
T T = T A incessancyincessancyincessancyincessancy T = T C
s n   j s = 0 incessancy s = s C
χ H 2 O χ H 2 O = χ H 2 O A incessancy n   j H 2 O = 0 n   j H 2 O = 0 incessancy χ H 2 O = χ H 2 O C
χ H 2 χ H 2 = χ H 2 A incessancy n   j H 2 = 0
χ O 2 n   j O 2 = 0 incessancy χ O 2 = χ O 2 C
Table 4. Cell dimensions and operating conditions.
DescriptionValue
CL thickness 10 μm
GDL thickness160 μm
PEM thickness25 μm
Ionomer volume fraction in CL0.3
Ionomer volume fraction in PEM1
Pore volume fraction GDL0.76
Pore volume fraction CL0.4
Thermal conductivity GDL1.6 W/m∙K [22]
Thermal conductivity CL0.27 W/m∙K [23]
Thermal conductivity PEM0.3 W/m∙K [23]
Pore tortuosity GDL1.6
Pore tortuosity CL1.6
Absolute permeability GDL6.15 × 10−12 m2 [24]
Absolute permeability CL10−13 m2 [25]
Electrical conductivity GDL1250 S/m [26]
Electrical conductivity CL350 S/m [26]
Table 5. Operating conditions of the base case.
Gas Pressure in Cathode and Anode1.5 atm.
Relative Humidity in Cathode and Anode GC100%
Liquid Saturation at GC/CGDL Interface0.12
Ambient Temperature−50–+50 °C
H2 Mole Fraction in Fuel1.00
O2 Mole Fraction in Oxidant0.21
Publisher’s Note: MDPI stays neutral with regard to jurisdictional claims in published maps and institutional affiliations.

