Article

Fumaric Acid Production by R. arrhizus NRRL 1526 Using Apple Pomace Enzymatic Hydrolysates: Kinetic Modelling

by
Victor Martin-Dominguez
,
Jorge Garcia-Montalvo
,
Alberto Garcia-Martin
,
Miguel Ladero
* and
Victoria E. Santos
FQPIMA Group, Materials and Chemical Engineering Department, Chemical Sciences School, Complutense University of Madrid, 28040 Madrid, Spain
*
Author to whom correspondence should be addressed.
Processes 2022, 10(12), 2624; https://doi.org/10.3390/pr10122624
Submission received: 15 October 2022 / Revised: 24 November 2022 / Accepted: 2 December 2022 / Published: 7 December 2022
(This article belongs to the Special Issue Advanced Technologies in Biohydrogen and Bioprocesses)

Abstract

:
Fumaric acid is one of the most promising biorefinery platform chemicals, fruit residues being a very suitable raw material for its production in second generation biorefineries. In particular, apple pomace is a plentiful residue from the apple juice industry, with apple being the second largest fruit crop in the world, with a production that increased from 46 to 86 Mtons in the 1994–2021 period. With a global apple juice production of more than 4.5 Mtons, a similar amount of apple pomace is produced yearly. In this work, apple pomace hydrolysate has been obtained by enzymatic hydrolysis and further characterized for its content in sugars, phenolics and nitrogen using different analytic methods, based on HPLC and colorimetric techniques. Previous to the use of this hydrolysate (APH), we studied if the addition of fructose to the usual glucose-rich broth could lead to high fumaric acid yields, titers and productivities. Afterwards, APH fermentation was performed and improved using different nitrogen initial amounts, obtaining production yields (0.32 gFumaric acid/gconsumed sugar) similar to those obtained with synthetic media (0.38 gFumaric acid/gconsumed sugar). Kinetic modelling was employed to evaluate, explain, and understand the experimental values and trends of relevant components in the fermentation broth as functions of the bioprocess time, proposing a suitable reaction scheme and a non-structured, non-segregated kinetic model based on it.

1. Introduction

Sustainable development is a geopolitical target in most countries throughout the world. It addresses key social, economic, and environmental indicators, with the aim to create a lasting equilibrium between human needs and desires and the ultimate source of most resources, both energetic and material, our Earth. Petroleum and, in general, fossil resources depletion starts to be a reality, pushing the search and discovery of new materials and energy sources [1,2,3].
Green chemistry and engineering are sustainability tools that have experienced a great growth in recent years for the aforementioned reasons [4]. Additionally, biorefineries appear as an integrated and integral process strategy based on the petrochemical industry but focusing on the modification of biomass as the source for an almost unlimited array of products, biomass being a global term encompassing all renewable and sustainable raw materials created in the biosphere, that is, by living beings [5].
During the last decades, biorefineries have evolved and they can be classified in several generations. First generation biorefineries are based on starch- and sucrose-rich crops, also used in feeding. However, this involved an ethical dilemma, due to the competition they create between the energy and food sectors [2,6]. Thus, and due also to the relative scarceness of these raw materials, second generation biorefineries are based on lignocellulosic materials: energy crops and residues, which have little or no value as food or feed. These biorefineries can use also sugar rich wastes, provided by agro-food industries, with no value as food ingredients. In this way, the raw material is plentiful and cost-efficient and several problems due to waste management are solved [6]. This generation is widely investigated by creating alternative industrial processes, with a focus on the increase of the raw material reactivity, as it is usually recalcitrant to chemical or biochemical transformation [7]. In this context, a third generation of biorefineries is coming, developed to transform sea resources, and mainly focused on algae technology [2,8].
To increase yields and productivities of the biotechnological processes in biorefineries, genetic edition has been introduced. For example, using genetically modified organisms (GMOs), a wide variety of products can be obtained from very different raw materials, this fact gives rise to the fourth generation of biorefineries, focused overall as a continuation of previous generation, modifying algae and cyanobacteria [7].
The food industry is a very suitable source of raw materials for second generation biorefineries, as food waste and loss need to be valorised instead of being disposed of. In this context, fruit wastes from the beverage industry, which are rich in free sugars and structural polysaccharides, are composed by cellulose, hemicellulose and pectin, which can be hydrolysed to fermentable sugars [9]. Moreover, fruit wastes are a rich source of high value substances such as essential oils (mostly terpenes), flavonoids, carotenoids, and pectin, to name a few. These substances add value to overall process, rendering it more efficient and cost-effective and also avoiding deleterious effect on upstream operations due to catalysts and/or biocatalysts deactivation or inhibitions [10].
Apple manufacturing wastes, also known as apple pomace (AP), are mainly composed by apple peel, flesh, and seeds, and even precipitated solids from juice clarification. In countries such as Germany, apple is the fruit with the highest production. A huge amount of AP (200–250 kt/year) is generated, making necessary its management, as wastes or as a by-product. The main AP applications are focussed on composting or on animal feeding, remarking its use as horse feed [11].
Fumaric acid was designated as one of the top 12 building blocks to be produced in biorefineries, by the U.S. Department of Energy [12]. It is a dicarboxylic acid with a double bond, which confers very interesting properties as monomer and as rising crosslinker in material industry. As a chemical building block, it is co-polymerized to several polyamides or resins. Its main use lies, however, in the food industry, where it is used as a non-flavouring acidulant. This compound has also several applications in the health and pharma industries. As an ingredient of cattle feed, it reduces 70% of methane emissions, a greenhouse gas with a heating potential 21 times higher than CO2 [13,14].
The acid is produced nowadays by catalytic isomerization from maleic anhydride, a process that involves very intensive pressure and temperature, being energy-intensive. In addition, the use of maleic anhydride is dangerous for the environment, as this compound is petroleum-based [13,15].
Rhizopus spp. is a genus of filamentous fungi, known to be the best natural producers of fumaric acid. However, these microorganisms present some disadvantages due to low productivity and lack of process reliability. This last feature is due to their growth as hyphae, having different morphologies with diverse productivities [16]. Fungal morphology and its control have been widely discussed [17,18]. Pellet morphology is generally recognised as the most suitable morphology due to its high productivity and low effect on medium rheology. The control of the size and the development of pellets on inoculum stages optimizes the fungal metabolism for fumaric acid production [19].
Fumaric acid is present in the metabolism of Rhizopus in two different pathways: the tricarboxylic acid (TCA) cycle and the TCA reductive pathway. The first route is only present inside the mitochondria and fumaric acid is within a metabolic cycle, not being a product of the route [13,20]. This is, however, the situation in the TCA reductive pathway: the acid is the final product. This metabolic route starts from pyruvate which, through CO2 fixation, ends in fumarate. Enzyme fumarase is responsible from the last step of the route; its activity is known to increase nitrogen limiting conditions [21,22].
With the objective of implementing this fermentative process on a biorefinery model, this work is focused on the obtention of fumaric acid from an enzymatic hydrolysate of AP (APH), as carbon source on fermentation medium. This hydrolysate was characterized to know its composition. As a comparative counterpart, the fungal fermentation with synthetic media with identical composition to APH and also with glucose as only carbon source has been studied. The kinetic modelling was employed as a tool for a further comparison and to simulate the bioprocess based on APH, looking for a future scale up.

2. Materials and Methods

2.1. Wastes

AP employed on the present work have been kindly supplied by a beverage factory, having real industrial wastes for an accurate implementation. It was supplied by Concentrados Villaviciosa S.A. (La Almunia de Doña Godina, Aragon, Spain), an apple juice factory for cider elaboration. The waste is produced in the first part of the process, when apples are washed and peeled and after shredding and pressing [23,24].

2.2. Enzymes and Reagents

The enzymes employed on the present study were supplied by ASA Spezialenzyme GmbH (Wolfenbüttel, Germany). These enzymes are: Biogazyme 2x, Xylanase 2x, β-glucosidase 1000 and Pektinase L40.
Several chemical reagents were employed for media elaboration and analysis protocols. Glucose and fructose EPR (Labchem. Premia de Dalt, Spain) were employed as a carbon source on synthetic media; at the same time, fermentation media are composed by any other salts such as ammonium sulphate or magnesium sulphate. All these salts and inorganic compounds, as well as DPPH for antioxidant activity determination, were supplied by Panreac (Castellar del Vallés, Spain). On the other hand, certain specific reagents were supplied by Sigma-Aldrich (Saint Louise, MO, USA.), such as Corn Step Liquor (CSL) and the ion exchange resin Dowex® 50WX8. Other reagent employed was Folin–Ciocalteu’s phenol reagent in analytical grade (Chemical Lab, Zedelgem, Belgium). Active carbon for detoxification process was supplied by ACROS Organics (Waltman, MA, USA.) with 4–12 mesh.
Finally, different kinds of CaCO3 tested, with diverse specifications, were provided by Alfa-Aesar (Averhill, MA, USA) and VWR chemicals (Radnor, PA, USA), both with ≥99% purity.

2.3. Enzymatic Hydrolysis

Enzymatic hydrolysis was carried out using fresh apple pomace, with no further pre-treatment. The process regime selected was fed-batch. Final total solid load was 15% (w/v), distributed on 5 different loads of 3% (w/v) of dry solid at 0, 3.5, 24, 48 and 60 h, with a total time of 72 h. This hydrolysis was performed in a 2 L bioreactor, with mechanical stirring at 350 rpm and 50 °C, pH was maintained at 5.0 using NaOH.
An enzymatic cocktail was developed based on previous studies [25,26]. Its composition was: Biogazyme 2x: 18 mg/gdry solid, Xylanase 2x: 12 mg/gdry solid, β-glucosidase 1000: 9 μL/gdry solid and Pektinase L40: 9 μL/gdry solid. Due to the high solid load over time, there were two different enzymatic cocktail loads during the waste processing: One at the beginning of the operation (0 h) and another load at 48 h.

2.4. Detoxification

Because of the nature and composition of APH, a decontamination process was needed to remove antimicrobial compounds [27,28]. Firstly, a precipitation of solids, assisted by CaCO3 (1 g/L), was performed during 5 min at 80 rpm and at room temperature. Afterwards, the solids were removed by centrifugation using three cycles of 10 min at 11,733× g (8500 rpm) to ensure a complete clarification of the liquid phase.
Once all solids were removed, two detoxification stages were performed in series. The first one was an adsorption operation using 10% (w/v) active carbon in a contact stage of 30 min. This stage sought to eliminate phenolic compounds and essential oils [29]. A second detoxification stage was performed using an ion exchange resin Dowex® 50WX8, using 10% (w/v) of resin for 30 min. This resin is employed to reduce the cation concentration, such as metals or ammonium [27].
After the use of the resin, it must be washed with water (500 mLwater/100 gresin), later regenerated with H2SO4 0.125 M (100 mLacid/100 gresin) and, finally, washed with water again.
At last, two filtrations were performed: An initial filtration with a glass fibre filter, for removing remaining solids. Finally, a sterilizing filtration (0.22 μm) was applied to have a stable medium.

2.5. Microorganism and Stock Elaboration

As in previous studies [19,30], Rhizopus arrhizus NRRL 1526 was used for fumaric acid production. It was cultivated on agar plates with PDA (potato dextrose agar) medium. The spore stock (2·107 spores/tube) was elaborated after sporulation (5 days). Stock was stored at −80 °C in a saline–glycerol 20% (v/v) solution.

2.6. Media and Culture Conditions

All experiments carried out on this study were performed following one flask–one sample working protocol, in such a way as to assure reproducibility and traceability [19]. Fermentations were carried out in 100 mL shake flasks, using 20 mL of culture medium at 34 °C and 400 rpm.
The process was divided into two different stages: the inoculum stage was firstly performed, with the purpose of developing correct pellet morphology, with a proper size, and a metabolic state suitable for an enhanced fumaric acid production.
Inoculum medium was defined by Rhodes in 1959 [31], with some later modifications [19]. It is composed by: Glucose (40 g/L), ammonium sulphate (4 g/L), MgSO4 × 7 H2O (0.4 g/L), ZnSO4 × 7 H2O (0.044 g/L), KH2PO4 (1.6 g/L), FeCl3 × 6 H2O (0.0075 g/L) and CSL (0.5 mL/L). This medium is widely employed in the bibliography as it has a proper composition to obtain an appropriate growth and development of fungal biomass.
The production stage employed a common composition of micronutrients, optimised for production by Ling and Ng [32]: MgSO4 × 7 H2O (0.4 g/L), ZnSO4 × 7 H2O (0.044 g/L), KH2PO4 (0.3 g/L), FeCl3 × 6 H2O (0.0075 g/L) and finally CaCO3 (35 g/L), used as pH controller and CO2 supplier [30]. Sugars concentration has been set to resemble culture media to APH, after its analysis. There were two synthetic media used: A first medium only composed by glucose as carbon source with a concentration of 60 g/L. The other synthetic medium consisted in an analogous of the APH, being composed of glucose and fructose in the same concentration of 30 g/L.
The nitrogen content, on different production media, was adapted from literature [30,32] to obtain nitrogen limiting conditions. Ammonium sulphate concentration was adjusted to have the same C:N ratio on the different experiments, having an ammonium sulphate concentration of 0.54 g/L for these media, which means 0.07 g/L of ammonia.
The final AP fermentation medium would be composed mainly of APH, but it was complemented to ensure the same composition of micronutrients defined before, and (NH4)2SO4 as nitrogen source added, at a concentration to be determined.

2.7. Biomass and Ammonium Tracing

Ammonium concentration was measured using an ammonia ion selective electrode Hanna Instruments HI-4101, in an ISE (Ion Selective Electrode) measurer Hanna Instruments HI-5522 (Hanna Instruments. Villafranca Padovana, Italy).
Living biomass have been quantified following the methodology defined in a previous study [30]. As indicated in this reference, the biomass concentration was related to nitrogen consumption by stoichiometry once the average molecular formula of the microorganism was established (CH1.80O0.68N0.22).

2.8. Sample Analysis

For tracing the concentration of the different compounds, HPLC techniques have been employed. A modular HPLC device Jasco series 2000 (Jasco. Tokyo, Japan) was used, having a refractive index detector (RID) and a diode array detector (DAD).
Two different HPLC columns have been employed for different purposes: A BP 800-H column (Benson. Reno, NV, USA), with H2SO4 0.005 M as mobile phase, at 0.5 mL/min and 60 °C was employed for all samples, as this HPLC method is suitable for almost all relevant compounds. In this analysis, fumaric acid was measured using the DAD at 250 nm. Other substances (malic acid, ethanol, and glucose) were quantified using the RID. In addition, a BP 800-PB column thermostatized at 80 °C (Benson. Reno, NV, USA), with Milli-Q H2O as mobile phase flowing at 0.5 mL/min, used for analysing in detail several hexoses and pentoses present on the hydrolysates, such as xylose, galactose, saccharose, and fructose.
Folin–Ciocalteu and DPPH assays were performed to determine total phenolic content and antioxidant capacity, respectively, on APH. These characterizations have been applied to study the effectivity of detoxification process [9] by known protocols obtained from the bibliography: the Folin–Ciocalteu working protocol was developed by Ribeiro et al., from Universidade Federal do Paraná, Brazil [33], while the DPPH protocol was established by Ozturk et al., from the University of Manchester, UK [34].
Finally, a classic Bradford method for soluble protein quantification was employed, used for characterizing APH. The employed protocol is the same as in previous studies [30].

2.9. Mathematical Methods

Once the different kinetic models on the present study were proposed, they were fit to all relevant experimental data using the software Aspen Custom Modeller V11® (ACM). This program applies nonlinear fitting mathematic methods, based on NL2SOL algorithm coupled to a variable interval Euler method for the numerical integration of the ordinary differential equations (ODEs) that constitutes each kinetic model. The NL2SOL algorithm is an algorithm very adequate to solve ODEs systems based on gradient method; it was developed from the Marquardt–Levenberg algorithm. It ensures a fast and reliable calculation of the kinetic parameters or constants of the models [35].
The model must be introduced using programming language very similar to Matlab. Afterwards, experimental data are introduced. Finally, initial iteration values for model parameters are required to reach an appropriate convergence of the system. For the iteration, some physical criteria must be applied such as the need for the kinetic parameters to be positive.
Kinetic parameters are obtained together their standard errors with a 95% confidence (by Student’s t analysis) which must be as low as possible. To test the goodness of the proposed kinetic model, some statistical parameters were provided by the software: root main squared error (RMSE) (Equation (1)) measures the cumulative error between the experimental data and the fitted model, so it should tend to zero. This parameter is based on the sum of squared residuals (SSR), represented in Equation (2), that indicates the overall error present in the model, in respect of experimental data [19,36].
RMSE = SSR ( N K )
SSR = j = 1 j = K i = 1 i = N ( C ij   exp C ij   calc ) 2
The calculation of RMSE, requires the freedom degrees in the model (N-K). Representing N, the number of experimental data and K, the number of parameters in the proposed model.
The F test is based on SSR calculation as well; it points out how good the fitting is. This test indicates the probability that the model would be represented by a Fisher–Snedecor distribution with 95% confidence. The parameter F95 (Equation (3)) must be always over a critical value (tabulated) for the number of data and kinetic parameters used, thus ruling out the null hypothesis. In any case, it should be as large a value as possible [19,36].
F 95 = j = 1 j = K n = 1 n = N ( C jn   calc K ) 2 j = 1 j = K n = 1 n = N ( SSR N K )
Finally, the percentage of variation explained (%VE) (Equation (4)) is a differential goodness-of-fit parameter: It gives information about how well the model explains the changes of the measured variables (concentrations) with the independent variable (time, in this case). A 100% implies a perfect explanation by the model of the experimental change of the dependent variable(s) contained in the model [19,37].
% VE = 100 ( 1 l = 1 l = L SSR l l = 1 l = L SSR mean   l )

2.10. Kinetic Model

To model the time course of the different compounds in the experiments carried out in the present study, a non-structured, non-segregated simple kinetic model has been proposed and applied to these four experiments. The model (Equations (5)–(16)) is based on another model successfully employed in a previous study [30], but it has been modified according to the trends appreciated in these experiments. The reaction scheme developed for this model is:
y GX   G + y FrX   Fr +   y NX   N [ X ] X + y EX   Et + y IX I   r 1 = μ m [ X ] [ N ]
G + y FrEn   Fr [ X ] Energy r 2 = m S [ X ]   ( Only   if   [ G ] > 0 )
y IF   I [ X ] F + y MF   M r 3 = k F [ X ] · [ I ]
Et [ X ] Energy r 4 = k E [ X ]   ( Only   if   [ G ] = 0 )
From this reaction scheme, model equations are the following:
Biomass:
R X = d [ X ] dt = r 1
Fumaric acid:
R F = d [ F ] dt = r 3
Malic acid:
R M = d [ M ] dt = Y MF r 3
Ethanol:
R E = d [ Et ] dt = Y EX r 1 r 4
Ammonia:
R N = d [ N ] dt = Y NX r 1
Glucose:
R G = d [ G ] dt = Y GX r 1 r 2
Fructose:
R Fr = d [ Fr ] dt = Y FrX r 1 Y FrEn · r 2
Intermediate:
R I = d [ I ] dt = Y IX r 1 Y IF · r 3
The proposed kinetic model is based on fungal growth described by the M’Kendrick and Pai model, considering ammonia as a limiting substrate (Equations (5) and (9)). From this growth model, associations to growth substances production are described through yields: ethanol and the intermediate metabolite (Equations (5), (12) and (16)).
A cellular maintenance reaction was introduced too; for this reaction we considered the consumption of glucose and fructose for respiration to obtain energy (Equations (6), (14) and (15)).
Additionally, there is a specific reaction to describe the TCA reductive pathway, where fumaric and malic acids are clearly not associated to growth (Equation (7)). As previously mentioned, when using APH as substrate, the production of fumaric and malic acids do not deter even when sugars are totally consumed, suggesting the accumulation of an intermediate inside the fungal cells (growth associated, as reflected in Equation (5)). Probably, malate concentration grows inside the cells due to the great sensitivity of the fumarase to inhibitors [28,38].
Concerning ethanol disappearance (Equation (8)), this is a phenomenon that is not present in all experiments probably because only when APH is used, glucose and fructose disappear completely. Ethanol has been proved to be produced in aerobic conditions by the Crabtree effect [30], shifting the excess of carbohydrate to the production of ethanol to increase NADH levels in the cells. Afterward, when the microorganism need for energy increases, ethanol is transported inside the microorganism to face such needs in the absence of other carbon sources. For this reason, the reaction represented in Equation 8 is only present with the condition that glucose and fructose concentrations are 0, a fact that happens at the same time (40 h).

3. Results and Discussion

3.1. Enzymatic Hydrolysis

Enzymatic hydrolysis was performed as commented in the Materials and Methods section (Section 2.6). APH was characterized after and before detoxification process, obtaining the results shown in Table 1. HPLC sugar analysis was carried out using different columns described on Section 2.8. It is appreciated that the detoxification treatment only slightly affects the final monosaccharide content, conserving more than 95% original sugar content. Phenolic and antioxidant activity quantifications were also performed, these substances are reported to have antifungal effect [28]. As it is shown in Table 1, the detoxification process reduced the content in phenolics and antioxidants. Near 43% phenolics are removed, according to the Folin–Ciocalteu method, but only 20% antioxidant activity disappears. Therefore, enzyme inhibition due to this type of compound can still be expected. In addition, a nitrogen quantification has been carried out, and in Table 1 it can be observed that ammonium content on the detoxified APH is below the quantification limit, so its value could be considered null. Therefore, the treatment with ionic resins is successful to remove ammonia. Moreover, protein content, as measured by the Bradford method, is not significant (0.42 g/L), as this value is below the initial protein concentration added for hydrolysis (2.87 g/L). This detoxified APH constitutes the carbon source for some experiments reported in this work.

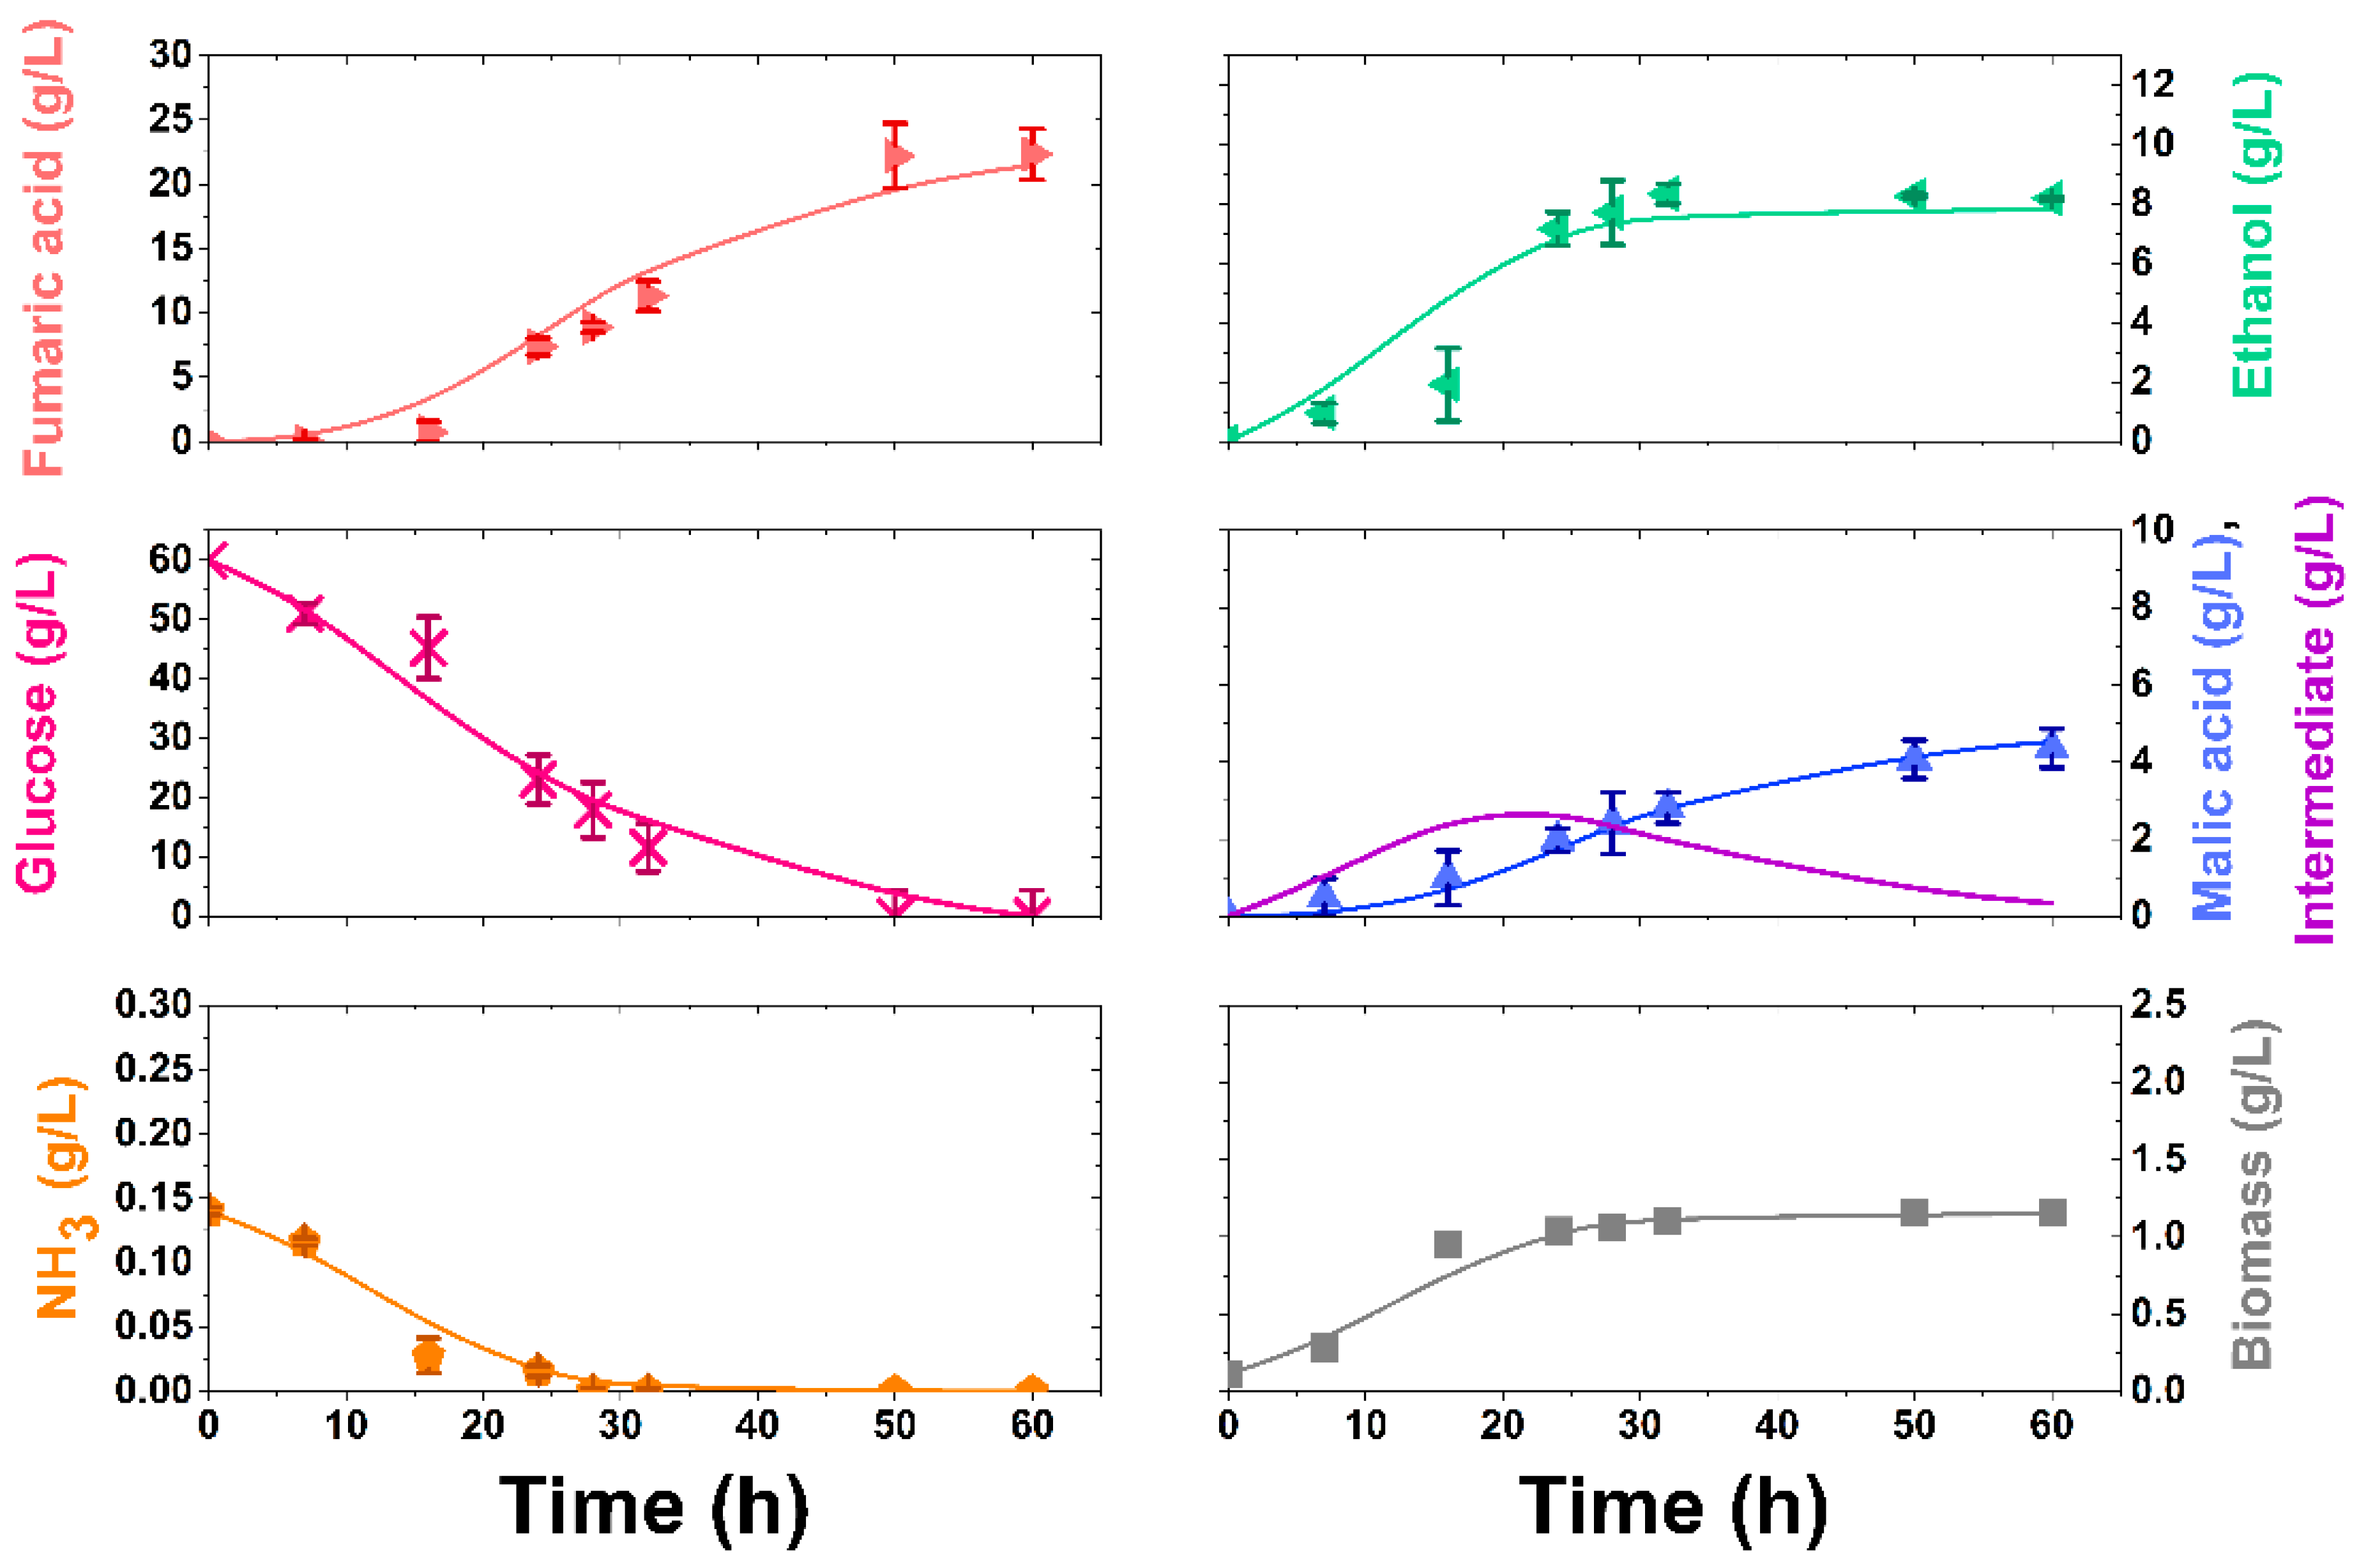
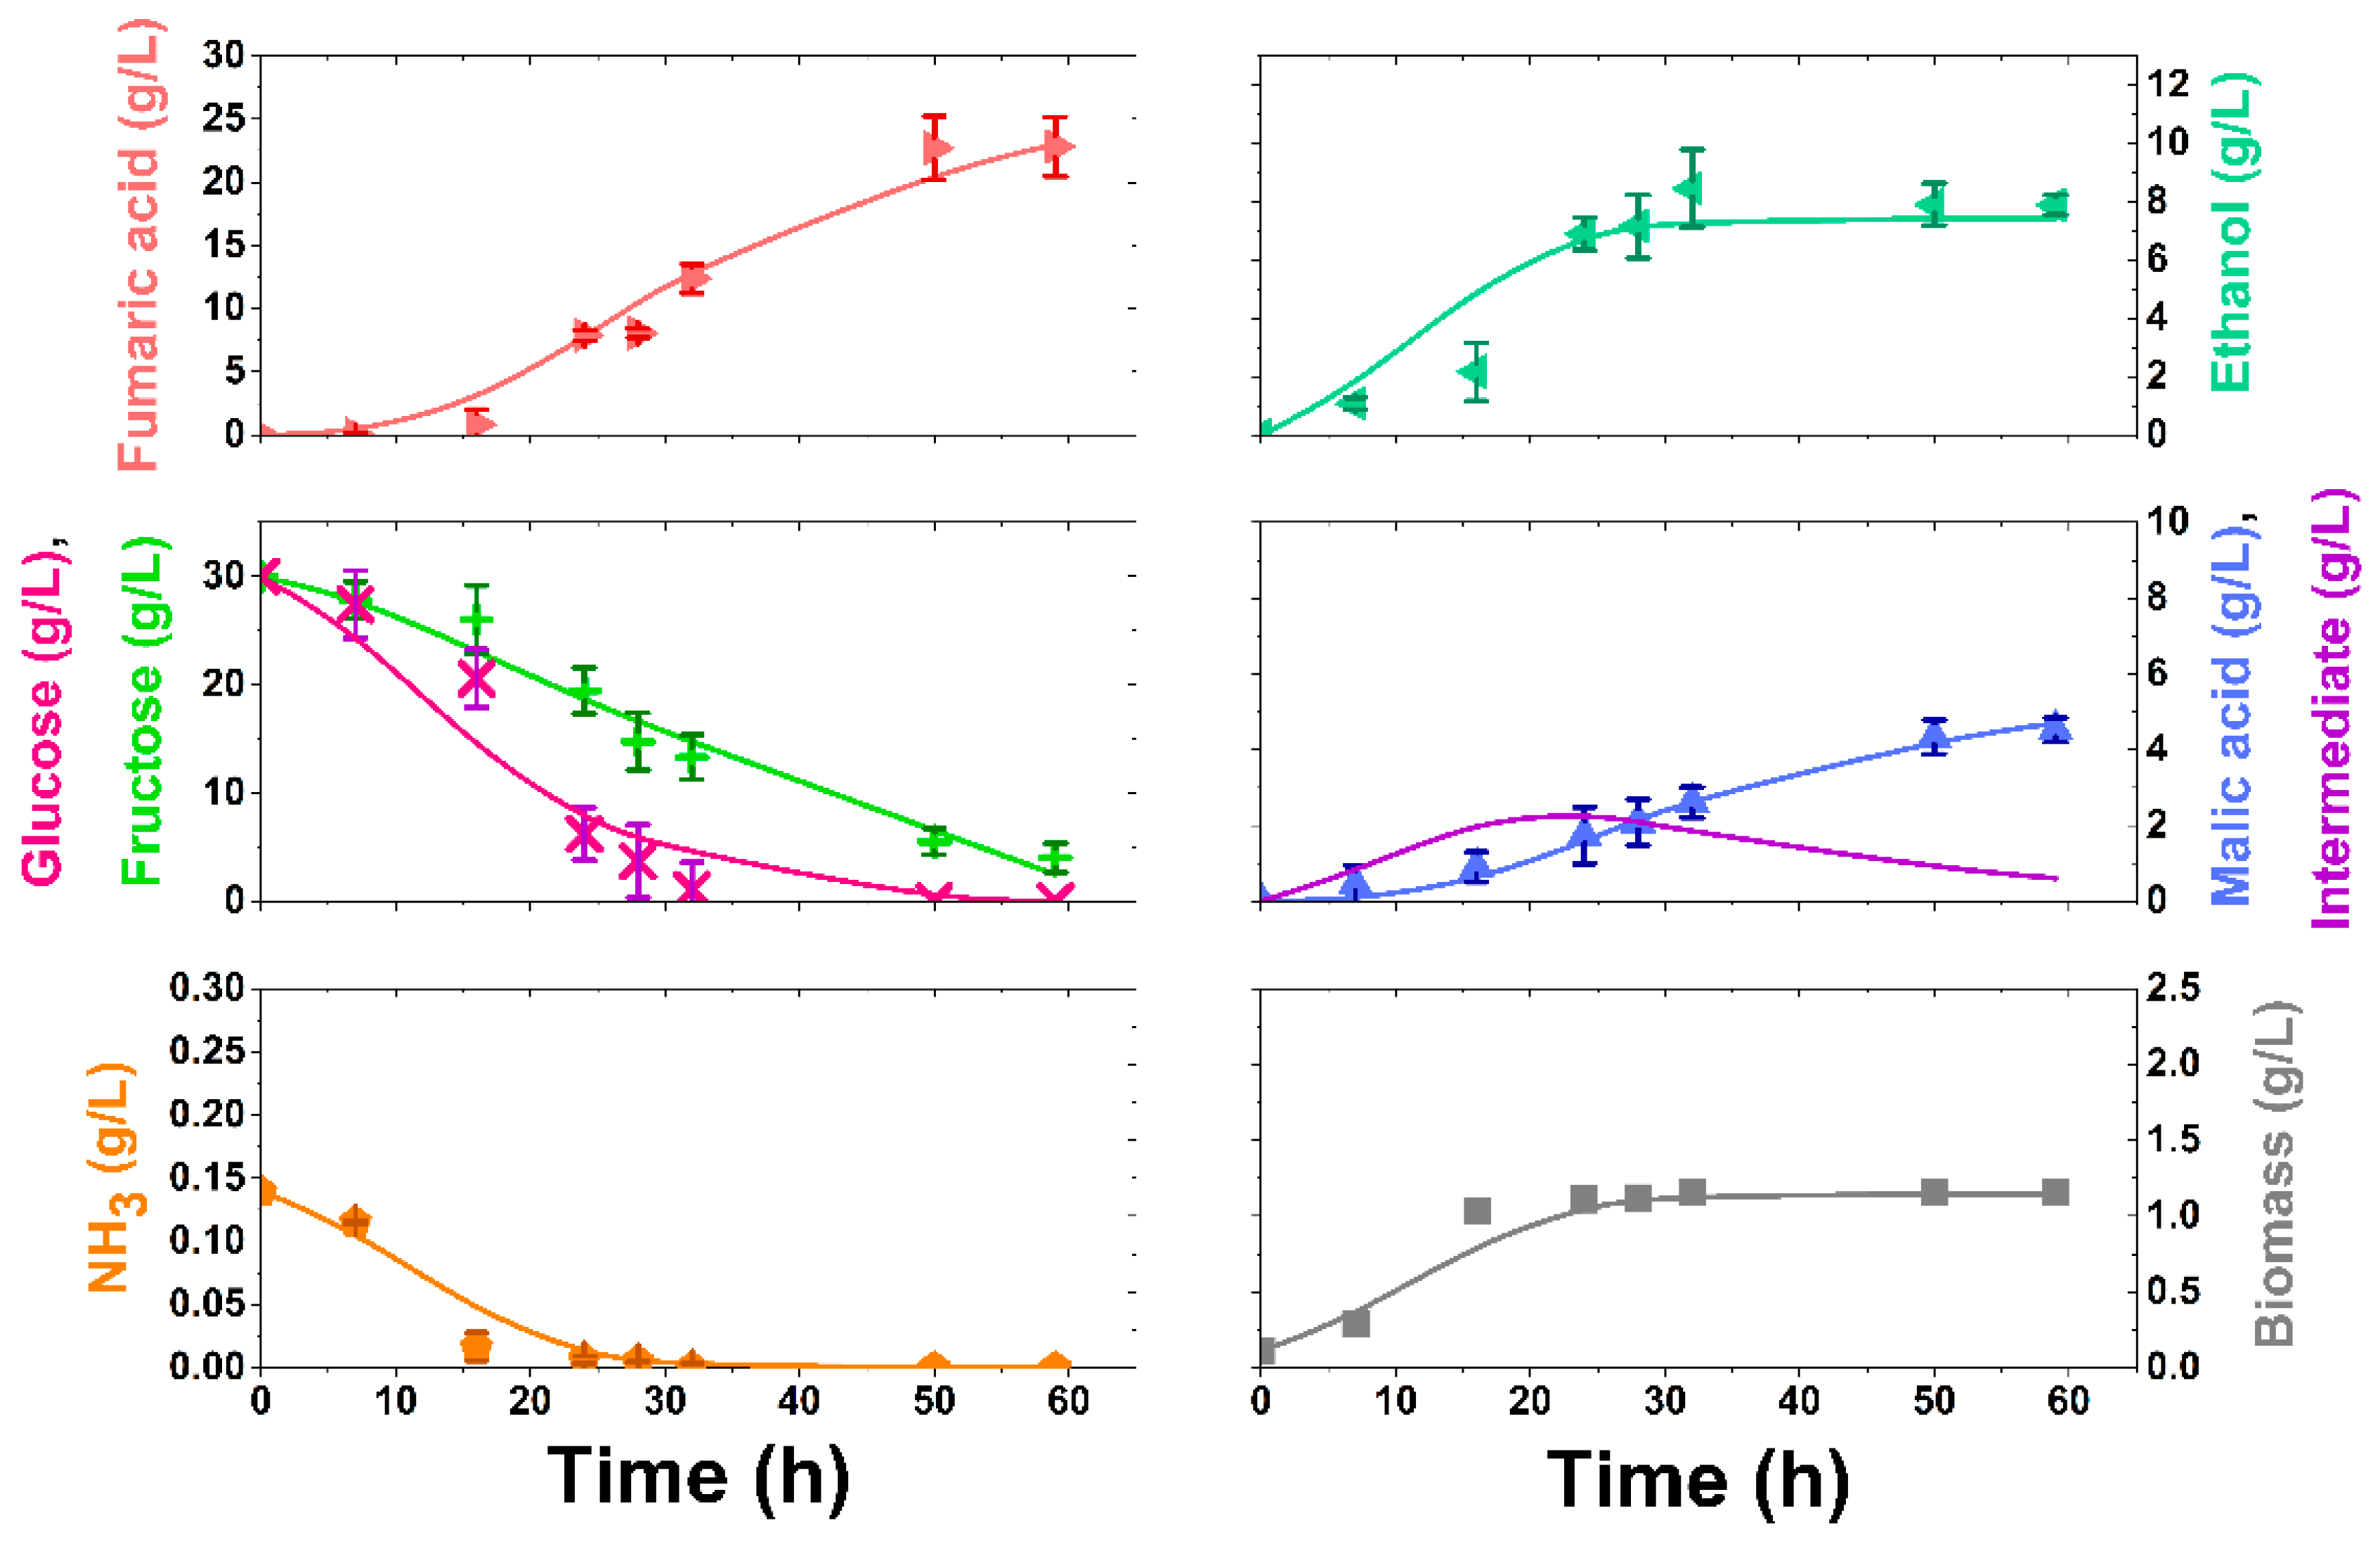
3.2. Synthetic Media Experiments

To study the effect of glucose and glucose/fructose mixtures in this bioprocess, two experiments are carried out using a medium with only glucose at a concentration identical to that of total sugars in detoxified APH (experiment 1) and another run using a mixture glucose/fructose 1:1 w/w with the same mass concentration found in detoxified APH (experiment 2). In Table 2, we have collected diverse key fermentation parameters of these experiments. It can be noticed that they are very similar for both runs. Figure 1 and Figure 2 show the experimental data (as points) obtained for these experiments. The results for Experiment 1 (Figure 1) show the same trends reported elsewhere [30]: Fumaric and malic acids accumulate in parallel in the fermentation broth, having a non-associated increase relative to biomass production. Glucose and ammonia are totally consumed.
Ethanol evolution is of notable interest. In the bibliography it is widely reported how its production is linked to fungal growth, and when it stops, ethanol concentration starts decreasing, as a consequence of evaporation [30,39] and/or due to its consumption by the fungus after having produced it via the Crabtree effect [40]. This effect is reported to take place in different processes performed by certain species of fungi and yeasts. It consists of ethanol generation with a double purpose. Firstly, it generates an energy reserve that they can consume when required (in particular, fumaric acid transport through the membrane needs a notable amount of ATP). At the same time, its presence prevents or hinders the growth of other microorganism, reducing the competence for resources. Ethanol production takes place over a threshold concentration of glucose and in an excess of oxygen [41,42]. Despite of this, in both experiments with pure sugars (Figure 1 and Figure 2), it can be observed that ethanol concentration remains constant after being produced, suggesting that the microorganism has no need of it as an energy source in these cases, while evaporation is not taking place at an appreciable rate.
Regarding the experiment 2 (Figure 2), the use of both sugars combined in identical concentrations at zero time provides very close results to those obtained when we use only glucose. However, fructose is not totally consumed. In fact, the microorganism consumes glucose at a much higher rate (glucose is totally consumed at a bioprocess time between 30 and 50 h). This effect is not due to carbon catabolite repression, as fructose is consumed in parallel to glucose, though at a lower rate. However, fructose transport through the membrane needs a higher amount of energy and the fungus need to use a different phosphorylation route (and enzymes) to obtain pyruvate out of fructose [25]. Even in these conditions, fumaric production is very similar to that in Experiment 1, not only in terms of final yield but also considering its concentration evolution with time. Likewise, the evolution of the rest of compounds in the fermentation broth is very close to those shown in Figure 1. Thus, there is an evident possibility of using glucose–fructose mixtures as substrate, the composition of the detoxified APH.

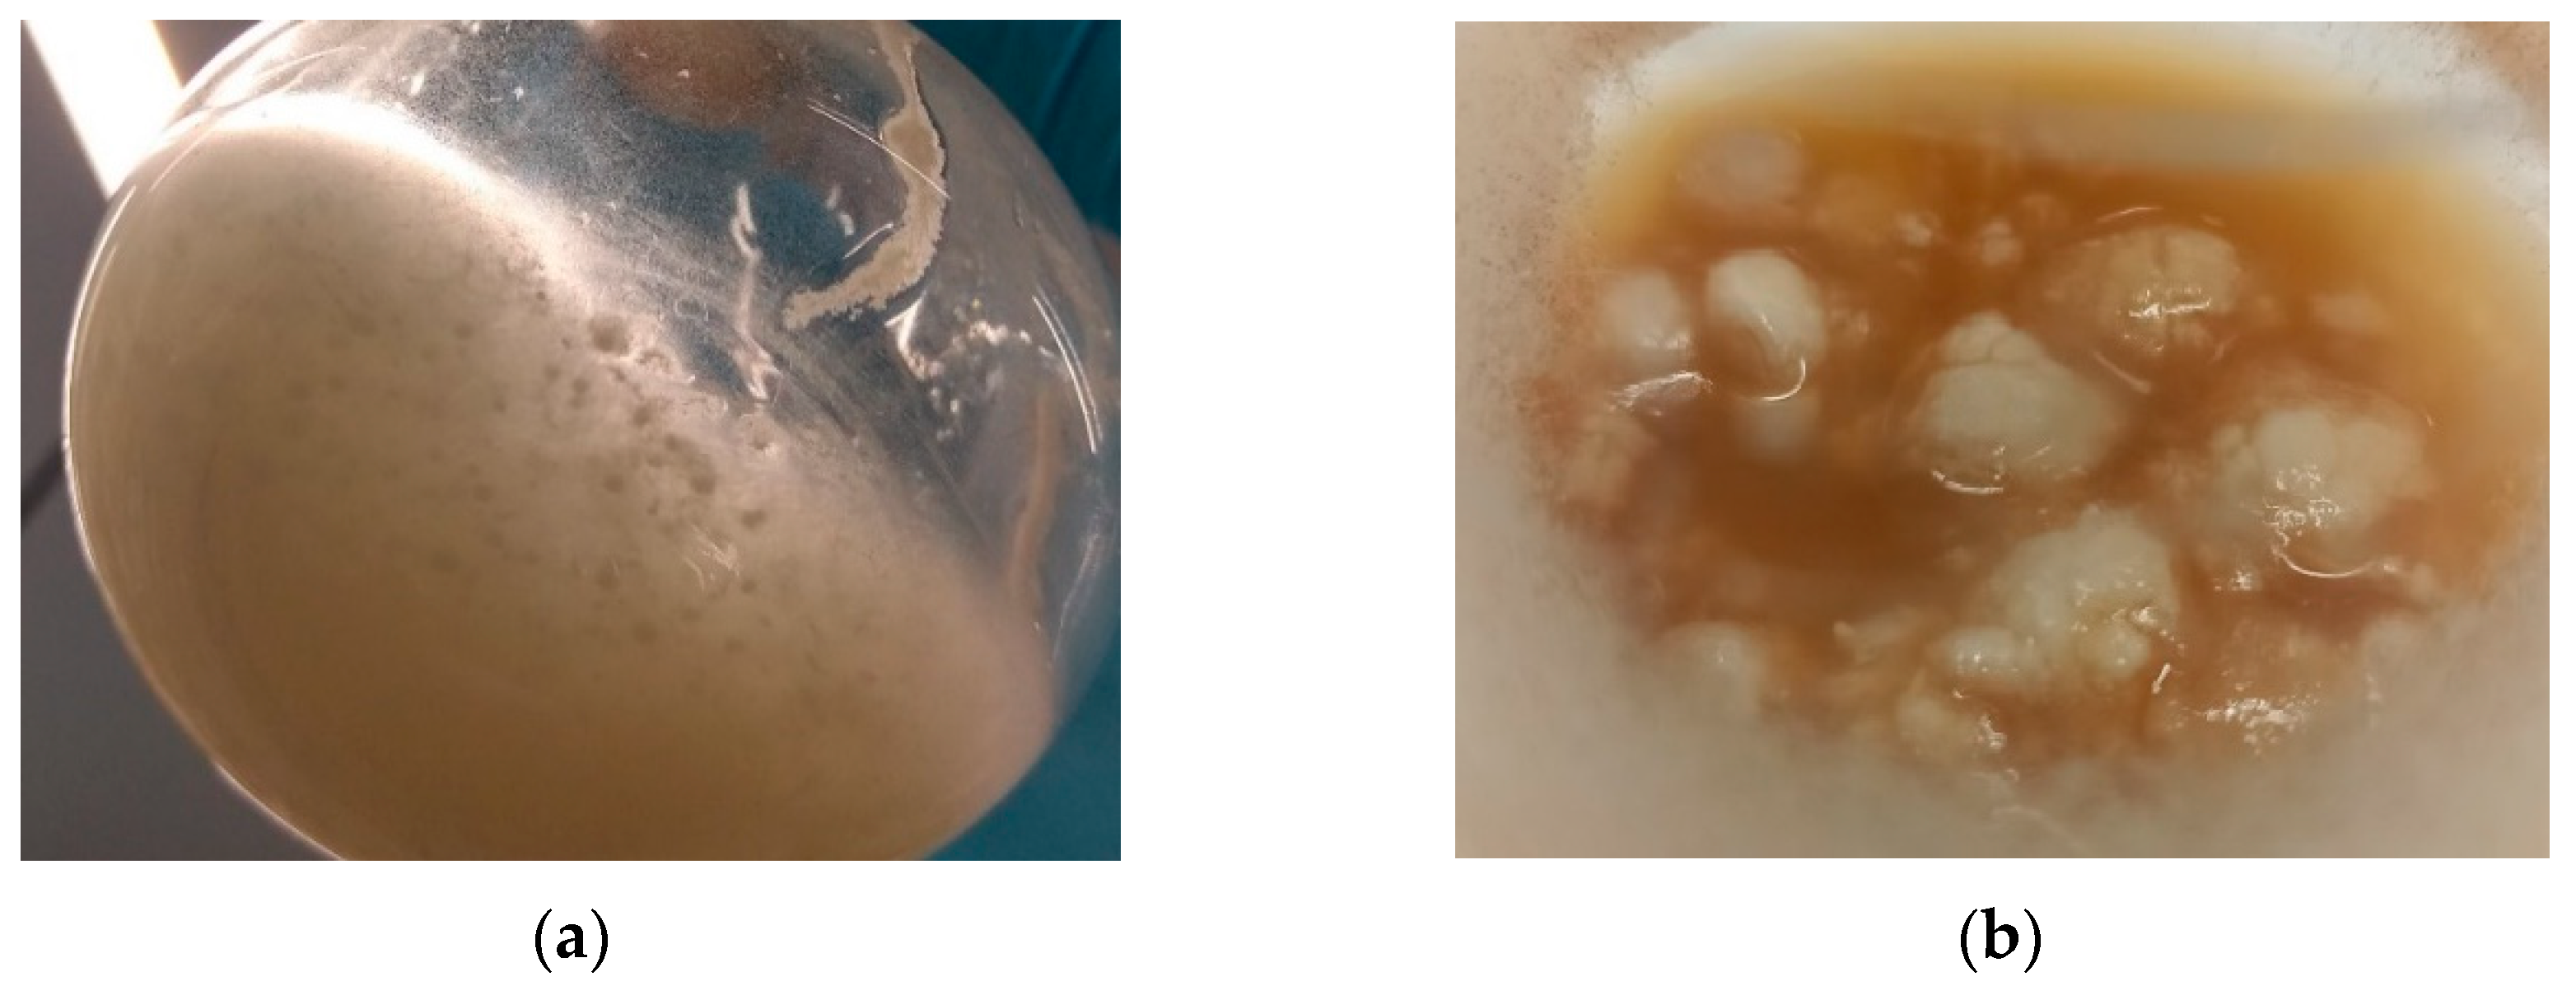
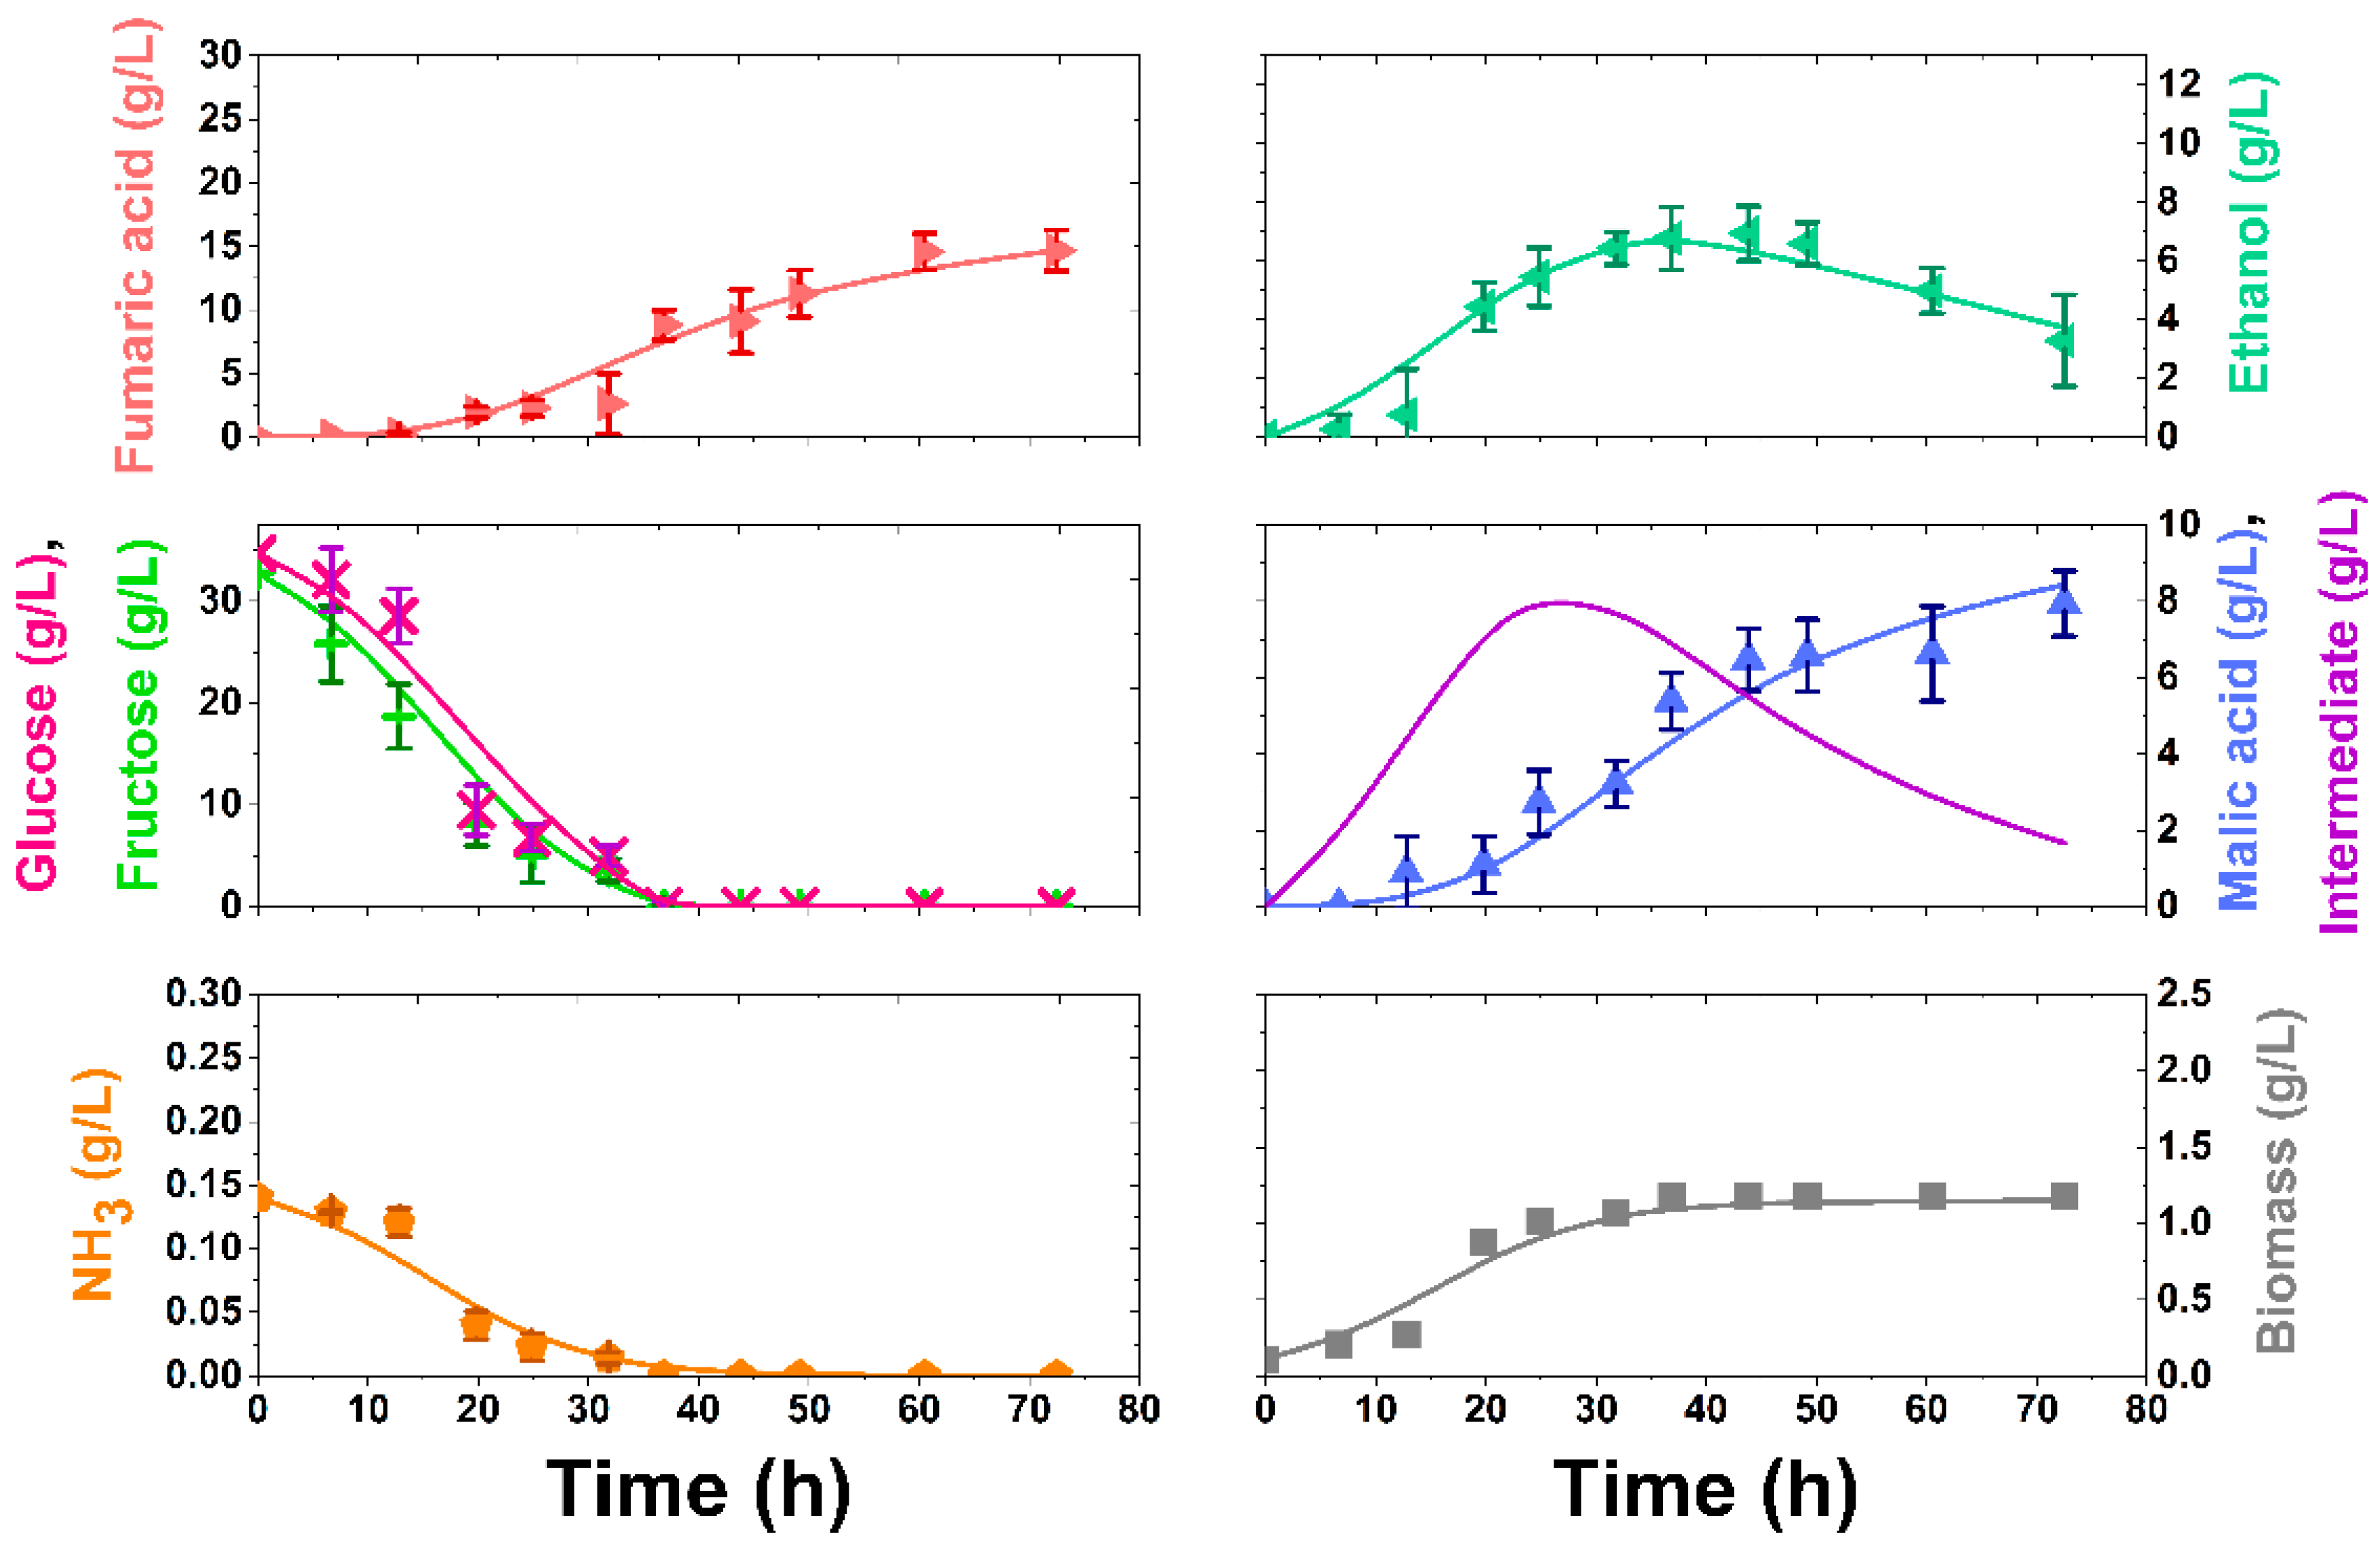
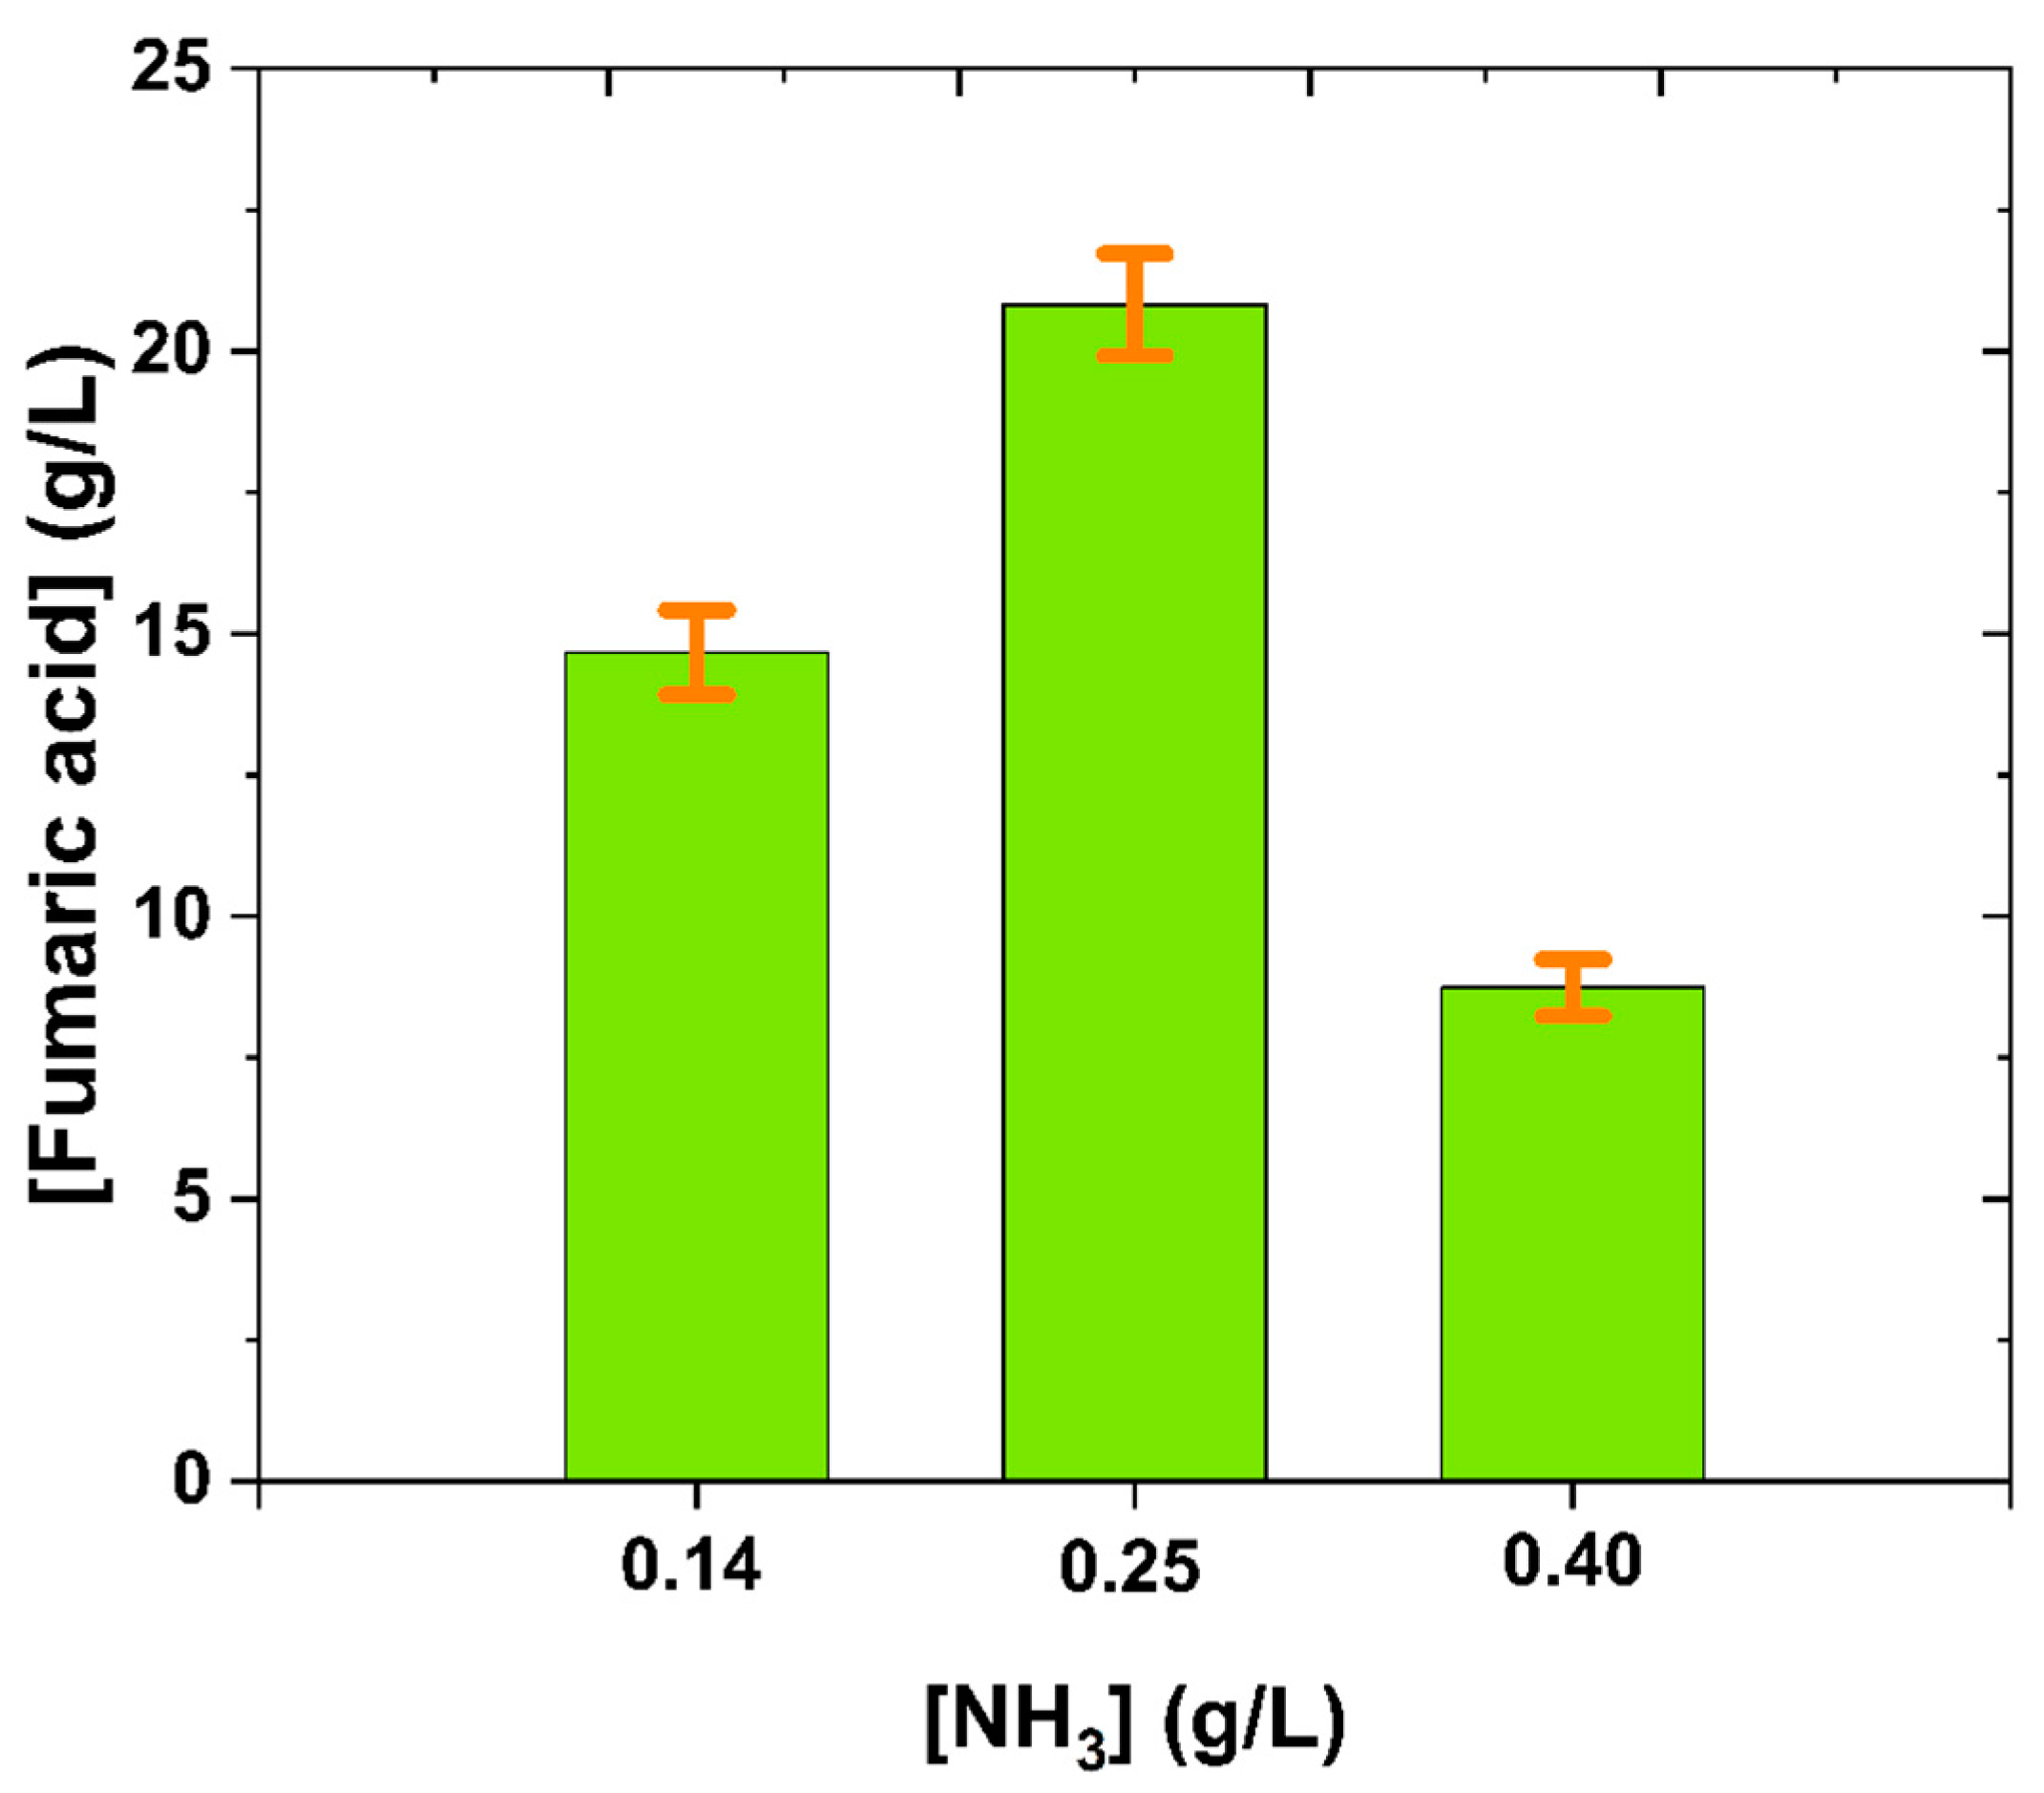
3.3. APH Application

A second set of runs was devoted to the use of detoxified APH as a carbon source in fumaric acid production. In a first trial (Experiment 3) to produce fumaric acid, the same conditions of Experiment 2 were used (Table 2). We can appreciate that both fumaric acid yield and productivity decreased by 40% and 48%, respectively. These lower values obtained in APH can be due to the remaining toxicity due to phenolic compounds and also reflect on the change of morphology: The mycelium in Experiment 3 does not grow any longer with a pellet morphology, resembling more a clump (Figure 3). This change of morphology is a symptom from a change in the metabolism. This metabolic alteration is probably a fungal defense strategy in the presence of phenolics and antioxidant compounds, because it reduces the inner concentration of these compounds in the biomass due to mass transfer limitations inside the clump [28,43]. However, this will result also in lower amounts of oxygen reaching the inner part of the clump and, probably, to the death of inner cells as the clump grows, with the subsequent reduction of active biomass concentration.
In view of these results, is clear that detoxification process should be improved, in a way to reduce the inhibition and reach higher production yields. For this purpose, the active carbon treatment step could be optimized; on the other hand, other treatments could be performed, such as adsorption to hydrophobic matrixes, nanofiltration with membranes or peroxidase treatment [44,45].
In Figure 4, we displayed the time evolution of all the compounds. Some temporal changes can be easily perceived. For example, even if biomass growth and nitrogen source consumption follow the same trends as they used to, these processes are taking place more slowly. Moreover, the change of morphology provokes the decrease on fumaric acid production. This reduction on the final concentration of fumaric acid is balanced by a higher production of malic acid. The carbon flux driven to reductive TCA should be maintained [46]. Thus, the mentioned inhibition must have affected fumarase activity, preventing malate transformation to fumarate. It have been reported that certain substances present in essential oils coming from different fruits have an antifungal effect [28,43], also some components from fruit juices such as phenolics or antioxidant compounds reduce the activity of several enzymes produced by fungi [43,47]. It is well known and reported in the bibliography that enzymes responsible for the reductive TCA pathway are very sensitive to changes in fermentation conditions and overall fumarase [48,49]. It is possible to switch reversibility of certain metabolic reactions, changing process conditions [13,50]. So, it is not strange that the presence of inhibitors could impact on reductive TCA enzymes and, in particular, on fumarase.
As a consequence, fumaric and malic acids evolve in a diverse manner: their production is still not associated to growth (such as in previous experiments); however, when sugar concentration finishes, both acids concentration still rises. This effect could be explained by the accumulation of an intermediate metabolite, possibly malate, as the result of the deactivation of fumarase or other enzymes on the TCA reductive pathway[47,51]
Other remarkable difference is the ethanol disappearance once its maximum is reached. As mentioned before, the Crabtree effect can be activated or not depending on the concentration of glucose and fructose, being the threshold concentration dependent on the sugar [40]. In fact, this effect can also be affected by the presence of inhibitory substances. Under stress conditions and in need of energy sources, the fungus could activate the ethanol transport through the membrane, this transport being driven by a concentration gradient and, thus, diffusive in nature. Ethanol is consumed afterwards in the TCA cycle, creating a notable amount of energy in terms of ATP [42]. This ethanol consumption takes place after 40 h, once glucose and fructose have disappeared. In fact, carbohydrate consumption when using APH is faster than with pure sugar solutions, so ethanol could be used as alternative carbon source for cellular maintenance once sugars are not present. Furthermore, sugars disappearance with bioprocess time changes when compared to the trend in Experiment 2: now both sugars are consumed at the same rate. While glucose is consumed at a slightly higher rate, fructose consumption rate is increased 2–3 fold.
The drop of the fermentation parameters could be caused by an excess of chemical stress suffered by the fungi, although this stress reflects in a more active metabolism and a diverse morphology. As carbon consumption is activated, it can be foreseen that nitrogen needs will be higher. For this reason, and also trying to reduce the classical nitrogen limiting conditions [13,21,42], we have tested different ammonia initial concentrations when using APH (Figure 5), setting them at 0.25 and 0.40 g/L.
It is to be appreciated (Figure 5) that now, when using APH monosaccharides as the main carbon source, the fungal need of nitrogen moves quickly towards higher values (even though nitrogen restrictions are still needed to produce fumaric acid). As a consequence, an ammonia concentration of 0.25 g/L was selected for a final experiment (Experiment 4). As can be seen on Table 2, production yield is very similar to that obtained with the analogue medium (experiment 2). Moreover, the productivities (Table 2) show that this increase in final production is due to the reduction of nitrogen stress, with a concomitant decrease of fumaric acid productivity. Thus, the higher acid final concentration seems to be directly related to a higher biomass concentration, consequence of a higher nitrogen availability. In Figure 6, we appreciate the same trends for all the compounds perceived in Experiment 3 (in both cases using APH), while final fumaric acid concentration has been improved and ethanol production increases. As malic acid production is lower than obtained in Experiment 3, we can conclude that its conversion into fumaric acid is also activated. The behaviour of ethanol indicates a higher activation of the Crabtree effect [41].
It was proven there is a fall in the value of the production yield when APH is used; however, this value is similar to those obtained with other wastes hydrolysates (Table 3). The use of these kind of carbon sources involves inhibition due to the presence of different substances present in the hydrolyzed biomass, that provoke a lower production respect that from synthetic media. However, reached production yields are good enough to carry out the process successfully.

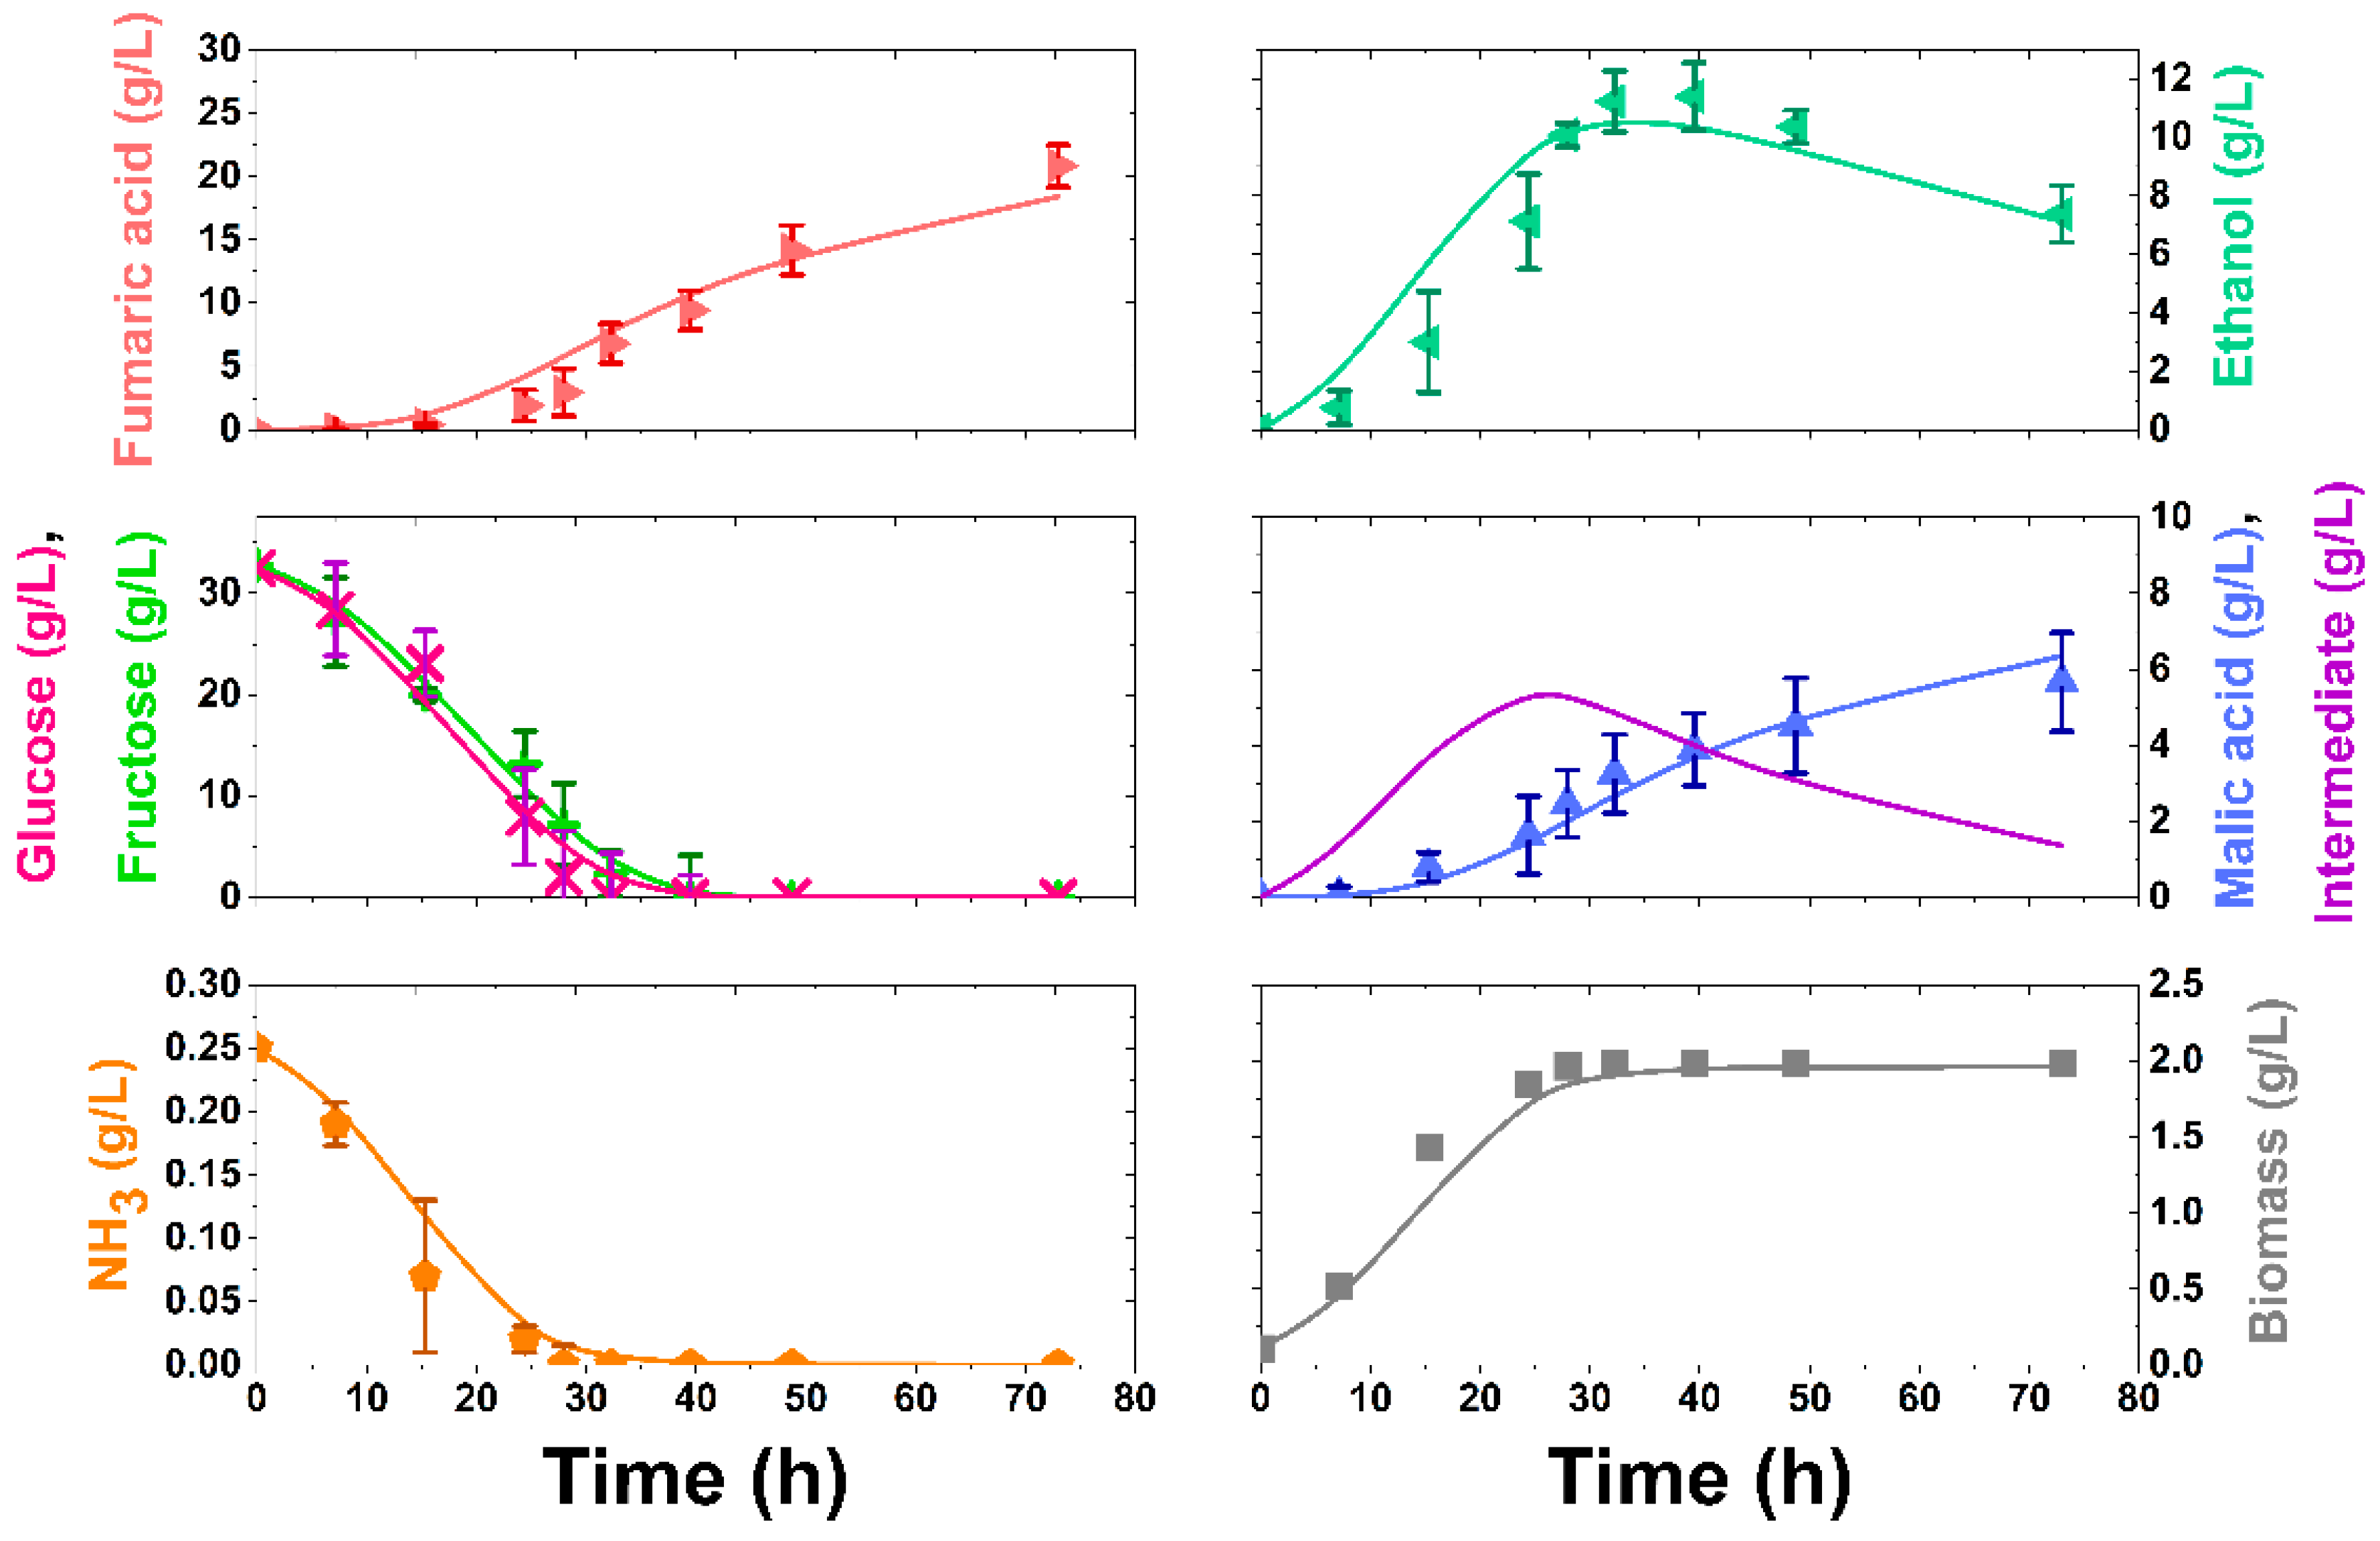
3.4. Kinetic Modelling

With the proposed kinetic model, modelling and analysis was performed using Aspen Custom Modeller V11®. Kinetic parameters obtained are represented in Table 4. At the same time, statistical parameters related with goodness-of-fitting are represented in Table 5. The model prediction is represented in Figure 1, Figure 2, Figure 3 and Figure 5 as lines, showing the accurate fit of the model, in lines, to each experiment’s results. As it can be seen, the evolution of the intermediate compound can be predicted using this model: as expected, this compound shows a trend passing through a maximum value. The accumulation of this compound is higher when APH is used as substrate as a consequence of the reduction of fumaric acid production.
The value of the parameter YNX is set to a value of 0.135 gAmmonia/gBiomass in all cases because biomass concentration is calculated from consumed ammonia. From the other kinetic parameters, contained in Table 4, some observations can be pointed out: the first observation is the inhibition caused by phenolics and antioxidants containing in APH, affecting the specific growth rate, μm. Its value is clearly lower in the experiments when the hydrolysate is used as substrate, this effect can be observed comparing results shown in Figure 2 and Figure 3, where biomass production is slower in Experiment 3. The value for Experiment 4 lower than Experiment 3 is perhaps due to an ammonia inhibition.
The values of μm in Experiments 1 and 2 are difficult to analyse in comparison with other processes with Rhizopus spp., because in literature there are no kinetic models for this process. A comparative process is, for example, lactic acid production [55,56], showing the same magnitude order and similar values for this kinetic parameter in different processes with diverse growth models. Rhizopus spp. specific growth rate is always very similar.
Regarding the values of YGX and YFrX parameters, we can observe how the sum of values of parameters YGX and YFrX in Experiments 2 and 3, gives a value very close to YGX in Experiment 1. This means that the yield of the use of sugars for cell reproduction is equal for the experiments carried out using the same total sugar and ammonium concentrations (Table 4).
Considering malic acid production, YMF has a very similar value in Experiments 1 and 2, but in Experiment 3 the highest value of the study is observed. Apparently, this increase in malic acid production is a consequence of the excessive accumulation of the intermediate metabolite observed in Figure 3.
Considering the evolution of the intermediate and the behaviours of kF and YMF parameters, it is most plausible that inhibition caused by compounds present in APH is affecting fumarase. Therefore, to identify the intermediate metabolite with malate turns out to be a real possibility.
To generate a deeper understanding of the influence of certain parameters on the proposed model, a sensibility analysis of certain parameters was performed throughout the proposal of alternative scenarios (Figures S1–S4). We can appreciate that the model predicts a higher yield to fumaric acid when a total detoxification of the APH is attained (Figure S2), while a higher amount of glucose and fructose at the beginning results in higher titres for the acid and by-products, but not in higher yields (Figure S4). Evidently, considering the environmental effects on the biocatalytic capacity of the fungus, these results are predictions that need to be validated with a thorough experimentation. This analysis has been included as Supplementary Material.
Regarding statistical parameters in Table 5, it is clearly observed that the fit of the proposed models to experimental data of the four experiments is accurate from a statistical perspective: very high F95 values, much higher than the theoretical or threshold value to reject the null hypothesis at 95% confidence (between 20 and 30 for each experiment data number and the kinetic model parameter number), a very low value of RMSE (corresponding to similar values for experimental data and data obtained by calculation with the kinetic model and the parameters retrieved for the relevant experiment). Moreover, the percentage of variation explained is relatively close to 100%, so experimental and calculated, with the model, trends of the concentrations with time are very similar.

4. Conclusions

R. arrhizus is proven to be able to produce fumaric acid from pure glucose and glucose:fructose mixtures media, providing relatively high final concentrations that are even better when glucose:fructose mixtures are used, instead of only glucose.
APH is a suitable substrate for these fermentative processes, with an adequate sugar concentration to reach appropriate production yields. APH detoxification reduces its high content in phenolics and antioxidants, but still a high amount remains. It can suppose a disadvantage and generate inhibitory effects on cellular growth and production. Adding more nitrogen, reducing the stress due to its relative deficiency, results in relatively low yields but fumaric acid titers are recovered.
Finally, a proposed kinetic model can describe and predict the behavior of the process in the four conditions here tested, through an accurate description of the reaction scheme, providing optimum goodness-of-fit statistical parameters. Kinetic parameters reflect the effects of the chemical changes in the broth due to the modifications in the type of carbon source and the amount of nitrogen source.

Supplementary Materials

The following supporting information can be downloaded at: https://www.mdpi.com/article/10.3390/pr10122624/s1, Figure S1: Scenario 1 simulation; Figure S2: Scenario 2 simulation; Figure S3: Scenario 3 simulation; Figure S4: Scenario 4 simulation.

Author Contributions

Conceptualization, V.M.-D., M.L. and V.E.S.; methodology, V.M.-D., J.G.-M. and A.G.-M.; investigation, V.M.-D., J.G.-M. and A.G.-M.; data curation, V.M.-D.; writing—original draft preparation, V.M.-D.; writing—review and editing, V.E.S. and M.L.; supervision, V.E.S. and M.L.; project administration, V.E.S. and M.L.; funding acquisition, V.E.S. and M.L. All authors have read and agreed to the published version of the manuscript.

Funding

This research was funded by the Spanish Science and Innovation Ministry through a pre-doctoral grant for V.M.D. and the research project VALOPACK [grant number: PRE2018-084908; research project code: PID2020-114365RB-C21], and European Commission with the ERA-net project SPAREC [research project code: ERA-Net SUSFOOD2 PCI2018-093114], all of which are thankfully appreciated.

Data Availability Statement

All data used in this study are included in figures and tables. Numerical data will be provided should they are requested.

Acknowledgments

We are sincerely grateful to Concentrados Villaviciosa S.A. for the fruit wastes supply employed in the present study. ASA Spezialenzyme GmbH is kindly acknowledged for its contribution as consultant on enzymes selection and enzyme supply.

Conflicts of Interest

The authors declare no conflict of interest.

References

  1. Portada—Desarrollo Sostenible. Available online: https://www.un.org/sustainabledevelopment/es/ (accessed on 17 May 2022).
  2. Mat Aron, N.S.; Khoo, K.S.; Chew, K.W.; Show, P.L.; Chen, W.H.; Nguyen, T.H.P. Sustainability of the four generations of biofuels—A review. Int. J. Energy Res. 2020, 44, 9266–9282. [Google Scholar] [CrossRef]
  3. Batten, S. Climate Change and the Macro-Economy: A Critical Review. SSRN Electron. J. 2018. Staff Working Paper No. 706. Available online: https://papers.ssrn.com/sol3/papers.cfm?abstract_id=3104554 (accessed on 17 May 2022). [CrossRef]
  4. Moral-Zamorano, M.; Quijada-Garrido, I.; San-Miguel, V.; Serrano, B.; Baselga, J.; Hashmi, S.; Stadler, F.J.; García-Peñas, A. Concentration effect over thermoresponse derived from organometallic compounds of functionalized poly(N-isopropylacrylamide-co-dopamine methacrylamide). Polymers 2021, 13, 3921. [Google Scholar] [CrossRef] [PubMed]
  5. Ripoll, V.; Rodríguez, A.; Ladero, M.; Santos, V.E. High 2,3-butanediol production from glycerol by Raoultella terrigena CECT 4519. Bioprocess Biosyst. Eng. 2020, 43, 685–692. [Google Scholar] [CrossRef]
  6. Esteban, J.; Ladero, M. Food waste as a source of value-added chemicals and materials: A biorefinery perspective. Int. J. Food Sci. Technol. 2018, 53, 1095–1108. [Google Scholar] [CrossRef]
  7. Nanda, S.; Rana, R.; Sarangi, P.K.; Dalai, A.K.; Kozinski, J.A. A Broad Introduction to First-, Second-, and Third-Generation Biofuels. In Recent Advancements in Biofuels and Bioenergy Utilization; Sarangi, P., Nanda, S., Mohanty, P., Eds.; Springer: Singapore, 2018; pp. 1–25. [Google Scholar] [CrossRef]
  8. Straathof, A.J.J.; Wahl, S.A.; Benjamin, K.R.; Takors, R.; Wierckx, N.; Noorman, H.J. Grand research challenges for sustainable industrial biotechnology. Trends Biotechnol. 2019, 37, 1042–1050. [Google Scholar] [CrossRef]
  9. Garcia-Montalvo, J.; Garcia-Martin, A.; Ibañez-Bujan, J.; Santos, V.E.; Yustos, P.; Bolivar, J.M.; Ladero, M. Extraction of antioxidants from grape and apple pomace: Solvent selection and process kinetics. Appl. Sci. 2022, 12, 4901. [Google Scholar] [CrossRef]
  10. Arias, A.; Feijoo, G.; Moreira, M.T. Exploring the potential of antioxidants from fruits and vegetables and strategies for their recovery. Innov. Food Sci. Emerg. Technol. 2022, 77, 102974. [Google Scholar] [CrossRef]
  11. Perussello, C.A.; Zhang, Z.; Marzocchella, A.; Tiwari, B.K. Valorization of apple pomace by extraction of valuable compounds. Compr. Rev. Food Sci. Food Saf. 2017, 16, 776–796. [Google Scholar] [CrossRef]
  12. Werpy, T.; Petersen, G. Top Value Added Chemicals from Biomass: Volume I—Results of Screening for Potential Candidates from Sugars and Synthesis Gas; National Renewable Energy Lab.: Golden, CO, USA, 2004. [Google Scholar] [CrossRef] [Green Version]
  13. Roa Engel, C.A.; Straathof, A.J.J.; Zijlmans, T.W.; Van Gulik, W.M.; Van Der Wielen, L.A.M. Fumaric acid production by fermentation. Appl. Microbiol. Biotechnol. 2008, 78, 379–389. [Google Scholar] [CrossRef] [Green Version]
  14. McGinn, S.M.; Beauchemin, K.A.; Coates, T.; Colombatto, D. Methane emissions from beef cattle: Effects of monensin, sunflower oil, enzymes, yeast, and fumaric acid. J. Anim. Sci. 2004, 82, 3346–3356. [Google Scholar] [CrossRef] [PubMed]
  15. Liu, Y.; Song, J.; Tan, T.; Liu, L. Production of fumaric acid from l-malic acid by solvent engineering using a recombinant thermostable fumarase from Thermus thermophilus HB8. Appl. Biochem. Biotechnol. 2015, 175, 2823–2831. [Google Scholar] [CrossRef] [PubMed]
  16. El-Enshasy, H.A. Filamentous Fungal Cultures-Process Characteristics, Products, and Applications. In Bioprocessing for Value-Added Products from Renewable Resources; Yang, S.-T., Ed.; Elsevier Science: Amsterdam, The Netherlands, 2007; pp. 225–261. [Google Scholar] [CrossRef]
  17. Zhang, K. Fumaric Acid Fermentation by Rhizopus oryzae with Integrated Separation Technologies. Ph.D. Thesis, The Ohio State University, Columbus, OH, USA, 2012; pp. 1–210. [Google Scholar]
  18. Martin-Dominguez, V.; Estevez, J.; De Borja Ojembarrena, F.; Santos, V.E.; Ladero, M. Fumaric acid production: A biorefinery perspective. Fermentation 2018, 4, 33. [Google Scholar] [CrossRef] [Green Version]
  19. Martin-Dominguez, V.; Bouzas-Santiso, L.; Martinez-Peinado, N.; Santos, V.E.; Ladero, M. Kinetic modelling of the coproduction process of fumaric and malic acids by Rhizopus arrhizus NRRL 1526. Processes 2020, 8, 188. [Google Scholar] [CrossRef] [Green Version]
  20. Xu, Q.; Li, S.; Huang, H.; Wen, J. Key technologies for the industrial production of fumaric acid by fermentation. Biotechnol. Adv. 2012, 30, 1685–1696. [Google Scholar] [CrossRef]
  21. Zhang, K.; Yu, C.; Yang, S.T. Effects of soybean meal hydrolysate as the nitrogen source on seed culture morphology and fumaric acid production by Rhizopus oryzae. Process. Biochem. 2015, 50, 173–179. [Google Scholar] [CrossRef]
  22. Jiménez-Quero, A.; Pollet, E.; Zhao, M.; Marchioni, E.; Avérous, L.; Phalip, V. Fungal fermentation of lignocellulosic biomass for itaconic and fumaric acid production. J. Microbiol. Biotechnol. 2017, 27, 1–8. [Google Scholar] [CrossRef]
  23. Gołebiewska, E.; Kalinowska, M.; Yildiz, G. Sustainable use of apple pomace (AP) in different industrial sectors. Materials 2022, 15, 1788. [Google Scholar] [CrossRef]
  24. Vukušić, J.L.; Millenautzki, T.; Cieplik, R.; Obst, V.; Saaid, A.M.; Clavijo, L.; Zlatanovic, S.; Hof, J.; Mösche, M.; Barbe, S. Reshaping apple juice production into a zero discharge biorefinery process. Waste Biomass Valorization 2021, 12, 3617–3627. [Google Scholar] [CrossRef]
  25. de la Torre, I.; Ladero, M.; Santos, V.E. D-lactic acid production from orange waste enzymatic hydrolysates with L. delbrueckii cells in growing and resting state. Ind. Crop. Prod. 2020, 146, 112176. [Google Scholar] [CrossRef]
  26. Senit, J.J.; Velasco, D.; Gomez Manrique, A.; Sanchez-Barba, M.; Toledo, J.M.; Santos, V.E.; Garcia-Ochoa, F.; Yustos, P.; Ladero, M. Orange peel waste upstream integrated processing to terpenes, phenolics, pectin and monosaccharides: Optimization approaches. Ind. Crop. Prod. 2019, 134, 370–381. [Google Scholar] [CrossRef]
  27. Krull, S.; Eidt, L.; Hevekerl, A.; Kuenz, A.; Prüße, U. Itaconic acid production from wheat chaff by Aspergillus terreus. Process. Biochem. 2017, 63, 169–176. [Google Scholar] [CrossRef]
  28. Grande-Tovar, C.D.; Chaves-Lopez, C.; Serio, A.; Rossi, C.; Paparella, A. Chitosan coatings enriched with essential oils: Effects on fungi involve in fruit decay and mechanisms of action. Trends Food Sci. Technol. 2018, 78, 61–71. [Google Scholar] [CrossRef]
  29. Chandel, A.K.; Kapoor, R.K.; Singh, A.; Kuhad, R.C. Detoxification of sugarcane bagasse hydrolysate improves ethanol production by Candida shehatae NCIM 3501. Bioresour. Technol. 2007, 98, 1947–1950. [Google Scholar] [CrossRef] [PubMed]
  30. Martin-Dominguez, V.; Aleman-Cabrera, P.I.; Eidt, L.; Pruesse, U.; Kuenz, A.; Ladero, M.; Santos, V.E. Production of fumaric acid by Rhizopus arrhizus NRRL 1526: A Simple Production Medium and the Kinetic Modelling of the Bioprocess. Fermentation 2022, 8, 64. [Google Scholar] [CrossRef]
  31. Rhodes, R.A.; Moyer, A.J.; Smith, M.L.; Kelley, S.E. Production of fumaric acid by Rhizopus arrhizus. Appl. Microbiol. 1959, 7, 74–80. [Google Scholar] [CrossRef]
  32. Ling, L.; Ng, T. Fermentation Process for Carboxylic Acids. U.S. Patent 4,877,731, 31 October 1989. [Google Scholar]
  33. Ribeiro, L.F.; Ribani, R.H.; Francisco, T.M.G.; Soares, A.A.; Pontarolo, R.; Haminiuk, C.W.I. Profile of bioactive compounds from grape pomace (Vitis vinifera and Vitis labrusca) by spectrophotometric, chromatographic and spectral analyses. J. Chromatogr. B 2015, 1007, 72–80. [Google Scholar] [CrossRef]
  34. Ozturk, B.; Parkinson, C.; Gonzalez-Miquel, M. Extraction of polyphenolic antioxidants from orange peel waste using deep eutectic solvents. Sep. Purif. Technol. 2018, 206, 2384–2393. [Google Scholar] [CrossRef]
  35. Dennis, J.E.; Gay, D.M.; Welsch, R.E. An adaptative nonlinear least-squares algorithm. ACM Trans. Math. Softw. 1981, 7, 348–368. [Google Scholar] [CrossRef] [Green Version]
  36. Yepes, C.; Estévez, J.; Arroyo, M.; Ladero, M. Immobilization of an industrial β-glucosidase from Aspergillus fumigatus and its use for cellobiose hydrolysis. Processes 2022, 10, 1225. [Google Scholar] [CrossRef]
  37. Esteban, J.; Fuente, E.; Blanco, A.; Ladero, M.; Garcia-Ochoa, F. Phenomenological kinetic model of the synthesis of glycerol carbonate assisted by focused beam reflectance measurements. Chem. Eng. J. 2015, 260, 434–443. [Google Scholar] [CrossRef]
  38. Ichikawa, S.; Iino, T.; Sato, S.; Nakahara, T.; Mukataka, S. Improvement of production rate and yield of fumaric acid from maleic acid by heat treatment of Pseudomonas alcaligenes strain XD-1. Biochem. Eng. J. 2003, 13, 7–13. [Google Scholar] [CrossRef]
  39. Naude, A.; Nicol, W. Improved continuous fumaric acid production with immobilised Rhizopus oryzae by implementation of a revised nitrogen control strategy. New Biotechnol. 2018, 44, 13–22. [Google Scholar] [CrossRef] [PubMed] [Green Version]
  40. Swart, R.M.; Brink, H.; Nicol, W. Rhizopus oryzae for fumaric acid production: Optimising the use of a synthetic lignocellulosic hydrolysate. Fermentation 2022, 8, 278. [Google Scholar] [CrossRef]
  41. Swart, R.M.; Ronoh, D.K.; Brink, H.; Nicol, W. Continuous production of fumaric acid with immobilised Rhizopus oryzae: The role of ph and urea addition. Catalysts 2022, 12, 82. [Google Scholar] [CrossRef]
  42. Swart, R.M.; Roux, F.; Naude, A.; de Jongh, N.W.; Nicol, W. Fumarate production with Rhizopus oryzae: Utilising the Crabtree effect to minimise ethanol by-product formation. Biotechnol. Biofuels 2020, 13, 22. [Google Scholar] [CrossRef] [Green Version]
  43. Rana, B.K.; Singh, U.P.; Taneja, V. Antifungal activity and kinetics of inhibition by essential oil isolated from leaves of Aegle marmelos. J. Ethnopharmacol. 1997, 57, 29–34. [Google Scholar] [CrossRef]
  44. Raj, T.; Chandrasekhar, K.; Morya, R.; Kumar Pandey, A.; Jung, J.H.; Kumar, D.; Singhania, R.R.; Kim, S.H. Critical challenges and technological breakthroughs in food waste hydrolysis and detoxification for fuels and chemicals production. Bioresour. Technol. 2022, 360, 127512. [Google Scholar] [CrossRef]
  45. Tavares, A.P.M.; Gonçalves, M.J.A.; Brás, T.; Pesce, G.R.; Xavier, A.M.R.B.; Fernandes, M.C. Cardoon hydrolysate detoxification by activated carbon or membranes system for bioethanol production. Energies 2022, 15, 1993. [Google Scholar] [CrossRef]
  46. Yin, X.; Li, J.; Shin, H.-D.; Du, G.; Liu, L.; Chen, J. Metabolic engineering in the biotechnological production of organic acids in the tricarboxylic acid cycle of microorganisms: Advances and prospects. Biotechnol. Adv. 2015, 33, 830–841. [Google Scholar] [CrossRef]
  47. Tsen, H.Y.; Tsai, S.Y. Comparison of the kinetics and factors affecting the stabilities of chitin-immobilized naringinases from two fungal sources. J. Ferment. Technol. 1988, 66, 193–198. [Google Scholar] [CrossRef]
  48. Ding, Y.; Li, S.; Dou, C.; Yu, Y.; He, H. Production of fumaric acid by Rhizopus oryzae: Role of carbon-nitrogen ratio. Appl. Biochem. Biotechnol. 2011, 164, 1461–1467. [Google Scholar] [CrossRef] [PubMed]
  49. Zhang, T.; Wang, Z.; Deng, L.; Tan, T.; Wang, F.; Yan, Y. Pull-in urea cycle for the production of fumaric acid in Escherichia coli. Appl. Microbiol. Biotechnol. 2015, 99, 5033–5044. [Google Scholar] [CrossRef] [PubMed]
  50. Zhang, B.; Yang, S.T. Metabolic engineering of Rhizopus oryzae: Effects of overexpressing fumR gene on cell growth and fumaric acid biosynthesis from glucose. Process. Biochem. 2012, 47, 2159–2165. [Google Scholar] [CrossRef]
  51. Zhang, K.; Yang, S.T. In situ recovery of fumaric acid by intermittent adsorption with IRA-900 ion exchange resin for enhanced fumaric acid production by Rhizopus oryzae. Biochem. Eng. J. 2015, 96, 38–45. [Google Scholar] [CrossRef]
  52. Sebastian, J.; Rouissi, T.; Brar, S.K. Miscanthus sp.—Perennial lignocellulosic biomass as feedstock for greener fumaric acid bioproduction. Ind. Crop. Prod. 2022, 175, 114248. [Google Scholar] [CrossRef]
  53. Deng, F.; Aita, G.M. Fumaric acid production by Rhizopus oryzae ATCC® 20344TM from lignocellulosic syrup. Bioenergy Res. 2018, 11, 330–340. [Google Scholar] [CrossRef]
  54. Papadaki, A.; Papapostolou, H.; Alexandri, M.; Kopsahelis, N.; Papanikolaou, S.; de Castro, A.M.; Freire, D.M.G.; Koutinas, A.A. Fumaric acid production using renewable resources from biodiesel and cane sugar production processes. Environ. Sci. Pollut. Res. 2018, 25, 35960–35970. [Google Scholar] [CrossRef]
  55. Groff, M.C.; Scaglia, G.; Gaido, M.; Kassuha, D.; Ortiz, O.A.; Noriega, S.E. Kinetic modeling of fungal biomass growth and lactic acid production in Rhizopus oryzae fermentation by using grape stalk as a solid substrate. Biocatal. Agric. Biotechnol. 2022, 39, 102255. [Google Scholar] [CrossRef]
  56. Ajala, E.O.; Ajala, M.A.; Onoriemu, O.O.; Akinpelu, S.G.; Bamidele, S.H. Lactic acid production: Utilization of yam peel hydrolysate as a substrate using Rhizopus orysae in kinetic studies. Biofuels Bioprod. Biorefin. 2021, 15, 1031–1045. [Google Scholar] [CrossRef]
Figure 1. Experimental results (points) and simulation (lines) by means of the kinetic modelling applied to Experiment 1 ([Glucose]0 = 60 g/L, [NH3]0 = 0.14 g/L, 200 rpm, 34 °C).
Processes 10 02624 g001
Figure 2. Experimental results (points) and simulation (lines) by means of the kinetic modelling applied to Experiment 2 ([Glucose]0 = [Fructose]0 = 30 g/L, [NH3]0 = 0.14 g/L, 200 rpm, 34 °C).
Processes 10 02624 g002
Figure 3. (a) Pellets obtained in synthetic media; (b) Morphology obtained in APH fermentations.
Processes 10 02624 g003
Figure 4. Experimental results (points) and simulation (lines) by means of the kinetic modelling applied on Experiment 3 (APH, [NH3]0 = 0.14 g/L, 200 rpm, 34 °C).
Processes 10 02624 g004
Figure 5. Nitrogen source concentration selection for complementing APH.
Processes 10 02624 g005
Figure 6. Experimental results (points) and simulation (lines) by means of the kinetic modelling applied on Experiment 4 (APH, [NH3]0 = 0.25 g/L, 200 rpm, 34 °C).
Processes 10 02624 g006
Table 1. APH characterization analysis.
ParameterBefore DetoxificationDetoxified APHUnits
[Sugars]68.1265.29g/L
[Glucose]35.1132.48g/L
[Fructose]33.0132.81g/L
Total phenolic content587.86336.32mgeq.gallic acid/L
Antioxidant activity67.6953.77TEAC/L
[NH4+]105.17<10 *mg/L
[Soluble protein]0.42g/L
* Below quantification limit.
Table 2. Main parameters of the experiments performed in this work.
ExperimentMedium[Fumaric Acid] (g/L)Yield (gFumaric
acid/gconsumed sugar)
Specific Productivity
(gFumaric acid/(gBiomass·h))
1Glucose: 60 g/L
NH3: 0.14 g/L
22.200.370.32
2Glucose: 30 g/L
Fructose: 30 g/L
NH3: 0.14 g/L
22.700.380.33
3APH
NH3: 0.14 g/L
14.670.230.17
4APH
NH3: 0.25 g/L
20.820.320.14
Table 3. Comparative of fumaric acid production using different wastes hydrolysates.
ReferenceMicroorganismMedium[Fumaric Acid] (g/L)Production Yield (gfumaric acid/gsugar)
[52]Rhizopus oryzae NRRL 2582Silver grass hydrolysate: Sugars ≈ 55 g/L; Yeast extract: 0.5 g/L9.260.17
[53]Rhizopus oryzae ATCC 20344Lignocellulosic syrup: Sugars ≈ 80 g/L; Urea: 0.2 g/L34.200.43
[54]Rhizopus oryzae NRRL 2582Sugar cane molasses with soybean cake hydrolysate: Sugars ≈ 25 g/L; free amino nitrogen: 0.2 g/L7.900.32
Present workRhizopus arrhizus NRRL 1526Apple pomace hydrolysate: Sugars ≈ 60 g/L; (NH4)2SO4: 0.25 g/L20.820.32
Table 4. Kinetic parameters for the proposed kinetic model obtained by statistical fitting.
ParameterUnitsExperiment 1Experiment 2Experiment 3Experiment 4
μm L g NH 3 · h 1.20 ± 0.071.28 ± 0.080.96 ± 0.040.76 ± 0.05
kF L · g Fumaric   acid g Biomass · g Sugar · h (2.64 ± 0.40)·10−1(2.87 ± 0.34)·10−1(0.74 ± 0.05)·10−1(0.48 ± 0.05)·10−1
kE g Ethanol g Biomass · h (8.14 ± 1.42)·10−2(5.14 ± 2.20)·10−2
mS g Glucose g Biomass · h (5.94 ± 2.67)·10−1(3.14 ± 0.38)·10−1(5.36 ± 0.26)·10−1(3.25 ± 2.81)·10−1
YFrEn g Fructose g Glucose 1.25 ± 0.131.93 ± 0.101.27 ± 1.06
YMF g Malic   acid g Fumaric   acid (2.11 ± 0.16)·10−1(2.04 ± 0.16)·10−1(5.61 ± 0.34)·10−1(3.45 ± 0.79)·10−1
YEX g Ethanol g Biomass 7.52 ± 0.367.17 ± 0.346.88 ± 0.295.86 ± 0.39
YGX g Glucose g Biomass 30.40 ± 8.8520.57 ± 2.9521.95 ± 1.1910.57 ± 4.47
YFrX g Fructose g Biomass 5.97 ± 2.849.47 ± 1.198.17 ± 4.41
YIX g Intermediate g Biomass 4.86 ± 0.683.49 ± 0.466.93 ± 0.804.19 ± 0.47
YIF g Intermediate g Fumaric   acid (2.19 ± 0.16)·10−1(1.31 ± 0.32)·10−1(3.49 ± 0.88)·10−1(3.45 ± 0.79)·10−1
Table 5. Statistical parameters of proposed kinetic modelling.
ParameterExperiment 1Experiment 2Experiment 3Experiment 4
RMSE0.0880.0860.0890.127
F951954309536611407937696
%VE96.2895.5096.5596.93
Publisher’s Note: MDPI stays neutral with regard to jurisdictional claims in published maps and institutional affiliations.

