


Analysis of Voltage Stability of the Slovak Republic’s Power System †


Abstract
:1. Introduction
- Transmission system (TS) configuration—the number of interconnections between and lengths of individual transmission lines;
- Load and transit through the TS;
- Strategy of the voltage control (i.e., reactive power control);
- Speed of the voltage regulators;
- Load characteristics;
- Connection and characteristics of the compensation devices;
- Installed transformers with on-load tap changers (OLTCs).
2. Materials and Methods
- The voltage change profile of particular nodes with an increasing load and increasing transit, whereby it was possible to identify strong and weak nodes;
- The critical voltages important for the change of function of the transformers with AVRs in the TS/DS, e.g., regulator OLTC blocking;
- The margin for maintenance of the voltage in pilot nodes with an increasing load and increasing transit.
- Voltage magnitude in the TS nodes;
- Power angle of the transmission lines;
- Estimation of the reactive power reserve in generators by identifying the operating point in the PQ diagram;
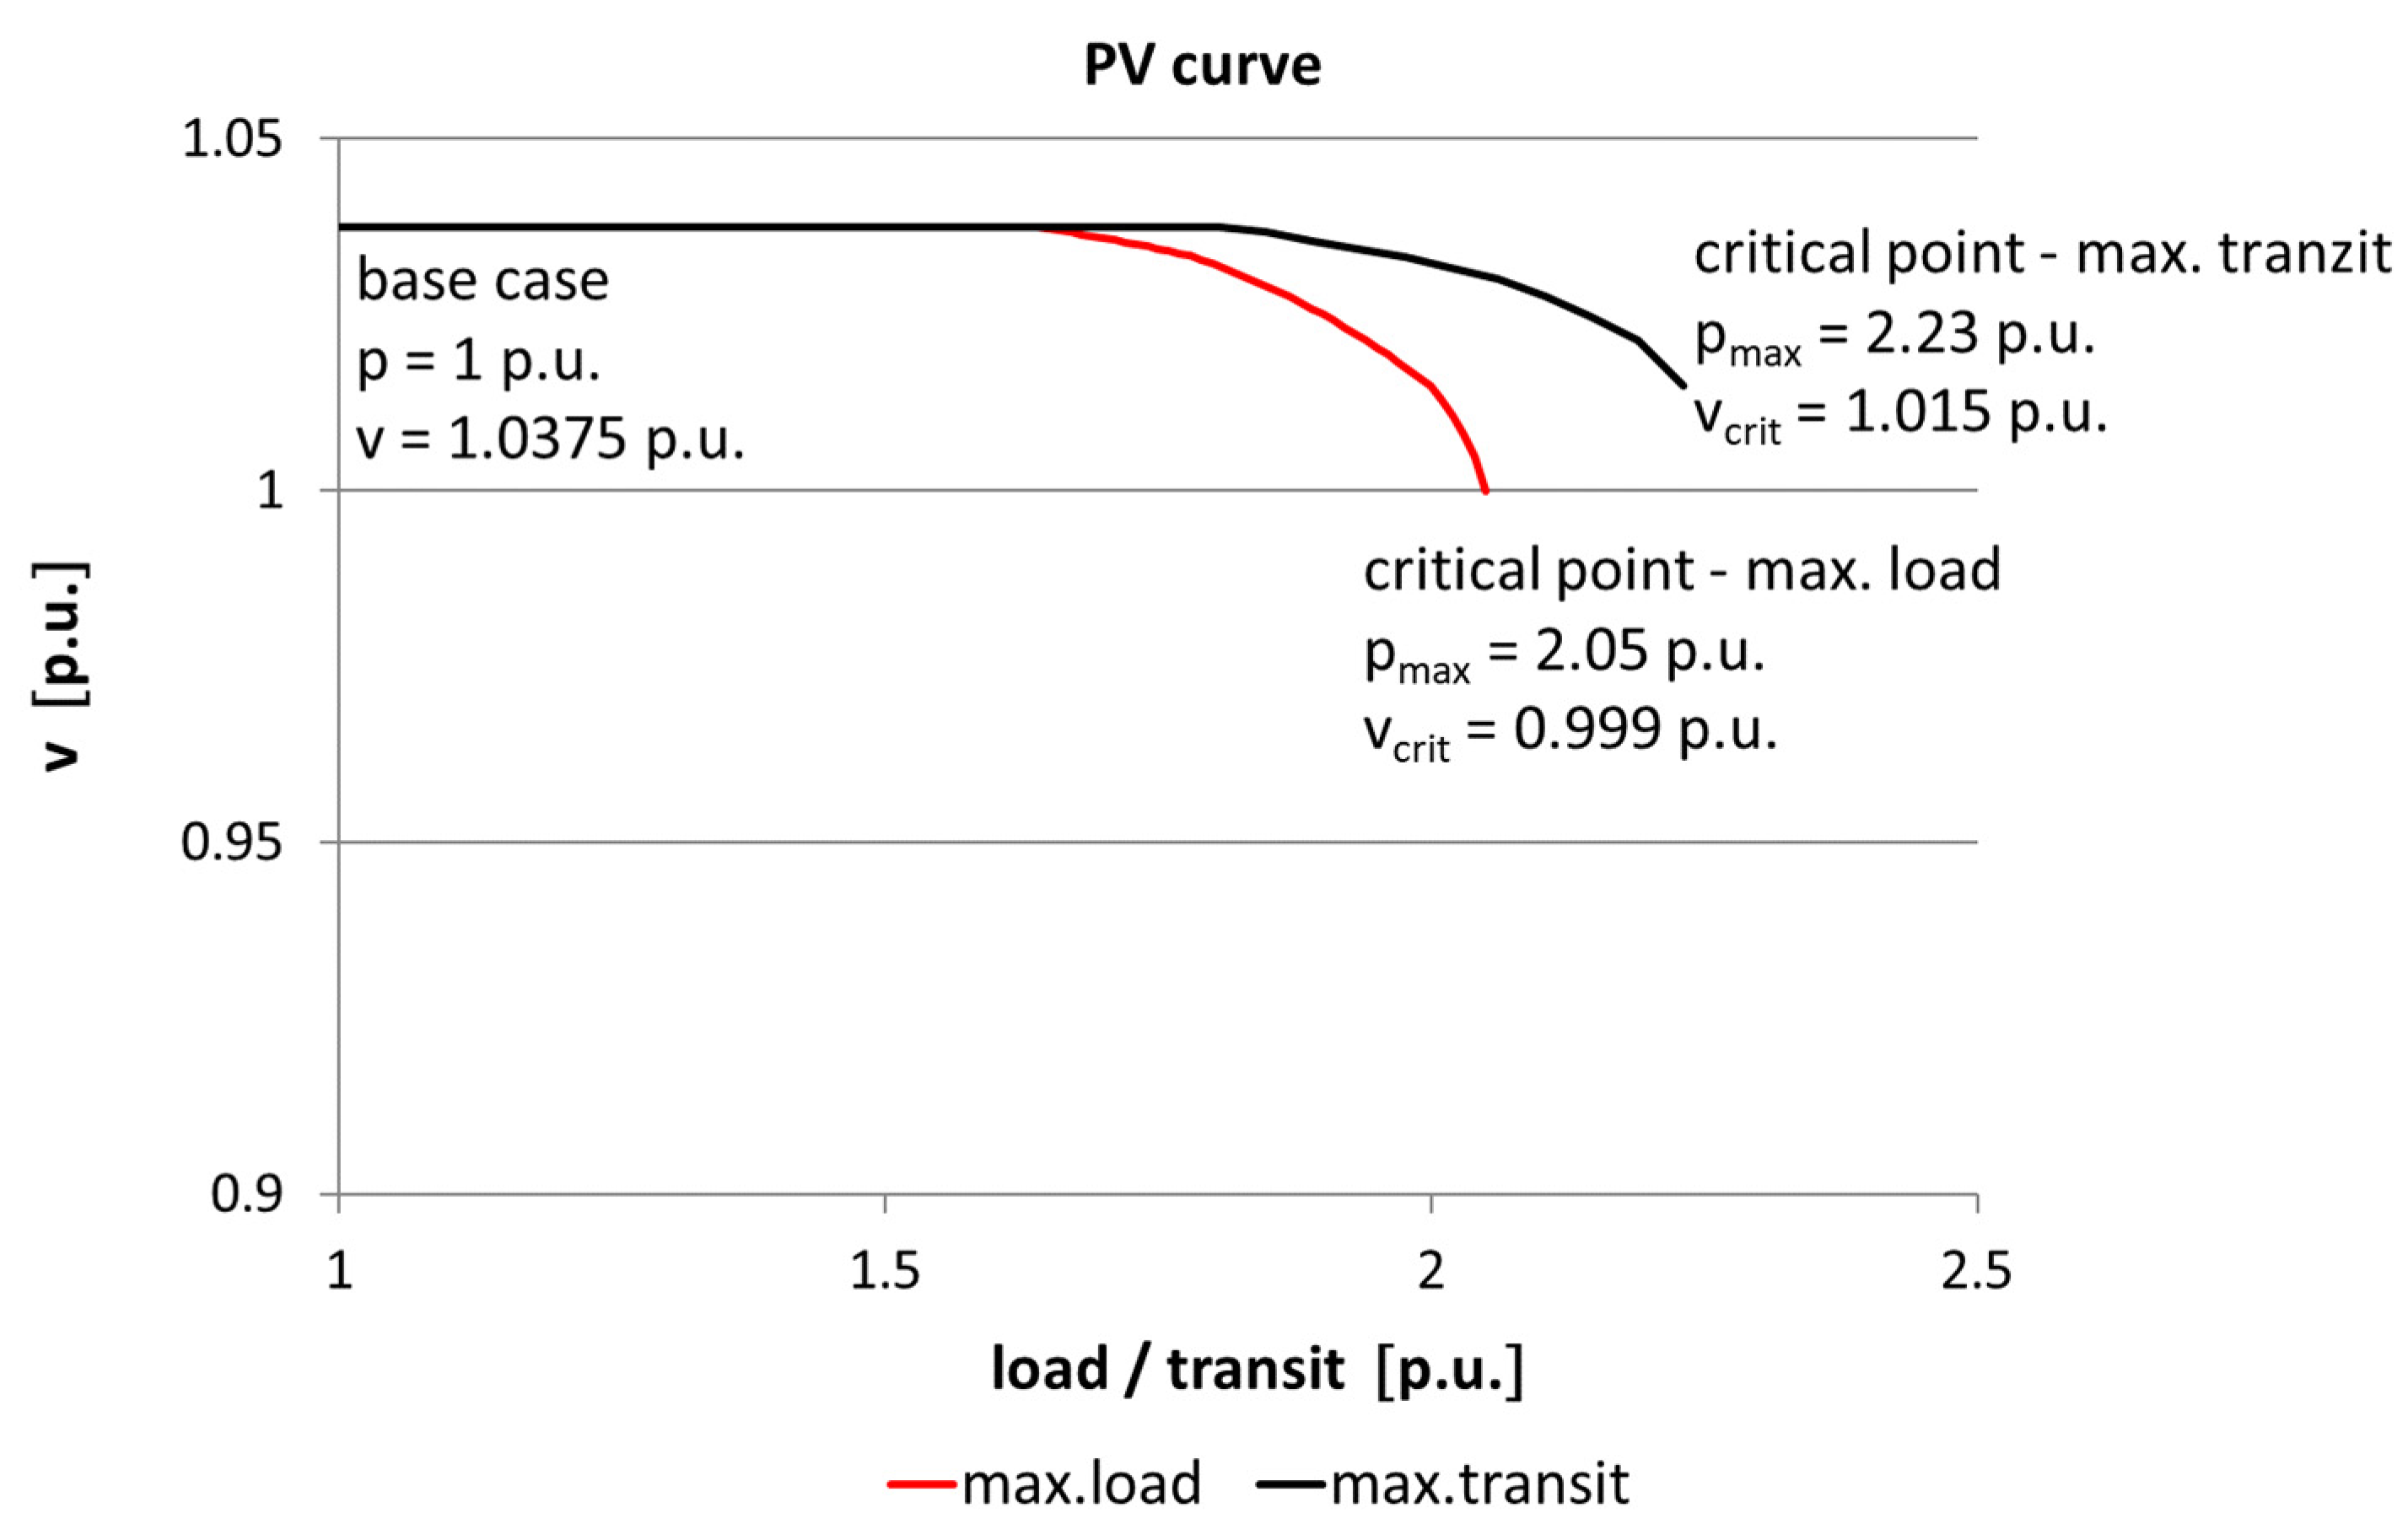
- Estimation of the reserve of the voltage stability, i.e., the “distance” from the critical point on the PV curve (Figure 1).
- (1)
- Increasing the net load in the DS with the incremental step of 0.01 p.u. from the initial state, i.e., step +41 MW in winter and step +31 MW in summer. The power factor (PF) of the loads in the PS was kept constant along with the increasing generation in the surrounding PS.
- (2)
- Increasing the net load in the PSs of Hungary, Italy, and the Balkans with the incremental step of 0.005 p.u. from the initial state, i.e., step +443 MW in winter and step +424 MW in summer. The power factor (PF) of the loads in the PS was kept constant along with the increasing generation in northern and western Europe such that the dominant direction of the power flow through the Slovak TS was maintained.
3. Results

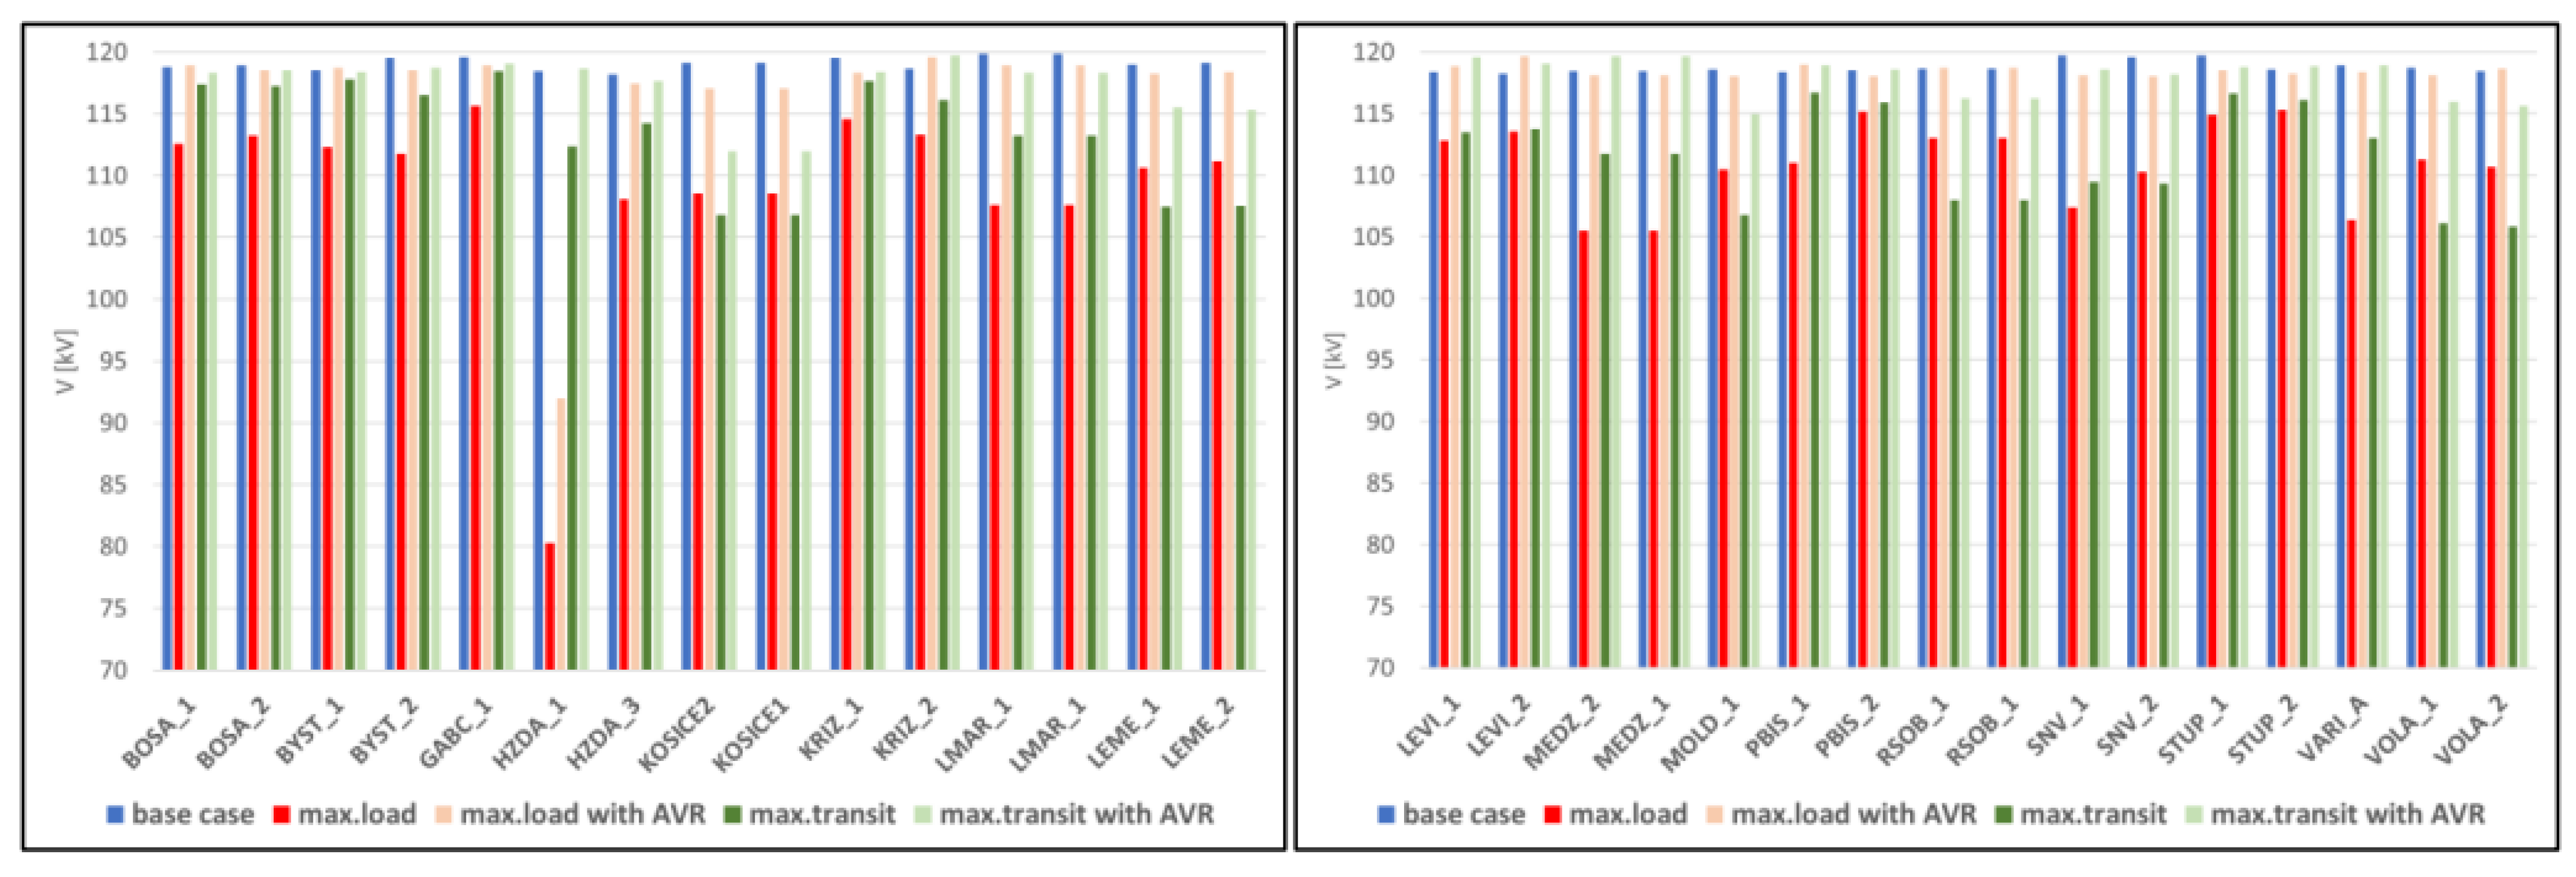
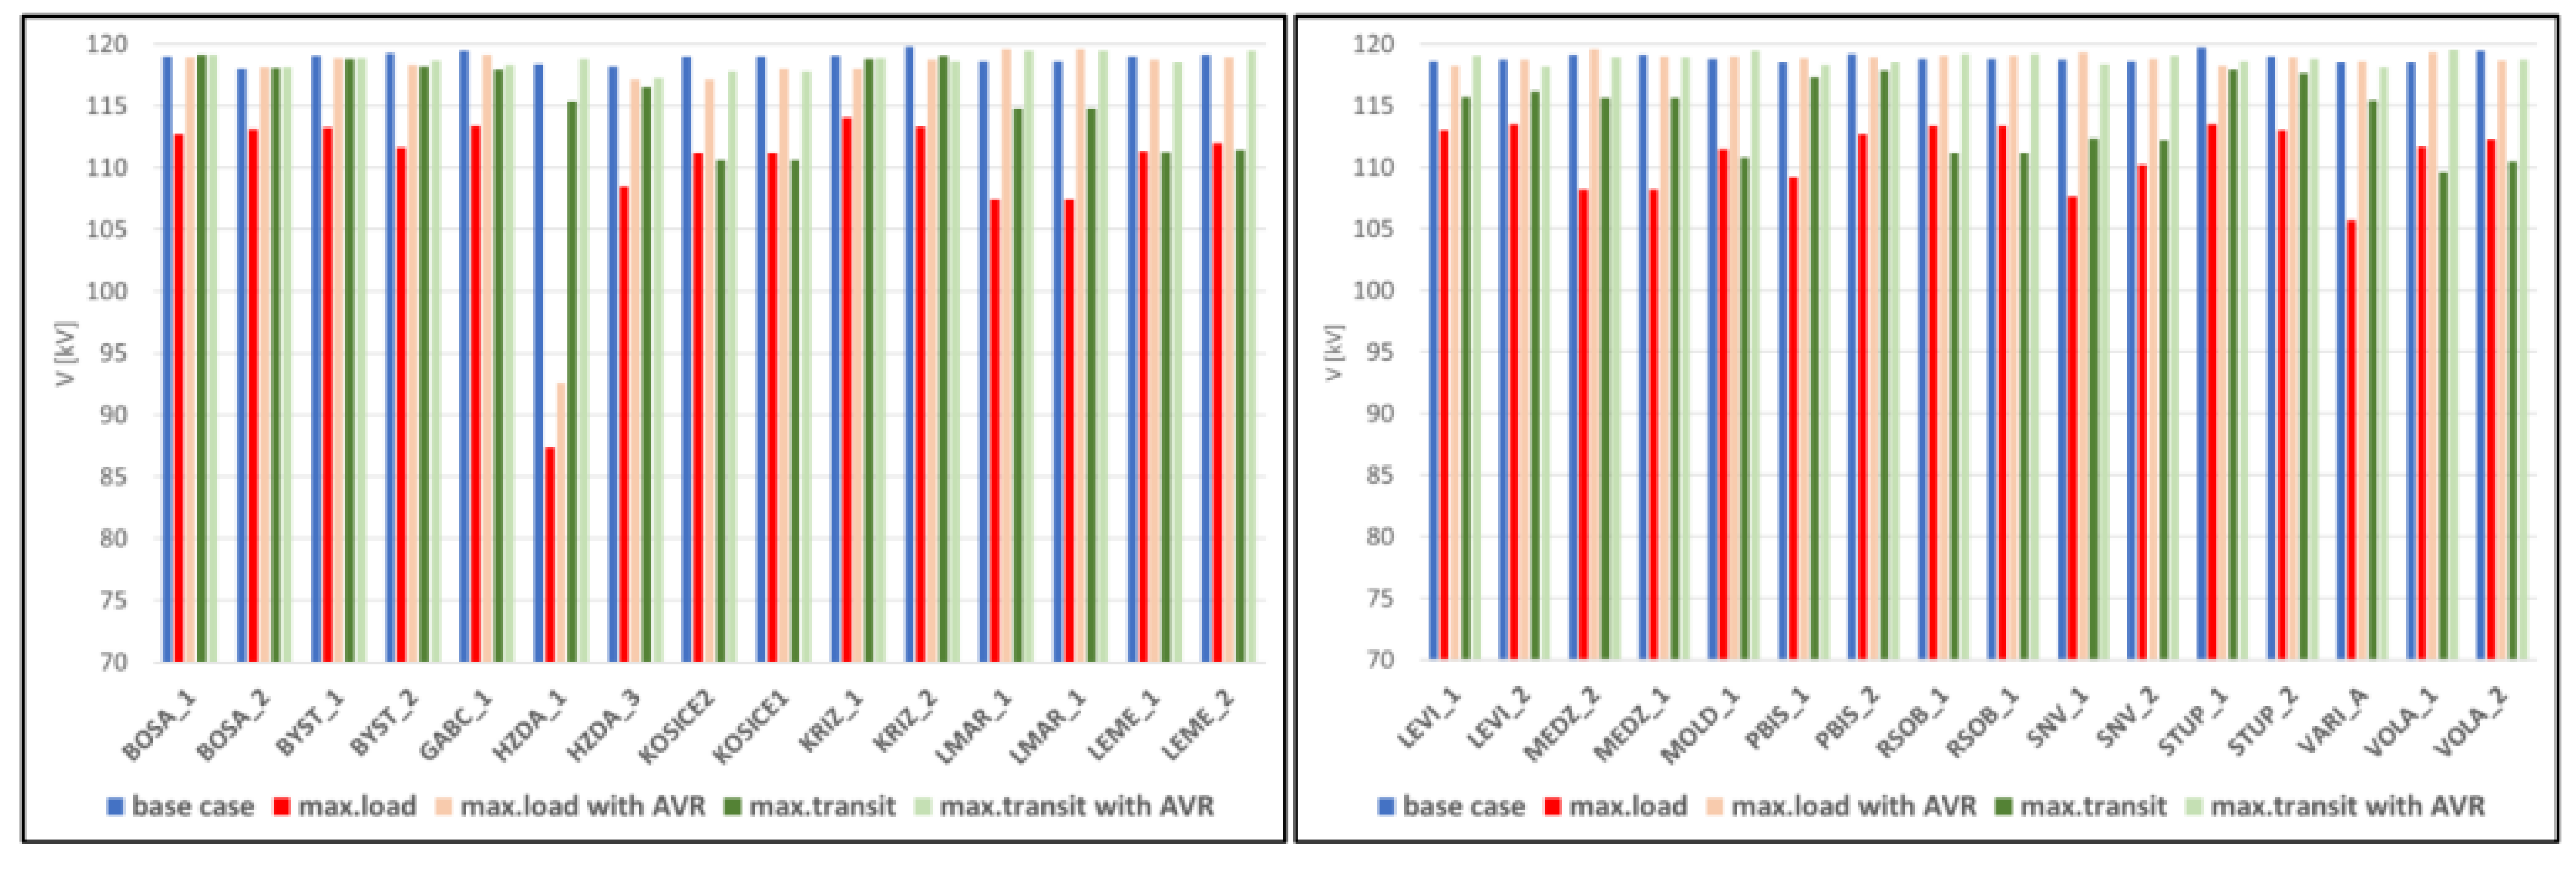
3.1. Results of the Load Flow Calculations for the Worst States
- Some transmission lines were overloaded;
- Some transformers were overloaded;
- Voltages in some PS nodes were outside the permitted tolerance margin;
- The generators worked at the maximum overexcitation state.
- Cross-border power lines were overloaded;
- Voltages in some PS nodes were outside the permitted tolerance margin;
- Generators worked at the maximum overexcitation state.
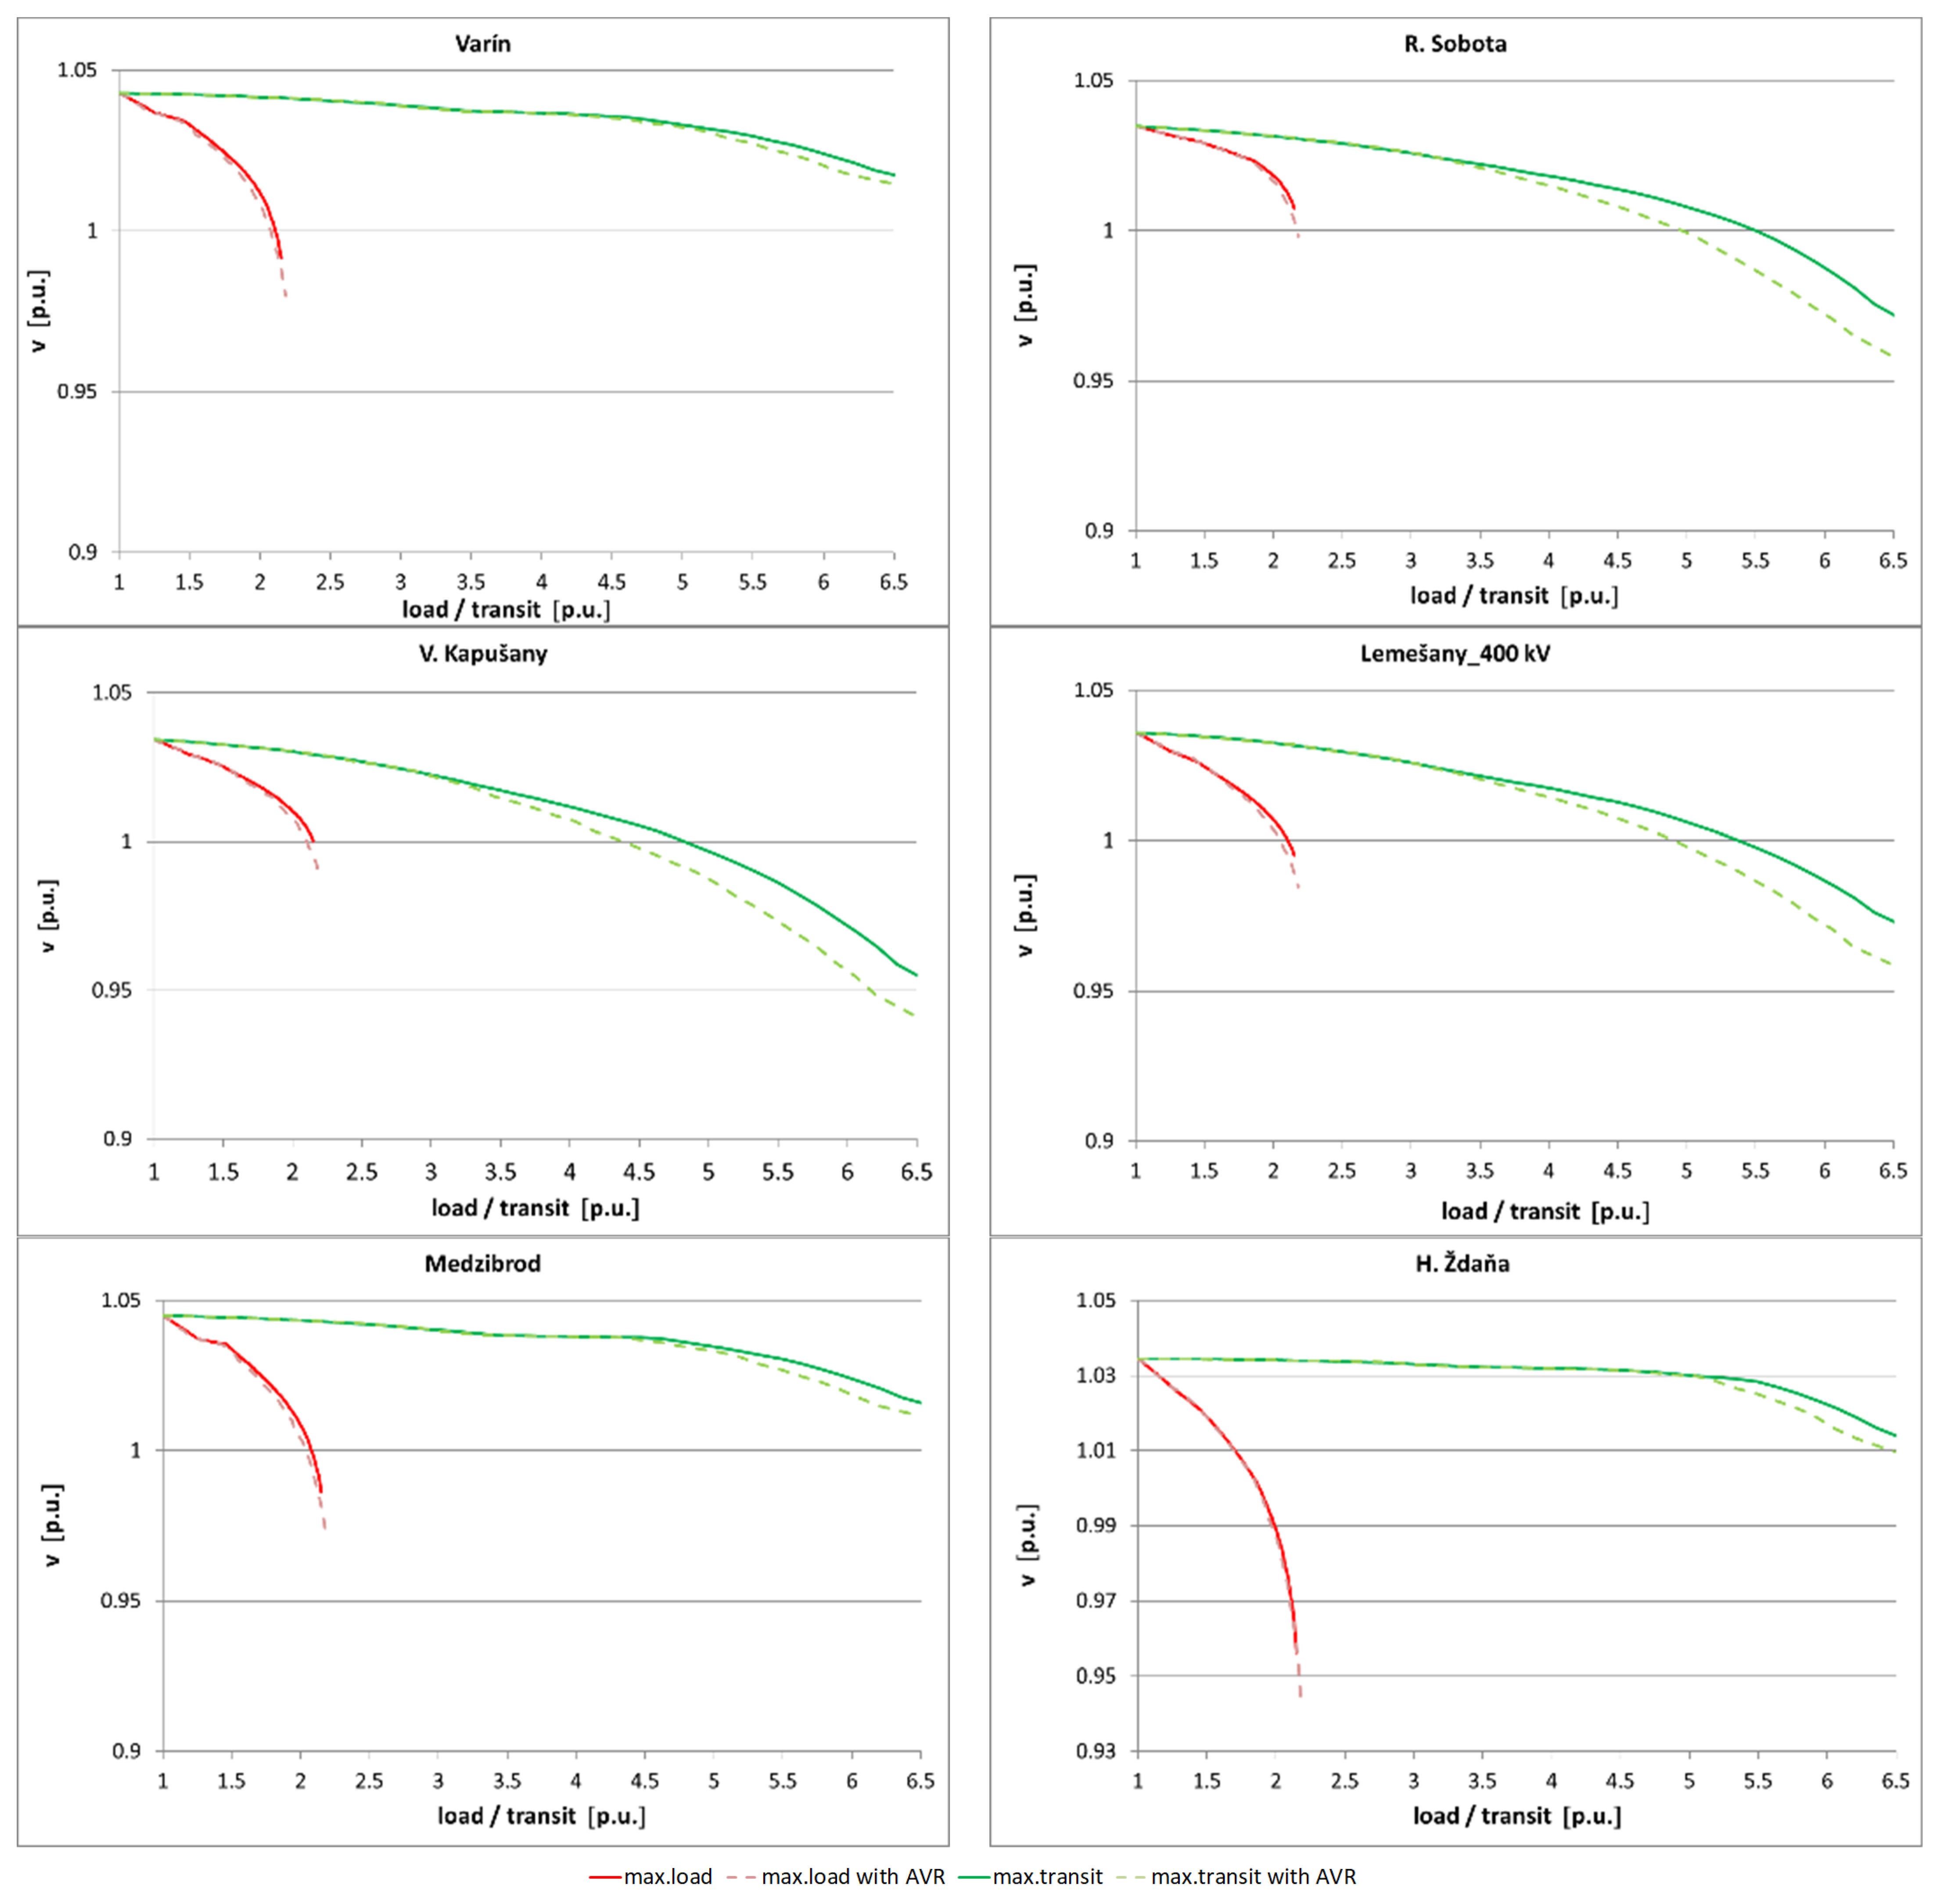
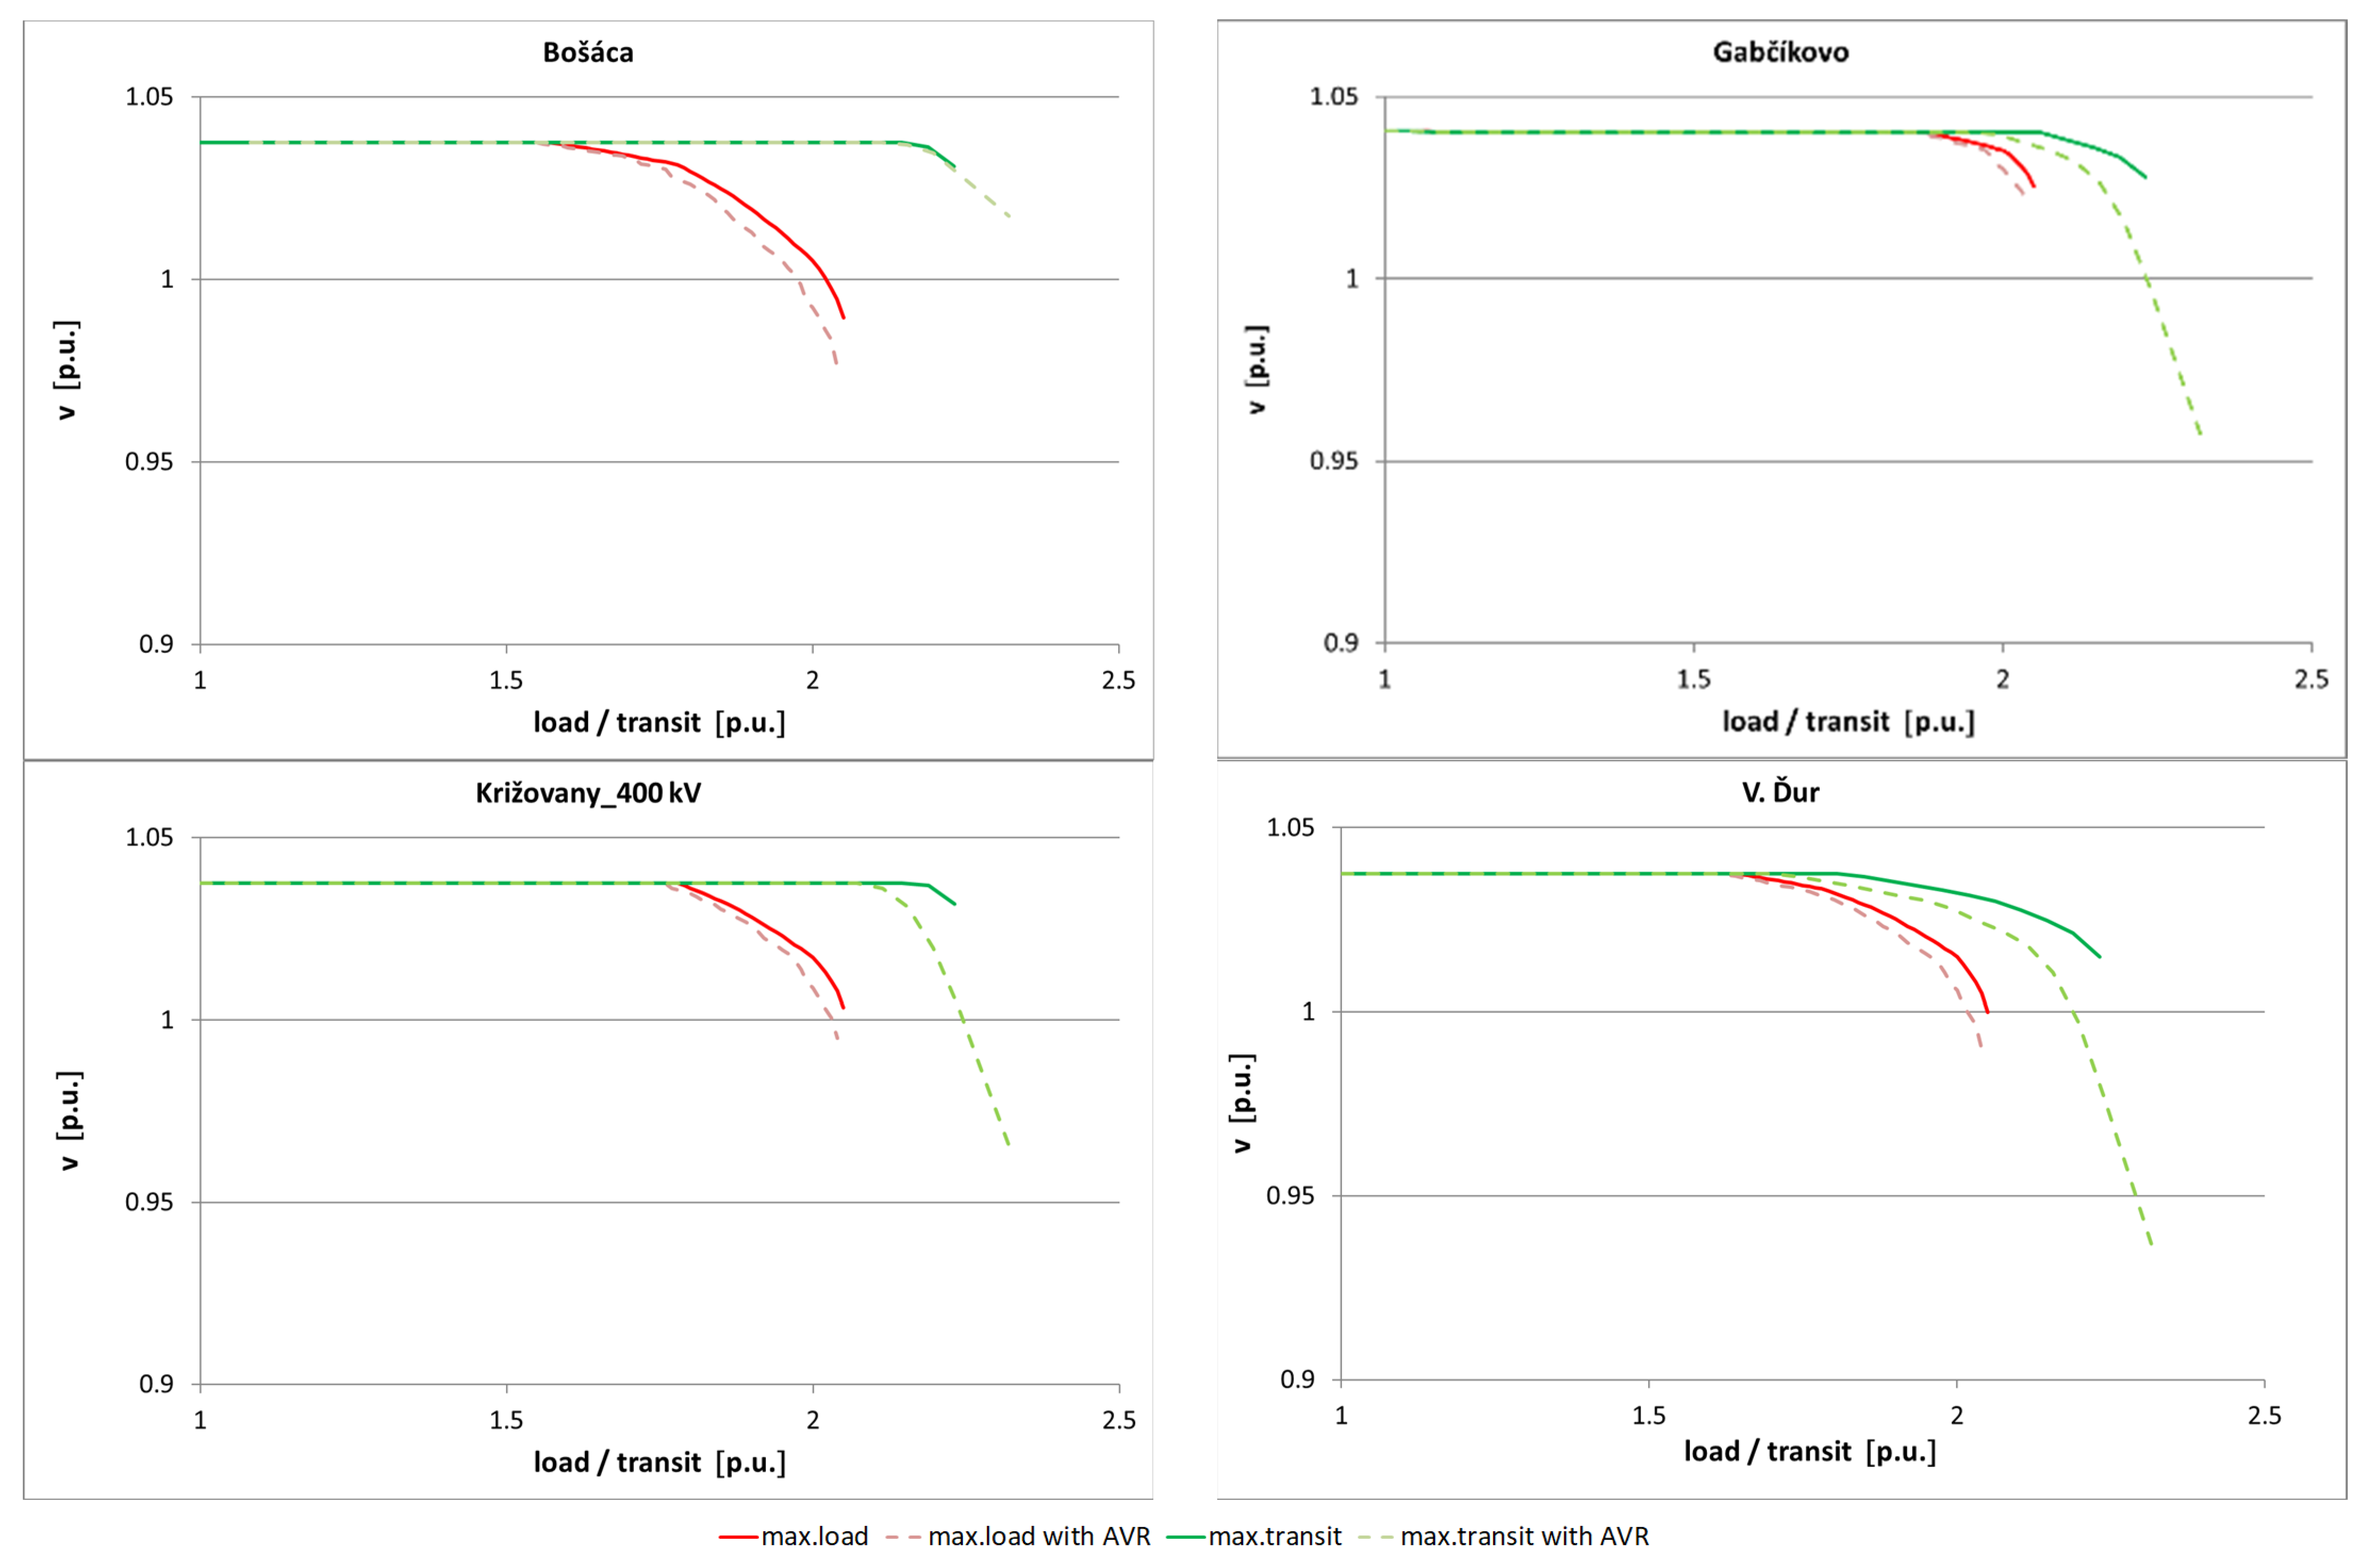
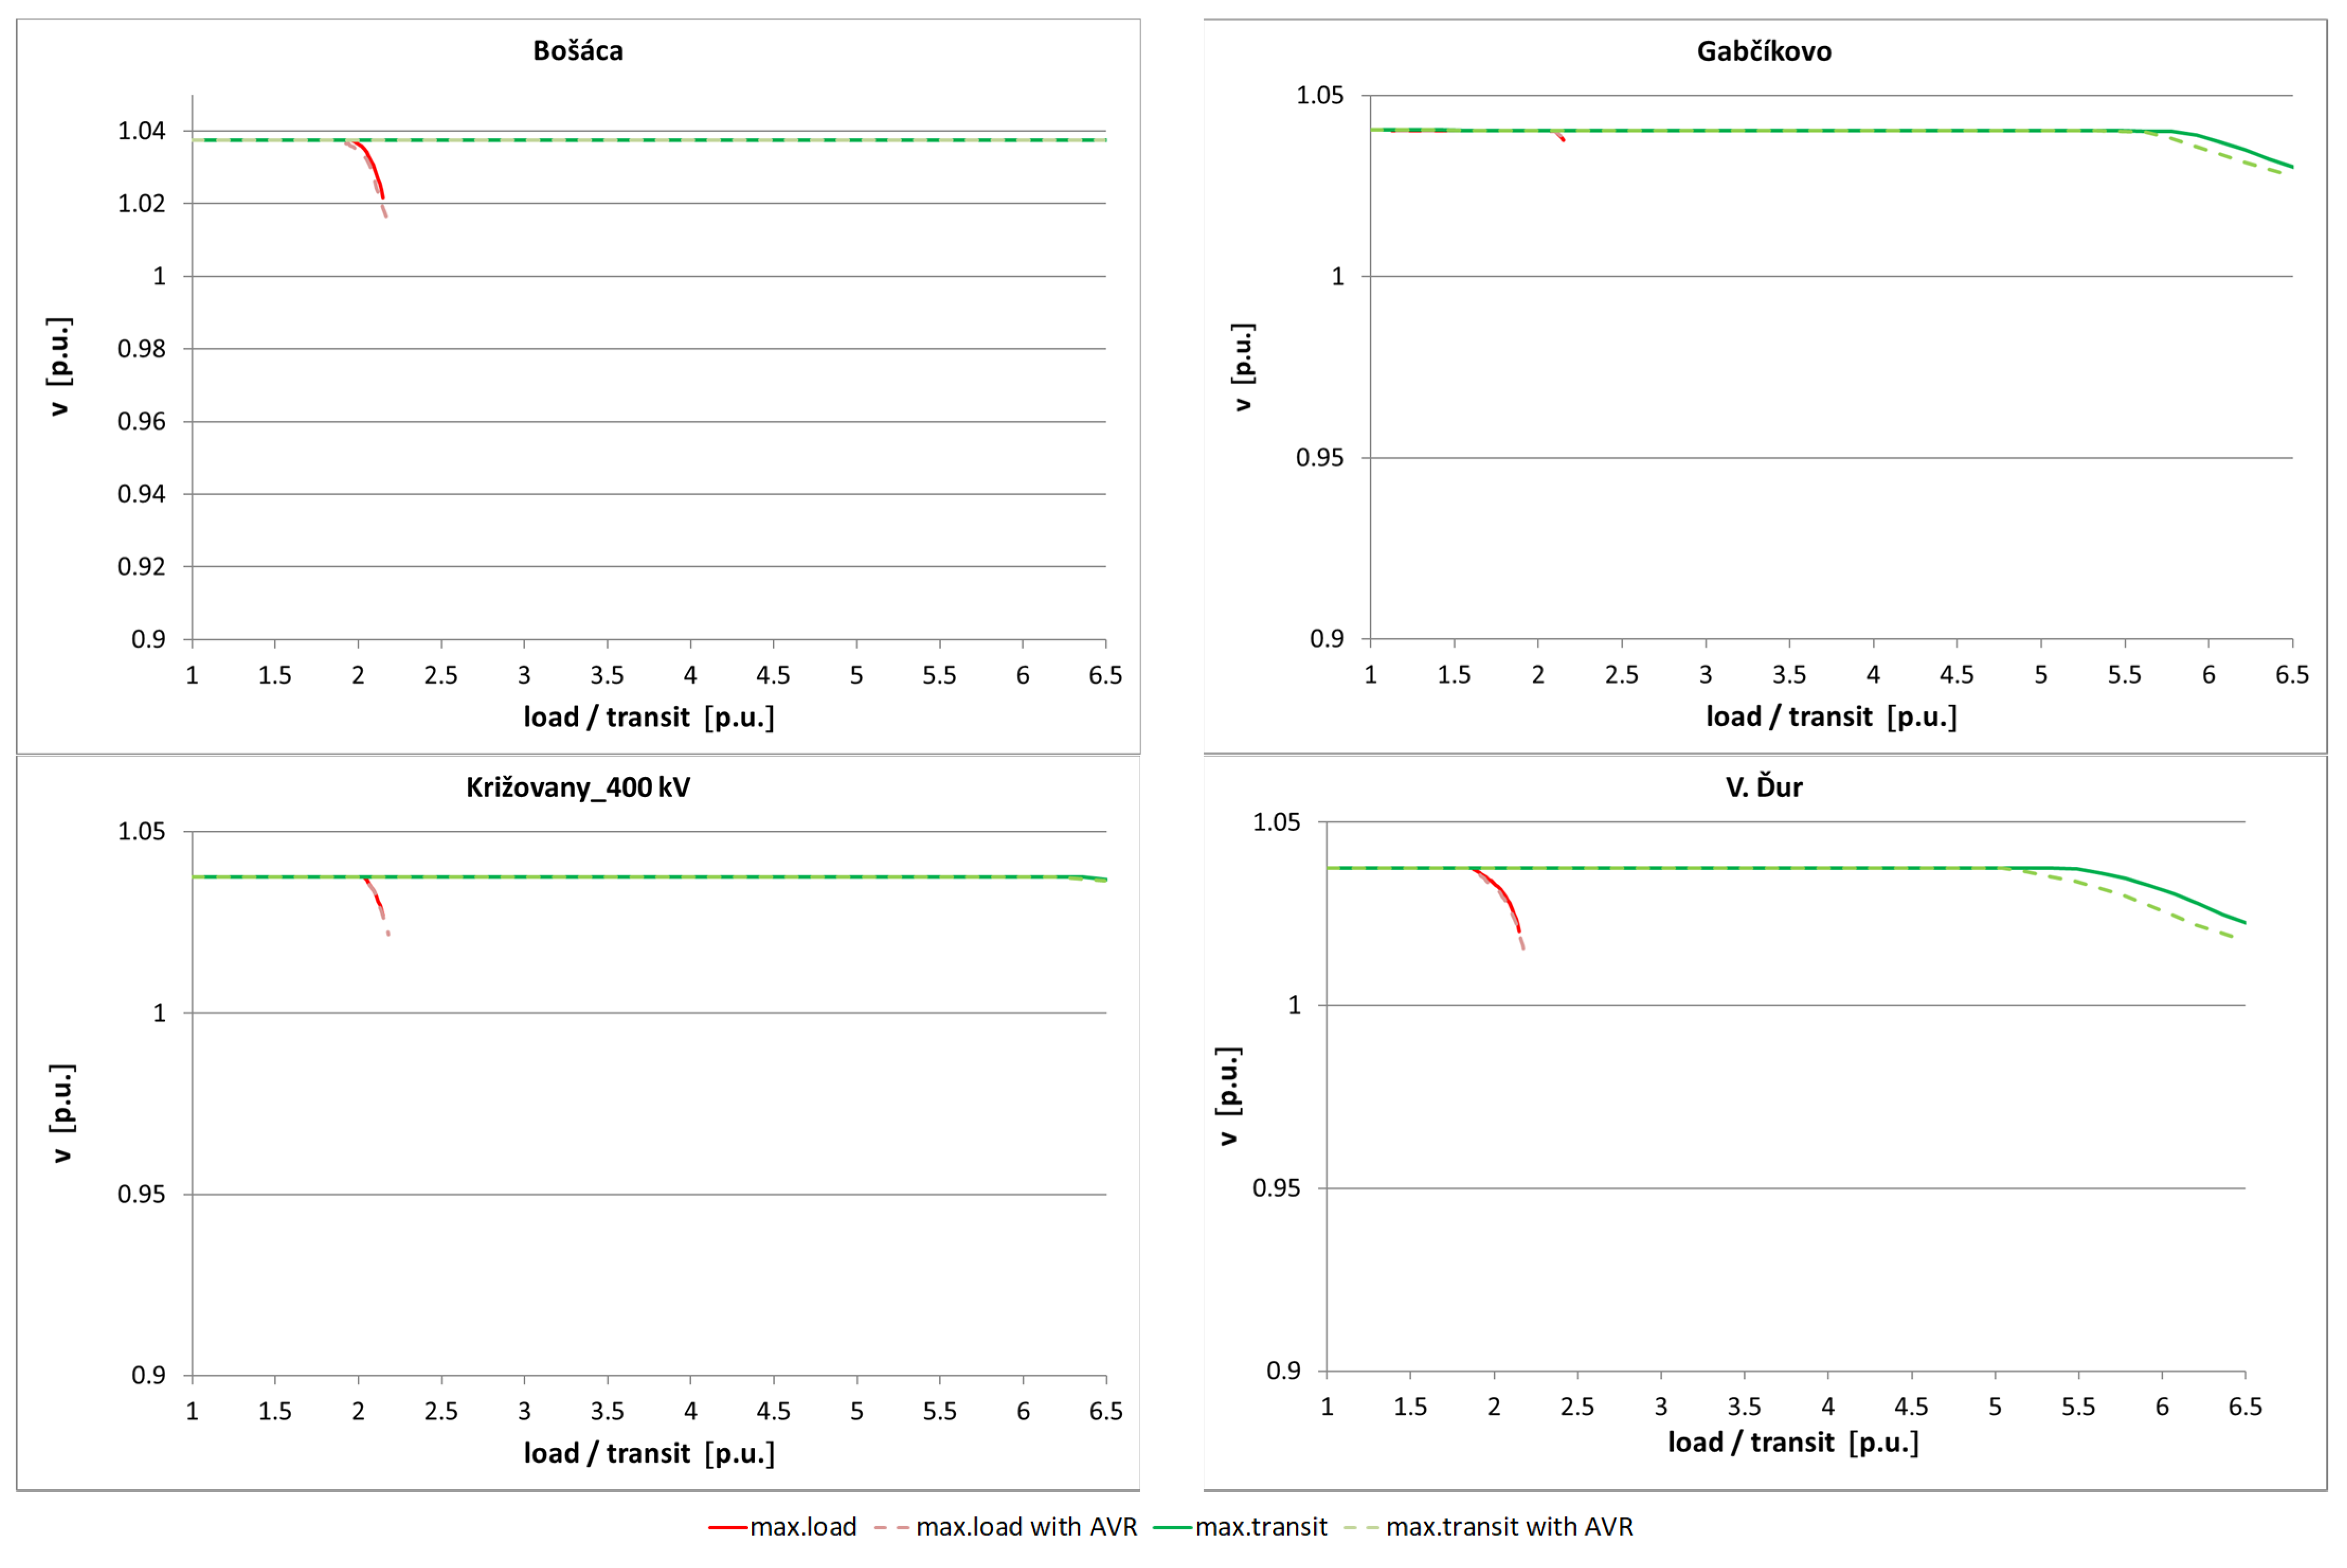
3.2. PV Curves for Selected Nodes of TS of the Slovak Republic
3.2.1. Pilot Nodes
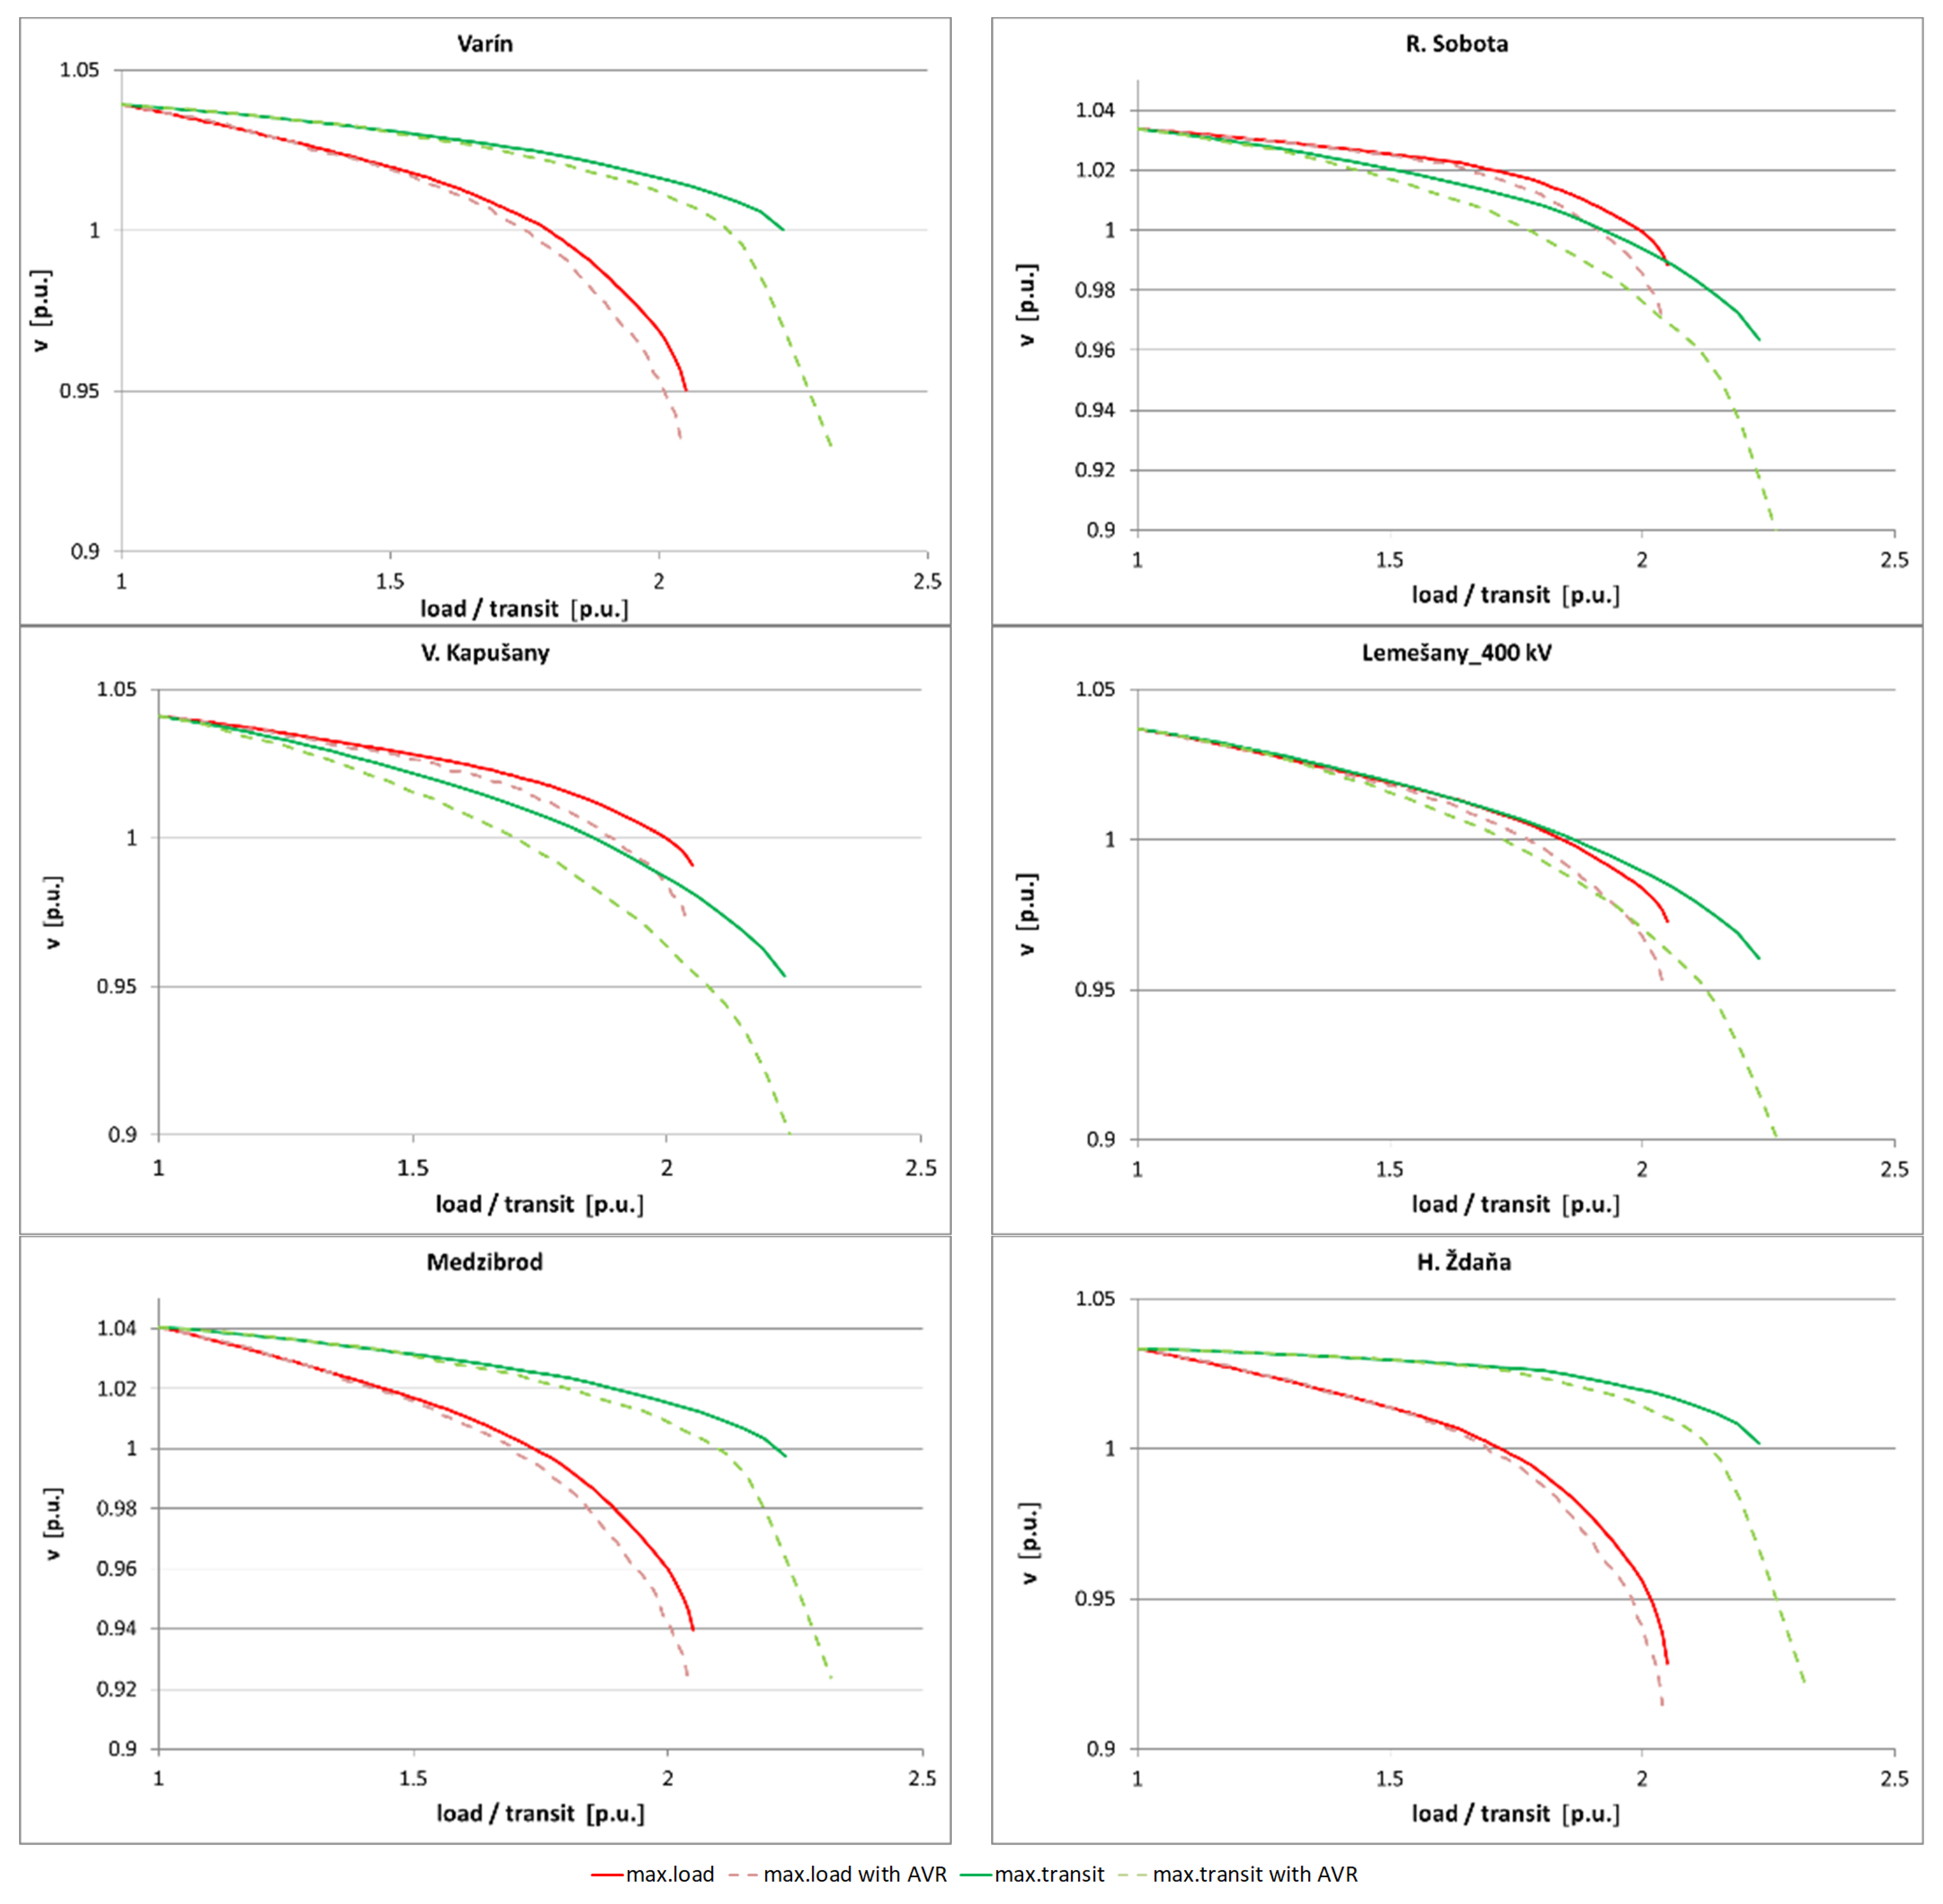
3.2.2. Voltage-Weak Nodes
3.3. Fixing Critical Voltage Values in Nodes of the TS of the Slovak Republic to Block OLTCs on Transformers
- The change—such as a decrease in the required values of regulated voltage on the secondary side of the transformers—in the DS, whereby the OLTC on the transformer will continue operate;
- The setting of a particular tap on the transformer and blocking it in the given position;
- The reverse logic of tap switching, which is the switching of the taps controlled according to the voltage in the TS nodes, not the voltage value in the DS. It is possible to divide the transformers into groups controlled on the basis of voltage in the defined TS nodes. In this case, various types of transformers in the TS must be considered from the point of view of the tap-winding location [25].
4. Conclusions
- Preserve the number of pilot nodes in the PS.
- ○
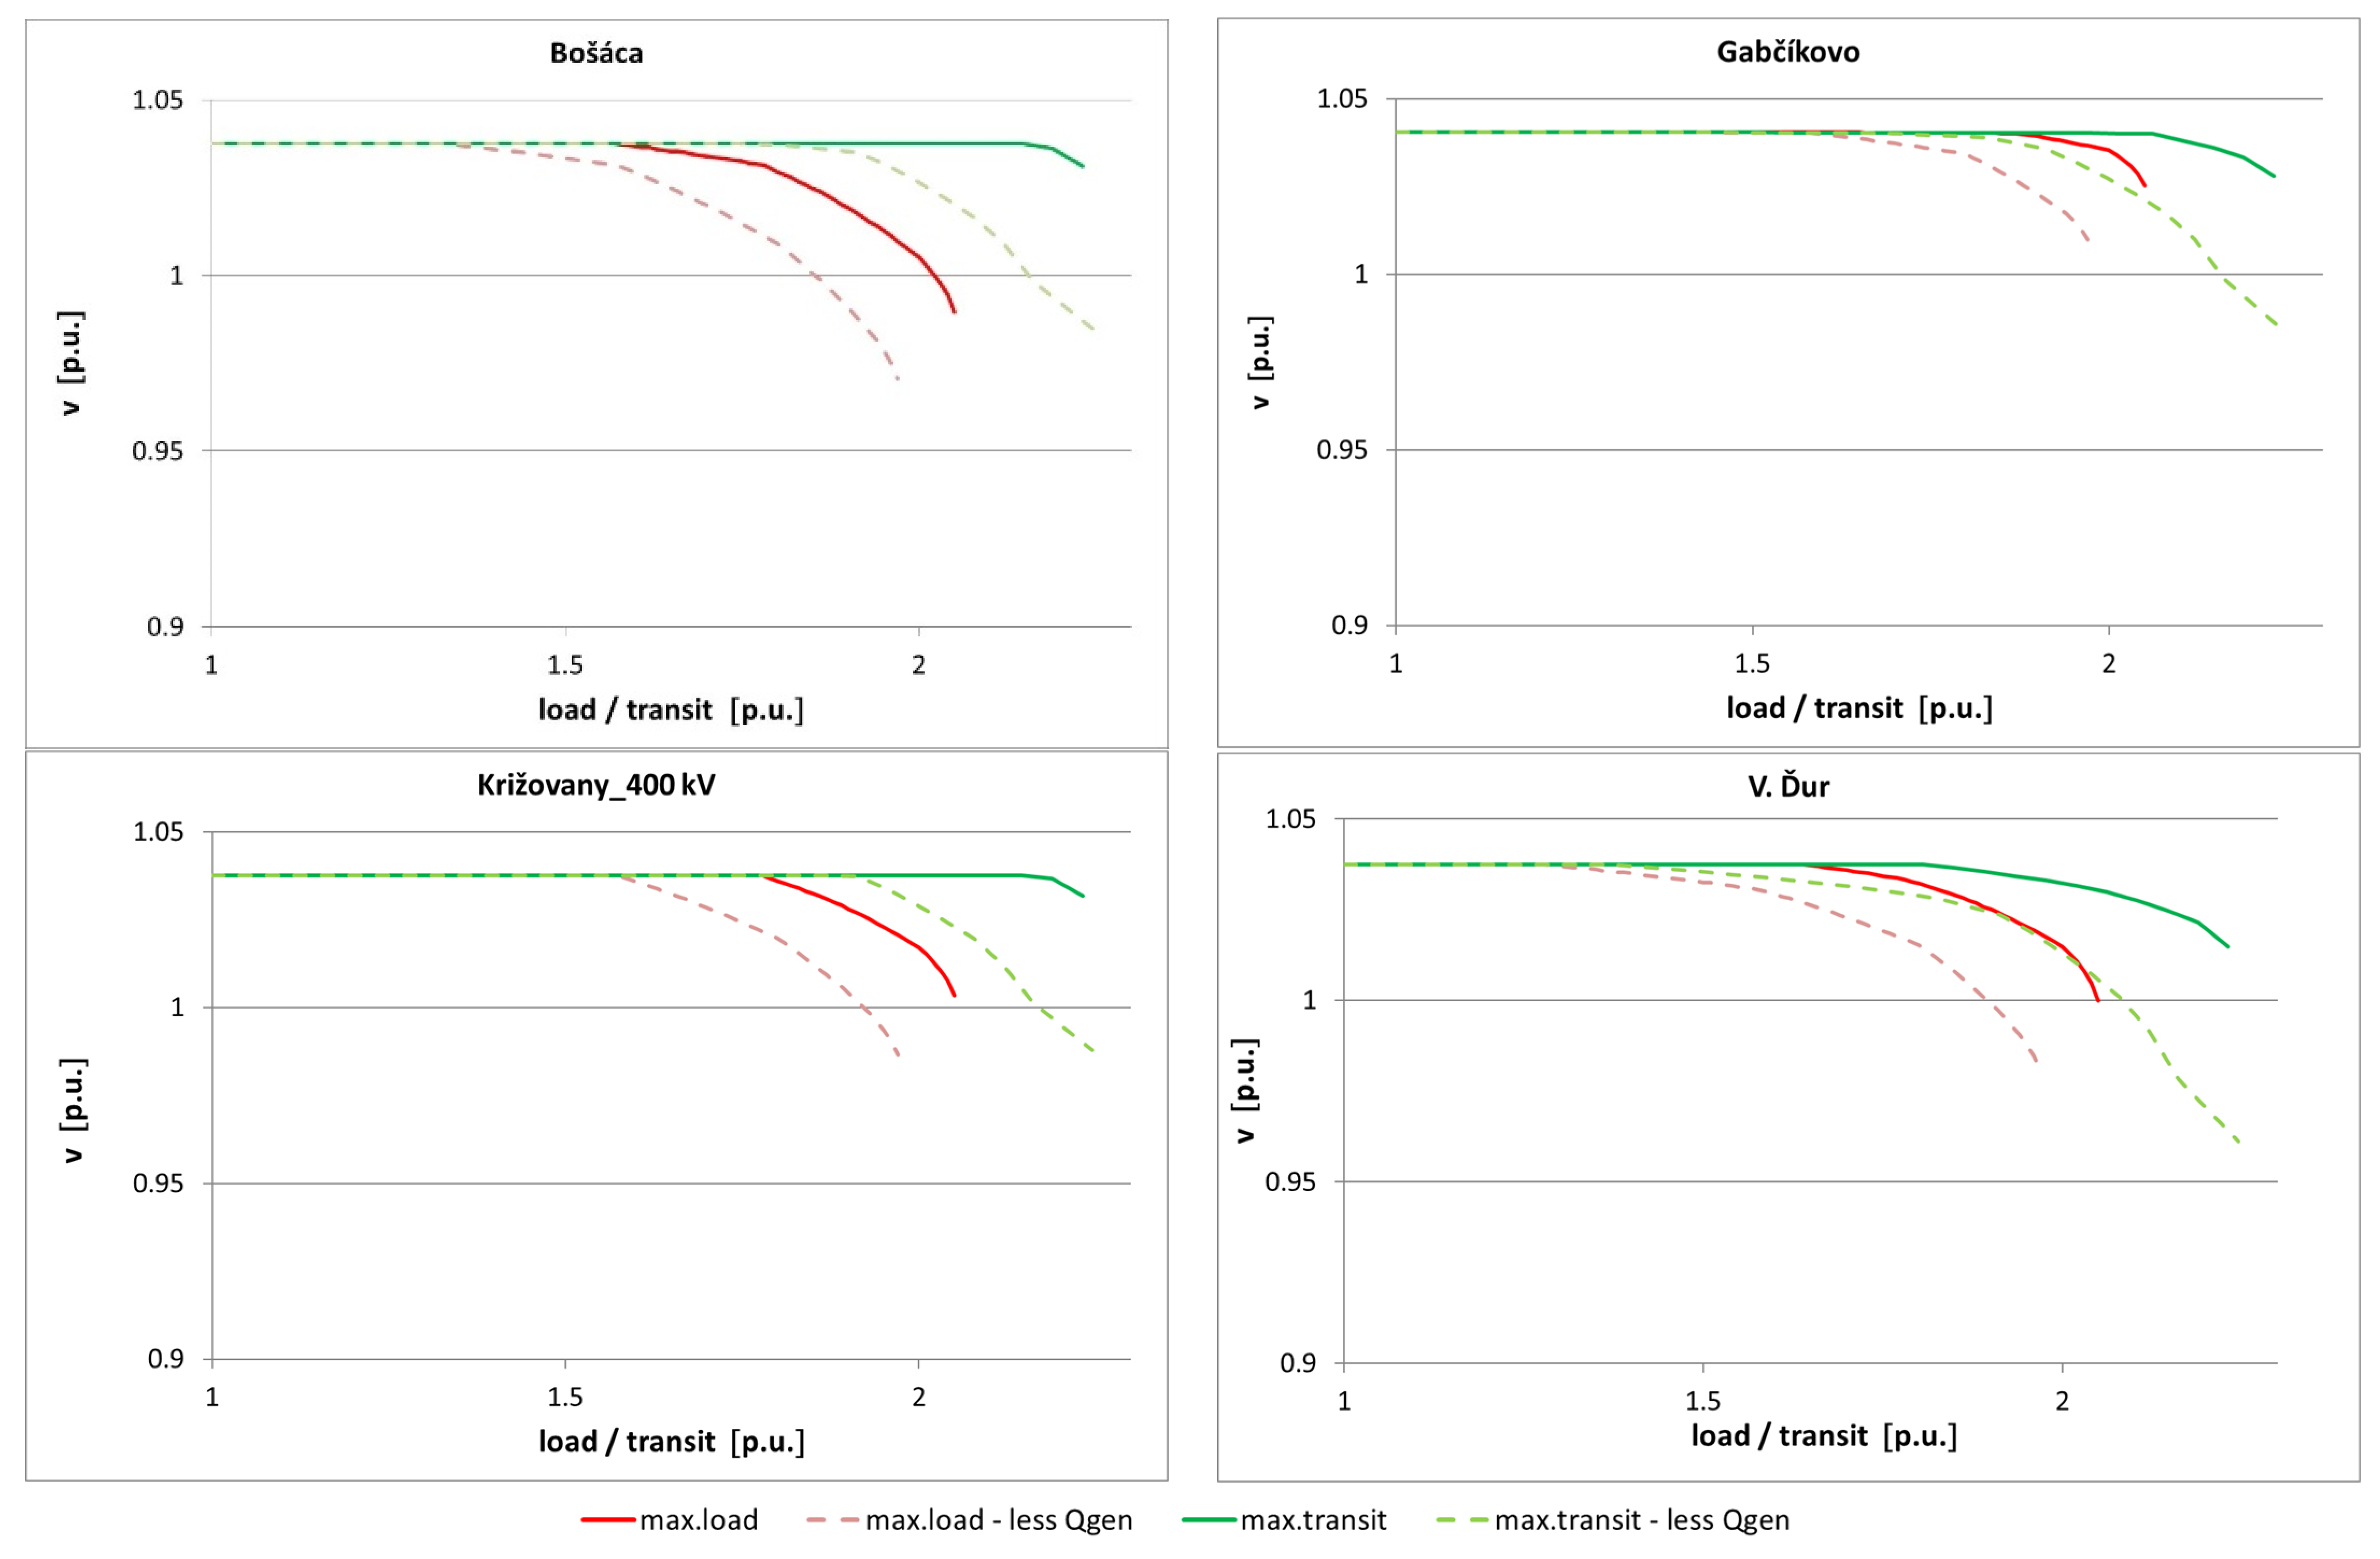
- The positive impact of the pilot nodes on the electrically closest substation was obvious from the shape of the PV curves. Therefore, we recommend that the number of pilot nodes in the Slovak Republic’s TS be preserved.
- Request a sufficient regulation range of the reactive power of the sources connected to the Slovak Republic’s TS.
- ○
- It is necessary to continue ensuring that the regulation range of reactive power for generators remains unchanged and to request that new power sources connected to the TS have a sufficient regulation range of the reactive power in the areas of underexcitation and overexcitation, which means maintaining the existing policy regarding requirements for the PQ diagrams for the existing generators and new power sources.
- Maintain the voltage in the nodes in the Slovak Republic’s PS to be the upper part of the range of the permitted values, i.e., between the 220 kV and 400 kV voltage levels.
- Block the OLTCs on the 400 kV/110 kV transformers and 220 kV/110 kV transformers as a preventive measure in case of a decrease in voltage in the TS nodes.
- ○
- The comparison of states with an AVR on transformers and without an AVR proved the negative impact of voltage control on transformers in states of emergency, such as when there is a high load or a high transit in the voltage in the PS nodes.
- Analysis of the influence of voltage-dependent loads in the PS;
- Comparing and determining the influence of the different types of modeled loads on the PS operation by considering the voltage instability margin;
- Assessment of the significance of topological changes in the PS, i.e., the impact of planned/unplanned power line outages [21];
- Comparing the results with a modal analysis to determine the participation factors for nodes and power lines;
- Analysis of using an online voltage stability assessment [22] and the relevant evaluation of these methods;
- Comparing the results of voltage stability assessments using case studies and online methods.
Author Contributions
Funding
Data Availability Statement
Acknowledgments
Conflicts of Interest
Appendix A. Summary Data for Transformers and Voltages

| TS Node | DS Node | TR | Base Case | Max. Load | Max. Load with AVR | ||||||||
|---|---|---|---|---|---|---|---|---|---|---|---|---|---|
| V1 (kV) | V2 (kV) | Act. Tap | TR Load (%) | V1 (kV) | V2 (kV) | TR Load (%) | V1 (kV) | V2 (kV) | Act. Tap | TR Load (%) | |||
| Bošáca | BOSA_1 | TBO_1 | 415.0 | 118.8 | 4 | 20.6 | 395.8 | 112.6 | 64.6 | 390.5 | 118.9 | −1 | 63.5 |
| BOSA_2 | TBO_2 | 118.9 | 4 | 29.6 | 113.2 | 62.1 | 118.5 | −1 | 62.8 | ||||
| Bystričany | BYST_1 | TBY_1 | 416.8 | 118.5 | 5 | 14.7 | 400.2 | 112.3 | 63.2 | 398.4 | 118.7 | 1 | 62.6 |
| BYST_2 | TBY_2 | 119.5 | 3 | 35.0 | 111.7 | 62.4 | 118.5 | 1 | 55.5 | ||||
| Gabčíkovo | GABC_1 | TGA_1 | 416.2 | 119.6 | 4 | 25.2 | 410.2 | 115.7 | 101.4 | 407.9 | 118.9 | 3 | 100.7 |
| H. Ždaňa | HZDA_1 | THZ_1 | 413.4 | 118.4 | 1 | 87.8 | 371.5 | 80.3 | 267.4 | 365.9 | 92.0 | −8 | 254.0 |
| HZDA_3 | THZ_2 | 118.2 | 6 | 10.5 | 108.1 | 24.2 | 117.4 | 3 | 12.6 | ||||
| Košice | KOSICE2 | TKO_1 | 413.7 | 119.1 | 2 | 36.0 | 387.5 | 108.6 | 80.8 | 379.5 | 117.0 | −6 | 80.5 |
| KOSICE1 | TKO_2 | 119.1 | 2 | 36.0 | 108.6 | 80.8 | 117.0 | −6 | 80.5 | ||||
| Križovany | KRIZ_1 | TKR_1 | 415.0 | 119.5 | 3 | 33.5 | 401.4 | 114.6 | 81.5 | 398.0 | 118.3 | 1 | 79.6 |
| KRIZ_2 | TKR_2 | 118.6 | 4 | 51.4 | 113.3 | 93.6 | 119.6 | 0 | 93.3 | ||||
| L. Mara | LMAR_1 | TLM_1 | 416.8 | 119.9 | 3 | 27.9 | 378.8 | 107.6 | 83.0 | 371.9 | 118.9 | −6 | 82.6 |
| LMAR_1 | TLM_2 | 119.9 | 3 | 27.6 | 107.6 | 82.1 | 118.9 | −6 | 81.8 | ||||
| Lemešany | LEME_1 | TLE_1 | 414.8 | 119.0 | 1 | 40.1 | 389.1 | 110.6 | 69.7 | 381.1 | 118.2 | −5 | 67.2 |
| LEME_2 | TLE_2 | 119.1 | 1 | 36.5 | 111.2 | 59.9 | 118.4 | −5 | 59.3 | ||||
| Levice | LEVI_1 | TLV_1 | 414.7 | 118.4 | 4 | 20.3 | 399.7 | 112.8 | 57.3 | 395.5 | 118.9 | 0 | 56.7 |
| LEVI_2 | TLV_2 | 118.2 | 4 | 13.9 | 113.5 | 51.6 | 119.7 | 0 | 51.0 | ||||
| Medzibrod | MEDZ_2 | TME_1 | 416.2 | 118.4 | 4 | 28.2 | 375.8 | 105.5 | 60.6 | 369.1 | 118.1 | −5 | 59.9 |
| MEDZ_1 | TME_2 | 118.4 | 4 | 28.5 | 105.5 | 61.2 | 118.1 | −5 | 60.5 | ||||
| Moldava | MOLD_1 | TMO_1 | 414.2 | 118.6 | 2 | 29.2 | 389.1 | 110.5 | 62.2 | 381.1 | 118.0 | −4 | 62.0 |
| P. Biskupice | PBIS_1 | TPB_1 | 415.3 | 118.4 | 3 | 77.1 | 403.1 | 111.0 | 176.9 | 399.7 | 119.0 | −7 | 185.2 |
| PBIS_2 | TPB_2 | 118.5 | 5 | 25.3 | 115.1 | 68.6 | 118.0 | 3 | 67.9 | ||||
| R. Sobota | RSOB_1 | TRS_1 | 413.5 | 118.6 | 3 | 24.6 | 395.4 | 113.0 | 51.1 | 388.2 | 118.7 | −2 | 51.6 |
| RSOB_1 | TRS_2 | 118.6 | 4 | 23.5 | 113.0 | 48.1 | 118.7 | −1 | 47.4 | ||||
| Sp. N. Ves | SNV_1 | TSN_1 | 415.9 | 119.7 | 4 | 49.6 | 383.1 | 107.3 | 109.5 | 375.5 | 118.1 | −6 | 108.3 |
| SNV_2 | TSN_2 | 119.6 | 4 | 32.8 | 110.2 | 51.7 | 118.1 | −3 | 52.3 | ||||
| Stupava | STUP_1 | TST_1 | 414.2 | 119.7 | 2 | 41.4 | 401.1 | 114.9 | 83.5 | 398.8 | 118.5 | 0 | 75.9 |
| STUP_2 | TST_2 | 118.6 | 3 | 27.9 | 115.3 | 72.6 | 118.2 | 1 | 72.7 | ||||
| Varín | VARI_A | TVA_1 | 415.7 | 118.9 | 4 | 37.9 | 380.2 | 106.4 | 99.3 | 374.2 | 118.4 | −6 | 95.6 |
| Voľa | VOLA_1 | TVO_1 | 416.6 | 118.7 | 4 | 13.4 | 392.7 | 111.3 | 41.0 | 384.9 | 118.1 | −1 | 40.1 |
| VOLA_2 | TVO_2 | 118.4 | 4 | 11.9 | 110.7 | 43.5 | 118.6 | −2 | 43.4 | ||||
| TS Node | DS Node | TR | Base Case | Max. Transit | Max. Transit with AVR | ||||||
|---|---|---|---|---|---|---|---|---|---|---|---|
| V1 (kV) | V2 (kV) | Act. Tap | TR Load (%) | V1 (kV) | V2 (kV) | V1 (kV) | V2 (kV) | Act. Tap | |||
| Bošáca | BOSA_1 | TBO_1 | 415.0 | 118.8 | 4 | 20.6 | 408.1 | 117.4 | 385.1 | 118.3 | −1 |
| BOSA_2 | TBO_2 | 118.9 | 4 | 29.6 | 117.2 | 118.5 | −1 | ||||
| Bystričany | BYST_1 | TBY_1 | 416.8 | 118.5 | 5 | 14.7 | 410.6 | 117.8 | 388.3 | 118.4 | 1 |
| BYST_2 | TBY_2 | 119.5 | 3 | 35.0 | 116.5 | 118.7 | −1 | ||||
| Gabčíkovo | GABC_1 | TGA_1 | 416.2 | 119.6 | 4 | 25.2 | 409.2 | 118.4 | 382.9 | 119.1 | −2 |
| H. Ždaňa | HZDA_1 | THZ_1 | 413.4 | 118.4 | 1 | 87.8 | 395.3 | 112.4 | 369.0 | 118.7 | −8 |
| HZDA_3 | THZ_2 | 118.2 | 6 | 10.5 | 114.3 | 117.6 | −4 | ||||
| Košice | KOSICE2 | TKO_1 | 413.7 | 119.1 | 2 | 36.0 | 373.0 | 106.8 | 347.8 | 111.9 | −8 |
| KOSICE1 | TKO_2 | 119.1 | 2 | 36.0 | 106.8 | 111.9 | −8 | ||||
| Križovany | KRIZ_1 | TKR_1 | 415.0 | 119.5 | 3 | 33.5 | 408.9 | 117.7 | 386.0 | 118.4 | −1 |
| KRIZ_2 | TKR_2 | 118.6 | 4 | 51.4 | 116.1 | 119.7 | −1 | ||||
| L. Mara | LMAR_1 | TLM_1 | 416.8 | 119.9 | 3 | 27.9 | 392.1 | 113.2 | 368.8 | 118.3 | −4 |
| LMAR_1 | TLM_2 | 119.9 | 3 | 27.6 | 113.2 | 118.3 | −4 | ||||
| Lemešany | LEME_1 | TLE_1 | 414.8 | 119.0 | 1 | 40.1 | 375.1 | 107.5 | 350.8 | 115.5 | −8 |
| LEME_2 | TLE_2 | 119.1 | 1 | 36.5 | 107.5 | 115.3 | −8 | ||||
| Levice | LEVI_1 | TLV_1 | 414.7 | 118.4 | 4 | 20.3 | 397.6 | 113.5 | 369.6 | 119.6 | −5 |
| LEVI_2 | TLV_2 | 118.2 | 4 | 13.9 | 113.7 | 119.1 | −4 | ||||
| Medzibrod | MEDZ_2 | TME_1 | 416.2 | 118.4 | 4 | 28.2 | 393.0 | 111.7 | 369.6 | 119.7 | −5 |
| MEDZ_1 | TME_2 | 118.4 | 4 | 28.5 | 111.7 | 119.7 | −5 | ||||
| Moldava | MOLD_1 | TMO_1 | 414.2 | 118.6 | 2 | 29.2 | 373.4 | 106.7 | 347.9 | 114.9 | −8 |
| P. Biskupice | PBIS_1 | TPB_1 | 415.3 | 118.4 | 3 | 77.1 | 406.9 | 116.7 | 383.3 | 118.9 | −5 |
| PBIS_2 | TPB_2 | 118.5 | 5 | 25.3 | 115.9 | 118.6 | 0 | ||||
| R. Sobota | RSOB_1 | TRS_1 | 413.5 | 118.6 | 3 | 24.6 | 376.5 | 108.0 | 347.7 | 116.2 | −8 |
| RSOB_1 | TRS_2 | 118.6 | 4 | 23.5 | 108.0 | 116.2 | −9 | ||||
| Sp. N. Ves | SNV_1 | TSN_1 | 415.9 | 119.7 | 4 | 49.6 | 381.4 | 109.5 | 357.0 | 118.6 | −9 |
| SNV_2 | TSN_2 | 119.6 | 4 | 32.8 | 109.3 | 118.2 | −8 | ||||
| Stupava | STUP_1 | TST_1 | 414.2 | 119.7 | 2 | 41.4 | 404.6 | 116.6 | 384.2 | 118.7 | −3 |
| STUP_2 | TST_2 | 118.6 | 3 | 27.9 | 116.1 | 118.8 | −2 | ||||
| Varín | VARI_A | TVA_1 | 415.7 | 118.9 | 4 | 37.9 | 394.6 | 113.0 | 373.2 | 118.9 | −5 |
| Voľa | VOLA_1 | TVO_1 | 416.6 | 118.7 | 4 | 13.4 | 372.6 | 106.1 | 345.6 | 116.0 | −8 |
| VOLA_2 | TVO_2 | 118.4 | 4 | 11.9 | 105.8 | 115.6 | −8 | ||||
| TS Node | DS Node | TR | Base Case | Max. Load | Max. Load with AVR | ||||||||
|---|---|---|---|---|---|---|---|---|---|---|---|---|---|
| V1 (kV) | V2 (kV) | Act. Tap | TR Load (%) | V1 (kV) | V2 (kV) | TR Load (%) | V1 (kV) | V2 (kV) | Act. Tap | TR Load (%) | |||
| Bošáca | BOSA_1 | TBO_1 | 415.0 | 119.0 | 4 | 17.9 | 408.6 | 112.7 | 76.7 | 405.4 | 118.9 | 2 | 56.8 |
| BOSA_2 | TBO_2 | 118.0 | 5 | 16.9 | 113.1 | 55.6 | 118.1 | 3 | 41 | ||||
| Bystričany | BYST_1 | TBY_1 | 416.2 | 119.0 | 4 | 13.2 | 409.1 | 113.2 | 91.8 | 408.1 | 118.9 | 2 | 64.1 |
| BYST_2 | TBY_2 | 119.3 | 3 | 31.1 | 111.6 | 69.2 | 118.3 | 2 | 54.4 | ||||
| Gabčíkovo | GABC_1 | TGA_1 | 416.2 | 119.5 | 4 | 33.8 | 415.0 | 113.4 | 127.3 | 414.5 | 119.1 | 4 | 95.7 |
| H. Ždaňa | HZDA_1 | THZ_1 | 413.8 | 118.4 | 1 | 84.7 | 382.5 | 87.3 | 234.2 | 377.5 | 92.6 | −8 | 203.4 |
| HZDA_3 | THZ_2 | 118.2 | 6 | 12.1 | 108.5 | 28 | 117.1 | 3 | 10.9 | ||||
| Košice | KOSICE2 | TKO_1 | 413.2 | 119.0 | 2 | 34.8 | 396.0 | 111.2 | 94.5 | 391.6 | 117.1 | −2 | 81.7 |
| KOSICE1 | TKO_2 | 119.0 | 2 | 34.8 | 111.2 | 94.5 | 118.0 | −4 | 81.7 | ||||
| Križovany | KRIZ_1 | TKR_1 | 415.0 | 119.0 | 3 | 26.3 | 410.6 | 114.0 | 88.6 | 408.6 | 118.0 | −4 | 67.2 |
| KRIZ_2 | TKR_2 | 119.8 | 3 | 43.4 | 113.3 | 107.8 | 118.7 | 2 | 85.7 | ||||
| L. Mara | LMAR_1 | TLM_1 | 418.0 | 118.6 | 4 | 18.5 | 396.4 | 107.4 | 82.3 | 391.4 | 119.6 | −2 | 60.6 |
| LMAR_1 | TLM_2 | 118.6 | 4 | 18.3 | 107.4 | 81.5 | 119.6 | −2 | 60.1 | ||||
| Lemešany | LEME_1 | TLE_1 | 414.4 | 119.0 | 1 | 17.9 | 398.1 | 111.3 | 57.9 | 393.8 | 118.7 | −3 | 43.9 |
| LEME_2 | TLE_2 | 119.1 | 1 | 16.6 | 112.0 | 46.4 | 118.9 | −2 | 36.6 | ||||
| Levice | LEVI_1 | TLV_1 | 415.2 | 118.6 | 4 | 14.9 | 407.8 | 113.0 | 71.1 | 405.3 | 118.2 | 2 | 51.7 |
| LEVI_2 | TLV_2 | 118.7 | 4 | 16.3 | 113.5 | 71.3 | 118.7 | 2 | 52.3 | ||||
| Medzibrod | MEDZ_2 | TME_1 | 418.0 | 119.1 | 4 | 14 | 394.5 | 108.2 | 40.4 | 389.2 | 119.6 | −2 | 31.5 |
| MEDZ_1 | TME_2 | 119.1 | 4 | 13.9 | 108.2 | 40 | 119.0 | −1 | 31.2 | ||||
| Moldava | MOLD_1 | TMO_1 | 413.7 | 118.8 | 2 | 21.6 | 397.3 | 111.5 | 60.5 | 393.0 | 119.0 | −1 | 46.8 |
| P. Biskupice | PBIS_1 | TPB_1 | 415.3 | 118.5 | 3 | 60.5 | 410.1 | 109.2 | 176.8 | 408.5 | 118.8 | −3 | 140.7 |
| PBIS_2 | TPB_2 | 119.2 | 4 | 33.6 | 112.7 | 114.9 | 118.9 | 3 | 87.4 | ||||
| R. Sobota | RSOB_1 | TRS_1 | 413.9 | 118.8 | 4 | 8.1 | 403.0 | 113.3 | 35 | 399.2 | 119.1 | 1 | 27.8 |
| RSOB_1 | TRS_2 | 118.8 | 3 | 16.7 | 113.3 | 38.9 | 119.1 | 0 | 24.9 | ||||
| Sp. N. Ves | SNV_1 | TSN_1 | 416.8 | 118.7 | 5 | 37.6 | 396.8 | 107.7 | 110.1 | 392.1 | 119.3 | −2 | 85.3 |
| SNV_2 | TSN_2 | 118.6 | 5 | 20.9 | 110.2 | 43.3 | 118.8 | 0 | 36.6 | ||||
| Stupava | STUP_1 | TST_1 | 414.8 | 119.7 | 2 | 27.7 | 408.5 | 113.5 | 77.2 | 407.6 | 118.3 | 2 | 57.9 |
| STUP_2 | TST_2 | 119.0 | 3 | 31.2 | 113.0 | 105.4 | 118.9 | 2 | 81.1 | ||||
| Varín | VARI_A | TVA_1 | 417.1 | 118.5 | 5 | 42 | 396.6 | 105.7 | 122.9 | 396.2 | 118.5 | −1 | 93 |
| Voľa | VOLA_1 | TVO_1 | 414.8 | 118.5 | 4 | 14.1 | 399.0 | 111.7 | 44.7 | 395.0 | 119.3 | 0 | 34.5 |
| VOLA_2 | TVO_2 | 119.4 | 3 | 12.6 | 112.3 | 50.5 | 118.6 | 0 | 37.2 | ||||
| TS Node | DS Node | TR | BASE Case | Max. Transit | Max. Transit with AVR | ||||||
|---|---|---|---|---|---|---|---|---|---|---|---|
| V1 (kV) | V2 (kV) | Act. Tap | TR Load (%) | V1 (kV) | V2 (kV) | V1 (kV) | V2 (kV) | Act. Tap | |||
| Bošáca | BOSA_1 | TBO_1 | 415.0 | 119.0 | 4 | 17.9 | 415.0 | 119.1 | 415.0 | 119.1 | 4 |
| BOSA_2 | TBO_2 | 118.0 | 5 | 16.9 | 118.1 | 118.1 | 5 | ||||
| Bystričany | BYST_1 | TBY_1 | 416.2 | 119.0 | 4 | 13.2 | 415.2 | 118.8 | 415.6 | 118.9 | 4 |
| BYST_2 | TBY_2 | 119.3 | 3 | 31.1 | 118.2 | 118.6 | 3 | ||||
| Gabčíkovo | GABC_1 | TGA_1 | 416.2 | 119.5 | 4 | 33.8 | 411.2 | 117.9 | 411.1 | 118.3 | 4 |
| H. Ždaňa | HZDA_1 | THZ_1 | 413.8 | 118.4 | 1 | 84.7 | 404.7 | 115.3 | 403.9 | 118.8 | −1 |
| HZDA_3 | THZ_2 | 118.2 | 6 | 12.1 | 116.5 | 117.2 | 5 | ||||
| Košice | KOSICE2 | TKO_1 | 413.2 | 119.0 | 2 | 34.8 | 385.6 | 110.6 | 381.2 | 117.8 | −4 |
| KOSICE1 | TKO_2 | 119.0 | 2 | 34.8 | 110.6 | 117.8 | −4 | ||||
| Križovany | KRIZ_1 | TKR_1 | 415.0 | 119.0 | 3 | 26.3 | 414.4 | 118.8 | 414.6 | 118.8 | 3 |
| KRIZ_2 | TKR_2 | 119.8 | 3 | 43.4 | 119.1 | 118.6 | 4 | ||||
| L. Mara | LMAR_1 | TLM_1 | 418.0 | 118.6 | 4 | 18.5 | 404.8 | 114.8 | 403.4 | 119.4 | 4 |
| LMAR_1 | TLM_2 | 118.6 | 4 | 18.3 | 114.8 | 119.4 | 4 | ||||
| Lemešany | LEME_1 | TLE_1 | 414.4 | 119.0 | 1 | 17.9 | 388.0 | 111.3 | 383.5 | 118.5 | −4 |
| LEME_2 | TLE_2 | 119.1 | 1 | 16.6 | 111.4 | 119.5 | −4 | ||||
| Levice | LEVI_1 | TLV_1 | 415.2 | 118.6 | 4 | 14.9 | 405.2 | 115.7 | 403.9 | 119.0 | 2 |
| LEVI_2 | TLV_2 | 118.7 | 4 | 16.3 | 116.1 | 118.2 | 2 | ||||
| Medzibrod | MEDZ_2 | TME_1 | 418.0 | 119.1 | 4 | 14 | 405.6 | 115.6 | 404.6 | 118.9 | 2 |
| MEDZ_1 | TME_2 | 119.1 | 4 | 13.9 | 115.6 | 118.9 | 2 | ||||
| Moldava | MOLD_1 | TMO_1 | 413.7 | 118.8 | 2 | 21.6 | 385.8 | 110.8 | 381.4 | 119.4 | −4 |
| P. Biskupice | PBIS_1 | TPB_1 | 415.3 | 118.5 | 3 | 60.5 | 410.8 | 117.3 | 410.9 | 118.3 | 2 |
| PBIS_2 | TPB_2 | 119.2 | 4 | 33.6 | 117.8 | 118.5 | 4 | ||||
| R. Sobota | RSOB_1 | TRS_1 | 413.9 | 118.8 | 4 | 8.1 | 387.3 | 111.1 | 383.3 | 119.2 | −3 |
| RSOB_1 | TRS_2 | 118.8 | 3 | 16.7 | 111.1 | 119.2 | −2 | ||||
| Sp. N. Ves | SNV_1 | TSN_1 | 416.8 | 118.7 | 5 | 37.6 | 394.9 | 112.4 | 391.9 | 118.4 | 0 |
| SNV_2 | TSN_2 | 118.6 | 5 | 20.9 | 112.2 | 119.0 | 0 | ||||
| Stupava | STUP_1 | TST_1 | 414.8 | 119.7 | 2 | 27.7 | 409.2 | 117.9 | 409.2 | 118.6 | 2 |
| STUP_2 | TST_2 | 119.0 | 3 | 31.2 | 117.7 | 118.8 | 2 | ||||
| Varín | VARI_A | TVA_1 | 417.1 | 118.5 | 5 | 42 | 406.4 | 115.4 | 405.9 | 118.1 | 3 |
| Voľa | VOLA_1 | TVO_1 | 414.8 | 118.5 | 4 | 14.1 | 383.7 | 109.6 | 378.8 | 119.5 | −3 |
| VOLA_2 | TVO_2 | 119.4 | 3 | 12.6 | 110.4 | 118.7 | −3 | ||||
References
- Eleschová, Ž.; Beláň, A.; Cintula, B.; Bendík, J.; Cenký, M.; Janiga, P. Voltage Stability of Power System of the Slovak Republic: Influence of Transformers with AVR. In Proceedings of the 2022 22nd International Scientific Conference on Electric Power Engineering (EPE), Kouty nad Desnou, Czech Republic, 8–10 June 2022; pp. 1–6. [Google Scholar]
- Commission Regulation (EU) 2017/1485 of 2 August 2017 Establishing a Guideline on Electricity Transmission System Operation (Text with EEA Relevance). 2017, Volume 220. Available online: http://data.europa.eu/eli/reg/2017/1485/oj (accessed on 10 November 2022).
- Kundur, P. Power System Stability and Control; McGraw-Hill: New York, NY, USA, 1994; ISBN 978-0-07-063515-9. [Google Scholar]
- Anderson, P.M.; Fouad, A.A. Power System Control and Stability, 2nd ed.; Wiley-IEEE Press: Piscataway, NJ, USA, 2002; ISBN 978-0-471-23862-1. [Google Scholar]
- Kawabe, K.; Tanaka, K. Analytical Method for Short-Term Voltage Stability Using the Stability Boundary in the P-V Plane. IEEE Trans. Power Syst. 2014, 29, 3041–3047. [Google Scholar] [CrossRef]
- Peng, L.; Yubo, Y.; Yuting, W. On-Line Voltage Stability Assessment Strategy Considering Limit of Voltage Source. In Proceedings of the TENCON 2015-2015 IEEE Region 10 Conference, Macao, China, 1–4 November 2015; pp. 1–5. [Google Scholar]
- UCTE. Final Report of the Investigation Committee on the 28 September 2003 Blackout in Italy. 2004, p. 128. Available online: https://www.entsoe.eu/fileadmin/user_upload/_library/publications/ce/otherreports/20040427_UCTE_IC_Final_report.pdf (accessed on 10 November 2022).
- UCTE. Final Report-System Disturbance on 4 November 2006. Available online: https://www.entsoe.eu/fileadmin/user_upload/_library/publications/ce/otherreports/Final-Report-20070130.pdf (accessed on 10 November 2022).
- Vournas, C.D.; Nikolaidis, V.C.; Tassoulis, A. Experience from the Athens Blackout of July 12, 2004. In Proceedings of the 2005 IEEE Russia Power Tech, St. Petersburg, Russia, 27–30 June 2005; pp. 1–7. [Google Scholar]
- Central Electricity Regulatory Commission. Report on the Grid Disturbance on 30th July 2012 and Grid Disturbance on 31st July 2012. 2012. Available online: https://cercind.gov.in/2012/orders/Final_Report_Grid_Disturbance.pdf (accessed on 10 November 2022).
- U.S.-Canada Power System Outage Task Force Final Report on the August 14, 2003 Blackout in the United States and Canada: Causes and Recommendations 2004. Available online: https://www3.epa.gov/region1/npdes/merrimackstation/pdfs/ar/AR-1165.pdf (accessed on 10 November 2022).
- UCTE UCTE OH—Appendix 3: Operational Security 2009. Available online: https://www.entsoe.eu/fileadmin/user_upload/_library/publications/entsoe/Operation_Handbook/Policy_3_Appendix_final.pdf (accessed on 10 November 2022).
- Commission Regulation (EU) 2017/2196 of 24 November 2017 Establishing a Network Code on Electricity Emergency and Restoration (Text with EEA Relevance). 2017, Volume 312. Available online: http://data.europa.eu/eli/reg/2017/2196/oj (accessed on 10 November 2022).
- Liu, X.; Niu, X.; Zhu, Y.; Zhu, C. Influence of Regulation of OLTC Transformation Ratio on Voltage Stability. In Proceedings of the 2013 Fourth International Conference on Digital Manufacturing & Automation, Shinan, China, 29–30 June 2013; pp. 696–700. [Google Scholar]
- Mahendar, G.; Yesuratnam, G. An Approach to Identify Critical on Load Tap Changing (OLTC) Transformers under Network Contingencies. In Proceedings of the 2016 IEEE 7th Power India International Conference (PIICON), Bikaner, India, 25–27 November 2016; pp. 1–6. [Google Scholar]
- Nassaj, A.; Shahrtash, S.M. Prevention of Voltage Instability by Adaptive Determination of Tap Position in OLTCs. In Proceedings of the 2017 Iranian Conference on Electrical Engineering (ICEE), Tehran, Iran, 2–4 May 2017; pp. 980–985. [Google Scholar]
- Li, J.; Liu, Y.; Zhang, L. Effect of On-Load Tap Changer on Voltage Stability of Power Systems with Nonlinear Load. In Proceedings of the 2011 IEEE International Conference on Computer Science and Automation Engineering, Shanghai, China, 10–12 June 2011; Volume 4, pp. 146–149. [Google Scholar]
- Slovenská Elektrizačná Prenosová Sústava, a.s. Basic Data. Available online: https://www.sepsas.sk/en/technical-data/basic-data/ (accessed on 12 October 2022).
- Slovenská Elektrizačná Prenosová Sústava, a.s. Annual Reports. Available online: https://www.sepsas.sk/en/control-centre/yearly-operational-data/annual-reports/ (accessed on 12 October 2022).
- ENTSO-E. Synchronous Area Framework Agreement for Regional Group Continental Europe: Annex 6: Policy on Data Exchange. Available online: https://eepublicdownloads.entsoe.eu/clean-documents/SOC%20documents/SAFA_for_RG_CE/SAFA_for_RG_CE_-_08_-_Annex_06_-_Policy__on_Data_Exchange_220215.docx (accessed on 10 November 2022).
- ENTSO-E Grid Map. Available online: https://www.entsoe.eu/data/map/ (accessed on 11 November 2022).
- Slovenská Elektrizačná Prenosová Sústava, a.s. Grid Maps. Available online: https://www.sepsas.sk/en/technical-data/grid-maps/ (accessed on 12 October 2022).
- Gajic, Z.; Karlsson, D.; Kockott, M. Advanced OLTC Control to Counteract Power System Voltage Instability. 2006. Available online: https://library.e.abb.com/public/899e52a1c85c4fefc12574b1002c96c7/SA2006-000024_A_en_Advanced_OLTC_Control_to_Counteract_Power_System_Voltage_Instability.pdf (accessed on 10 November 2022).
- Soe, N.N.; Lwin, K.S. Advance OLTC Control for Improving Power System Voltage Stability. Int. J. Sci. Eng. Technol. Res. 2014, 3, 2487–2493. [Google Scholar]
- Otomega, B.; Sermanson, V.; Van Cutsem, T. Reverse-Logic Control of Load Tap Changers in Emergency Voltage Conditions. In Proceedings of the 2003 IEEE Bologna Power Tech Conference Proceedings, Bologna, Italy, 23–26 June 2003; Volume 1, p. 7. [Google Scholar]
- Van Cutsem, T.; Vournas, C.D. Emergency Voltage Stability Controls: An Overview. In Proceedings of the 2007 IEEE Power Engineering Society General Meeting, Tampa, FL, USA, 24–28 June 2007; pp. 1–10. [Google Scholar]


| Transformer | Vmax (kV) | Vmin (kV) | Step (p.u.) | Tap Min | Tap Max |
|---|---|---|---|---|---|
| T401 BOSA | 120.0 | 118.0 | 0.0133 | −9 | 9 |
| T402 BOSA | 120.0 | 118.0 | 0.0143 | −8 | 8 |
| T401 BYST | 120.0 | 118.0 | 0.0150 | −8 | 8 |
| T402 BYST | 120.0 | 118.0 | 0.0150 | −8 | 8 |
| T401 GABC | 120.0 | 118.0 | 0.0120 | −9 | 9 |
| T402 HZDA | 120.0 | 117.0 | 0.0110 | −8 | 8 |
| T403 HZDA | 120.0 | 118.0 | 0.0150 | −8 | 8 |
| T402 KOSI | 121.0 | 117.0 | 0.0126 | −8 | 8 |
| T401 KOSI | 121.0 | 117.0 | 0.0126 | −8 | 8 |
| T402 KRIZ | 120.0 | 118.0 | 0.0150 | −8 | 8 |
| T403 KRIZ | 120.0 | 118.0 | 0.0150 | −8 | 8 |
| T401 LMAR | 120.0 | 118.0 | 0.0137 | −7 | 7 |
| T402 LMAR | 120.0 | 118.0 | 0.0137 | −7 | 7 |
| T402 LEME | 120.0 | 118.0 | 0.0143 | −8 | 8 |
| T403 LEME | 120.0 | 118.0 | 0.0143 | −8 | 8 |
| T401 LEVI | 120.0 | 118.0 | 0.0150 | −8 | 8 |
| T403 LEVI | 120.0 | 118.0 | 0.0150 | −8 | 8 |
| T401 MEDZ | 120.0 | 118.0 | 0.0145 | −8 | 8 |
| T402 MEDZ | 120.0 | 118.0 | 0.0145 | −8 | 8 |
| T401 MOLD | 120.0 | 118.0 | 0.0150 | −8 | 8 |
| T402 PBIS | 120.0 | 118.0 | 0.0120 | −9 | 9 |
| T404 PBIS | 120.0 | 118.0 | 0.0150 | −8 | 8 |
| T402 RSOB | 120.0 | 118.0 | 0.0150 | −8 | 8 |
| T403 RSOB | 120.0 | 118.0 | 0.0112 | −9 | 9 |
| T401 SNV | 120.0 | 118.0 | 0.0115 | −9 | 9 |
| T402 SNV | 120.0 | 118.0 | 0.0126 | −8 | 8 |
| T401 STUP | 120.0 | 118.0 | 0.0126 | −8 | 8 |
| T402 STUP | 120.0 | 118.0 | 0.0150 | −8 | 8 |
| T401 VARI | 120.0 | 118.0 | 0.0125 | −9 | 9 |
| T401 VOLA | 120.0 | 118.0 | 0.0150 | −8 | 8 |
| T402 VOLA | 120.0 | 118.0 | 0.0150 | −8 | 8 |
| Base Case | With AVR in Winter | With AVR in Summer |
|---|---|---|
| Total generation | 4626.9 MW | 4334.3 MW |
| Total load | 4088.7 MW (1 p.u.) | 3309.9 MW (1 p.u.) |
| Total losses | 81.5 MW | 54.4 MW |
| Losses in the TS | 52.1 MW | 31.2 MW |
| Losses in the DS | 29.4 MW | 23.2 MW |
| Power balance | 260.4 MW | 787.7 MW |
| Transit | 2216.2 MW (1 p.u.) | 626.2 MW (1 p.u.) |
| Max. loaded line | 56% (V449) | 41% (V449) |
| Max. voltage in the TS | 416.8 kV (L. Mara) | 418.0 kV (Medzibrod, L. Mara) |
| Min. voltage in the TS | 413.4 kV (H. Ždaňa) | 413.2 kV (Košice) |
| Max. power angle on the power line–tie line | 7.56° (V449) | 5.52° (V449) |
| Max. power angle on the power line–internal line | 6.80° (V426) | 5.52° (V426) |
| All generators are in the under-excitation area, meaning a sufficient reactive power reserve. | ||
| The Worst States with Maximum Load in DS | Without AVR in Winter | With AVR in Winter | Without AVR in Summer | With AVR in Summer |
|---|---|---|---|---|
| Total generation in PS | 4626.9 MW | 4626.9 MW | 4334.3 MW | 4334.3 MW |
| Total load in PS | 8381.8 MW (2.05 p.u.) | 8340.8 MW (2.04 p.u.) | 7132.9 MW (2.15 p.u.) | 7502.8 MW (2.27 p.u.) |
| Total losses in PS | 214.6 MW | 201.7 MW | 144.1 MW | 140.4 MW |
| Losses in TS | 108.8 MW | 110.7 MW | 67.1 MW | 70.0 MW |
| Losses in DS | 105.8 MW | 91.0 MW | 77.0 MW | 70.4 MW |
| Power balance | −3661.1 MW | −3627.3 MW | −3335.4 MW | −3706.2 MW |
| Transit | 770.6 MW | 770.2 MW | 452.8 MW | 440.5 MW |
| Reserve of stability | 105% | 104% | 116% | 127% |
| Max. loaded line | 123% (V404) | 123% (V404) | 80% (V270) | 80% (V270) |
| Max. voltage in TS | 410.2 kV (Gabčíkovo) | 407.9 kV (Gabčíkovo) | 414.8 kV (Gabčíkovo) | 414.5 kV (Gabčíkovo) |
| Min. voltage in TS | 371.5 kV (Horná Ždaňa) | 365.9 kV (Horná Ždaňa) | 380.8 kV (Horná Ždaňa) | 377.5 kV (Horná Ždaňa) |
| Max. power angle of the power line–tie line | 13.57° (V270) | 13.50° (V270) | 9.32° (V270) | 9.35° (V270) |
| Max. power angle of the power line–internal line | 7.63° (V426) | 7.80° (V426) | 5.65° (V426) | 5.71° (V426) |
| All generators are in over-excitation area, meaning no reactive power reserve. | ||||
| The Worst States with Maximum Transit through TS | Without AVR in Winter | With AVR in Winter | Without AVR in Summer | With AVR in Summer |
|---|---|---|---|---|
| Total generation in PS | 4626.9 MW | 4626.9 MW | 4334.3 MW | 4334.3 MW |
| Total load in PS | 4088.7 MW | 4088.7 MW | 3309.9 MW | 3309.9 MW |
| Total losses in PS | 225.7 MW | 236.3 MW | 159.2 MW | 154.8 MW |
| Losses in TS | 190.0 MW | 201.3 MW | 132.3 MW | 128.9 MW |
| Losses in DS | 35.7 MW | 35.0 MW | 26.9 MW | 25.9 MW |
| Power balance | 116.2 MW | 105.6 MW | 682.9 MW | 687.3 MW |
| Transit | 5321.1 MW (2.40 p.u.) | 5142.0 MW (2.32 p.u.) | 4164.4 MW (6.65 p.u.) | 4063.9 MW (6.49 p.u.) |
| Reserve of stability | 140% | 132% | 565% | 549% |
| Max. loaded line | 135% (V404) | 136% (V404) | 99% (V404) | 96% (V404) |
| Max. voltage in TS | 410.6 kV (Bystričany) | 388.3 kV (Bystričany) | 415.2 kV (Bystričany) | 415.6 kV (Bystričany) |
| Min. voltage in TS | 371.6 (V. Kapušany) | 345.1 (V. Kapušany) | 380.5 (V. Kapušany) | 376.5 (V. Kapušany) |
| Max. power angle of the power line–tie line | 15.04° (V449) | 17.04° (V449) | 13.40° (V449) | 13.29° (V449) |
| Max. power angle of the power line–internal line | 8.43° (V426) | 9.66° (V426) | 6.87° (V426) | 6.89° (V426) |
| All generators are in over-excitation areas, meaning no reactive power reserve. | ||||
| Pilot Node | Max. Load | Max. Transit | ||
|---|---|---|---|---|
| Without AVR Winter/Summer | With AVR Winter/Summer | Without AVR Winter/Summer | With AVR Winter/Summer | |
| Bošáca | 1.58/1.94 | 1.58/1.90 | 2.16/6.65 | 2.16/6.49 |
| Gabčíkovo | 1.87/2.01 | 1.87/2.01 | 2.01/5.62 | 1.99/5.78 |
| Križovany | 1.78/2.04 | 1.78/2.03 | 2.16/6.49 | 2.07/6.20 |
| V. Ďur | 1.65/1.87 | 1.62/1.86 | 1.86/5.49 | 1.70/5.19 |
| Pilot Node | Qgen (MVAr) |
|---|---|
| Bošáca | 160 |
| Gabčíkovo | 240 |
| Križovany | 160 |
| V. Ďur | 320 |
Publisher’s Note: MDPI stays neutral with regard to jurisdictional claims in published maps and institutional affiliations. |
© 2022 by the authors. Licensee MDPI, Basel, Switzerland. This article is an open access article distributed under the terms and conditions of the Creative Commons Attribution (CC BY) license (https://creativecommons.org/licenses/by/4.0/).
Share and Cite
Eleschová, Ž.; Cintula, B.; Cenký, M.; Beláň, A.; Bendík, J.; Janiga, P. Analysis of Voltage Stability of the Slovak Republic’s Power System. Processes 2022, 10, 2613. https://doi.org/10.3390/pr10122613
Eleschová Ž, Cintula B, Cenký M, Beláň A, Bendík J, Janiga P. Analysis of Voltage Stability of the Slovak Republic’s Power System. Processes. 2022; 10(12):2613. https://doi.org/10.3390/pr10122613
Chicago/Turabian StyleEleschová, Žaneta, Boris Cintula, Matej Cenký, Anton Beláň, Jozef Bendík, and Peter Janiga. 2022. "Analysis of Voltage Stability of the Slovak Republic’s Power System" Processes 10, no. 12: 2613. https://doi.org/10.3390/pr10122613
APA StyleEleschová, Ž., Cintula, B., Cenký, M., Beláň, A., Bendík, J., & Janiga, P. (2022). Analysis of Voltage Stability of the Slovak Republic’s Power System. Processes, 10(12), 2613. https://doi.org/10.3390/pr10122613