Article

Cutting Force Prediction for Trochoid Milling of 300M Ultra-High Strength Steel

1
School of Mechanical Engineering, Shaanxi University of Technology, Hanzhong 723001, China
2
Shaanxi University Enterprise Joint Research Center for Advanced Manufacturing of Aircraft Landing Gear and Performance Testing of Aviation Components, Shaanxi University of Technology, Hanzhong 723001, China
3
Engineering Research Center of Manufacturing and Testing for Landing Gear and Aircraft Structural Parts, Universities of Shaanxi Province, Hanzhong 723001, China
*
Author to whom correspondence should be addressed.
Processes 2022, 10(12), 2617; https://doi.org/10.3390/pr10122617
Submission received: 8 November 2022 / Revised: 18 November 2022 / Accepted: 24 November 2022 / Published: 6 December 2022
(This article belongs to the Section Manufacturing Processes and Systems)

Abstract

:
Trochoid milling can improve the quality of machining of difficult materials as well as the efficiency of machining. However, its complex tool trajectory makes it difficult to predict the instantaneous cutting forces during cutting. Therefore, in this paper, the transient cutting thickness model in the cycloidal milling process was established using numerical combined with analytical methods, and the semi-mechanical cutting force model was established. Experiments were designed to compare the differences between the cutting force coefficients extracted from the slot milling experiments and those extracted from the trochoid milling. Finally, experiments were designed to validate the established cutting force model. The results showed that there was an error of 5–23% between the tangential cutting force coefficients extracted from slot milling and the tangential cutting force coefficients extracted from trochoid milling, while there was an error of 21–35% in the radial cutting force coefficients, indicating that the cutting force coefficients extracted from slot milling cannot be used to predict the cutting force in the trochoid milling process. It was verified that the error of the established cutting force model in predicting the cutting force of trochoid milling was 12%, indicating that the established model has a high accuracy, which provides a theoretical basis for the selection of cutting parameters and parameter optimization in the future.

1. Introduction

As a common difficult-to-machine material, 300M steel is widely used in the manufacturing process of aircraft landing gear in the aerospace field because of its high hardness, good transverse plasticity, high fracture toughness, excellent fatigue performance, and good corrosion resistance [1,2]. However, because of its high hardness, a large amount of cutting force and cutting heat will be generated during the machining process, which seriously affects the quality of the machined surface and the service life of the tool [3,4]. Trochoid milling is beneficial to the discharge of chips and the heat dissipation of the tool, which can significantly improve the service life of the tool [5]. Cutting force is one of the important indicators reflecting the stability of the machining process, and has an important impact on tool life, surface quality, and machining accuracy. In order to extend the tool life and improve the surface quality of parts, the cutting force of trochoid milling was studied and it is particularly important to establish a cutting force model. The calculation of the accurate cutting force requires an accurate chip thickness during the cutting process. Therefore, establishing a cutting force model with an accurate chip thickness can realize the optimal control of the cutting force in trochoid milling, which is helpful for predicting the processing stability before the actual processing to ensure the processing quality and efficiency and reduce the production cost.
In recent years, many experts and scholars have conducted a lot of research on the material properties, general groove milling, and end milling of 300M steel. Hou et al. [6] used the improved J-integral calculation method to solve the problem of the quantitative evaluation of the crack growth of shot peening reinforced structures, and the results showed that increasing the shot peening speed was more conducive to delaying the fatigue crack growth. Guo et al. [7] established a mathematical model of recrystallization volume integration and a grain size prediction model under a high strain rate, which provided a theoretical basis for optimizing the processing parameters and generating a cutting force model of parts with excellent mechanical properties. Skubisz et al. [8] investigated the possibility and determination of 300M hot, warm forging of ultra-high strength steel, and subsequent air-accelerated quenching. Bag et al. [9] studied the axial fatigue life of 300M steel under different spraying conditions. A lower limit prediction method of fatigue life based on the stress intensity factor was proposed. Ajaja et al. [10] studied the effect of surface integrity characteristics produced by hard turning on the rotational bending fatigue life of 300M steel. Zhang et al. [11] used single-factor experiments to study the milling experiment of 300M steel under five lubrication conditions and carried out orthogonal experiments on three cutting parameters under CMQL conditions to observe the influence of process parameters on surface quality and tool wear. Zhang et al. [12] studied the influence of cutting data on the cutting force and cutting temperature during milling under CMQL conditions through orthogonal experiments. The results showed that the cutting depth had the greatest influence on the cutting force, and the cutting speed had the greatest influence on the cutting temperature. Yang et al. [13] studied the effect of milling parameters on the integrity of the milled surface of ultra-high strength steel. The results showed that milling speed and feed per tooth had a significant influence on the surface roughness of 2D and 3D.
In trochoid milling, Šajgalík et al. [14] used response surface experiments to study the influence of trochoid trajectory parameters on the total cutting force during the cycloidal milling of hardened steel. Zhang et al. [15] established a trochoid milling force prediction model based on the radial cutting depth. It was verified that the predicted values were in good agreement with the experimental values. PLETA et al. [16] combined the cutting force coefficient, cutting edge coefficient, and instantaneous cutting thickness to establish a semi-mechanical dynamic cutting force model of trochoid milling process. Cai et al. [17] established a cutting force model of the end mill by the micro-element method on the basis of the contact angle model between the tool and the work piece, and carried out experimental verification. In terms of instantaneous cutting thickness model prediction, Otkur et al. [18,19] assumed that the trochoid milling trajectory was a pure circle, and on this basis, the chip thickness model of the trochoid milling process was established, and the cutting force extracted by the slot milling experiment was used, factors that simulate the cutting force of trochoid milling.
From the above research and analysis, it can be seen that the current domestic and international research on 300M steel is mainly focused on some characteristics of the material and the effect of each cutting parameter on the cutting force, cutting heat, surface roughness, and tool life in the general milling of 300M steel. As for solving the instantaneous cutting thickness of cycloidal milling, this is mainly solved by using the traditional equivalent cutting thickness model or by reducing the tool path to a circle. The cutting force coefficients extracted from the slot milling are used in predicting the cutting force. However, the methods described above produce large errors in predicting the cutting forces in cycloidal milling. Therefore, in this paper, the instantaneous cutting thickness during trochoid milling was solved using numerical combined with analytical methods based on the real trajectory of cycloidal milling, and a semi-mechanical cutting force model was established. A comprehensive experiment was also designed to compare the cutting force coefficients extracted from slot milling and cycloid milling. Finally, the established model was verified experimentally, and the results showed that the error between the predicted and experimental values of the cutting force was small and the model had high accuracy.

2. Modeling of Uncut Thickness in Cycloidal Milling

2.1. Mathematical Expression of the Trajectory of the Pendulum Blade

The trochoid milling tool trajectory is represented by three motions: (1) the rotation motion of the tool around its central axis, the rotation speed is also equivalent to the machine speed, clockwise direction; (2) the counterclockwise rotation motion of the tool center around a certain radius circle; and (3) the feed motion of the tool along the Y direction, the above three combinations become the cycloidal motion, the equations of the motion trajectory of the tool tip and tool center are shown in Equations (1) and (2) are shown:
{ X t = R cos ( ω 2 t ) + r cos ( ω 1 t ) Y t = R sin ( ω 2 t ) + rsin ( ω 1 t ) + v t
{ X c = R cos ( ω 2 t ) Y c = R sin ( ω 2 t ) + v t
where R is the radius of the tool’s revolution in mm; r is the radius of the tool in mm; ω 2 is the rotational speed of the tool during its revolution; ω 1 is the rotational speed of the tool during its rotation; v is the speed of the tool during linear feed along the Y-axis; t is the time in s; and [ X t   Y t ] T and [ X c   Y c ] T are the global coordinates of the tool tip in the XY plane.
The geometric representation of the cycloidal trajectory is shown in Figure 1a. Unlike the general belief that the tool path produces a purely circular outer edge, there is a feed speed v along the Y direction in Equation (1), resulting in a skewed outer edge that leads to a large deviation between the cycloidal outer edge and the assumption of a circular outer edge; the continuity and smoothness of the outer edge can be improved by increasing ω 1 and decreasing ω 2 . However, the assumption of a purely circular outer edge is still undesirable, except at very small feed rates.
In conventional milling (such as end milling or slot milling), the geometry of each chip is the same throughout the cutting process, while in trochoid milling, the shape of each chip varies in size during the cutting process due to the tool rotation and the feed motion of the tool along the feed direction, and in addition, due to the complexity of the trochoid milling trajectory equation, there is no explicit expression describing the geometry of the chip, and the tool trajectory of the current cycle with the trajectory cut in the previous cycle is shown in Figure 1b, and the equation of the trajectory cut in the previous cycle can be expressed as Equation (3). If the coordinates of the intersection point of the tool trajectory curve are known, the geometry of the chip can be expressed.
{ X c = ( R + r ) cos ( ω 2 t ) Y c = ( R + r ) sin ( ω 2 t ) + v t

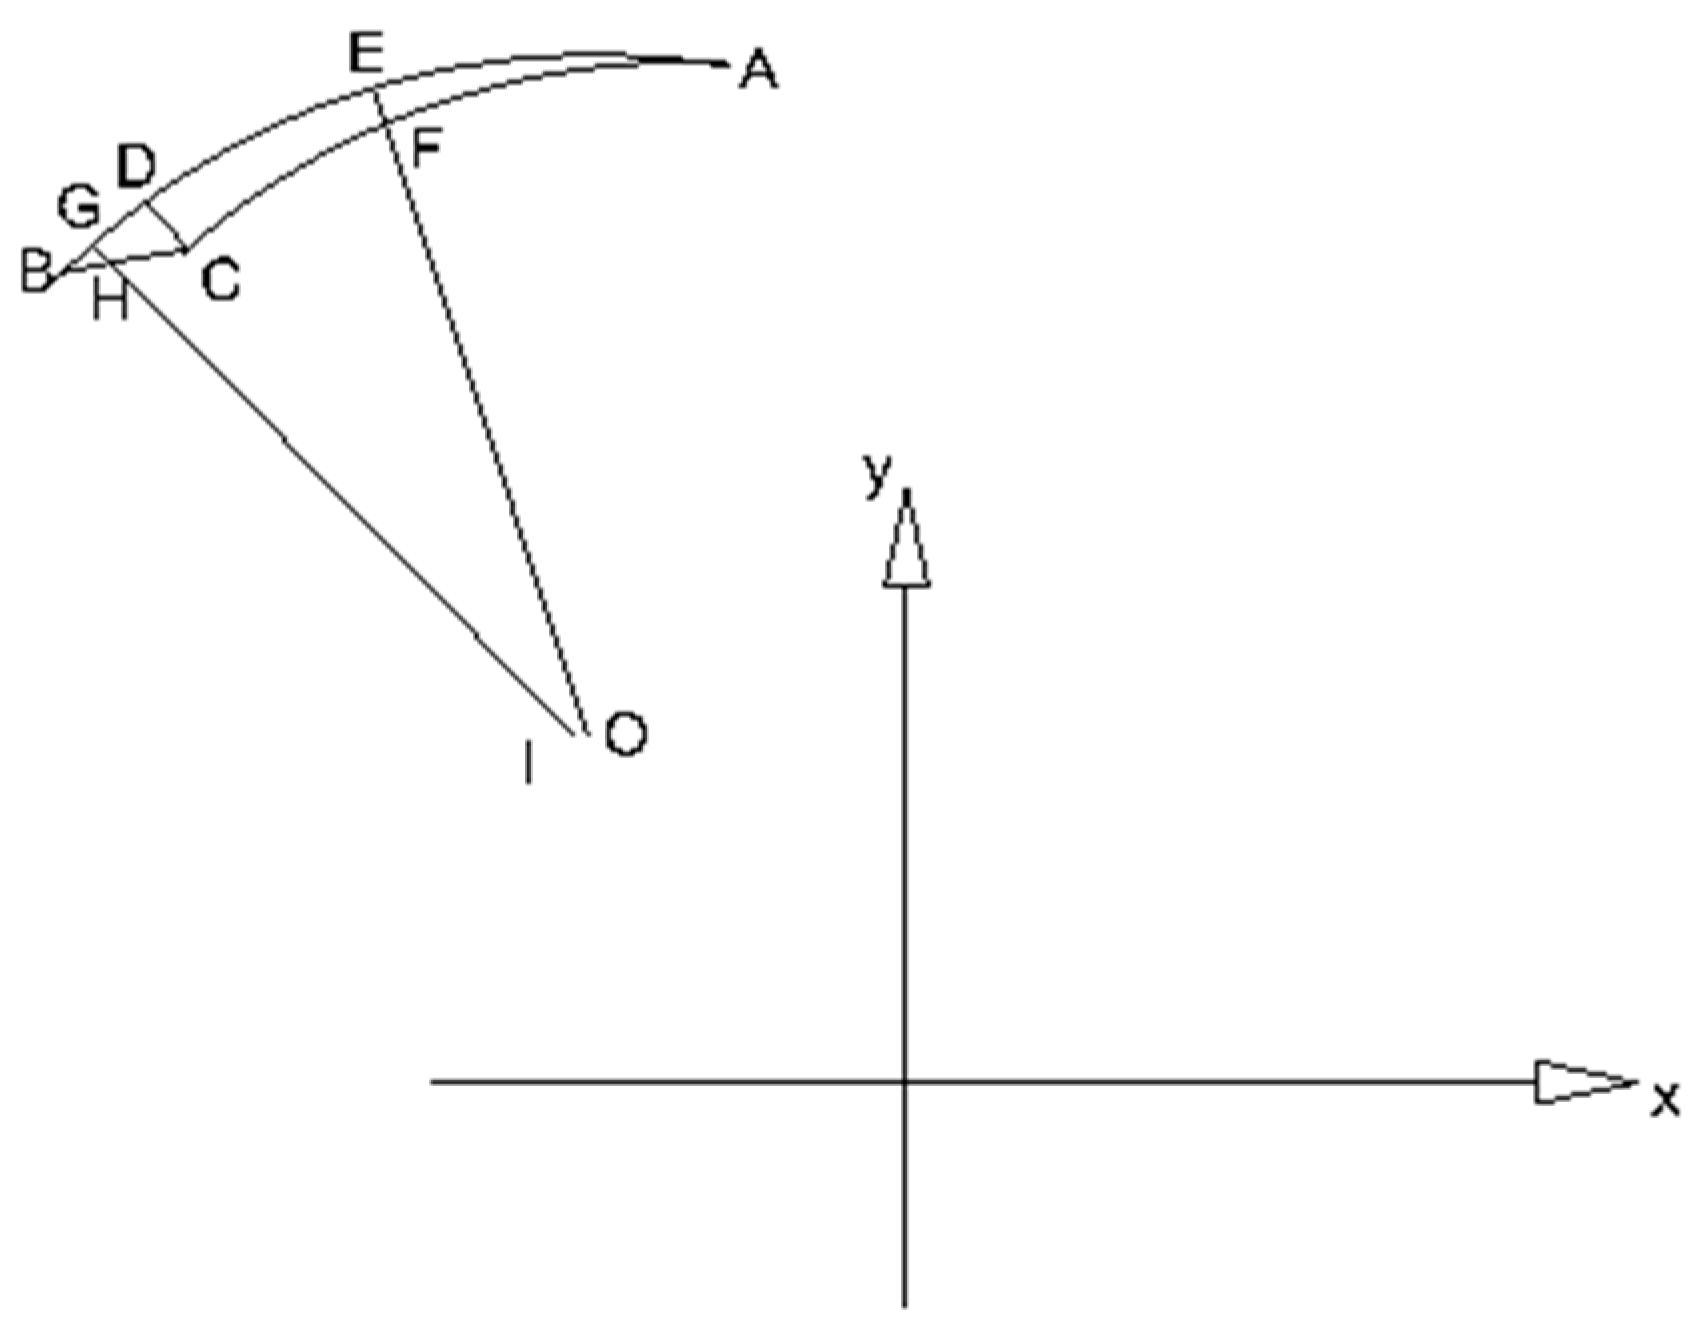
2.2. Constructing Chip Geometry

In order to find the intersection point (self-intersection and cross-intersection), this paper used the mechanical search method. Let there are two points p 1 ( x 1 , y 1 ) and p 2 ( x 2 , y 2 ) on the two curves, each moving on the curve C 1 , C 2 with the change of parameters α , β , and the distance between them d = ( x 1 x 2 ) 2 + ( y 1 y 2 ) 2 constantly changing. If two curves have an intersection, there are specific parameter values α , β making d = 0 , when the two points coincide, which is the intersection point p ( x , y ) , according to which the method of finding the intersection point P can be derived. The intersection point according to this method is shown in Figure 2a:
The first step after finding all the self-intersection points is to find the first two points A 1 1 and A 1 2 closest to the extrapolation line, as shown in Figure 2b, and to obtain the time difference ∆t between the two points to find the remaining points closest to the extrapolation line. The second step is to use the mechanical search method to find the cross intersection points of the current tool trajectory and the trajectory cut in the previous cycle. The cross-intersection points are crucial because the geometry of the chip starts from the cross-intersection points, and at this stage, all the intersection points of the chip are found and the geometry of the chip can be constructed from the appropriate connection of these points.
As shown in Figure 3, each chip geometry can be composed of three regions, which are defined as follows:
(1)
Region 1 ( R 1 N ), from point A 2 N (the intersection of the current tool trajectory with the trajectory cut through the previous cycle) to point A 1 N (the closest self-intersection points to the extrapolation line).
(2)
Region 2 ( R 2 N ), which is a part of R 1 N 1 , is generated from the previous crumbs and is defined from point A 2 N to point A 11 N .
(3)
Region 3 ( R 3 N ), this region is on the extrapolation line of the previous cycle from point A 2 N to A 11 N .
It should be noted that point A 11 N and point A 1 N have the same coordinates, only the time of passing through point A 11 N and point A 1 N are different. For the (N−1)st chip, the point A 11 N with smaller cutting time was chosen as the self-intersection point, while for the Nth chip, the point A 1 N with a larger cutting time was chosen, and according to this method, the exact geometry of each chip in the single-tooth cycloid milling process can be constructed.

2.3. Solution of Chip Thickness

After the geometry of the chip is constructed, the cutting thickness is solved by dividing each chip into two segments (AD segment and DB segment), as shown in Figure 4, with AB as R 1 N , AC as R 2 N , and BC as R 3 N in the figure.
AD segment:
When the jst blade cuts to the point E, assume that the cutting time at this time is t E , then the coordinates of the tool tip at this time are ( X t ( t E ) , Y t ( t E ) ) , the coordinates of the tool center are ( X c ( t E ) , Y c ( t E ) ) , connect the tool tip E with the tool center O, the intersection of OE and the j-1th blade trajectory is F, and the time of the j-1st blade passing through the point F is t F . The coordinates of the j-1th blade tip at the moment of t F are ( X t ( t F ) , Y t ( t F ) ) , and the following equations can be listed according to the common line of E, F, O points:
X E X O Y E Y O = X F X O X F X O
Substitute (1) and (2) into (4) and simplify to obtain:
R r c o s ( ω 2 t ) sin ( ω 2 t E ω 1 t E ) + R r sin ( ω 2 t ) cos ( ω 2 t E ω 1 t E ) + r 2 sin ( ω 1 t E ω 1 t F + Δ ) + R r sin ( ω 2 t E ω 1 t E ) + v t r cos ( ω 1 t E ) = 0
where t = t E t F , which is the time interval between the tool tip passing through points E and F. Δ is the interdental angle of the tool, and the interdental angle of a single tool tooth is 2 π .
In the actual milling process, since t is small and ω 1 t can be considered as ω 1 t infinitesimal compared to π , cos( ω 1 t ), sin( ω 1 t ) can be expanded according to the following Taylor expansion:
{ sin x = x 1 6 x 3 cos x = 1 1 2 x 2
The final reduction to a cubic equation with respect to t
a t 3 + b t 2 + c t + d = 0
where:
{ a = 1 6 R ω 2 3 cos ( ω 1 t E ω 2 t E ) 1 6 ω 1 3 r b = 1 2 R ω 2 2 sin ( ω 2 t E ω 1 t E ) 1 2 r Δ ω 1 2 c = R ω 2 cos ( ω 2 t E ω 1 t E ) + r ω 1 1 2 r ω 1 Δ 2 + v cos ω 1 t E d = r Δ 1 6 Δ 3 r
By solving the cubic equation to find t , we obtain the coordinates of t F and point F to obtain the cutting thickness at the moment of t F :
h t E = | E F |
The DB segment is solved similarly to AD, the only difference being that the solution is found by associating the jth blade trajectory with the equation of the trajectory cut through the previous revolution cycle of the tool.

2.4. Chip Thickness Modeling for Multi-Tooth Tools

The chip thickness modeling method of single cutter teeth does not lose its versatility in chip thickness modeling of multi-cutter teeth, and the main difference between the two is that in the trochoid milling trajectory of multi-cutter teeth, the closest point to the extrapolation line is not obtained through the self-intersection point, but is solved through the cross-intersection point of the first and second cutter teeth, and the equation of the cycloidal trajectory of double cutter teeth with equal spacing is shown in Equation (9), where Δ denotes the interdental angle. In order to construct the chip geometry, the tool orientation plays an important role, as shown in Figure 5a, with the tool rotating clockwise, the path of the second cutting edge generates the R 2 region of the first cutting edge, the path of the first cutting edge generates the R 2 region of the second cutting edge, and the rest of the steps are the same as the method for modeling the chip thickness of a single-tooth chip. Figure 5b,c depicts the variation in the chip area and the corresponding chip thickness with the cutting time for the dual tool teeth.
{ X t = R cos ( ω 2 t ) + r cos ( ω 1 t + Δ )    Δ { 0 , π } Y t = R sin ( ω 2 t ) + r sin ( ω 1 t + Δ ) + v t    Δ { 0 , π }

3. Cutting Force Model

The cutting force during milling is the best parameter to reflect the thickness of the cut, using the instantaneous thickness of the cut model described in Section 1. As shown in Equation (10), the chip area is represented by the product of the clockwise cutting thickness h(t) and the axial cutting thickness b. Here, the function g(t) is “1” when the tool is involved in cutting, and “0” when the tool is in the uncut state, as shown in Equation (11). The cutting forces in the tangential and radial directions are selected from the dynamic cutting force model [20] and given in Equation (12), where K t and K r are the tangential and radial cutting force coefficients, respectively; K te and K re are the tangential and radial cutting forces, respectively. The radial cutting force edge coefficient, θ, is the cutting angle of the cutter tooth, that is, the angle between the current position of the cutter tooth and the cut-out position. Use the rotation matrix R in Equation (13) to convert the cutting force in local coordinates to the cutting force in XY global coordinates. The local and global coordinates and rotation angles of any chip are given in Figure 6. The positive direction of the force in the XY coordinates is applied by the positive direction of the dynamometer.
A ( t ) = b h ( t ) g ( t )
g ( t ) = { 1 t s t t e 0 t t s , t t e
{ F T = K t b h ( t ) g ( t ) + K t e b F R = K r b h ( t ) g ( t ) + K r e b
[ F X F Y ] = [ sin θ cos θ cos θ sin θ ] [ F T F R ]

4. Experiments

4.1. Test Conditions

The work piece material was 300M (40CrNi2Si2MoVA) steel, which has the advantages of high strength, high transverse plasticity, high fracture toughness, and excellent fatigue performance, so most of the landing gears of military and civilian aircraft use it as raw material. The size of the work piece (length × width × height) was 100 mm × 80 mm × 30 mm, and its main chemical composition and mechanical properties are shown in Table 1 and Table 2.
The milling test was carried out at the DMU50 five-axis machining center. The tool uses a SANDVIK carbide index able cutter R390-11T308M-PM1130, the number of teeth is 2, the radius is 16 mm, and the milling method is up-cut milling. The trochoid milling process and the measurement of the milling force are shown in Figure 7a,b. Milling forces during milling were measured and collected using a dynamometer model 9257B and DEWESoftX3 software.

4.2. Experimental Scheme

One of the purposes of this work was to study the influence of the tool path on the cutting force coefficient, in other words, whether the cutting force coefficient extracted from general slot milling can be used in the prediction of the cutting force of trochoid milling. In order to answer this question, the design conducted three independent experiments. The experiments in Table 3 were used to compare the cutting force coefficient between trochoid milling and general slot milling. In these experiments, the feed rate of the tool and the revolution speed of the tool were kept constant, and only the rotation speed of the tool was changed. The general experimental design of slot milling is shown in Table 4. In series I experiments, the same rotational speed, axial depth of cut, and feed per tooth were used as in trochoid milling. It was the same as in wire milling, but both the maximum and average chip thickness were different from the trochoid milling experiments. Therefore, two additional experimental series of slot milling (series II and series III) were designed to match the maximum and average chip thickness in trochoid milling, and the feed per tooth for these two series was determined as follows:
(1)
Use the method proposed in Section 2 to find the chip thickness for each group of trochoid milling in Table 3;
(2)
The feed per tooth in series II is equal to the maximum chip thickness in trochoid milling;
(3)
The feed per tooth in series III is equal to the average chip thickness in trochoid milling.
The experiments in Table 5 were to verify the accuracy of the proposed method for calculating the chip thickness in predicting the cutting force by changing the rotation speed and revolution speed of the tool. The training set c1–c9 was used to identify the cutting force coefficients ( K t and K r ) and the pendulum linear regression model between the line parameters ( ω 1 and ω 2 ); the regression model was then used on the test set d1–d4; the cutting force was simulated using the cutting thickness model in Section 2 and the cutting force model in Section 3.

5. Identification and Comparison of Cutting Force Coefficients

5.1. Identification of Cutting Force Coefficient

The purpose of this section was to investigate whether cutting force coefficients from slot milling could be used interchangeably to predict the forces in trochoid milling. The experiments used here are shown in Table 3 and Table 4 (i.e., a1–a8 and b1–b8).
For general slot milling, in order to obtain the cutting force coefficient during the cutting process, a full immersion experiment was carried out, the cutting force was collected and decomposed into tangential and radial components, and then the data were divided into individual chips, and the one with five revolutions of the tool was selected. As shown in Figure 8b, the equivalent cutting thickness model in Formula (14) was used to calculate the instantaneous cutting thickness during slot milling. θ varies between 0 ° 180 ° , and the chip thickness changes with time. The trend is shown in Figure 8a. The cutting force coefficient corresponding to each discrete rotation angle was calculated using Equation (15), and finally, the average cutting force coefficient of five rotations of the tool was selected. When conducting the experiment, change the blade for each experiment, so the cutting force edge coefficients K t e and K r e can be ignored in Equation (10)).
h = f z sin θ
{ K t = F T b h ( t ) g ( t ) K r = F R b h ( t ) g ( t )
The above method of calculating the cutting force coefficient by using a limited number of tool rotations is only suitable for general slot milling, because in the slot milling process, the variation law of the cutting thickness of each chip is constant. For trochoid milling, as shown in Figure 9, the change of chips means the change in the cutting force coefficient in one trochoid cycle, so the cutting force coefficient during trochoid milling cannot be solved using a limited number of tool rotations. Instead, it is carried out in one full trochoid cycle, and the variation in the cutting force with time in one cycle is shown in Figure 9. Using the chip thickness model in Section 2, the chip thickness is known at each discretized tool angle position. The cutting force in the X and Y directions was converted into tangential and radial cutting forces by using the formula, and then the cutting force coefficient of the entire cycloid cycle was calculated by Formula (13), and the average value was finally obtained.

5.2. Comparison of Cutting Force Coefficients between Slot Milling and Trochoid Milling

The cutting force coefficients for slotting and trochoid milling were compared using the bar graphs in Figure 10, and Table 6 presents the slotting experiments (b1–b8) and trochoid milling experiments (a1–a8) for each series and the average error. According to the series III experiments, there was a 23% error in K t and a 22% error in K r . Series I and series II experiments had small errors in predicting the tangential cutting force coefficient with errors of 7% and 5%, but large errors in predicting the radial cutting force coefficient, with errors of 35% and 21%. As shown in Figure 10 in general, the tangential cutting force coefficient K t and radial cutting force coefficient K r predicted by the slot milling experiment will be too large, so the cutting force coefficient obtained from the slot milling experiment is not and should be replaced with the cutting force factor for trochoid milling.

6. Trochoid Milling Force Simulation

6.1. Fitting of Cutting Force Coefficients

In Section 4, it was shown that the cutting force coefficients extracted in slot milling cannot be used to predict the cutting forces during trochoid milling, therefore, a separate set of experiments for trochoid milling are required to establish the cutting force coefficients and the regression equation between the tool path parameters. The experiments used in this section are given in Table 5, using nine different tool revolution speeds and machine tool speeds as a training set, and using four sets of parameters different to the test set. As a test set, the cutting force coefficient obtained in the test set is shown in Figure 11. It can be seen from the figure that under the same tool revolution speed, the tangential force coefficient F t remained unchanged, while the radial cutting force coefficient F r increased with the tool rotation speed. However, according to the cutting force coefficients in the process of cycloid milling with different rotation and revolution speeds, a generalized linear model suitable for each coefficient can be obtained such as Equation (16). Using this equation, the cycloid with known parameters can be obtained. The cutting force coefficient of milling is substituted into the dynamic cutting force model in Equation (3) to predict the cutting force during trochoid milling.
{ K t = 271 ω 2 + 3254 ,    R 2 = 91 % K r = 322.7 ω 2 + 0.68 ω 1 + 932.8    R 2 = 92 %

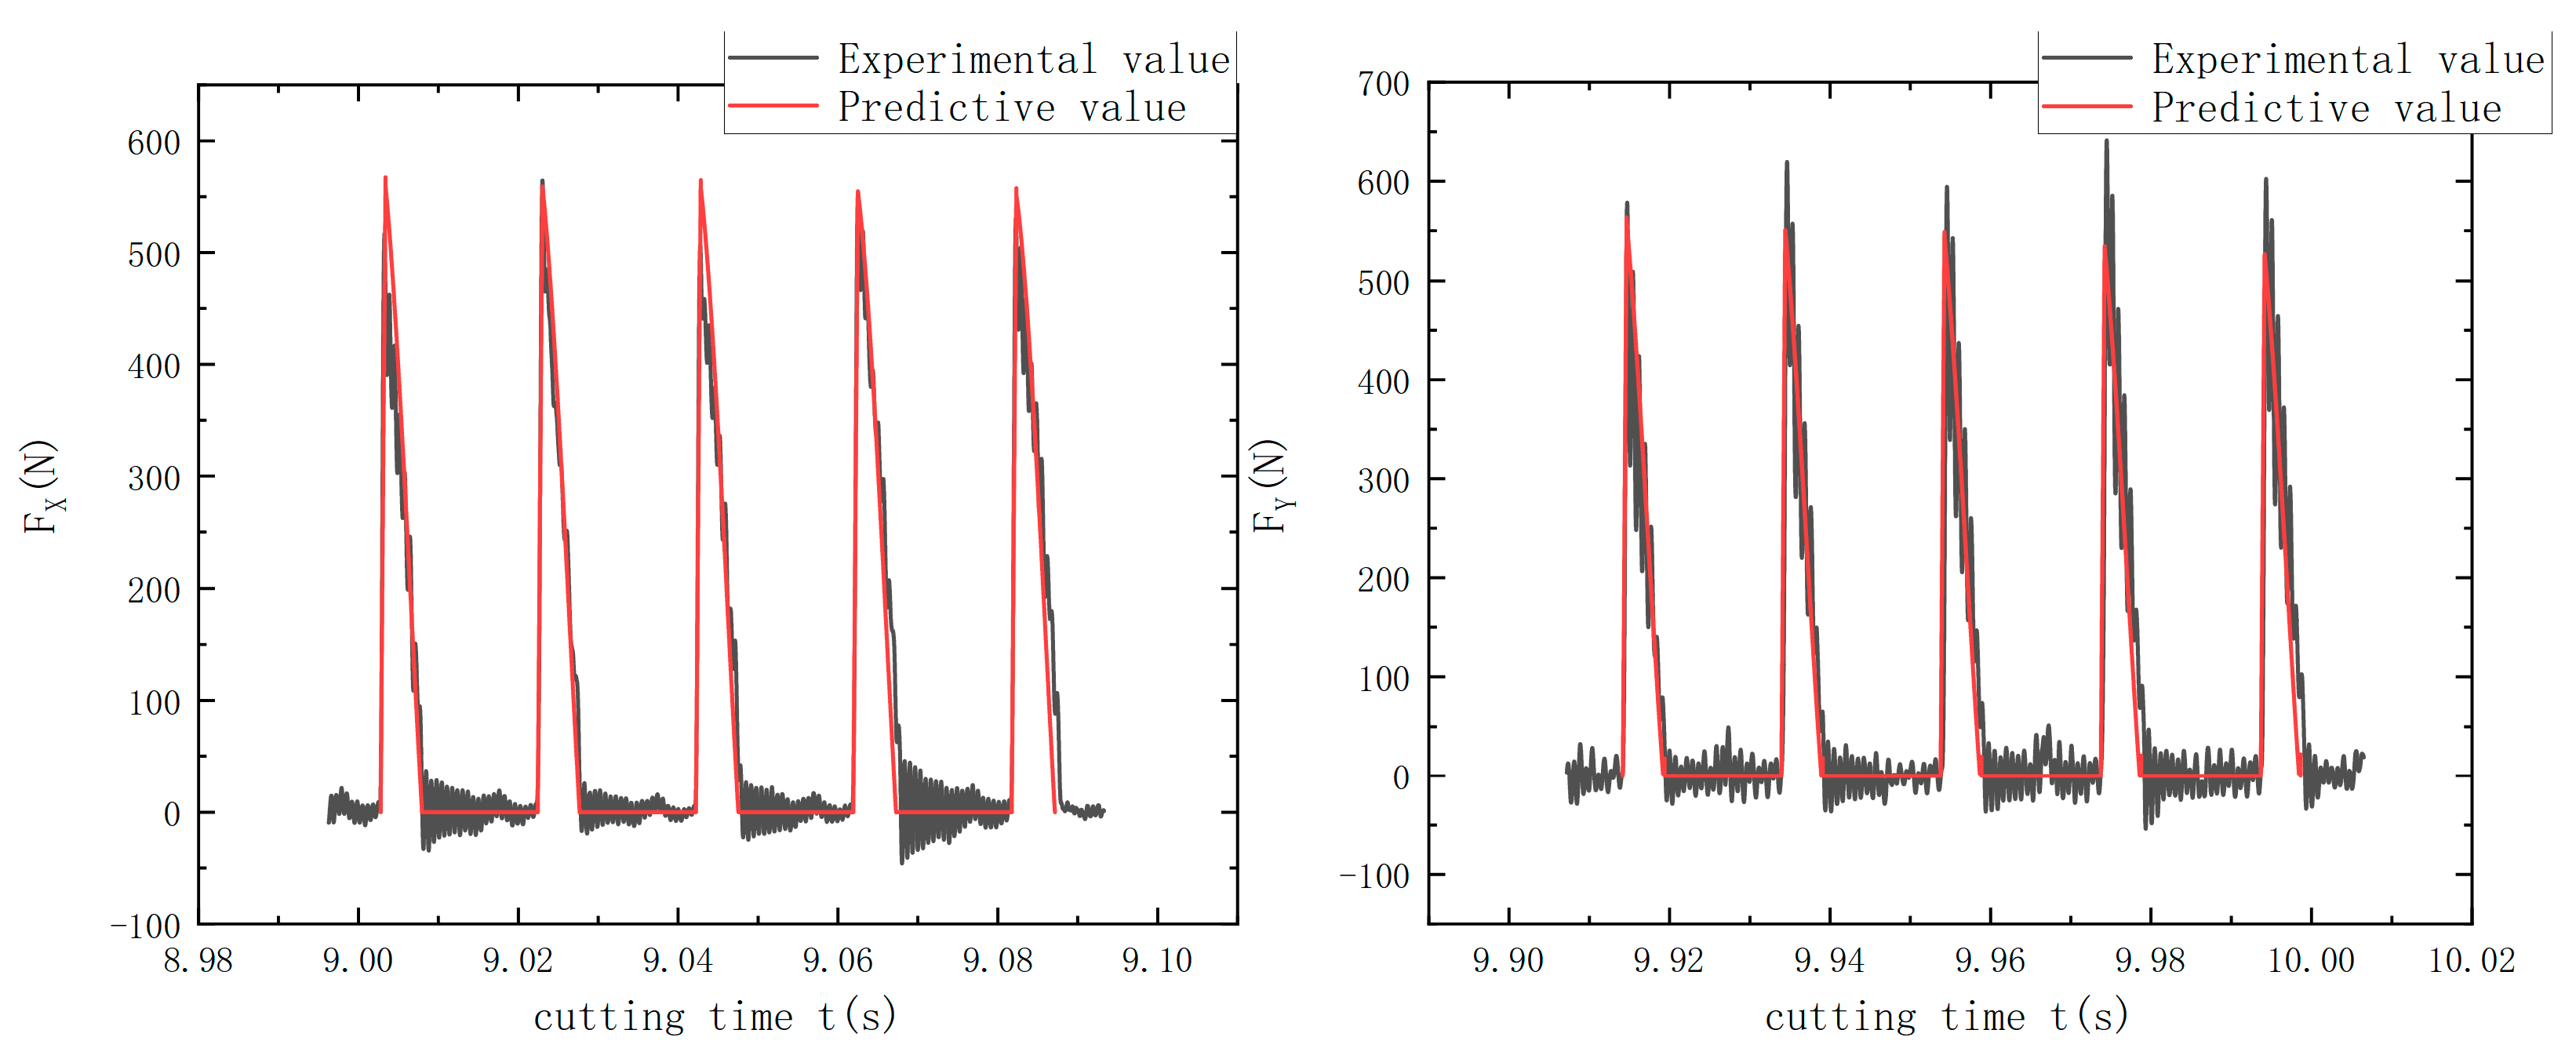
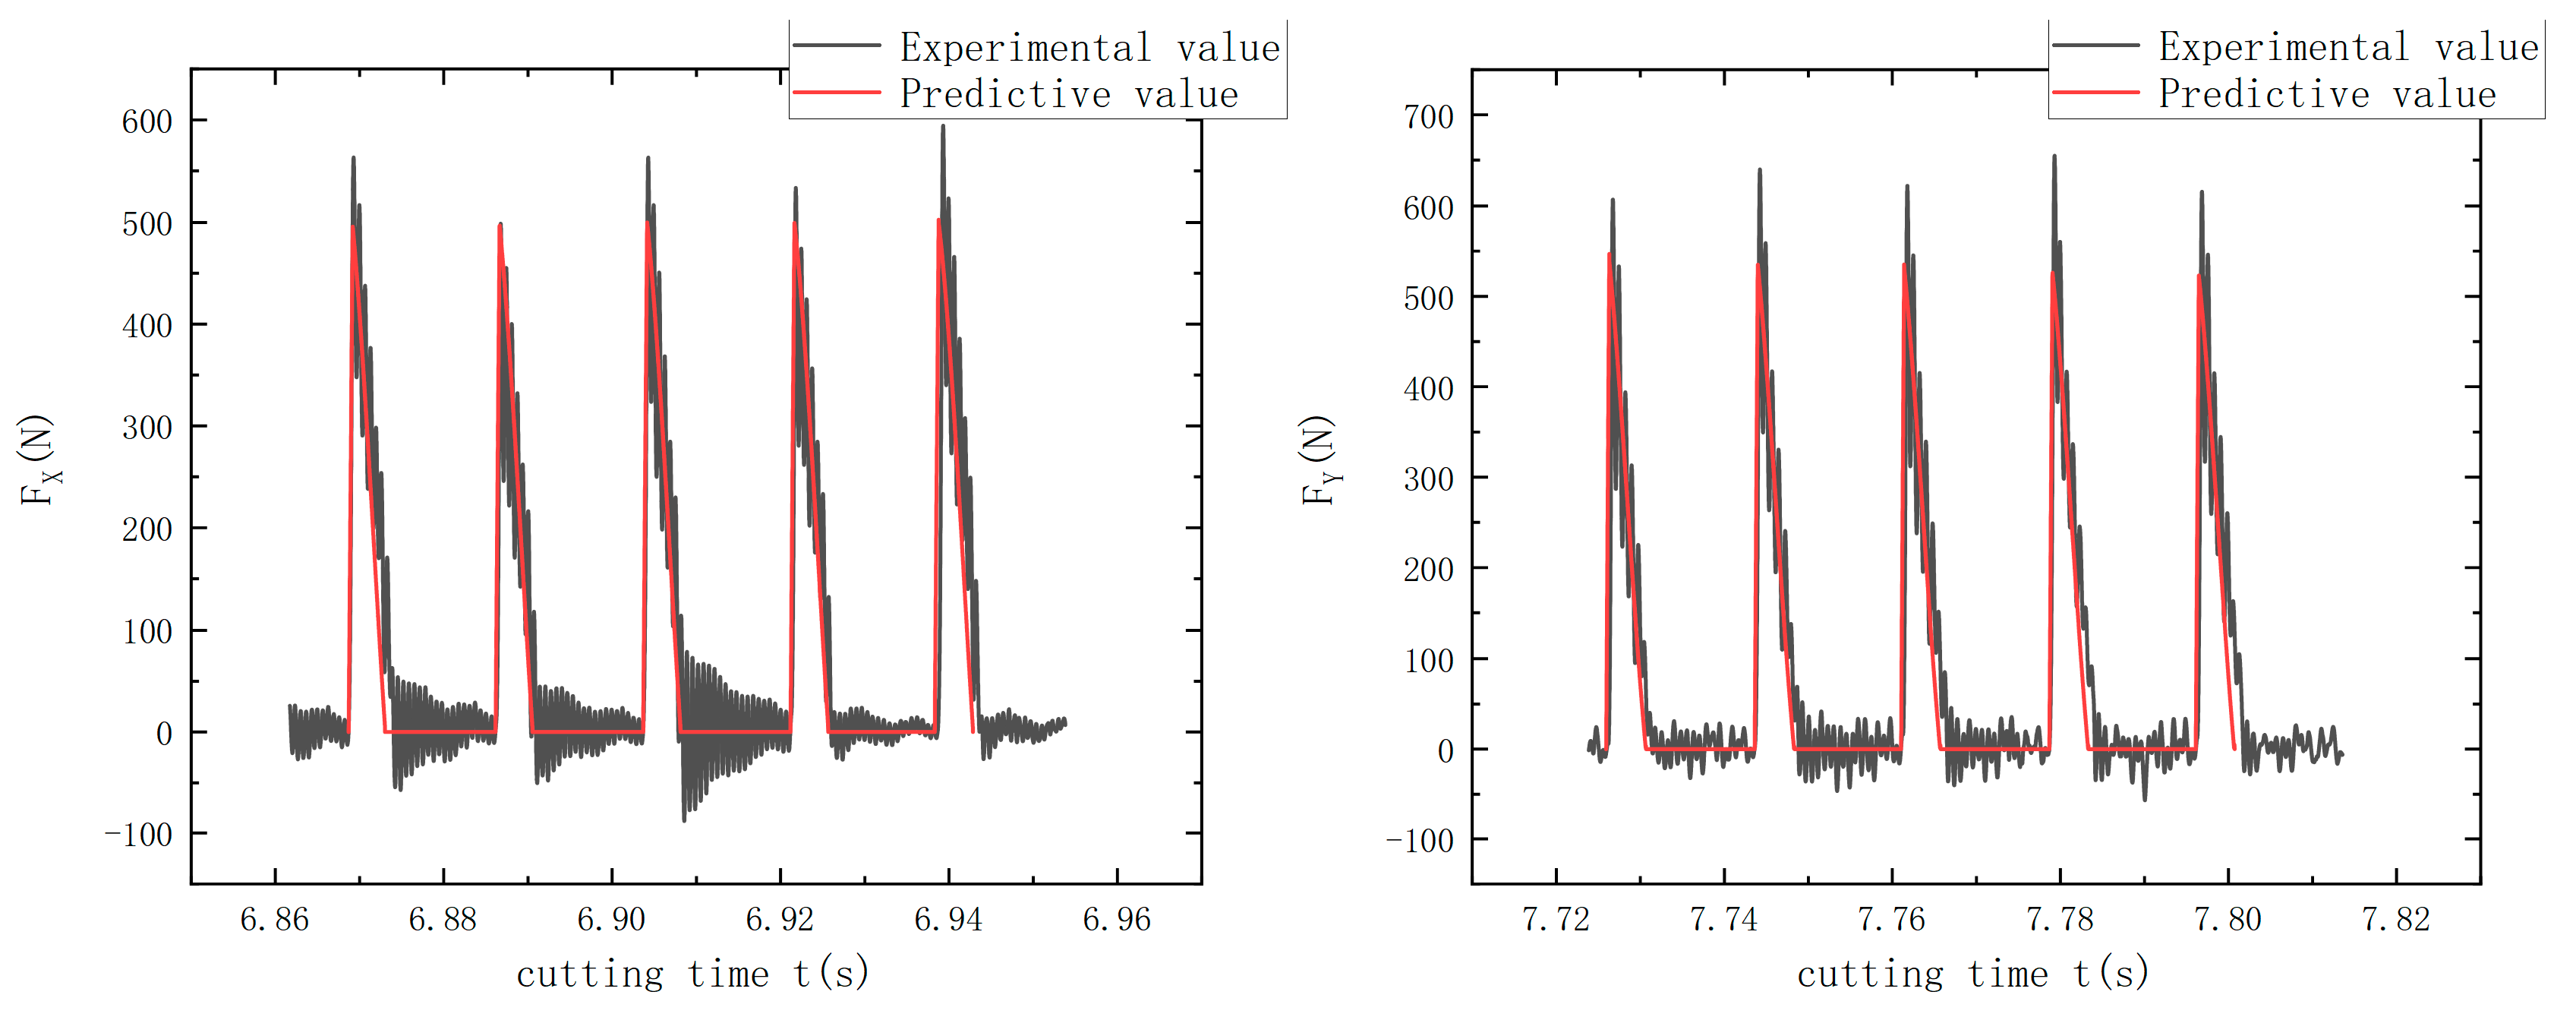
6.2. Comparison of Simulated and Experimental Values of Cutting Force

The comparison between the experimental value and the predicted value of trochoid milling in the d1–d4 experiments is shown in the figure. It can be seen from Figure 12, Figure 13, Figure 14, Figure 15 and Figure 16 that the overall trend of the experimental value and the predicted value is consistent, but under each processing parameter, the experimental value and the predicted value. There are two reasons for the error. One is that there is a certain error when fitting the cutting force coefficient of trochoid milling. The other is that the tool vibration and the vibration of the system are not considered in the model. For the average of the four groups of comparisons, the error was 12%, indicating that the chip thickness model and cutting force model established in this paper had high accuracy.

7. Conclusions

In this paper, based on the complex tool trajectory in the trochoid milling process, the instantaneous cutting thickness model and cutting force model in the trochoid milling process were established. Experiments were designed to investigate the relationship between the trochoid milling parameters (i.e., tool rotation speed and tool revolution speed) and the tangential and radial cutting force coefficients, and finally the previously established model was verified. It was verified that the model developed in this paper had a high accuracy. The specific research results are as follows:
(1)
Based on finding the self-intersection points between the tool trajectories as well as the cross-intersection points, a numerical algorithm was designed to construct the geometry of each chip during milling and then solve the cutting thickness at each moment by solving the transcendental equation.
(2)
Comprehensive experiments were designed to investigate the correlation between the cutting force coefficient and the tool path. For the extraction of the cutting force coefficient, eight trochoid milling experiments and 24 slot milling experiments were performed. By comparing the cutting force coefficients extracted from the slot milling and trochoid milling experiments, it was found that there was an error of 5–23% between the tangential cutting force coefficients and 21–35% between the radial cutting force coefficients, so the coefficients extracted from the slot milling could not be used in the trochoid milling cutting force prediction. In addition, nine experiments were designed to establish a linear regression model between the trochoid milling tool path parameters and the cutting force coefficient, and the variance of the model was 92% with high accuracy.
(3)
Four new test experiments were designed and the resulting linear regression models were used to predict the cutting force coefficients, which were used in the cutting force model. The simulated cutting force was compared with the experimentally measured cutting force, and the error between them was analyzed to be 12%. This proves that the established model has a high accuracy.
In this paper, the focus was limited to the prediction of cutting forces during trochoid milling under ideal conditions, without considering the vibration of the tool as well as the machine tool, therefore, in the subsequent study, we will investigate the effect of tool vibration on the instantaneous cutting thickness as well as the cutting forces.

Author Contributions

Conceptualization K.Z. and S.D.; Methodology, K.Z.; Software, S.D.; validation, S.D. and K.Z.; Formal analysis, K.Z.; Investigation, K.Z.; Resources, C.Z.; Data curation, K.Z.; Writing—original draft preparation, K.Z.; Writing—review and editing, C.Z.; Supervision, C.Z.; Project administration, C.Z.; Funding acquisition, C.Z. All authors have read and agreed to the published version of the manuscript.

Funding

This research was funded by Shaanxi Province Qin Chuang Yuan Landing Gear Performance Test and Equipment Research Scientists and Engineers Team, grant number 2022KXJ-139; and Key technology and development of five-axis linkage CNC boring and milling machine, grant number 2019ZDLGY01-03.

Data Availability Statement

All data used in this study are declared in the paper.

Conflicts of Interest

The authors declare no conflict of interest.

References

  1. Wang, H.Y. Research on the Dynamics of Helical Hole Milling in Difficult-to-Machine Materials; Tianjin University: Tianjin, China, 2012. [Google Scholar]
  2. Li, M. Manufacturing Technology for Large Aircraft Undercarriage. Aerosp. Manuf. Technol. 2008, 21, 68–71. [Google Scholar]
  3. Liu, H.X.; Dong, T.; Zhang, X.W.; Liu, Z.F.; Shi, H. Laser Cladding Preparation WC/Co50/Al Microstructure and Cutting Performance of Cemented Carbide Coated Tools. Chin. J. Lasers 2017, 44, 104–112. [Google Scholar]
  4. Wu, D.X.; Zhang, D.H.; Yao, C.F. Effect of Turning Surface Integrity of GH4169 Super alloy on Fatigue Properties. J. Aeronaut. Mater. 2017, 37, 59–67. [Google Scholar]
  5. Liao, L.J.; Ren, J.G.; Yang, J.F. Trochoid Milling Technology and Its Application in Aero engine Machining. Aerosp. Manuf. Technol. 2015, 47–50. [Google Scholar] [CrossRef]
  6. Hou, S.; Cai, Z.; Zhu, Y.; Zhao, Q.; Chen, Y.; Gao, H.; Wang, H.; Li, J. Elasto Plastic Fracture Mechanics Analysis of the Effect of Shot Peening on 300M Steel. Materials 2021, 14, 3538. [Google Scholar] [CrossRef] [PubMed]
  7. Guo, P.; Deng, L.; Wang, X.; Li, J. Modelling of dynamic recrystallization kinetics of 300M steel at high strain rates during hot deformation. Sci. China Technol. Sci. 2019, 62, 1534–1544. [Google Scholar] [CrossRef]
  8. Skubisz, P.; Sinczak, J. Properties of direct-quenched aircraft forged component made of ultrahigh-strength steel 300M. Aircr. Eng. Aerosp. Technol. 2018, 90, 713–719. [Google Scholar] [CrossRef]
  9. Bag, A.; Delbergue, D.; Ajaja, J.; Bocher, P.; Lévesque, M.; Brochu, M. Effect of different shot peening conditions on the fatigue life of 300M steel submitted to high stress amplitudes. Int. J. Fatigue 2019, 130, 105274. [Google Scholar] [CrossRef]
  10. Ajaja, J.; Jomaa, W.; Bocher, P.; Chromik, R.R.; Brochu, M. High cycle fatigue behavior of hard turned 300 M ultra-high strength steel. Int. J. Fatigue 2020, 131, 105380. [Google Scholar] [CrossRef]
  11. Zhang, H.P.; Ding, C.L.; Shi, R.X.; Liu, R.H. Optimization of Technological Parameters and Application Conditions of CMQL in High-Speed Milling 300M Steel. Integr. Ferroelectr. 2021, 217, 141–153. [Google Scholar] [CrossRef]
  12. Zhang, H.P.; Zhang, Q.Y.; Ren, Y.; Shay, T.; Liu, G.L. Simulation and Experiments on Cutting Forces and Cutting Temperature in High Speed Milling of 300M Steel under CMQL and Dry Conditions. Int. J. Precis. Eng. Manuf. 2016, 19, 1245–1251. [Google Scholar] [CrossRef]
  13. Zhen, C.Y.; Yang, X.; Yan, L.; Jin, X.; Wang, Q.D. The effect of milling parameters on surface integrity in high-speed milling of ultrahigh strength steel. Procedia CIRP 2018, 71, 83–88. [Google Scholar]
  14. Šajgalík, M.; Kušnerová, M.; Harničárová, M.; Valíček, J.; Czán, A.; Czánová, T.; Drbúl, M.; Borzan, M.; Kmec, J. Analysis and Prediction of the Machining Force Depending on the Parameters of Trochoid Milling of Hardened Steel. Appl. Sci. 2020, 10, 1788. [Google Scholar] [CrossRef] [Green Version]
  15. Zhang, X.H.; Peng, F.Y.; Qiu, F.; Yan, R.; Li, B. Prediction of Cutting Force in Trochoid Milling Based on Radial Depth of Cut. Adv. Mater. Res. 2014, 852, 457–462. [Google Scholar] [CrossRef]
  16. Pleta, A.; Nithyanand, G.; Niaki, F.A.; Mears, L. Identification of optimal machining parameters in trochoid milling of Inconel 718 for minimal force and tool wear and investigation of corresponding effects on machining affected zone depth. J. Manuf. Process. 2019, 43, 54–62. [Google Scholar] [CrossRef]
  17. Cai, Y.L.; Zhang, X.G.; Zhang, Z.Z.; Xi, X.L.; Wang, H.T. Analysis of cutting force in trochoidal milling and grooving. J. Beijing Jiao Tong Univ. 2022, 46, 148–157. [Google Scholar]
  18. Otkur, M.; Lazoglu, I. Trochoid milling. Int. J. Mach. Tools Manuf. 2007, 47, 1324–1332. [Google Scholar] [CrossRef]
  19. Kardes, N.; Altintas, Y. Mechanics and dynamics of the circular milling process. J. Manu. Sci. Eng. 2007, 129, 21. [Google Scholar] [CrossRef]
  20. Altintas, Y.; Lee, P. Mechanics and dynamics of ball end milling. Trans. ASME 1998, 120, 684–698. [Google Scholar] [CrossRef]
Figure 1. (a) Tool trajectory diagram. (b) Current and previous cycle cut through trajectory.
Processes 10 02617 g001
Figure 2. (a) Self-intersection identification. (b) Selecting the point closest to the extrapolation line.
Processes 10 02617 g002
Figure 3. Single-tooth chip geometry configuration.
Processes 10 02617 g003
Figure 4. Chip geometry.
Processes 10 02617 g004
Figure 5. (a) Double cutter tooth chip shape construction diagram. (b) Double cutter tooth chip area. (c) Variation in the chip thickness in one revolution cycle.
Processes 10 02617 g005
Figure 6. Positive direction of cutting force and rotation angle θ in X–Y coordinates.
Processes 10 02617 g006
Figure 7. (a) Work piece clamping site. (b) Cutting force measurement site.
Processes 10 02617 g007
Figure 8. (a) Chip thickness during slotting; (b) Milling force during slot milling.
Processes 10 02617 g008
Figure 9. Cutting force in one cycle of trochoid milling.
Processes 10 02617 g009
Figure 10. (a) Comparison of the tangential cutting force coefficients between trochoid milling and slot milling. (b) Comparison of the radial cutting force coefficients between trochoid milling and slot milling.
Processes 10 02617 g010
Figure 11. Relationship between the cutting force coefficient and tool rotation and revolution; (a) revolution speed is 0.78 rad/s, (b) revolution speed is 1.57 rad/s, (c) revolution speed is 3.14 rad/s. (d) Relationship between cutting force coefficient and rotation speed.
Processes 10 02617 g011
Figure 12. The comparison between the experimental value and the simulated value of the force in the x direction in experiment d1.
Processes 10 02617 g012
Figure 13. The comparison between the experimental value and the simulated value of the force in the y direction in experiment d1.
Processes 10 02617 g013
Figure 14. The comparison between the experimental value and the simulated value of the force in the x, y direction in experiment d2.
Processes 10 02617 g014
Figure 15. The comparison between the experimental value and the simulated value of the force in the x, y direction in experiment d3.
Processes 10 02617 g015
Figure 16. The comparison between the experimental value and the simulated value of the force in the x, y direction in experiment d4.
Processes 10 02617 g016
Table 1. Chemical composition of 300M (mass fraction %).
ElementCCrNiMnSiMoV
Content0.41–0.460.65–0.951.6–2.00.65–0.901.45–1.800.3–0.4>0.05
Table 2. Mechanical properties of 300M.
Tensile   Strength   δ b / MPa Yield   Strength   ( δ 0.2 / MPa ) Rate of Reduction in Area/% Elongation δ /% Elastic Modulus 103E/MPa
19301620329.2199
Table 3. The experimental design of the cycloid trajectory of the double-edged tool.
NumberFeed Rate v, (mm/s) Tool   Rotation   Speed   ω 1 , ( rad / s ) Tool   Revolution   Speed   ω 2 ,   ( rad / s ) Depth of Cut b, (mm)Machine Speed, (RPM) Machine   Feed   Rate   f r ,   ( mm / min ) Feed   Per   Tooth   f z ,   ( mm / tooth )
a10.5125.661.57080.5120016270.68
a20.5146.611.57080.5140016270.58
a30.5167.551.57080.5160016270.51
a40.5188.491.57080.5180016270.45
a50.5209.441.57080.5200016270.41
a60.5230.381.57080.5220016270.37
a70.5240.861.57080.5230016270.35
a80.5251.331.57080.5240016270.34
Table 4. The experimental design of double-edged tool slot milling.
NumberFeed Rate v, (mm/s)Depth of Cut b, (mm)Machine Speed, (RPM) Feed   Per   Tooth   f z ,   ( mm / tooth )
IIIIII
b10.50.512000.680.490.24
b20.50.514000.580.420.21
b30.50.516000.510.370.18
b40.50.518000.450.330.16
b50.50.520000.410.300.14
b60.50.522000.370.270.13
b70.50.523000.350.360.12
b80.50.524000.340.250.11
Table 5. The experimental design of the double-edged tool to verify the chip thickness model.
NumberFeed Rate v, (mm/s) Tool   Revolution   Speed   ω 2 ,   ( rad / s ) Machine Speed, (RPM)Depth of Cut b, (mm) Feed   Per   Tooth   f z ,   ( mm / tooth )
c10.50.7812000.5820
c20.51..5712000.51627
c30.53.1412000.53205
c40.50.7816000.5820
c50.51.5716000.51627
c60.53.1416000.53205
c70.50.7820000.5820
c80.51.5720000.51627
c90.53.1420000.53205
d10.51.5713000.51627
d20.51.5715000.51627
d30.51.5717000.51627
d40.51.5719000.531627
Table 6. Error comparison between the slotting and trochoid milling cutting force coefficients.
Error between Cutting Force Coefficients K t   ( N / m m 2 ) K t   ( N / m m 2 )
IIIIIIIIIIII
15915302523
212417311125
310122361524
49320271525
59124382323
66528342019
72122311725
821035473510
Average error (%)7523352122
Publisher’s Note: MDPI stays neutral with regard to jurisdictional claims in published maps and institutional affiliations.

