Abstract
A 2020 investigation into air quality in urban areas found that nitrogen oxide and PM10 concentrations were above average. With the exception of summer, three seasons were found to have the highest nitrogen oxide concentrations, with a significant decrease during COVID-19. The significant PM10 relationship showed how communication affects the worsening of air quality, especially in the winter. The highest concentration of nitrogen oxide of 53.99 µg m−3 indicated the possibility of advection of pollutants from outside the agglomeration. The highest level of nitrogen oxide content, 95.95 µg m−3 in the atmospheric air, confirmed the significant presence of pollutants of communication origin. The advancement of electro-mobility and the application of cutting-edge technologies alongside renewable energy sources may contribute to a decrease in the amount of harmful substances released into the atmosphere.
1. Introduction
Global environmental concerns include air contaminants, which, because of their transboundary reach, contaminate vast areas and endanger the health of those exposed to them [1,2]. Urban populations are nonetheless exposed to high pollutant concentrations that exceed EU regulations to protect human health [3], despite efforts by European (EU) governments to reduce air pollutant emissions and enhance air quality.
The size and urbanization of the city have a significant impact on the output of air pollutants (industrial plants, power plants, factories). Sulfur oxides, nitrogen oxides and carbon oxides are the principal pollutants in gas form, while volatile oxides, primarily created during the combustion of fuels, are the main pollutants in dust form [4]. In Poland and throughout Europe, there are two main dust fractions that are distinguished and used as a component of air quality monitoring in urban areas: PM10 (coarse fraction), whose dust particles have aerodynamic diameters below 10 µm, and PM2.5 (fine fraction), whose dust particles have aerodynamic diameters below 2.5 µm [5]. Contrary to popular assumption, human activities such as driving and heating homes and apartments are the main producers of air pollution.
Nitrogen (78.08 vol%), oxygen (20.95 vol%), argon (0.934 vol%) and carbon dioxide (0.034 vol%) make up the bulk of dry air. Per volume of air, vapor content ranges from 0.1% to 5% [6]. The primary gases and elements of air are only found in trace amounts. Only carbon dioxide can considerably modify the basic composition of the air at the Earth’s surface. These modifications suggest that the nitrogen/oxygen ratio of the entire air mass has slightly decreased [7].
The study’s goal was to factor-assess the impact of the Krakow agglomeration and Bacau County (cities with number of inhabitants above 500,000) on atmospheric air quality for the entire year of 2020, including COVID-19.
2. Materials and Methods
2.1. Krakow Agglomeration
The Krakow agglomeration served as the study region, and an air quality analysis was created for it, taking into consideration the number of registered vehicles between January and December 2020 as well as a few indicators of chemical pollution and ambient air temperature. According to the investigation, the State Inspectorate for Environmental Protection in Krakow collected air quality data from two locations. Additionally, two points were used to gather meteorological data from the Institute of Meteorology and Water Management. However, information on the number of automobiles registered in Krakow was sourced from the city’s department of communication.
The data from January to December 2020 for the analysis were obtained from two measurement stations: air quality monitoring located in Krakow at Bujaka St., the station type is the background with the following coordinates Φ 50.010575, λ 19.949189 (P1), and Bulwarów St., a type of industrial station with geographical coordinates: Φ 50.069308, λ 20.053492 (P2) (Figure 1). The results of air pollution were referred to as the limit values specified in the Notice of the Minister of Climate and Environment of April 12, 2021, on the publication of the uniform text of the Regulation of the Polish Minister of the Environment on the levels of certain substances in the air [8].
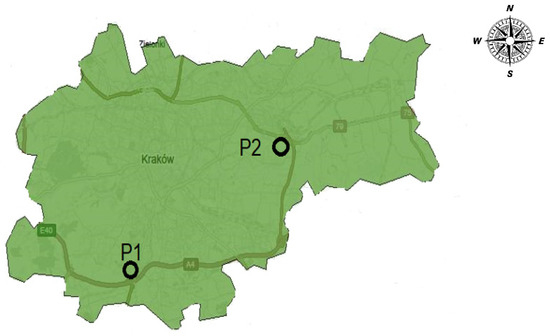
Figure 1.
Location of air quality monitoring stations in the Krakow Agglomeration.
The following indicators were used to analyse the air quality: PM10—suspended dust, As (PM10)—arsenic in suspended dust, C6H6—benzene, Cd (PM10)—cadmium in suspended dust, Ni (PM10)—nickel in suspended dust, Pb (PM10)—lead in suspended dust, NO—nitrogen oxide, NO2—nitrogen dioxide, NOX—nitrogen oxides, SO2—sulphur dioxide. In the conducted studies, the indicated indicators were also used by some researchers [1,9,10].
2.2. Bacau County
The air quality monitoring systems that are a part of the National Air Quality Monitoring Network (RNMCA) and are installed in Bacau County give information regarding the quantity of pollutants at the ground level (at the level of the air that is inhaled) [11].
The values for the following key meteorological factors for sampling, including wind direction and speed and temperature, are continuously recorded in order to characterize the sampling conditions and the correlation of the pollutant concentration level with the pollution sources.
In 2020, Bacau County’s air quality was measured continuously using two automatic stations that are a part of the National Network for Air Quality Monitoring (RNMCA) and are situated at two separate locations throughout the county (Figure 2). Table 1 provides a description of the measurement points.
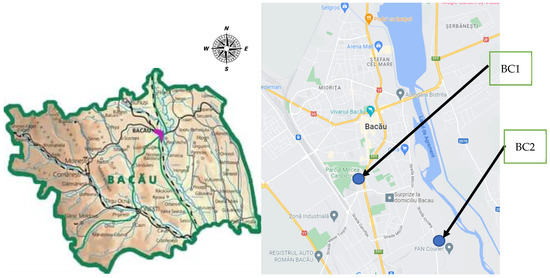
Figure 2.
Location of air quality monitoring stations in Bacau County.

Table 1.
The description of the measurement points [12].
The monitored pollutants, the measurement methods, the limit values, the alert and information thresholds, as well as the long-term objectives and criteria for the location of the monitoring points, shall be established by national atmospheric protection legislation and comply with the requirements of European regulations and national legislation by Romanian Law no. 104 of 15 June 2011 on ambient air quality, as subsequently amended and supplemented [13].
2.3. Statistics
A description statistical analysis was regarded maximum, minimum, average and standard deviation (SD) on the base average monthly data from 2022. The test probability p as significant was assumed at the level of <0.05. Parametric tests due to the abnormal distribution of most of the analyzed indicators, including physicochemical ones, were used [14].
Non-parametric tests were used due to the lack of normality of the distribution of analyzed results air pollution of the Shapiro–Wilk test. Similarly, as the normal distribution condition was not met, the Spearman’s rank method was used (n = 12) together with the assessment of its value to check the relationship between the above-mentioned variables [15]. The Statistica 13 software (StatSoft, Krakow, Poland, StatSoft, Inc., Tulsa, OK, USA) was used for statistical analysis [14].
2.4. Characteristics of the Selected Agglomeration
2.4.1. Location—Krakow Agglomeration
The agglomeration includes the county-owned portion of Krakow, which is the second-largest city in terms of both area and population in Poland and one of the most significant in all of Europe. Krakow is situated on the Vistula River in the south of the country (Figure 3a).
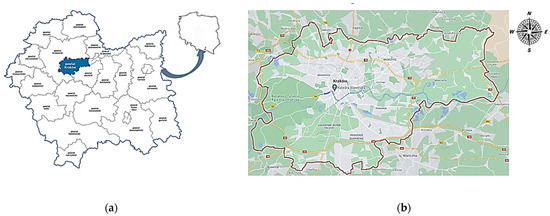
Figure 3.
Borders of the Krakow Agglomeration (a); Location of the Krakow agglomeration against the background of the Lesser Poland Voivodeship (Southern Poland) (b).
Generally, Krakow is situated in a basin at the junction of such geographic lands as the Zachodniobeskidzkie Foothills, Krakowsko-Częstochowska Upland and Sandomierz Basin (Figure 3b). As a result, it has a very good communication location, connecting transit nodes and tourist routes. There are 23 universities in Krakow. The city implements the concept of a “smart city”, which is connected with the idea of a “city of the good life” [8].
2.4.2. Location—Bacau County
Bacau County, which is in Moldova’s central region and is a component of Romania’s North-East Development Region, has a 6621 km2 area (Figure 4a). Bacau County is bordered to the west by Covasna and Harghita counties, to the east by Vaslui county, to the north by Neamt county and to the south by Vrancea county (Figure 4b).
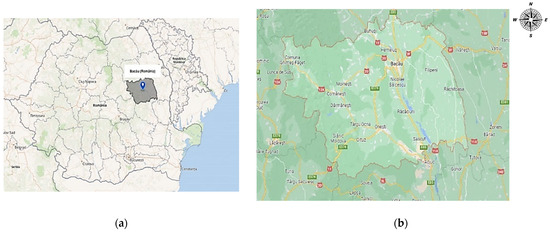
Figure 4.
Location of Bacau County at the level of Romania Country (a) and the borders of Bacau County (b).
The most significant industrial hub of Moldova is still located in Bacau County, one of the most industrialized areas in the area. Three municipalities, five cities and 85 communes make up the primary administrative subdivisions. The county seat is represented by Bacau, one of Moldova’s major cities with access to a number of European routes [11].
2.5. Climate
2.5.1. Krakow Agglomeration
Krakow has a cloud cover that is comparable to other locations in the country. We can see clouds approximately 160 days a year, with the majority of those days happening in the winter. There are over 37 days with clear skies, with the most occurring in September. The Vistula valley, where there are also the most days with fog, has the fewest days with clear skies. The formation of the so-called urban heat island affects the temperature increase by 1–2 °C in the most built-up places and where there are the most house furnaces, in addition, the specific configuration of residential building divisions—housing estates causes changes in air circulation and changes in the direction and speed of wind [16].
Due to the agglomeration’s location in the valley between the uplands and the Carpathians, where the values are defined by minimal values of annual amplitude, the yearly fluctuation of air humidity exhibits greater differentiation than in the centers located in the lowlands.
The driest time of year is summer as well as the last part of spring; relative humidity values are the lowest during these times, and insufficient humidity levels are the highest. There are various changes in humidity throughout the day during warm weather. Primarily in the spring and fall, air drying takes place [17].
2.5.2. Bacau County
Bacau County’s climate is an illustration of a progressive change from a strong continental climate in the east to a mild one in the west. The relief created by height, fragmentation, and exposure brings several regional subtleties and alters the climate in different parts of Bacau County. As a result, various distinct climatic regions can be identified, including the climate of the highlands, the sub-Carpathian region, the Tutovei Hills, and the Siret Valley.
The air temperature registers average annual values between 9 °C (in the eastern half of the county) and 2–3 °C (western extremity) [12].
The atmospheric precipitation regime is between 550 mm (at the eastern limit of the county) and 1000 mm on the mountain peaks. The average annual quantities in July are between 60 and 100 mm (West), reaching 20–30 mm in the East. The average annual quantities in January are between 30 and 60 mm.
2.6. Communication
2.6.1. Krakow Agglomeration
Krakow has the greatest rail links of any large Polish city, it is connected to the majority of other major cities, and it has connections for international passenger travel. Together with the bus station and a connection to the Balice airport, the major train station in Krakow serves as the city’s communication hub. The Krakow agglomeration has a sophisticated transportation system. The city had 169 bus lines and 21 tram lines as of the year 2020. The road system in this area is remarkably large. Both the S7 and the A4 highways pass through Krakow, with the A4 running from west to east and the latter from north to south. This makes travelling between big cities efficient.
The public transport infrastructure includes “Park and rides” car parks, which encourage you to leave your vehicles in designated places and use public transport. They are located at Czerwone Maki and the Balicka Stock Exchange. There is a place called “Kiss and Ride” in the city, where you can pick up and drop off passengers safely [18].
2.6.2. Bacau County
In Bacau County, there is a comprehensive rail, road and airway system.
A network of 455 km long county, national and European roads (E85, E574) runs across the county of Bacau. The municipality of Bacau, which serves as the county seat, is situated where major roads and airports converge. North–south and east–west railroad and road arteries of importance to the United States and Europe pass through the city. The Pan European Corridor No. IX’s Pan European Road E85 (DN2) travels via Bacau in a north–south direction and connects to the main corridor that travels through Moldova to Greece, Bulgaria, Ukraine and ultimately Russia. Regarding railway transport, Bacau is located on the Pan European Corridor IX of the railway network, which crosses Romania from south to north and unites the cities Giurgiu, Bucharest, Ploiesti, Buzau, Focsani, Bacau, Iasi [11].
Air traffic is served by George Enescu Bacau International Airport. It has a runway which is 2500 m long and 80 m wide and a total area of over 200 ha, annually serving over 200,000 passengers.
3. Results and Discussions
3.1. Atmospheric Air Quality—Krakow Agglomeration
Sources of PM are both natural and anthropogenic [17]. The mean concentration of PM10 was exceeded at two research stations (Figure 5). The highest was found in January with a value of 58.59 µg m−3 at the station Bujaka Str. and 55.09 µg m−3 at Bulwarow Str., at the permissible concentration of 40 µg m−3. The lowest with a concentration close to 18 µg m−3. The permissible level of airborne dust concentration was also exceeded in November (background station) and December (background station and industrial station). In the analyzed period, PM10 concentrations of over 15 µg m−3 are noticeable.
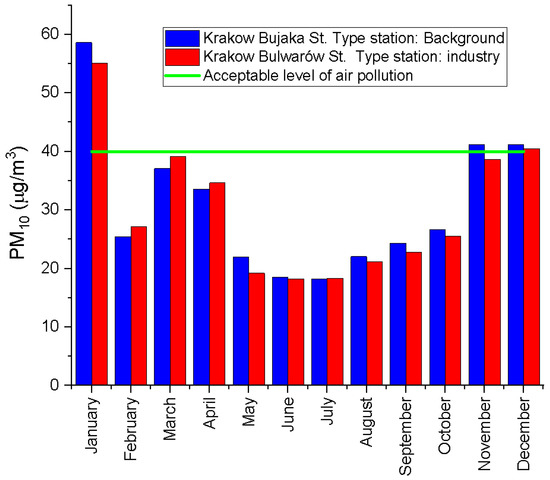
Figure 5.
Average PM10 concentration in individual months of 2020.
The station at Bulwarów Str. recorded the greatest concentration of benzene in December with a value of 3.68 µg m−3, and the station at Kraków Bujaka Str. recorded the lowest concentration in May with a value of 0.25 µg m−3 and an allowed concentration of 5 µg m−3. This demonstrates that the amount of benzene in the air has increased (Figure 6).
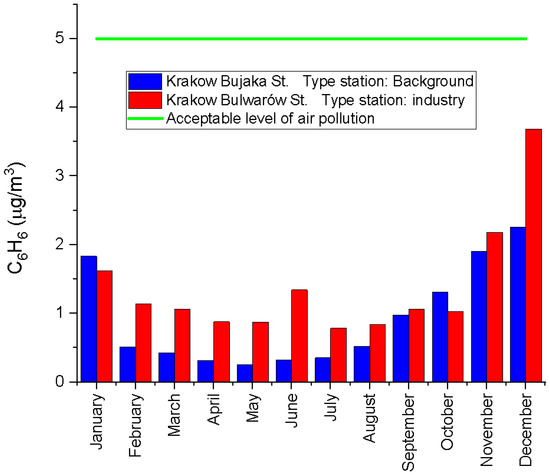
Figure 6.
Average concentration of C6H6 in individual months of 2020.
The station on Kraków Bulwarów Str. had the greatest average As concentration, 1.71 ng m−3, while the station on Bujaka Str. had the lowest average As concentration, 1.66 ng m−3, with an allowed concentration of 6 ng m−3 (Figure 7).
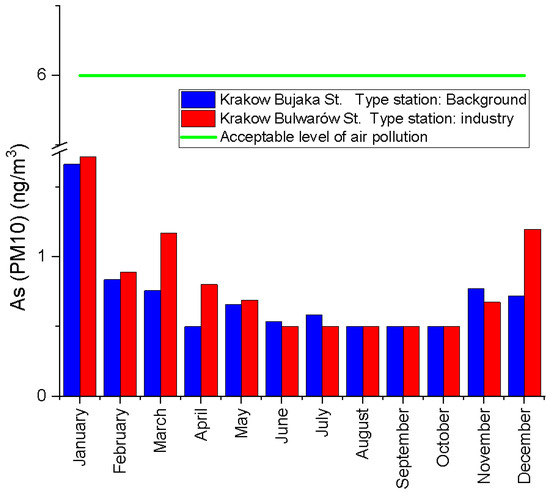
Figure 7.
Average concentration of As (PM10) in individual months of 2020.
Differently, the highest concentration of Ni was recorded in October at the station Bulwarów Str., with a value of 2.34 ng m−3, while the lowest was in February at the station Bujaka Str., with a value of 0.67 ng m−3 at the permissible concentration of 20 ng m−3 (Figure 8).
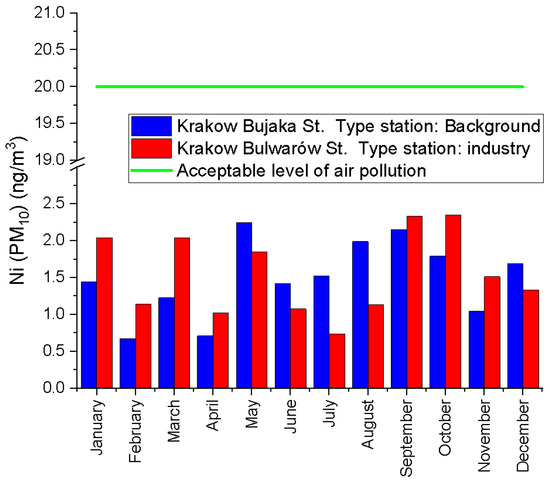
Figure 8.
Average daily concentration of Ni (PM10) in individual months of 2020.
The highest average daily concentration of Cd in dust was recorded in December at the background station at a value of 0.64 ng m−3, while the lowest was in June at the representative station for air quality assessment at 0.17 ng m−3 at the reported concentration of 5 µg m−3 (Figure 9).
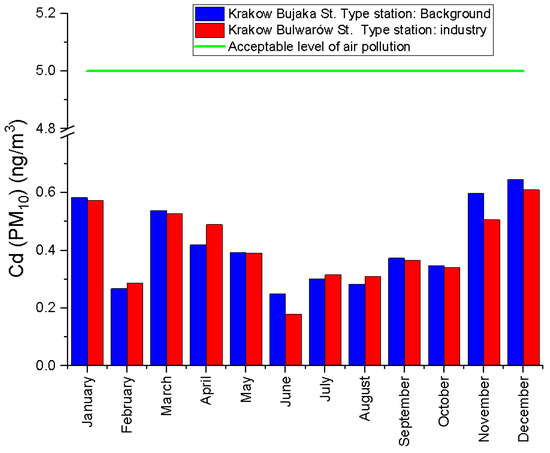
Figure 9.
Average daily concentration of Cd (PM10) in individual months of 2020.
The results on lead concentration during the test did not show any exceeding of the limit values. The highest concentration was recorded in December at an industrial station with a concentration of 0.01446 µg m−3, while the lowest was in September at a station qualified for background testing, with a value of 0.00399 µg m−3 at the permissible concentration of 0.5 µg m−3 (Figure 10).
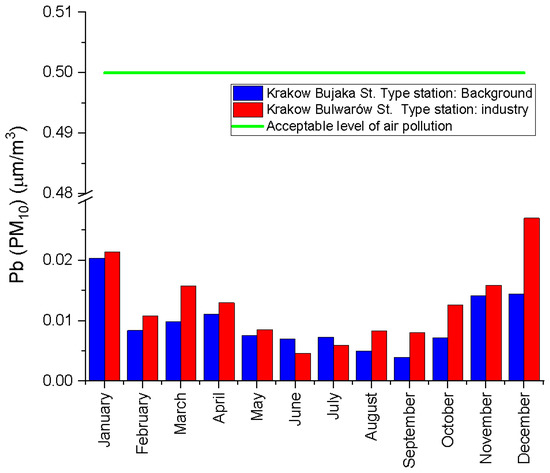
Figure 10.
Average concentration of Pb (PM10) in individual months of 2020.
In January, March, September, November and December, the background station’s average nitric oxide concentration was higher.
The highest concentration was recorded in January in the mentioned station with a value of 53.99 µg m−3, and at the industrial station with a value of 43.11 µg m−3 with a permissible concentration of 30 µg m−3. The permissible level of air pollutants was also exceeded at this station only in December. Generally, a decrease in NO concentration by more than 10 µg m−3 is noticeable (Figure 11).
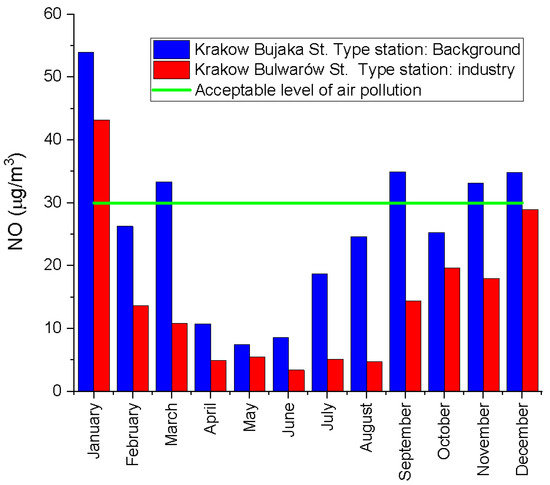
Figure 11.
Average NO concentration in individual months of 2020.
Another air pollution indicator, NO2, did not exceed the permissible level. In turn, the highest concentration of 36.55 µg m−3 was recorded in April at the background station, and the lowest in June at the industrial station, 16.73 µg m−3. Generally, a decrease in the concentration of this indicator is noticeable (Figure 12).
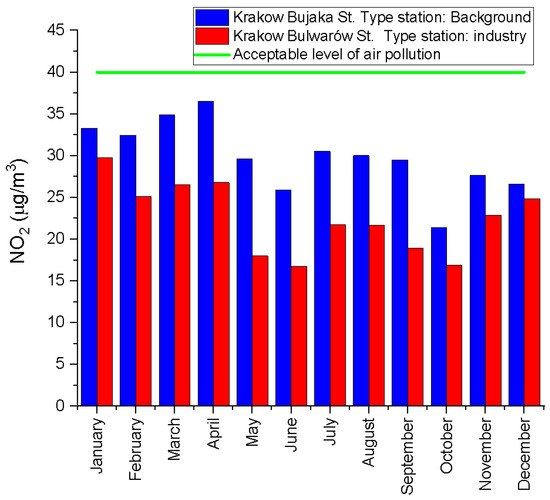
Figure 12.
Average NO2 concentration in individual months of 2020.
The result of nitrogen oxide concentration in the background point exceeded the data from the comparable station each month. The value of this pollutant in the background station ranged from 39.90 to 115.79 µg m−3, and in the second station, the concentration was slightly lower between 21.90–95.95 µg m−3 (with exceedances in January–March, September–December) at the permissible concentration of 30 µg m−3 The highest concentrations were recorded in January and the lowest in June, which indicates a decrease in concentration (Figure 13).
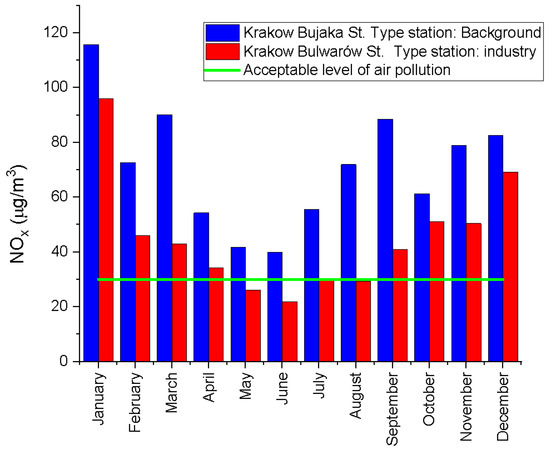
Figure 13.
Average NOX concentration in individual months of 2020.
The highest concentration of SO2 was recorded in January at the Krakow, Bujaka Str. with the value of 7.77 µg m−3, while the lowest was in July at the same point with the value of 1.93 µg m−3. The permissible level of pollutants in the air was below the permissible level (Figure 14).
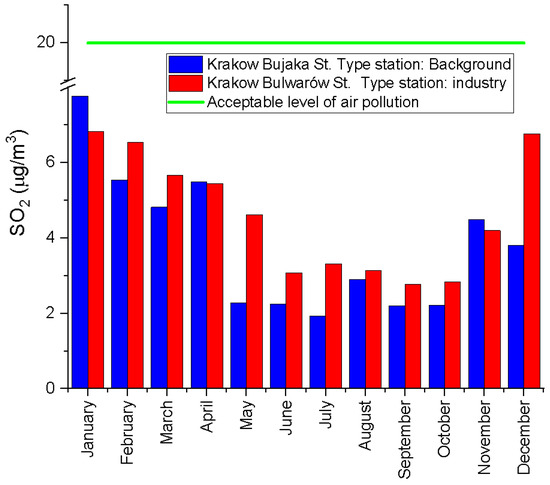
Figure 14.
Average SO2 concentration in individual months of 2020.
3.2. Atmospheric Air Quality—Bacau County
Measurements made for particulate matter PM10 in Bacau County showed that the permissible limit values were not exceeded (Figure 15). The highest value was registered in November 2020 in the industrial area of Bacau—39.02 µg m−3, while the lowest value was registered in the urban background station, in May, this being 7.04 µg m−3.
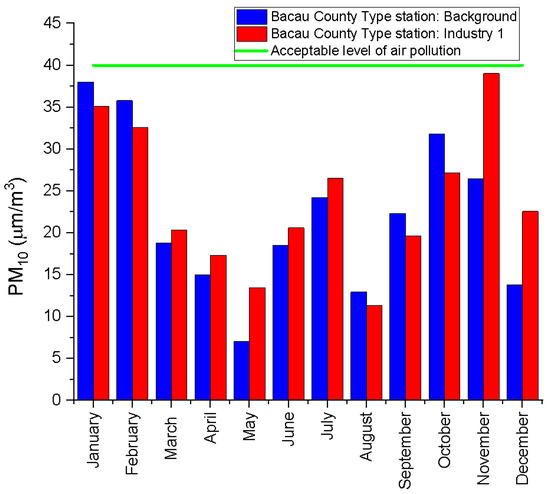
Figure 15.
Average PM10 concentration in individual months of 2020.
Monitoring for the parameter C6H6 (Figure 16) showed that its limit value was exceeded only in August in the urban background station with a value of 12.11 µg m−3. High values of this parameter were also recorded in November (4.9 µg m−3), December (4.94 µg m−3) and January (4.65 µg m−3), but no exceedances were recorded. The lowest value for benzene was recorded in May and June (0.45 µg m−3) at the measurement point in the Prefecture zone (urban area).
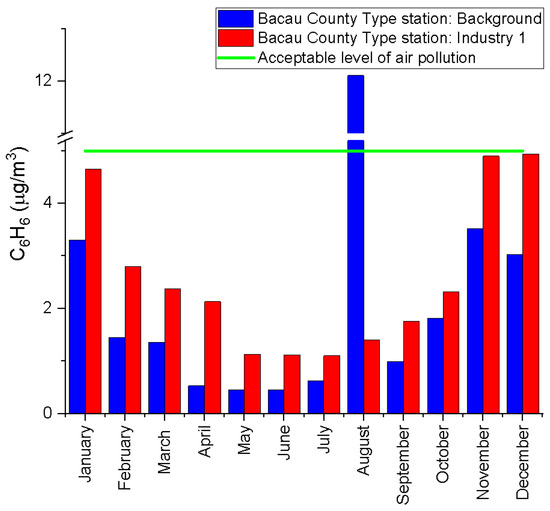
Figure 16.
Average C6H6 concentration in individual months of 2020.
Regarding the parameter As (Figure 17), it did not register exceedances according to Law no. 104 of 15 June 2011 on ambient air quality, as subsequently amended and supplemented. The highest average concentration was recorded in March with a concentration of 0.44 ng m−3, while the lowest was in June and September with a value of ng m−3 with the permissible concentration of 6 ng m−3.
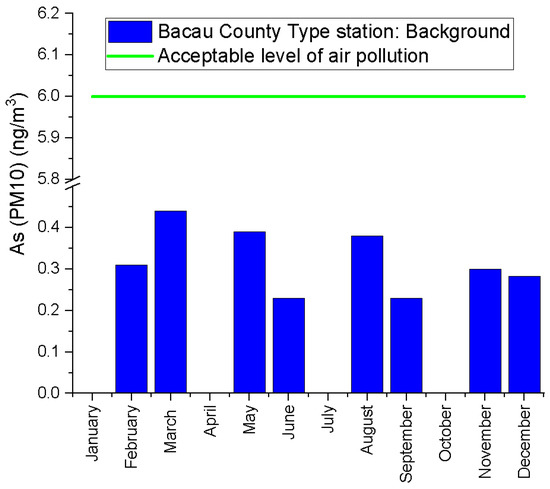
Figure 17.
Average As concentration in the year 2020.
The measurements for Ni (Figure 18) made in the urban background station did not show any exceedance of the maximum allowable value of 20 ng m−3. Thus, the lowest average value was recorded in September, 1.4 ng m−3, and the highest average value was recorded in March—2.72 ng m−3.
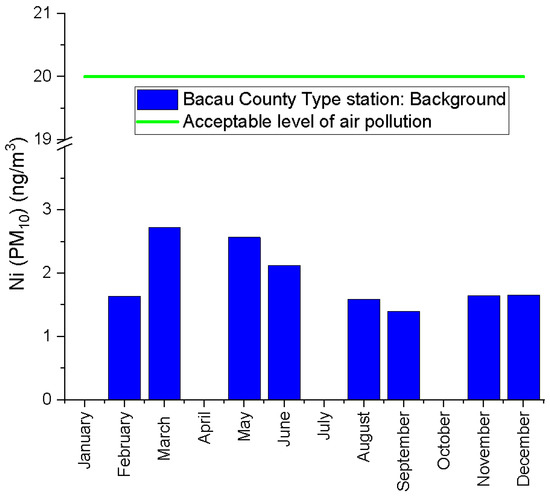
Figure 18.
Average Ni concentration in the year 2020.
The highest average recorded value for the Pb (Figure 19) quality parameter was in August, 0.091 µg m−3, while the lowest value for this parameter was in December, 0.0053 µg m−3. According to the current legislation, the permissible limit value is 0.5 µg m−3.
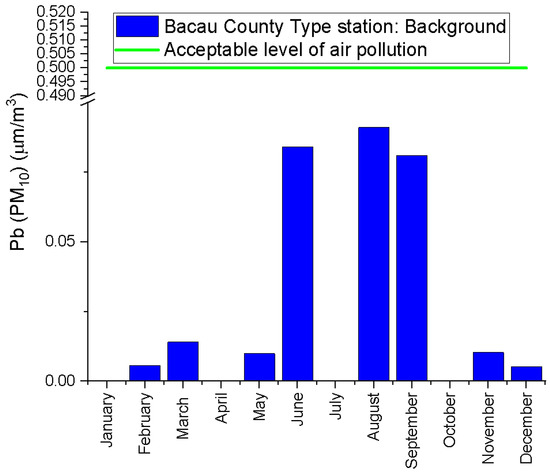
Figure 19.
Average Pb concentration in the year 2020.
Cadmium is another heavy metal measured in suspended particles in the air with a maximum permissible value of 5 ng m−3 (Figure 20). The measurements for this parameter did not indicate, as in the case of other heavy metals, overruns. The highest average value recorded in the urban background station of Bacau municipality was 0.36 ng m−3 in March and the lowest was 0.1 ng m−3 in September.
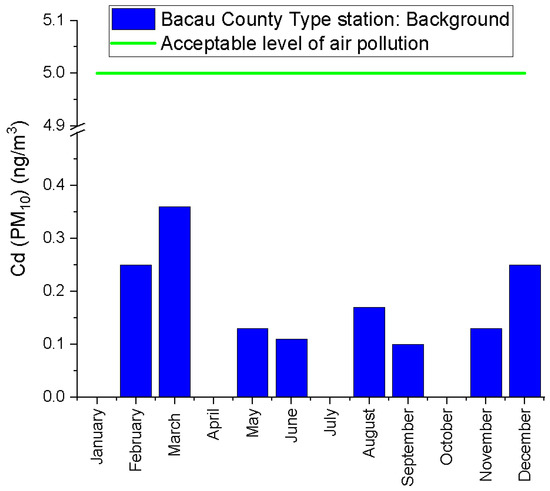
Figure 20.
Average Cd concentration in the year 2020.
Regarding the measurements made for nitric oxide (Figure 21), it was found that there were no exceedances for any of the measurement points throughout 2020. The highest average value for NO was recorded in January, with 19.35 µg m−3 in the urban background station, while the lowest value was recorded in the same area in May, with 2.57 µg m−3.
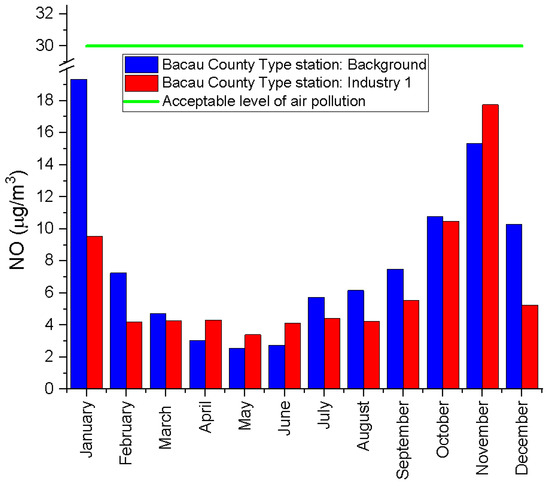
Figure 21.
Average NO concentration in individual months of 2020.
Another parameter measured by the National Network for Air Quality Monitoring is nitrogen dioxide. The monitored parameter did not record exceeded values according to Law no. 104 of 15 June 2011 on ambient air quality, as subsequently amended and supplemented.
The highest average value for NO2 was recorded in January in the urban area of Bacau municipality, namely, 38.21 µg m−3, while the lowest value was recorded in the industrial area of Bacau municipality—7 µg m−3 in March (Figure 22).
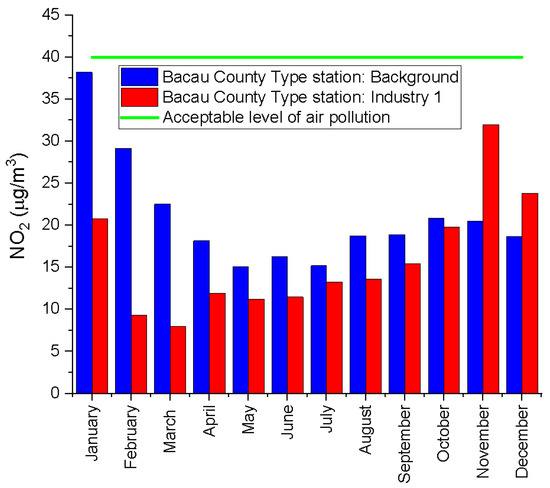
Figure 22.
Average NO2 concentration in individual months of 2020.
The average concentration of nitrogen oxides has been surpassed both in the urban background station and in the industrial area. Thus, there were recorded exceedances in January, October, November and December in both measurement areas, while in February and September, there were recorded exceedances only in the urban background station. The lowest average recorded was 14.44 µg m−3 in March with a permissible concentration of 30 µg m−3 (Figure 23).
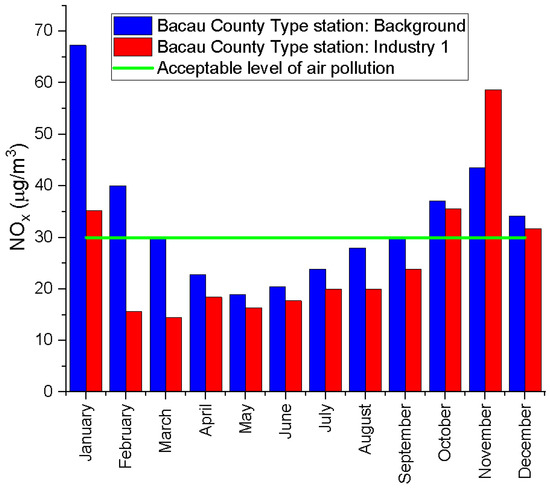
Figure 23.
Average NOX concentration in individual months of 2020.
The results of the SO2 average concentration (Figure 24) during the test did not show any exceeding of the limit values. The highest concentration was recorded in January at the industrial station with a concentration of 9.85 µg m−3, while the lowest was in September at the same station that qualified for industrial testing, with a value of 5.22 µg m−3 at the permissible concentration of 20 µg m−3.
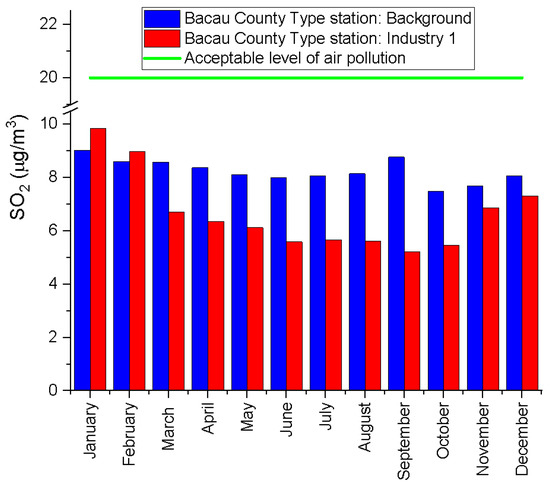
Figure 24.
Average SO2 concentration in individual months of 2020.
3.3. Atmospheric Air Temperature—Krakow Agglomeration
The highest average temperature at the Kraków–Balice synoptic station was recorded in August, 20.9 °C, and the lowest in December, 1.5 °C, and January, 1.6 °C (Table 2).

Table 2.
Average monthly atmospheric air temperatures in individual months in the Krakow agglomeration.
The highest average temperature in the third-order climatological station Kraków–observatory was recorded in August, 20.9 °C, and the lowest in December, 1.4 °C. Another month with recorded low temperatures in January.
3.4. Atmospheric Air Temperature—Bacau County
The average monthly air temperatures recorded at the Bacau weather station in 2020 are shown in Table 3. The lowest temperature recorded at the Bacau weather station was at the level of January at 0.0 °C, while the highest temperature was recorded at the level of August at 22.5 °C [19].

Table 3.
Average monthly atmospheric air temperatures in individual months in the Bacau County.
3.5. Number of Vehicles—Krakow Agglomeration
In Krakow Agglomeration, at the end of 2020 were registered 90,482 road vehicles.
3.6. Number of Vehicles—Bacau County
In Bacau County, at the level of 2020, 255,307 road vehicles were registered in circulation.
3.7. Statistical Analysis
A negative strong correlation occurred between the temperature measured in point 2 (industrial station, Bulwarów Str.), and the concentration of NO_2, NOX_2, PM10_2, which confirms the increase in the concentration of pollutants along with the temperature decrease. On the other hand, a different high positive correlation occurred between NO_2 and NOX_2 (Table 4).

Table 4.
Statistical values of selected indicators of air pollution and temperature in Krakow Agglomeration.
The highest correlation occurred between the concentration in point 2 (industrial station located in the Izvoare district of Bacau), of SO2_2 and NO_2; NO_2 and NOX_2, which confirms the increase in the concentration of pollutants. A different high negative correlation also occurred between PM10_2 and temperature (Table 5).

Table 5.
Statistical values of selected indicators of air pollution and temperature in Bacau County.
4. Discussion of the Results
To effectively reduce harmful emissions to the low, area and linear air, continuous quality monitoring is recommended, which is important for taking measures to minimize the negative impact on its condition.
One of the important indicators of air pollution recognition is particulate matter (PM10). The highest average concentration of PM10 in the urban agglomeration exceeded 50 µg m−3 in January. Some researchers [20] have attributed the concentration of particulate matter exceeding 40 µg m−3 to pollutants emitted by motor vehicles. Excessive PM10 concentration usually occurs in the winter. Additionally, Houthuijs [21] pointed to the problem of meeting air quality standards, especially in the winter season. Such a problem may be a consequence of temperature drop and coal combustion in installations with low efficiency. Particulate matter air pollution is a serious problem in large cities and urban-industrial agglomerations both in Poland and in Europe [5].
The concentration of nitrogen oxide and nitrogen oxides was most often exceeded in the winter–spring and autumn–winter periods in the agglomeration. Some researchers [22] have concluded that the impact of this air pollution might have on the character of buildings, indicating compact buildings as favorable.
The impact of COVID-19 on air quality is confirmed by a favorable decrease from April in the concentration of PM10, NO, NO2, and NOX. A similarly favorable downward trend in air pollution during the US pandemic was shown by Berman and Ebisu [23].
The content of nitrogen oxides was within the range of 21.90–95.95 µg m−3, which proved to be exceeded and showed the greatest differences of the results. The most frequent exceedances of this indicator were observed in January, March, September, October, November and December 2022 (Table 6). According to Rozbicka [24], the amount of nitrogen oxides in the atmospheric air is influenced by the number of emissions and meteorological conditions. The lowest temperatures occurred in January and December 2020, when the highest values of pollutants were most often found, including nitrogen oxides and PM10. Transport contributes to the increase in the share of greenhouse gases through emissions of PM10 and nitrogen oxides [25]. An additional positive correlation occurred between NO and NOX. That same correlation was confirmed [26].

Table 6.
List of the highest air pollution rates.
Road traffic and low emissions have a detrimental effect on air quality in Krakow and in Bacau, which directly affects the quality of life and health of the inhabitants. The reduction of pollutants emitted by vehicles should be a priority for each agglomeration and county. Regarding sustainable transport systems, the following solutions should be indicated: the creation of a car-free zone, low emission zone (LOZ), city center tolls for electric vehicles (EV), hybrid electric vehicles (HEVs), zero-emission vehicles (ZEVs), bike-sharing, car-sharing, carpooling, Park & Ride, Bike & Ride, Kiss & Ride [27,28,29,30]. According to Kowalski et al. [31], significant in transport systems is the long life of equipment. Electric cars do not contribute to the direct emission of pollutants into the air because the source of their propulsion is electricity. The emission of exhaust gases and CO2 escaping into the atmosphere is minimized to zero.
The results (Table 5) indicated the need for further replace the old ineffective furnaces, with the combustion of solid fuels such as coal and wood, and to replace them with gas boilers fired with natural gas to effectively reduce the emission of harmful pollutants into the air (Figure 25).

Figure 25.
The concept of reducing the level of air pollution.
5. Conclusions
Based on the analysis of air quality in the Krakow agglomeration and Bacau County during the 12 months of 2020, the following conclusions related to its anthropogenic pollution were formulated:
- Results above the normative concentrations of nitrogen oxides and PM10 indicate a problem with maintaining the required air quality parameters with a noticeable decrease in their concentrations, except for benzene, which was caused by COVID-19;
- The highest concentrations of nitrogen oxide of 53.99 µg m−3 were recorded in the winter in the background measuring station, which confirms the advection of pollutants in the area of the studied agglomeration;
- The concentration of nitrogen oxides was most often exceeded 5 times in the winter–spring and autumn–winter periods, with the highest value of 95.95 µg m−3 in the agglomeration;
- To effectively reduce harmful emissions into the air, it is advisable to replace heating installations with low-emission ones to replace heating furnaces and apply new technologies related to the use of renewable energy sources and the development of electromobility.
Author Contributions
Conceptualization, P.G. and I.O.; methodology, P.G. and I.O.; software, M.E.; validation, I.O.; formal analysis, P.G.; investigation, P.G. and I.O.; resources, T.C. and G.P.; data curation, P.G. and I.O.; writing—original draft preparation, P.G. and I.O.; writing—review and editing, M.E.; visualization, P.-L.M.; supervision, T.C. All authors have read and agreed to the published version of the manuscript.
Funding
This research received no external funding.
Institutional Review Board Statement
Not applicable.
Informed Consent Statement
Not applicable.
Data Availability Statement
Not applicable.
Conflicts of Interest
The authors declare no conflict of interest.
References
- Mayer, H. Air pollution in cities. Atmos. Environ. 1999, 33, 4029–4037. [Google Scholar] [CrossRef]
- WHO Health Risks of Particulate Matter from Long-Range Transboundary Air Pollution; WHO Regional Office for Europe: Copenhagen, Denmark, 2006; Available online: https://apps.who.int/iris/handle/10665/107691 (accessed on 12 February 2022).
- Selmi, W.; Selmi, S.; Teller, J.; Weber, C.; Rivière, E.; Nowak, D.J. Prioritizing the provision of urban ecosystem services in deprived areas, is a question of environmental justice. Ambio 2016, 50, 1035–1046. [Google Scholar] [CrossRef] [PubMed]
- Cooper, D.C.; Alley, F.A. Air Pollution Control: A Design Approach, 4th ed.; Waveland Press Inc.: Long Grove, IL, USA, 2011. [Google Scholar]
- Cembrzyńska, J.; Krakowiak, E.; Brewczynski, P.Z. Particulate pollution of PM10 and PM2.5 due to strong anthropopressure in Sosnowiec city. Environ. Med. 2012, 15, 31–38. [Google Scholar]
- Vallero, D. Fundamentals of Air Pollution; Academic Press: Cambridge, MA, USA, 2014. [Google Scholar]
- Falkowska, L.; Korzeniewski, K. Chemia Atmosfery; Uniwersytetu Gdańskiego: Gdańsk, Poland, 1995. (In Polish) [Google Scholar]
- RPME-Regulation of the Polish Minister of the Environment on the Levels of Certain Substances in the Air, The Notice of the Minister of Climate and Environment of 12 April on the Publication of the Uniform Text of the Regulation of the Minister of the Environment on the Levels of Certain Substances in the Air (Journal of Laws of 2021, Item 845). Available online: http://www.sejm.gov.pl (accessed on 18 March 2022).
- Bai, L.; Wang, J.; Ma, X.; Lu, H. Air pollution forecasts: An overview. Int. J. Environ. Res. Public Health 2018, 15, 780. [Google Scholar] [CrossRef]
- Gao, H.; Chen, J.; Wang, B.; Tan, S.C.; Lee, C.M.; Yao, X.; Yan, H.; Shi, J. A study of air pollution of city clusters. Atmos. Environ. 2011, 45, 3069–3077. [Google Scholar] [CrossRef]
- BEPA-Bacau Environmental Protection Agency, Report for 2020. Available online: http://apmbc-old.anpm.ro/docfiles/view/168051 (accessed on 17 March 2022).
- National Agency for Environmental Protection. Available online: http://www.anpm.ro/ (accessed on 18 March 2022).
- Law No. 104 of 15 June 2011 on Ambient Air Quality, as Subsequently Amended and Supplemented. Available online: https://legislatie.just.ro/Public/DetaliiDocument/129642 (accessed on 18 March 2022).
- Przydatek, G.; Budzik, G.; Janik, M. Effectiveness of selected issues of used tyre management in Poland. Environ. Sci. Pollut. Res. 2022, 29, 31467–31475. [Google Scholar] [CrossRef]
- Stanisz, A. Przystępny Kurs Statystyki Z Zastosowaniem STATISTICA PL na Przykładach Z Medycyny; Wydawnictwo StatSoft Polska: Kraków, Poland, 2006; pp. 1–343. (In Polish) [Google Scholar]
- Zakład Klimatologii. Available online: http://www.klimat.geo.uj.edu.pl/ (accessed on 12 February 2022). (In Polish).
- Anderson, J.O.; Thundiyil, J.G.; Stolbach, A. Clearing the air: A review of the effects of particulate matter air pollution on human health. J. Med. Toxicol. 2012, 8, 66–175. [Google Scholar] [CrossRef]
- Program Ochrony Środowiska Dla Miasta Krakowa Na Lata 2020–2030. Available online: https://strategia.krakow.pl/ (accessed on 12 February 2022).
- National Meteorological Administration. Available online: https://www.meteoromania.ro (accessed on 12 February 2022).
- Kumar, P.; Rivas, I.; Singh, A.P.; Ganesh, V.J.; Monirupa, A.; Frey, H.C. Dynamics of coarse and fine particle exposure in transport microenvironments. Clim. Atmos. Sci. 2018, 11, 1–12. [Google Scholar] [CrossRef]
- Houthuijs, D.; Breugelmansa, O.; Hoekb, G.; Vaskövic, É.; Mihálikovád, E.; Pastuszkae, J.S.; Jirikf, V.; Sachelarescug, S.; Lolovah, D.; Meliefsteb, K.; et al. PM10 and PM2.5 concentrations in Central and Eastern Europe: Results from the Cesar study. Atmos. Environ. 2001, 35, 2757–2771. [Google Scholar] [CrossRef]
- Borrego, C.; Martins, H.; Tchepel, O.; Salmim, L.; Monteiro, A.; Miranda, A.I. How urban structure can affect city sustainability from an air quality perspective. Environ. Model. Softw. 2006, 21, 461–467. [Google Scholar] [CrossRef]
- Berman, J.D.; Ebisu, J. Changes in U.S. air pollution during the COVID-19 pandemic. Sci. Total Environ. 2020, 739, 1–44. [Google Scholar] [CrossRef] [PubMed]
- Rozbicka, K. Charakterystyka zanieczyszczenia powietrza atmosferycznego tlenkami azotu na obszarze aglomeracji warszawskiej ze szczególnym uwzględnieniem Ursynowa. Przegląd Naukowy. Inżynieria I Kształtowanie Sr. 2007, 16, 1. (In Polish) [Google Scholar]
- Pietrzak, K.; Pietrzak, O. Environmental effects of electromobility in a sustainable urban public transport. Sustainability 2020, 12, 1052. [Google Scholar] [CrossRef]
- Hosseinibalam, F.; Hezaji, P. Influence of meteorological parameters on air pollution in Isfahan. Int. Conf. Biol. Environ. Chem. 2012, 46, 7–612. [Google Scholar]
- Ranaei, S. Patent-based technology forecasting: Case of electric and hydrogen vehicle. Int. J. Energy Technol. Policy 2016, 12, 20–40. [Google Scholar] [CrossRef]
- Kendall, K.; Kendall, M.; Liang, B.; Liu, Z. Hydrogen vehicles in China: Replacing the Western Model. Int. J. Hydrogen Energy 2017, 42, 30179–30185. [Google Scholar] [CrossRef]
- Ricci, M. Bike sharing: A review of evidence on impacts and processes of implementation and operation. Res. Transp. Bus. Manag. 2015, 15, 28–38. [Google Scholar] [CrossRef]
- Chang, S.; Song, R.; He, S.; Qui, G. Innovative bike-sharing in China: Solving faulty bike-sharing recycling problem. J. Adv. Transp. 2018, 2018, 7075814. [Google Scholar] [CrossRef]
- Kowalski, S.; Opoka, K.; Ciula, J. Analysis of the end-of-life the front suspension beam of a vehicle. Maint. Reliab. 2022, 24, 446–454. [Google Scholar] [CrossRef]
Publisher’s Note: MDPI stays neutral with regard to jurisdictional claims in published maps and institutional affiliations. |
© 2022 by the authors. Licensee MDPI, Basel, Switzerland. This article is an open access article distributed under the terms and conditions of the Creative Commons Attribution (CC BY) license (https://creativecommons.org/licenses/by/4.0/).