Abstract
We aimed to assess the temporal and spatial evolution law of the freezing temperature field of water-rich sandy soil in underground freezing engineering, taking the newly built west ventilating shaft freezing engineering in the Yuandian No. 2 Mine of Huaibei Coalfield as the engineering background. The influence of groundwater seepage on the freezing temperature field was qualitatively analyzed using field measured data. Based on the mixture medium theory, a hydrothermal coupling numerical calculation model of the freezing temperature field was established. The temporal and spatial evolution law of the freezing temperature field of water-rich sandy soil was obtained via the analysis of field measured data and numerical calculation results. It was found that the proportion of water that froze into ice in the soil mass within the freezing pipe circle is more than that outside of the freezing pipe circle; thus, the phase change in the soil mass within the freezing pipe circle is highly obvious. Groundwater seepage has an “erosion” effect on the upstream and side frozen walls and a “cooling superposition” effect on the downstream frozen wall. Under the effect of groundwater seepage of 2.81 m/d, the average temperature of the effective frozen wall during excavation is below −15 °C, while the thickness is above 5 m for the selected sandy layer at the site, meeting the construction and design requirements. When the groundwater flow rate increases from 0 to 10 m/d, the closure time of the frozen wall increases from 27 to 49 days, an 81.48% increase; the upstream thickness of the effective frozen wall decreases from 5.635 to 4.65 m, which represents a 17.48% decrease, while the downstream thickness increases from 5.664 to 7.393 m, an increase of 30.60%. The numerical calculation model in this paper can be used to predict the development law of the freezing temperature field of the water-rich sandy layers in the Yuandian No. 2 mine and to adjust the on-site cooling plan in real time according to the construction progress. This study provides some theoretical basis and reference for the construction and designs of the freezing temperature fields of water-rich sandy soil layers.
1. Introduction
The artificial ground freezing method was first used in the construction of building foundation reinforcements in South Wales in 1862. In 1883, for the first time, Bozshu, a German engineer, used the freezing method to dig the shaft in the Albarid coal mine in Germany. As the construction approach can adapt to various geological as well as hydrological engineering conditions, its applications have been greatly promoted. The artificial ground freezing method has gradually developed into an important construction method for underground projects in water-rich areas [1,2,3,4,5]. There are three ways of heat transfer: heat conduction, heat convection and heat radiation. To overcome the challenges associated with geotechnical engineering, the impact of heat radiation can be ignored in most cases; however, the impact of heat conduction and heat convection must be considered. Experimental studies and engineering practices have shown that the influence of groundwater seepage in the permeable strata in the freezing temperature field cannot be ignored [6,7,8,9].
Studies have aimed at elucidating the development and distribution of the freezing temperature field in geotechnical engineering under the action of groundwater. In experimental research, scholars designed indoor model tests using similar standard sand materials as well as on-site soil samples. Then, they studied the formation mechanisms and temperature field development law of the freezing wall under single pipe freezing, double pipe freezing and multipipe freezing under the action of groundwater [10,11,12,13,14,15]. In quantitative research, based on water migration, Harlan [16] first proposed a hydrothermal coupling numerical calculation model that is based on the hydrodynamic model. Since then, various forms of hydrothermal coupling numerical calculation models that are based on this model have been proposed. Based on the heat transfer and seepage theory, Lai Yuanming et al. [17,18] deduced the control differential equation of the coupling problem of temperature and seepage fields with phase change and applied the model in the calculation of tunnel projects and dams in cold regions using a numerical calculation software. They successfully predicted the development and distribution of freezing temperature fields in tunnels and dams in cold regions under the effect of seepage. Cai et al. [19] and Wang et al. [20] used the numerical calculation model to optimize the freezing scheme of the shaft in high velocity permeability formation and obtained a freezing design scheme that is more consistent with site construction. Pan Xudong et al. [21] analyzed the temporal and spatial evolution law of the freezing temperature fields of subway cross passages under the effects of groundwater seepage via a numerical simulation based on the hydrothermal coupling theory. To simulate the artificial freezing process of the saturated porous medium soil mass without considering the deformation under the action of groundwater, M Vitel et al. [22,23] proposed a hydrothermal coupling numerical calculation model that is completely consistent with thermodynamics. They successfully applied the model in the freezing engineering of coal mines containing fractured sandstones to predict the freezing process. Mahmoud et al. [24,25] used the enthalpy porosity method to establish the mathematical calculation model for the hydrothermal coupling of artificial freezing temperature fields under large flow velocity and verified the rationality and feasibility of the model through experiments. Hu et al. [26] established a fully coupled hydrothermal coupling numerical calculation model that is based on the theory of heat transfer and seepage in porous media and verified the reliability of the model through classical analytical solutions. A case of the freezing and strengthening of urban subway tunnels was calculated using COMSOL numerical calculation software.
In this paper, first, the governing differential equations of the freezing temperature and seepage fields are established, and the soil is regarded as a saturated porous medium composed of soil particles, ice and water. Using the mixture medium theory, multiple physical fields are coupled through the parameter coupling relationship between the two physical fields. Taking the Yuandian No. 2 Coal Mine of Huaibei Coalfield as the engineering background, the rationality and reliability of the model are verified using the measured data. Based on the established hydrothermal coupling numerical calculation model, the temporal and spatial evolution law of the freezing temperature field of the project under the action of groundwater seepage is analyzed. At the same time, the influence of the groundwater velocity on closure time, average temperature and thickness of the frozen wall is studied.
2. Project Overview
The Yuandian No. 2 Coal Mine is located in the southwest of the Huaibei Coal Mine, while the west ventilating shaft is located in the southwest of the Yuandian No. 2 Coal Mine in Huaibei city. The west ventilating shaft is a newly built shaft that was built by the freezing method. The net diameter of the main shaft is 5.5 m. The excavation diameter is 7.756 m above the vertical depth of 200 m and 8.506 m below the vertical depth of 200 m.
2.1. Shaft Geology
The newly built west ventilating shaft crosses 278.80 m of topsoil and 178.39 m of bedrock. From top to bottom, the strata of the shaft includes Quaternary (Q), Neogene (N) and Permian (P). The basic characteristics for each stratum are shown in Table 1.

Table 1.
Basic characteristics of strata.
2.2. Hydrogeology
From top to bottom, the shaft of the west ventilating shaft crosses 4 aquifers and 3 aquifuges of the topsoil layer. The distribution and burial depths for each aquifer and aquifuge are shown in Figure 1b. The buried depths for the second and third aquifers are 89.75 m and 189.30 m, respectively. The lithology is dominated by fine sand, and the water yield property of the sand layer is strong. Flow direction and velocity of groundwater are measured by the charging method. The measured flow direction is S 30.6° E, while the velocity is 2.81 m/d.
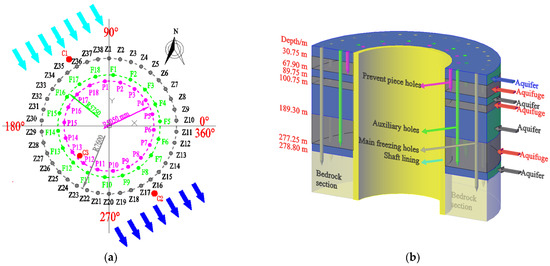
Figure 1.
Freezing holes design layout. (a) Plane layout of freezing holes; (b) three-dimensional diagram of freezing holes.
2.3. Freezing Scheme Design
2.3.1. Freezing Mode and Depth Design
According to existing hydrogeological data and shaft characteristics, combined with freezing design experience in similar areas, the shaft is designed to adopt the freezing method of main freezing holes + auxiliary holes + prevent piece holes. According to bidding documents, the freezing depth is 350 m.
2.3.2. Frozen Wall Design
- (1)
- Basic design parameters
During the active freezing period, the salty water temperature is −28–−32 °C. The control layer is the −262.4 m clay layer (absolute elevation) at the bottom of the loose layer, while the average design temperature of the frozen wall of the control layer is −12 °C.
- (2)
- Frozen wall thickness design
Based on geological and hydrogeological data of the mine and engineering characteristics, the theoretical formula for finite length ultimate strength is used to calculate the thickness of the frozen wall:
where E is the calculated thickness of frozen wall, m; k is the safety factor, taken as 1.1; is the coefficient of fixing degree at both ends of the frozen wall in the exposed section, taken as 0.2; p is the horizontal ground pressure of the calculated horizon, with p = 3.41 MPa; h is the height of the excavation section, taken as 2.5 m, while is the allowable compressive strength of frozen soil, taken as 2.62 MPa. After analysis, the thickness (E) of the frozen wall was found to be 4.96 m.
Based on calculation results, considering the size of shaft excavation diameter and requirements for freezing time before excavation and excavation speed combined with construction experience in this area, the frozen wall thickness was determined to be 5.0 m.
2.3.3. Freezing Holes Design
The freezing hole adopts the design method of three circles of freezing holes: main freezing holes + auxiliary holes + prevent piece holes. The plane layout and three-dimensional diagram of the freezing hole are shown in Figure 1.
Design parameters for each circle of freezing holes are shown in Table 2.
Table 2.
Layout parameters of freezing holes.
2.3.4. Temperature Measuring Holes Design
To accurately grasp the change in freezing temperature field, three temperature measuring holes (C1, C2 and C3) are designed and arranged on the main interface, respectively. The depth of C1 and C2 temperature measuring holes is 350 m, while the depth of the C3 temperature measuring hole is 75 m. To monitor the freezing temperature of strata in different directions and depths, the temperature measuring points are arranged every 20~50 m in the vertical direction in each hole or according to the special stratum. The layout plan for measuring points is shown in Figure 1a.
3. Analysis of Measured Data
3.1. Change Law of the Temperature Measuring Point
In Figure 2, under the continuous cooling of the freezing unit, the temperature for each measuring point decreases with the extension of freezing time. During the active freezing period, the temperature of the measuring point rapidly decreases. As the C3 measuring point is located within the freezing pipe ring diameter, it is not supplemented by the soil mass energy outside the freezing pipe ring diameter. Moreover, under the effects of the superposition of the cooling capacity of the main freezing hole and auxiliary hole, the temperature drop rate of the C3 measuring point is faster than that of the C1 and C2 measuring points outside of the freezing pipe ring diameter. The temperature change is associated with an obvious platform change stage when the C3 measuring point is near 0 °C, which is the phase change latent heat release stage when water becomes ice, while the C1 and C2 measuring points do not have an obvious phase change latent heat release stage. This is because the C3 measuring point is located inside the freezing pipe circle diameter. After the frozen wall closes, the closed frozen wall isolates the hydraulic connection between the inside of the freezing pipe circle diameter and the external soil mass. Even if the pore water pressure is exceeded due to internal freezing, the water in the soil mass cannot flow around under the effects of the excess pore water pressure; thus, the water in the soil mass can only be frozen and transformed into ice so as to release a large amount of the latent heat of the phase change. At the C1 and C2 temperature measuring points outside of the freezing pipe circle diameter, as the soil mass freezes to expand its volume, excess pore water pressure is formed at this point, and the water in the soil mass at this point can seep along the radial direction under the action of the excess pore water pressure so that the water that transforms into ice at this point is much less than that at the C3 measuring point. Thus, the phase change stage of the soil mass at this location is not obvious. In the later stage of maintenance freezing, as the C3 measuring point is close to the side wall, after the shaft excavation, the temperature change in the C3 measuring point is affected by the temperature of the brine in the freezing pipes and by other factors, such as the hydration heat of the concrete during the outer shaft wall casting, inner wall casting and ventilation temperature as well as the humidity in the shaft. Therefore, in the later period, on the basis of maintaining relative stability, the temperature of the C3 measuring point fluctuates to a certain extent, while the C1 and C2 measuring points will only change with the adjustment of the brine temperature in the freezing pipes.
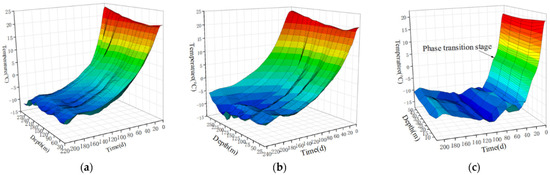
Figure 2.
Measured data of temperature measuring points. (a) C1 temperature measurement point; (b) C2 temperature measurement point; (c) C3 temperature measurement point.
3.2. Influence of Groundwater Seepage on Freezing Temperature Field
In Figure 3, the fine sand layers of −87 m and −135 m are water-rich layers. During the engineering hydrogeological survey, it was found that there is groundwater seepage in the water-bearing sandy layer. Based on the groundwater velocity and flow direction test, the groundwater flow direction is 30.6° south by east; that is, the groundwater flows from C1 to C2. Based on the actual hole forming positions of the freezing holes and the temperature-measuring holes on site, the minimum distance between the C1 temperature measuring point and the freezing holes at the −87 m level is 1088 mm. The minimum distance between the C2 temperature measuring point and the freezing holes is 1216 mm. The minimum distance between the C1 temperature measuring point and the freezing holes at the −135 m level is 1138 mm, while the minimum distance between the C2 temperature measuring point and the freezing holes is 1263 mm. If the effect of the groundwater seepage is not considered, the temperature of the C1 temperature measurement point should be lower than that of the C2 measurement point when freezing for the same time because the C1 measurement point is closer to the freezing hole. However, the C1 measuring point is located upstream of the groundwater seepage, while the C2 measuring point is located downstream of the groundwater seepage. During the groundwater seepage process, due to the convection heat exchange, the cooling capacity upstream is carried downstream along with the groundwater seepage, thereby generating the superposition effect of the cooling capacity at the downstream. Therefore, the cooling rate of the C2 measuring point is higher than that of the C1 measuring point, and the temperature of the C2 point is lower than that of the C1 measuring point at the same time of freezing. In the clay layers of −97 m and −215 m, the temperature of the two measuring points is almost the same at the same freezing time, with minimal differences. Therefore, in the clay layer, the influence of groundwater seepage on the freezing temperature field can be ignored, but in the fine sandy layer, the influence of groundwater seepage on the freezing temperature field is large and cannot be ignored. Therefore, groundwater seepage must be considered in the analysis of the freezing temperature field in the water- bearing fine sandy layer.
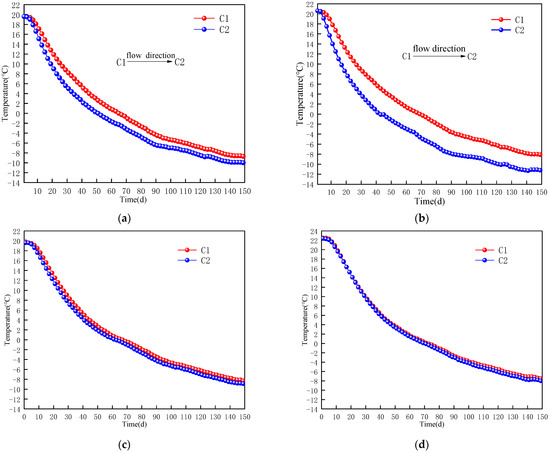
Figure 3.
Temperature change in measuring point under the action of groundwater seepage. (a) −87 m fine sand; (b) −135 m fine sand; (c) −97 m clay; (d) −215 m clay.
4. Numerical Calculation Model
4.1. Mathematical Calculation Model for the Freezing Temperature Field under Groundwater Seepage
Soil mass is a multiphase saturated material that is composed of soil particles, water and ice. During freezing, moisture transfer and the change in soil porosity due to frost heaving are not considered, and only the influence of convection heat transfer that is due to groundwater seepage on the freezing temperature field is considered.
4.1.1. Governing Differential Equation of the Temperature Field
The heat conduction and heat convection terms are considered in the heat transfer equation. According to the Fourier heat conduction and mass conservation laws, the governing differential equation of the two-dimensional freezing temperature field can be obtained as:
where is the density of the soil mass, kg/m3; Cp is the specific heat capacity of the soil mass, J/(kg·K); is the density of water, kg/m3; is the specific heat capacity of water, J/( kg·K); n is the porosity of the soil mass; T is the soil mass temperature, °C; t is the time, s; k is the thermal conductivity of the soil mass, W/(m·K); u and v are the x and y direction components of the water velocity, m/s; and x and y are the coordinate components, m.
4.1.2. Governing Differential Equation of the Seepage Field
According to the fluid continuity equation, mass conservation equation and Darcy’s law, the governing differential equation of the two-dimensional seepage field is:
where is the density of water, kg/m3; n is the soil porosity; K is the hydraulic conductivity coefficient of the soil mass, m/s; g is the acceleration of gravity, 9.8 m/s2; p is the water pressure, Pa; and is the mass source term, kg/(m3 · s).
4.1.3. Multiphysical Field Parameter Coupling
To ensure the mutual coupling between the temperature and seepage fields, the continuity of parameters and smooth transition, the Heaviside function is introduced:
where T_ d is the soil freezing point, °C, while T_ trans is the water–ice phase transition temperature, °C.
The velocity in the temperature field control differential Equation (2) is the Darcy seepage velocity field in the seepage field control differential Equation (3), while the porosity (n) and hydraulic conductivity coefficient (K) in the seepage field control differential Equation (3) are the functions of temperature. Thus, the temperature field control differential Equation (2) and the relevant physical quantities in the seepage field control differential Equation (3) have the following coupling relations:
where f1, f2, f3 and f4, respectively, correspond to different functional relations. Dl.u and dl.v, respectively, correspond to two components of the Darcy seepage velocity field, m/s. n0 is the initial porosity. Ku is the permeability coefficient of unfrozen soil, m/d.
The thermophysical parameters of the soil mass are assigned according to the volume average method, and the sensible heat capacity method is used to deal with latent heat of the water–ice phase change:
where , , denote the densities of the soil particles, water and ice, respectively, kg/m3; , , denote the thermal conductivities of the soil particles, water and ice, W/(m·K); , , are the specific heat capacities of the soil particles, water and ice, J/(kg·K); L is the latent heat of the water–ice phase transition, 335 Kj/kg; H (T) is the Heaviside function; and is the first derivative of the Heaviside function with respect to temperature T, 1/K.
4.2. Basic Assumptions of the Numerical Calculation Model
- (1)
- Soil mass is a saturated porous medium composed of soil particles, water and ice.
- (2)
- All parts of soil mass are homogeneous and isotropic.
- (3)
- In the freezing process, the influence of soil moisture transfer on the temperature field is not considered, and only the convection heat transfer caused by groundwater seepage is considered.
- (4)
- In the freezing process, the influence on the temperature field and the seepage field of frost heaving is not considered.
- (5)
- In the freezing process, the latent heat of the water–ice phase change is completely released within a certain range of soil freezing points.
4.3. Modeling of the Numerical Calculation Model
The numerical calculation model is established according to the actual forming situation of the freezing hole site and considering the freezing influence range. The model geometry, temperature field and corresponding boundary conditions of the seepage field are shown in Figure 4. The measured temperature of brine in different freezing holes is directly loaded on the boundary of the freezing holes as temperature load. The measured temperature of the input brine and output brine are shown in Figure 5a, and the measured temperatures of the brine in different freezing holes are shown in Figure 5b. In Figure 5, the whole freezing process can be divided into two stages: the active freezing period and the maintenance freezing period. During the active freezing period, the temperature of the brine rapidly drops, corresponding to the rapid rate of the temperature drop of the three measuring points in the soil. The difference between the temperature of the input brine and output brine at this stage is 2~5 °C. In the maintenance freezing period, the temperature of brine is basically maintained at −25 °C, resulting in slight fluctuations. At this time, the temperature difference between the input brine and output brine is stable, and the difference is smaller than that in the active freezing period. The difference between the input brine and output brine at this stage is 1~2 °C, indicating that the heat exchange in the stratum at this stage is also reduced.
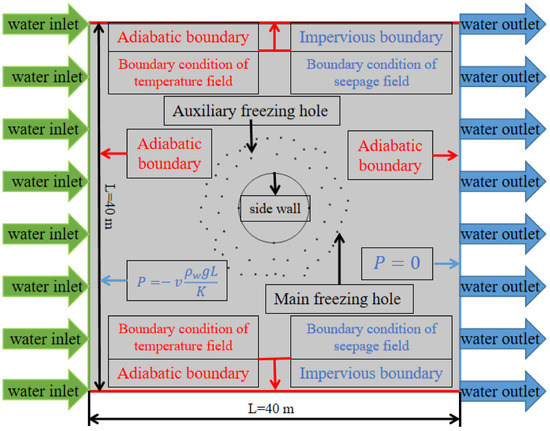
Figure 4.
The numerical calculation model.
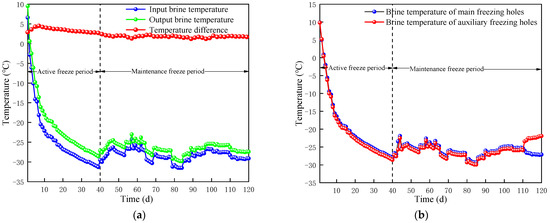
Figure 5.
Measured brine temperature. (a) Measured temperature of the input brine and output brine; (b) measured brine temperature of main freezing hole and auxiliary hole.
4.4. Analysis of the Numerical Calculation Results
4.4.1. Model Verification
To verify the feasibility of the hydrothermal coupling model, the results obtained from the numerical calculation are compared with the field-measured results (Figure 6 and Figure 7). The temperature measurement points and side wall temperature obtained from the numerical calculation are highly consistent with the field-measured results. The errors in the simulated and measured time history curves of the temperature measuring points are kept within 2 °C. At the same time, when excavating in different layers, the differences between the measured and simulated temperatures of the side walls in each direction are kept within 2 °C. Therefore, the model is reliable and effective. Based on this model, the temporal and spatial evolution law of the freezing temperature field of the water-rich sand layer under the action of groundwater seepage can be studied.
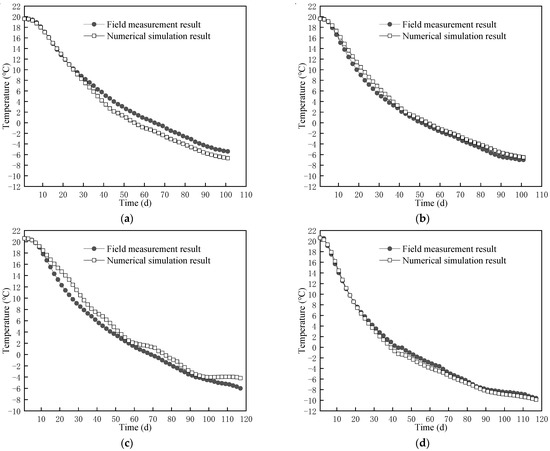
Figure 6.
Comparisons of measured and simulated temperature measuring points. (a) C1 temperature measurement point of −87 m fine sandy soil; (b) C2 temperature measurement point of −87 m fine sandy soil; (c) C1 temperature measurement point of −135 m fine sandy soil; (d) C2 temperature measurement point of −135 m fine sandy soil.
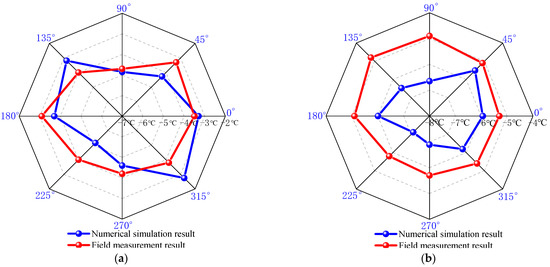
Figure 7.
Comparisons of measured and simulated side wall temperatures. (a) Side wall temperature of −87 m fine sandy soil; (b) side wall temperature of −135 m fine sandy soil.
4.4.2. Thickness and Average Temperatures of the Effective Frozen Wall
The effective frozen wall refers to the remaining frozen wall after deducting the frozen soil in the area to be excavated inside the side wall. It is this part of the frozen wall that plays the role of water sealing and bearing in the freezing method construction. Therefore, the thickness and average temperature of the effective frozen wall are important indicators for assessing the construction safety of the freezing method. Taking the −135 m water-bearing sand layer as the research object, the thickness of the effective frozen wall and the development of the temperature field with time are analyzed.
- (1)
- Effective frozen wall thickness
In the case of groundwater seepage, the development and distribution of the frozen wall over time are shown in Figure 8. After the closure of the frozen wall, the shape of the frozen wall changes with the extension of freezing time. The shape of the frozen wall has good symmetry without the deflection of the freezing hole; thus, the measurement of effective frozen wall thickness can be described by the four characteristic parameters of effective frozen wall thickness. These four thickness characteristic parameters are the upstream thickness Ru, the downstream thickness Rd and the thickness of the two flanks Rs1 and Rs2 (Figure 8). In the case of no deflection of the freezing hole, Rs1 and Rs2 are equal. In field construction, the actual hole forming position of the freezing hole cannot be exactly the same as the design position. After adopting effective measurement and correction technical measures, the actual hole forming position of the freezing hole is slightly deviated from the design position, but it meets the construction requirements. Therefore, under the actual hole forming location in the field, the development law of the effective frozen wall thickness with time can still be studied using these four characteristic parameters.
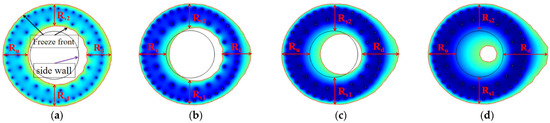
Figure 8.
Schematic presentation of characteristic parameters of effective frozen wall thickness. (a) Initial stage of closure; (b) middle stage I of closure; (c) middle stage II of closure; (d) last stage of closure.
In Figure 9, the effective frozen wall thickness of the −135 m fine sand layer gradually increases with the extension of the freezing time. After the frozen wall enters the side wall, the increase rate of the frozen wall thickness in the four different directions decreases. When freezing for 118 d, the layer is excavated. The effective frozen wall thickness in different directions is more than 5 m, meeting the construction requirements. As shown in Figure 10, under the effects of groundwater seepage, due to the convection heat transfer, the rate of increase in the frozen wall in different directions is different, especially the upstream and downstream thickness of the frozen wall. Due to the “erosion” effect of groundwater seepage on the upstream frozen wall and downstream superposition of the cooling capacity, the effective thickness of the downstream frozen wall after the closure of the frozen wall is greater than the effective thickness of the upstream frozen wall. After the frozen wall enters the side wall, the increase in thickness of the effective freezing wall only depends on the increase in the thickness of the frozen wall outside of the ring diameter of the freezing pipe. In Figure 9, after the frozen wall enters the side wall, under the normal cooling condition of the freezing pipe brine, the effective thickness of the upstream frozen wall remains unchanged under the “erosion” of groundwater, while the thickness of the downstream effective frozen wall continues to increase due to the superposition effect of the cooling capacity caused by the seepage of groundwater, which makes the difference between the effective frozen wall thickness at the upstream and downstream become larger. In this project, the velocity of groundwater seepage is 2.81 m/d. Due to the low velocity of the groundwater seepage, the “erosion” effect of the groundwater on the upstream frozen wall is small, and the difference between the upstream and downstream thickness is small. However, for the stratum with a high velocity of groundwater seepage and good permeability, the “erosion” effect of the groundwater on the upstream frozen wall is highly prominent. Sometimes, when the construction is performed according to the original design scheme, the frozen wall cannot close, or the closure time is too long, which brings about safety hazards to the project construction or affects the project construction progress. Therefore, for the stratum with a high flow rate and permeability, design optimization should be performed on the basis of the conventional freezing design scheme. For example, relevant measures, such as densifying the arrangement of the freezing pipes at the upstream of groundwater seepage and grouting to reduce the permeability of the stratum can be adopted [4,8,19,20] so as to ensure the thickness of the upstream frozen wall and the purpose of the timely closure of the frozen wall.
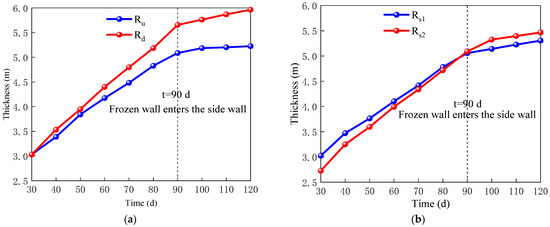
Figure 9.
Effective frozen wall thickness of −135 m fine sand layer. (a) Thickness of upstream and downstream; (b) thickness of flank.
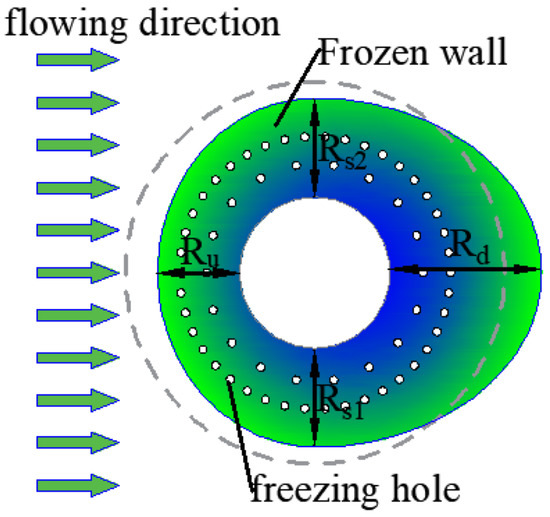
Figure 10.
Schematic diagram of frozen wall under the action of groundwater seepage.
- (2)
- Average temperature of effective frozen wall
As shown in Figure 11, the average temperature of the effective freezing wall decreases with the freezing time. The average temperature rapidly decreases during the active freezing period and gradually during the maintenance freezing period. Figure 11 further shows that the average temperature change in the effective frozen wall is synchronous with that of the brine. When frozen for 43–45 d, the temperature of the brine rises concomitantly with the average temperature of the frozen wall. Therefore, it can be concluded that the average temperature of the frozen wall is highly sensitive to the temperature of the brine. When frozen for 118 d, the layer can be excavated as the average temperature of the effective frozen wall drops to below −15 °C, meeting the construction requirements.
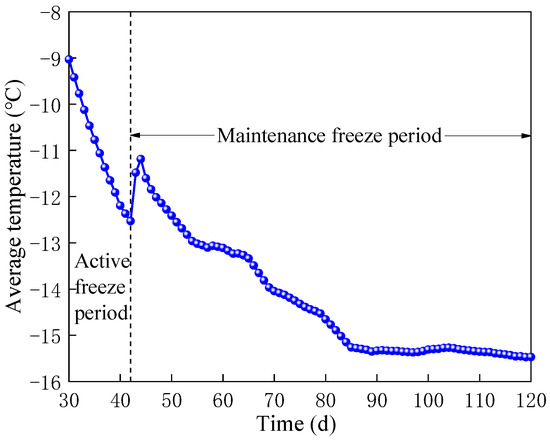
Figure 11.
Average temperature of effective frozen wall.
4.4.3. Influence of Groundwater Velocity on the Freezing Temperature Field
As shown in Figure 12, groundwater velocity has a high impact on the freezing temperature field. In Figure 12a, when the groundwater flow rate does not exceed 5 m/d, the closure time of the frozen wall cannot be affected by groundwater seepage. However, at a groundwater flow rate exceeding 5 m/d, the closure time of the frozen wall increases with the increasing groundwater flow rate. The closure time of the frozen wall does not show a simple linear relationship with the groundwater flow rate but rather increases exponentially with the increase in the flow rate. Therefore, in the water-rich sand layer, when the groundwater velocity exceeds 5 m/d, the influence of groundwater seepage on the closure time of the frozen wall must be fully considered in the design and construction scheme of an artificial groundwater freezing method. As shown in Figure 12a, when the groundwater flow rate increases from 5 to 10 m/d, the closure time increases by 81.48% from 27 to 49 d. Figure 12b shows that the groundwater flow rate also has a certain impact on the average temperature of the effective frozen wall. After the frozen wall closes, the greater groundwater flow rate results in an accelerated decrease in the average temperature of the effective frozen wall. However, the final average temperature of the effective frozen wall tends to be the same under different groundwater flow rates. Therefore, for the deep water-rich seepage sand layer, the groundwater flow rate has a minimal impact on the average temperature of the effective frozen wall. As a result, the safety index of the effective frozen wall average temperature is not affected. Figure 12c,d show that groundwater seepage has an impact on the different thickness parameters of the effective frozen wall. Among them, different groundwater velocities have the greatest impact on the thickness of the upstream and downstream frozen walls. Due to the “erosion” effect of the upstream groundwater and the “cooling superposition” effect of the downstream groundwater, when the groundwater velocity increases from 0 to 10 m/d, the effective thickness of the upstream frozen wall decreases by 17.48% from 5.635 to 4.65 m, and the thickness decreases. By comparison, the thickness of the downstream frozen wall increases by 30.60% from 5.664 to 7.397 m, and the thickness increases. However, the increase in the groundwater velocity has a minimal impact on the two sides, which decrease by 7.68% and 6.22%, respectively.
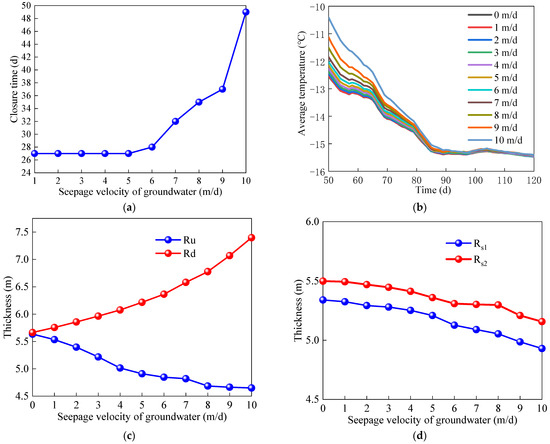
Figure 12.
Impact of groundwater seepage on freezing temperature field. (a) Closure of frozen wall; (b) average temperature; (c) upstream and downstream thickness of frozen wall (frozen for 118 d); (d) flank thickness of frozen wall (frozen for 118 d).
5. Conclusions
Taking the newly built west ventilating shaft freezing project of the Yuandian No. 2 Mine of Huaibei Coalfield as the engineering background, the field-measured data of the temperature measuring points were analyzed, and the development and distribution laws of the temperature field at different locations and different soil properties were obtained. Based on the mixture medium theory, a numerical calculation model of hydrothermal coupling for the freezing temperature field was established. The reliability of the numerical model was verified using field-measured data. Based on the numerical calculation model of hydrothermal coupling, the analysis of the temporal and spatial evolution law of the freezing temperature field of water-rich sandy soil under the action of groundwater seepage leads to the following conclusions:
- (1)
- The measured data show that the soil inside the freezing pipe ring diameter cools faster compared with that outside of the freezing pipe ring diameter. The phase transition stage of the soil inside the freezing pipe ring diameter is more obvious than that of the outside soil. In underground freezing engineering, the influence of groundwater on the freezing temperature field differs depending on the soil properties. Groundwater seepage has a greater influence on the sand soil freezing temperature field. However, the influence of groundwater seepage in clay can be ignored when analyzing the freezing temperature field.
- (2)
- The numerical calculation results show that when the −135 m water-rich sand layer is excavated, the average temperature of the effective frozen wall is below −15 °C, and the thickness is above 5 m, which meet the construction requirements.
- (3)
- Both the measured data and the numerical calculation results show that the groundwater seepage has an “erosion” effect on the upstream frozen wall and a “cooling superposition” effect on the downstream frozen wall. When designing a freezing project for the stratum with large velocity permeability, the impact of groundwater seepage should be comprehensively evaluated, and appropriate freezing scheme optimization measures should be implemented at the upstream of the frozen wall to ensure the safety of the working face and the closure time of the frozen wall according to the construction plan.
- (4)
- When the velocity of the groundwater seepage does not exceed 5 m/d, its influence on the closure time of frozen wall may not be considered. When the velocity of the groundwater seepage increases from 5 to 10 m/d, the closure time of the frozen wall and the thickness of the frozen wall at the downstream increase by 81.48% and 30.60%, respectively, whereas the thickness of the effective frozen wall at the upstream decreases by 17.48%. The greater the groundwater velocity, the higher the average temperature of the frozen wall after closure, but the final average temperature tends to be almost the same.
Author Contributions
Conceptualization, C.R. and H.S.; methodology, W.L. and B.W.; software, W.L.; validation, W.L., Y.D. and Z.W.; formal analysis, W.L.; investigation, W.L.; resources, C.R.; data curation, X.S. and H.M.; writing—original draft preparation, W.L.; writing—review and editing, W.L. and S.H.; visualization, S.H.; supervision, C.R.; project administration, H.M.; funding acquisition, C.R. All authors have read and agreed to the published version of the manuscript.
Funding
This research was funded by the National Natural Science Foundation of China, grant number 51878005, the Major Science and Technology Special Project of Anhui Province (202003c08020007) and the Open fund of Anhui Key Laboratory of Mining Construction Engineering (GXZDSYS2022107).
Institutional Review Board Statement
Not applicable.
Informed Consent Statement
Not applicable.
Data Availability Statement
Not applicable.
Conflicts of Interest
The authors declare no conflict of interest.
Nomenclature
Implication of symbols in the article:
| Symbols | Implication | Unit |
| Calculated thickness of the frozen wall | m | |
| Safety factor | 1 | |
| Coefficient of fixing degree at both ends of the frozen wall in the exposed section | 1 | |
| Horizontal ground pressure of the calculated horizon | 1 | |
| Height of the excavation section | m | |
| Allowable compressive strength of frozen soil | MPa | |
| Density of soil mass | kg/m3 | |
| Density of water | kg/m3 | |
| Density of ice | kg/m3 | |
| Density of soil particles | kg/m3 | |
| Specific heat capacity of soil mass | J/(kg·K) | |
| Specific heat capacity of water | J/(kg·K) | |
| Specific heat capacity of ice | J/(kg·K) | |
| Specific heat capacity of soil particles | J/(kg·K) | |
| Thermal conductivity of soil mass | W/(m·K) | |
| Thermal conductivity of water | W/(m·K) | |
| Thermal conductivity of ice | W/(m·K) | |
| Thermal conductivity of soil particle | W/(m·K) | |
| X component of fluid velocity in the temperature field | m/s | |
| Y component of fluid velocity in the temperature field | m/s | |
| X component of fluid velocity in the seepage field | m/s | |
| Y component of fluid velocity in the seepage field | m/s | |
| Soil freezing point | °C | |
| Water–ice phase transition temperature | °C | |
| Soil porosity | 1 | |
| Initial soil porosity | 1 | |
| Hydraulic conductivity coefficient of the soil mass | m/s | |
| Hydraulic conductivity coefficient of the unfrozen soil | m/s | |
| Acceleration of gravity | m/s2 | |
| Water pressure | Pa | |
| Mass source term | kg/(m3·s) | |
| Heaviside function | 1 | |
| Latent heat of water–ice phase transition | kJ/kg | |
| Thickness of the upstream frozen wall | m | |
| Thickness of the downstream frozen wall | m | |
| Thickness of the frozen wall at side | m | |
| Thickness of the frozen wall at side | m | |
| Temperature | °C | |
| Time | s | |
| X coordinate | m | |
| Y coordinate | m | |
| Temperature measurement point of C1 | / | |
| Temperature measurement point of C2 | / | |
| Temperature measurement point of C3 | / |
References
- Long, W.; Rong, C.; Shi, H.; Huang, S.; Wang, Z.; Duan, Y.; Ma, H. Temperature Field and Stability Analysis of the Frozen Wall Based on the Actual Position of Freezing Holes. Appl. Sci. 2022, 12, 8943. [Google Scholar] [CrossRef]
- Long, W.; Rong, C.; Duan, Y.; Guo, K. Numerical calculation of temperature field of freezing-sealing pipe roof method in Gongbei tunnel. Coal Geol. Explor. 2020, 48, 160–168. [Google Scholar]
- Cai, H.; Hong, R.; Xu, L.; Wang, C.; Rong, C. Frost heave and thawing settlement of the ground after using a freeze-sealing pipe-roof method in the construction of the Gongbei Tunnel. Tunn. Undergr. Sp. Tech. 2022, 125, 104503. [Google Scholar] [CrossRef]
- Pang, C.; Cai, H.; Hong, R.; Li, M.; Yang, Z. Evolution Law of Three-Dimensional Non-Uniform Temperature Field of Tunnel Construction Using Local Horizontal Freezing Technique. Appl. Sci. 2022, 12, 8093. [Google Scholar] [CrossRef]
- Hu, J.; Yang, P. Numerical analysis of temperature field within large-diameter cup-shaped frozen soil wall. Rock Soil Mech. 2015, 36, 523–531. [Google Scholar]
- Ji, Z.; Lao, L.; Li, H.; Li, S. The effects of seepage velocity on the formation of frozen sandy soil wall. Sci. Technol. Eng. 2018, 2, 130–138. [Google Scholar]
- Rong, C.; Zhang, X.; Cheng, H.; Wang, B.; Lin, J. Experimental study on influence of groundwater velocity on freezing temperature field. J. Guangxi Univ. Nat. Sci. Ed. 2018, 43, 656–664. [Google Scholar]
- Dong, Y.; Rong, C.; Wang, B.; Yang, F. Study on Optimal Arrangement Method of Multi-circle Frozen Hole Under action of Large Velocity Groundwater. Saf. Coal Mines 2020, 51, 18–25. [Google Scholar]
- Cheng, H.; Wang, B.; Zhao, J.; Yao, Z.; Rong, C. Causes for frozen wall gap in water-rich sand pebble formation and its closing technology. Coal Eng. 2021, 53, 1–8. [Google Scholar]
- Li, F.; Ding, H.; Zhang, X. Model test research of formation law of double-row-pipe freezing wall in water rich sand layer under seepage. Chin. J. Rock Mech. Eng. 2019, 38, 386–395. [Google Scholar]
- Zhang, S.; Yue, Z.; Sun, T.; Zhang, J.; Su, Y. Evolution of ground freezing temperature field under sudden seepage with stable flow rate and discriminate method of seepage. J. China Coal Soc. 2020, 45, 4017–4027. [Google Scholar]
- Zhang, J.; Qi, Y.; Yang, H.; Zhang, L. Formation rules of horizontal frozen plate with multiple rows in Beijing sandy gravel stratum under seepage condition. Chin. J. Rock Mech. Eng. 2020, 39, 3188–3196. [Google Scholar]
- Zhou, J.; Li, Z.; Tian, W. The Effects of Seepage on the Characteristics of Artificially Frozen Soil. J. Railw. Eng. Soc. 2021, 7, 12–17. [Google Scholar]
- Rong, C.; Wang, B.; Cheng, H.; Dong, Y.; Yang, F. Laboratory model test study on formation mechanisms of artificial frozen wall in permeable strata with high seepage velocity. Chin. J. Rock Mech. Eng. 2022, 41, 596–613. [Google Scholar]
- Wang, T.; He, Y.; Wu, Z.; Li, J. Effect of Groundwater Seepage on Artificial Freezing Process in Gravel Layer. China Railw. Sci. 2022, 43, 1–8. [Google Scholar]
- Harlan, R.L. Analysis of coupled heat-fluid transport in partially frozen soil. Water Resour. Res. 1973, 9, 1314–1323. [Google Scholar] [CrossRef]
- Lai, Y.; Wu, Z.; Zhu, Y.; Zhu, L. Nonlinear analyses for the coupled problem of temperature, seepage and stress fields in cold region tunnels. Chin. J. Geotech. Eng. 1999, 21, 529–533. [Google Scholar]
- Lai, Y.; Liu, S.; Wu, Z.; Wu, Y.; Konrad, J.M. Numerical simulation for the coupled problem of temperature and seepage fields in cold region dams. J. Hydraul. Res. 2002, 40, 631–635. [Google Scholar]
- Cai, H.; Yao, F.; Hong, R.; Lin, J.; Zeng, K. Multi-loop pipe freezing optimization of deep shaft considering seepage effect. Ara. J. Geosci. 2022, 15, 153. [Google Scholar] [CrossRef]
- Wang, B.; Cao, Y.; Rong, C.; Cheng, H. Study on the Mechanism and Prevention Method of Frozen Wall Maldevelopment Induced by High-Flow-Rate Groundwater. Water 2022, 14, 2077. [Google Scholar] [CrossRef]
- Pan, X.; Bai, Y.; Bai, Y.; Zhang, Z.; Miao, L. Study on the Influence Pattern of Seepage Field on Temperature Field in the Construction of the Metro Cross Passage by Freezing Method in Water-Rich Strata. Mod. Tunn. Technol. 2021, 58, 122–128. [Google Scholar]
- Vitel, M.; Rouabhi, A.; Tijani, M.; Guérin, F. Modeling heat and mass transfer during ground freezing subjected to high seepage velocities. Comput. Geotech. 2016, 73, 1–15. [Google Scholar] [CrossRef]
- Vitel, M.; Rouabhi, A.; Tijani, M.; Guérin, F. Thermo-hydraulic modeling of artificial ground freezing: Application to an underground mine in fractured sandstone. Comput. Geotech. 2016, 75, 112–125. [Google Scholar] [CrossRef]
- Alzoubi, M.A.; Nie-Rouquette, A.; Sasmito, A.P. Conjugate heat transfer in artificial ground freezing using enthalpy-porosity method: Experiments and model validation. Int. J. Heat Mass Tran. 2018, 126, 740–752. [Google Scholar] [CrossRef]
- Alzoubi, M.A.; Madiseh, A.; Hassani, F.P.; Sasmito, A.P. Heat transfer analysis in artificial ground freezing under high seepage: Validation and heatlines visualization. Int. J. Therm. Sci. 2019, 139, 232–245. [Google Scholar] [CrossRef]
- Hu, R.; Liu, Q.; Xing, Y. Case Study of Heat Transfer during Artificial Ground Freezing with Groundwater Flow. Water 2018, 10, 1322. [Google Scholar] [CrossRef]


Publisher’s Note: MDPI stays neutral with regard to jurisdictional claims in published maps and institutional affiliations. |
© 2022 by the authors. Licensee MDPI, Basel, Switzerland. This article is an open access article distributed under the terms and conditions of the Creative Commons Attribution (CC BY) license (https://creativecommons.org/licenses/by/4.0/).