Abstract
A chemical industry park (CIP) has a wide variety of hazardous chemicals, and once an accident occurs, the level of danger increases geometrically, while the domino effect may bring devastating consequences. To improve the emergency rescue capability of a chemical park and prevent the domino effect, a certain number of emergency centers are built at sites near the park for the purpose of rapid emergency rescue and deployment of emergency supplies. Based on this, in our study, a siting model of the emergency center of the chemical park, which aims to prevent the domino effect, was constructed by considering the timeliness and safety, while adopting the prevention of the domino effect as a constraint. The NSGA-II algorithm is used to solve the siting model, and the CPLEX method is used for the comparison. This study combines the prevention of the domino effect with multi-objective optimization theory, which has a good and simple applicability for solving the considered problem and can obtain solutions in line with science and reality. It also adds the risk radius of the demand point based on the traditional siting model and proposes a model that combines the risk and distance to reduce the risk of accidents across the whole region. Finally, the model is applied to a chemical park in China for an arithmetic analysis to provide decision makers with a targeted reference base for the siting of an emergency center. The experimental results show that the NSGA-II algorithm can effectively solve the model of the emergency center in the chemical park and outperforms the results obtained from the CPLEX solution in terms of its cost and safety.
1. Introduction
At present, China’s chemical and petrochemical industries have made great progress in terms of their economic efficiency, with a steady upward trend [1]. To continue promoting the vigorous development of the national chemical industry, large-scale chemical parks such as Shanghai, Ningbo and Huizhou have been built and continue to emerge in medium and small cities. A CIP is a product of the modern chemical industry that uses the industrial agglomeration model to achieve the optimal efficiency [2]. It can reduce the infrastructure costs and accelerate the conversion of raw chemical materials into others. Thus, the purpose of the internationalization of the chemical industry, maximization of the economic benefits and optimization of enterprise development is achieved. However, inside the park, the industrial operation also incorporates a large number of pipelines used for transporting chemical liquids, and many large storage tanks for chemical materials have been set up, many of which are flammable, explosive, highly toxic and corrosive and carry the radiation characteristic of hazardous materials. These hazardous sources are superimposed onto one another because of industrial clustering, and sudden accidents such as fires, explosions, toxic gas diffusion, toxic liquid leakage, radioactive material leakage, etc., produce great destructiveness in the park and also threaten the safety, lives and property of people near the park, as well as the conditions of the surrounding ecological environment. Through the statistics and analysis of 207 chemical accidents [3], it was found that the chemical accidents that can produce the domino effect account for 38.6%. Additionally, the domino effect [4] is very likely to occur in a situation of high temperature, high pressure and chemical reactions, such as oxidation reduction, brought about by different kinds of hazardous chemicals, which leads to the spreading of accidents affecting enterprises in the adjacent area and the occurrence of secondary accidents, thus expanding the scale of the accidents. Since 2015, there have been more than 10 cases of serious accidents concerning hazardous chemicals in China. For example, in March 2019, a particularly serious explosion occurred in a chemical park in Yancheng City, Jiangsu Province, killing seventy-eight people immediately, injuring more than seven hundred people, and causing economic losses of RMB 1.9 billion. When a sudden accident occurs in a chemical park, all the people in the park need to be evacuated to a safe area immediately in order to avoid their prolonged exposure to dangerous factors, such as thermal radiation and strong air currents, and emergency supplies from outside the park need to be transported to the accident site so as to improve the rescue efficiency and greatly reduce the human casualties and property damage.
However, most of the existing emergency studies have focused on the field of natural disasters, such as earthquakes, typhoons, floods, etc., with respect to multi-objective and multi-disaster emergency material deployment. For example, Liu et al. [5] examined several different passage periods, minimized the total time for dispatching paths in each period, maximized the matching of the material requirements at the distribution points and ensured the fairness of the relief material distribution. Feng et al. [6] took into account the efficiency and fairness and established a transportation deployment model for multiple types of emergency supplies throughout multiple cycles, considering the transportation cost minimization while ensuring that the first batch of emergency supplies could be fairly deployed to the disaster sites. Li et al. [7] constructed a multi-period, two-level planning model to solve the scheduling problem of post-disaster road network repair work, designed a genetic algorithm to solve the model considering the maximum relative satisfaction, and verified that the model could complete the repair of the damaged road network before the end of the planning time horizon in the case of the Wenchuan earthquake. Yu et al. [8] optimized the UAV path planning model using three constraints to understand the disaster situation and immediately carry out rescue work. Ng et al. [9] designed a model for different risk groups (children, women, elderly, etc.) and an emergency model for the rescue evacuation of people at sea among different risk groups (children, women, elderly, etc.) and different evacuation tools (lifeboats, rescue boats, marine robots, helicopters, etc.). Feng et al. [10] constructed a multi-objective optimization model for the purpose of rescue station site selection to improve the emergency response capability of each rescue team and its efficiency in emergencies. The optimization was carried out from three perspectives: the timeliness, economic efficiency and workload of rescue teams. The superiority of the model was verified by heuristic methods. Huang et al. [11] established an emergency logistics distribution path model based on uncertainty theory and used a cellular genetic algorithm to verify the feasibility of the model, considering the suddenness of the emergency events and the lack of historical data as a reference in the deployment of emergency logistics. El Sayed et al. [12] extended Zimmerman’s approach to maximize the membership and minimize the non-membership functions in the solution model and developed a novel approach for solving the fully intuitionistic fuzzy multi-objective fractional transportation problem (FIF-MOFTP). Sun et al. [13] designed a multi-objective positioning emergency logistics center model for sudden disasters with minimum total costs and the maximum satisfaction of the disaster victims. Additionally, the IABC algorithm was proposed to effectively calculate the optimal location of the emergency logistics center in sudden disasters, which can help the rescue time for different rescue locations to meet the satisfaction requirements. It is also proved that the global search capability and stability of the IABC algorithm are better than those of the ABC and GABC algorithms. Zhang et al. [14] used a hybrid optimization algorithm of an ant colony algorithm and NSGA-II to design an individual correction strategy for the multi-objective deployment of emergency supplies within a reasonable timeframe. The above studies all took natural disasters as their emergency situations and considered the distribution and dispatch of relief materials throughout different time cycles. Once a natural disaster occurs, the emergency centers in multiple locations will respond to the emergency situation at the same time and distribute a single type or multiple types of materials stored in the emergency centers and then enter the transportation link. This emergency response model pursues fairness in distributing the relief materials, minimizing the transportation time and optimizing the dispatching efficiency. However, the industries in the chemical park are complex and connected by pipelines, and the raw materials, intermediates and even the finished products used in the park are all highly dangerous sources. If an accident occurs in one chemical company, the domino effect will bring safety risks to the neighboring chemical companies in the park at the same time, causing the scale of the accident to increase geometrically. The traditional emergency response model for natural disasters is not applicable to the emergency dispatch model of chemical parks.
In recent times, the model of multi-objective decision optimization and facility siting has been widely used in various fields and has made good progress in public service facilities. For example, Wang et al. [15] established a hybrid model of an open site path considering the minimization of the post-earthquake emergency time and the minimization of the total cost of the emergency system, and they derived several non-dominated Pareto solution sets to provide a solution for decision makers. Elsisy et al. [16] introduced the modified Hungarian method for solving the interval and fuzzy assignment problem. It is used for the problem of the reuse of valuable buildings. The proposed algorithm requires less effort and time in order to reach optimality and offers a solution based on a scientific and realistic basis. Yu et al. [17] designed a bat algorithm incorporating a chaotic search mechanism to establish a time-satisfied site allocation model. J Burek [18] et al. developed a multi-objective optimization model based on life cycle assessment to identify cost efficiency optimization solutions so as to minimize the use of fossil energy and mitigate the climate change impact of Wal-Mart’s distribution center network. A Monte Carlo uncertainty analysis was also introduced to compare the solutions and evaluate the superiority of the Pareto optimal solution. Tao Wu [19] et al. raised the question of choosing the location of market hubs to maximize the total profit based on the meeting of the market demand. The validity of the results of the Lagrangian relaxation-based heuristic algorithm, compared with the CPLEX solver and the Benders decomposition method, are demonstrated by a large number of test examples. El Sayed et al. [20,21] assessed the client’s demands and vague demand for the supply of the items, adopting an interactive approach for a bi-level multi-objective supply chain model (BL-MOSCM). The proposed model assists the DM in minimizing the transportation expenses and conveyance time of a large SCN. Additionally, the paper discusses a new algorithm for generating the Pareto frontier for the bi-level, multi-objective, rough nonlinear programming problem (BL-MRNPP). This approach is mainly based on transforming the BL-MRNPP into a single-level nonlinear programming problem using the weighting method and KKT optimality conditions. Additionally, it can be applied to problems such as supply chain models, bi-level transportation models and bi-level industrial production planning problems. Kaveh [22] et al. used an improved genetic algorithm to optimize the siting layout of hospitals, aiming to select the points out of hundreds of candidate locations that could achieve the best coverage. A hierarchical analysis was introduced to limit the search space and compare the options using the genetic algorithm and particle swarm algorithm. Hu et al. [23] constructed a dual-objective, two-stage model for siting waste-to-energy facilities, considering the sustainability and economic aspects of the urban environment to help the government to identify the most cost-efficient and environmentally friendly location for siting waste-to-energy facilities under conditions of uncertainty. Kaveh et al. [24] identified vulnerable urban infrastructure in regard to cascading hazards and used GIS to prioritize urban areas according to the severity of the cascading hazards. A bi-objective multi-material distribution center siting model was constructed under uncertainty conditions. The model was solved using an invasive weed optimization algorithm. Wu et al. [25] used microblogging big data to obtain public opinion information on urban stormwater flooding disasters, while constructing a model for siting urban emergency logistics in stormwater flooding disaster situations. The NSGA-III algorithm was used to identify the optimal deployment path of the emergency logistics, which provides a reference for cities to cope with storm waterlogging disasters. The abovementioned research on urban infrastructure siting is making good progress, but emergency siting studies related to chemical parks are relatively rare. In the context of the vast territory of China, which has the largest population in the world and dense and complex urban planning lines, it is difficult for the firefighting and rescue forces to access the chemical parks established in the suburbs around the cities and almost impossible to meet the requirements for achieving the rescue within minutes. Additionally, different regions have relatively different levels of firefighting resource allocation because of differences due to economic and cultural factors. If the rescue is not timely, in addition to the accident point, the enterprises adjacent to the accident point will also be affected by the domino effect, making the situation more serious. Therefore, the establishment of multiple reasonably sized emergency centers in the vicinity of chemical parks can aid in the immediate initiation of the emergency response.
By referring to the above research results, it is found that there are few studies on emergency siting in the case of chemical parks, and few of them investigate how to prevent the domino effect in order to prevent the accident scale from expanding, and there is a lack of targeted mathematical models. Therefore, based on the previous academic research, this paper uses NSGA-II to solve a siting model of the chemical park emergency center that can effectively prevent the domino effect and satisfy the timeliness, economic and safety requirements so as to optimize the layout of the chemical park emergency center and provide a basis for decision makers involved in siting decisions. The CPLEX method is also introduced to verify the superiority of the NSGA-II algorithm in solving this model.
2. Siting Model
2.1. Description of the Problem
The establishment of an emergency center of a certain scale near the chemical park can improve the rescue efficiency, shorten the emergency time and greatly help to save lives and properties. At the same time, a reasonably located emergency center can also quickly deploy relief supplies to prevent secondary accidents caused by the domino effect. As the main dispatching point for rescue and relief when an accident occurs, individuals deciding on the location of the emergency center need to consider various factors, such as safety, timeliness, emergency costs and other factors.
If the emergency center aims to provide long-term and stable services during an accident, it must first ensure its own safety before it can effectively carry out rescue tasks for each accident site. The safety aspects are based on the “Design Code for Disaster Prevention and Sheltering Places” and, combined with the layout factors of the chemical park itself, different safety levels of the emergency center in the chemical park are obtained. A variety of safety factors need to be considered in regard to the site selection safety factor, such as the distance of the risk radius between the emergency center and the accident-prone area, the proximity of water sources for a sufficient water supply, the capacity for protection against extensive damage and wind direction problems, all of which can be used as references for the scoring of the emergency center site selection safety factor.
In the case of a sudden hazardous chemical accident in a chemical park, if the relief is not timely, the chain reaction brought about by the domino effect will allow the thermal radiation, strong airflow and flying debris generated in the accident area to impact the neighboring areas, leading to secondary accidents. Therefore, in terms of timeliness, the emergency response needs to be carried out immediately upon the occurrence of the accident. When deploying emergency forces for the rescue of the accident site, emergency measures should also be carried out for the nearby potential accident sites, such as spraying cool water to reduce the heat radiation affecting the storage tanks and burying the leaking chemicals with sand to prevent the further expansion of the accident scale. Additionally, the average travel time of emergency vehicles and the maximum travel time that can be taken to reach the accident point need to be considered in the case of a disaster.
The cost of establishing emergency centers of different sizes and capacities varies, but regardless of the size, the cost of establishing an emergency center is relatively high; thus, the cost of site selection is such that once the emergency center is established, the location of the emergency center will not be changed for a long period of time. Additionally, the number of emergency centers should be balanced according to the size of the incident, and the costs of transportation from the emergency center to the incident point should be as small as possible if all the incident points are covered.
In order to highlight the focus, the following basic agreement on the siting of the emergency center in the chemical park is reached:
(a) All emergency rescue vehicles can reach the accident point, without considering the damage to the road network.
(b) All types of emergency rescue vehicles have the same travel speed and their unit travel costs are the same.
(c) The construction cost of the emergency response center is known and there is sufficient financial support available for the establishment of the emergency response center.
(d) The emergency centers are distributed in a point pattern, with each point representing a site building area, and the actual distance from the emergency center to the incident point is known.
(e) Each emergency center is capable of meeting the material needs of each demand point.
2.2. Mathematical Model
The meanings of the symbols used in the modeling are as follows:
① Decision-making variables:
, is a 0–1 decision variable with the value of 1 if the emergency center is established at the candidate site j of the emergency center, and 0 otherwise.
, is a 0–1 decision variable with a value of 1 if incident point i is provided with rescue by the emergency center candidate site j, and 0 otherwise.
, is a 0–1 decision variable with a value of 1 if incident point i is rescued by emergency center candidate site j and the rescue is provided by a vehicle of type k. Otherwise, it is 0.
② Subscripts
, ( = 1, 2…) emergency accident site number.
, ( = 1, 2…) emergency center candidate site number.
, ( = 1, 2…) rescue vehicle type serial number.
, ( = 1, 2…) rescue material type serial number.
③ Constants
represents the construction cost of establishing an emergency center.
represents the risk radius at accident point i.
represents the total number of sites eventually built for the emergency response center.
represents the distance from emergency center j to accident point i.
represents the maximum number of rescue vehicles k.
represents the safety factor for siting emergency centers.
represents the time of tank failure at accident point i.
represents the unit travel speed of the rescue vehicle k.
represents the unit travel cost of rescue vehicle k.
represents the demand for the sth material at incident point i.
represents the upper load capacity of the kth type of vehicle.
From the definition of the abovementioned modeling parameters, the siting model of the chemical park emergency center is established as follows:
S.t.
Equation (1) is the objective function of minimizing the cost of siting the emergency center, and the cost of siting the emergency center includes the cost of building the emergency center and the cost of transporting the emergency vehicles. Equation (2) is the objective function of maximizing the safety of the emergency center siting, which is defined by the product of the safety factor and the distance of the risk radius. Equation (3) ensures that each incident point can be rescued. Equation (4) ensures that only the selected emergency center can provide rescue to the incident point. Equation (5) is the total number of final sites for the emergency center, ensuring that only a maximum of one emergency center can be built at each site selected. Equation (6) ensures that the distance between the emergency center and the incident point is greater than the risk radius at the incident point so as to ensure that the result of Equation (2) is a constant positive. Equation (7) is the upper limit of the number of rescue vehicles of the first kind and determines the number of vehicles that can be dispatched from the emergency center. Equation (8) is the constraint used to prevent the domino effect. It is necessary to control the time of the travel of the rescue vehicles to the accident point within the tank failure time. Equation (9) ensures that the number of supplies meets the demand at the accident point. Equation (10) is the constraint range under a given determination condition.
2.3. Tank Failure Time Formula
The constraint time in formula (11) is the time taken for the failure of the tank at the accident point due to thermal radiation. Emergency rescue vehicles arrive at the rescue site within the tank failure time to cool the tank by sprinkling water on and cooling the tank to extend the failure time, thus achieving the purpose of reducing the occurrence of domino accidents. Since the failure time involves thermodynamic and transport properties and requires a great deal of computational time, it is difficult to obtain accurate scenario data. Therefore, Landucci [26] obtained an equation to conservatively estimate the failure time of the tank based on experimental data, where the equation is the thermal radiation (in units) received by the tank at the accident point and the volume of the tank. The specific equation is as follows:
3. Algorithm Design
3.1. NSGA-II
The emergency siting problem is a multi-objective optimization problem containing multiple constraints, and such problems are usually NP-hard problems, for which it is difficult to reach an exact solution in the polynomial time. The objective function in this paper is modified from the traditional P-median 0–1 integer programming problem, and it is difficult to obtain the optimal solution using exact computation. Thus, the NSGA-II [27] algorithm is introduced in this paper to solve the model. The NSGA-II algorithm is improved by the first generation of the non-dominated ranking genetic algorithm. The NSGA-II algorithm addresses the shortcomings of the first generation of non-dominated genetic algorithms by improving three aspects: proposing a fast non-dominated ranking algorithm, introducing an elite strategy and using a crowding comparison operator. It is one of the most frequently used multi-objective evolutionary algorithms, while this algorithm has been widely used in the literature to solve various types of multi-objective scheduling optimization problems [28]. Moreover, its use of a non-dominated sorting hierarchy offers the good genes a greater chance of being inherited by the next generation, while the crowding degree strategy causes the individuals on the quasi-Pareto surface to be uniformly distributed, maintains the population diversity, overcomes the overpopulation and prevents the premature convergence of understanding, representing a better algorithm with a comprehensive performance. The flow chart of the NSGA-II algorithm is shown in Figure 1.
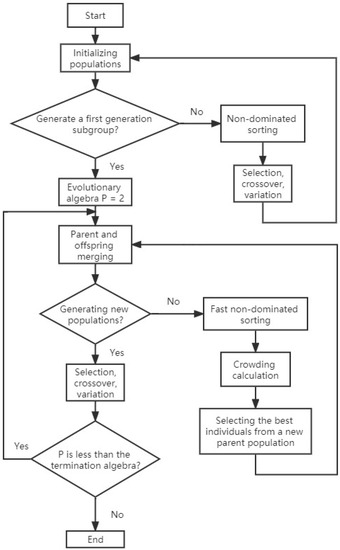
Figure 1.
NSGA-II algorithm flow chart.
3.1.1. Fast Non-Dominated Sorting
The fast non-dominated sorting algorithm merges the parent and child populations while reducing the computational complexity, so that the new generation population is selected from the doubling region, allowing the best individuals in both populations to be preserved. The fast non-dominated sorting strategy is as follows. First, for each solution p, define two variables: (1) The domination number np, which indicates the number of solutions that dominate the solution p. If n = 0, this means that p is a non-dominated solution. (2) On the other hand, sp denotes the set of solutions governed by the solution p. As shown in Figure 2, each point in the figure represents a solution of the objective function (for ease of understanding, the objective function f2 in this paper is transformed into the problem of finding the minimum value). Since the objective function values of p, q and r are better than those of point a, point a is dominated by p, q and r, na = 3, sr = {a, b, c}. Similarly, all the individuals were compared in terms of their dominance and non-dominance relationships, as defined above, until all the non-dominant individuals were found as the first level of the non-dominant stratum (Pareto first frontier) of the current population. Therefore, this process continues until the whole population is stratified.
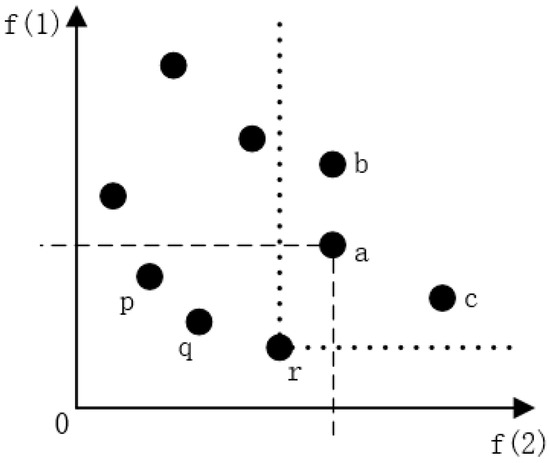
Figure 2.
Schematic diagram of fast non-dominated sorting.
3.1.2. Elite Strategy
The elite strategy can ensure that the best individuals in the population are not lost in the evolutionary process and can continue to participate in reproducing the next generation to obtain better individuals, which essentially improves the accuracy of the optimization results. The elite strategy is as follows. First, the new generation population P(t+1) is obtained by merging the parent population P(t) and the offspring population Q(t), and the population size of P(t+1) is 2N. Then, the infeasible individuals in the parent population are eliminated first after testing. Next, the different dominance layer populations are placed in P(t+1) sequentially according to the non-dominance ranking, from lowest to highest, until they are complete.
3.1.3. Crowding Comparison
The crowding degree comparison operator replaces the shared minor habitat strategy and overcomes the drawbacks of the artificially specified shared parameters in NSGA, enabling individuals in the population to extend to the entire Pareto scope and maintaining population diversity. The crowding degree strategy is as follows. When two individuals belong to the same non-dominated layer, the crowding degree, obtained by calculating the crowding distance, is used to determine which of the two has the higher priority. As shown in Figure 3, assume that the three points p, q and r are in the same non-dominated layer. A rectangular region is created with the two solutions p and r adjacent to point q as the vertices. The crowding distance dq of solution q is calculated using the crowding distance formula of non-boundary individuals. Then, the algorithm is guided to search progressing toward the uniformly distributed Pareto frontier by defining the crowding distance comparison operator, and the solution with a large crowding distance in the same frontier is preferentially selected to maintain the population diversity [29].
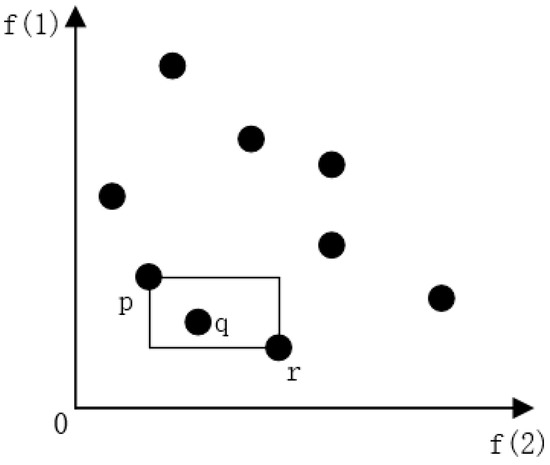
Figure 3.
Schematic diagram of the crowded distance.
3.2. Algorithm Solution Steps
For the site selection model of the emergency center of the chemical park, the perimeter of the chemical park is divided into several regions, and each region is regarded as a candidate site for the emergency center. Then, the crossover and variation operators [30] are designed according to the characteristics of each accident point and the attributes of each target, and then the value of each objective function is obtained by calculation. Thereby, the search for the location of the emergency center around the accident point is considered as chromosome multiple iterative evolutions, and the following are the solution steps of the NSGA-II algorithm, combined with the method in this paper:
Step1: Adopt real number coding and randomly generate the initial population according to the constraints, and then set the number of termination iterations.
Step2: Input data information on the required parameters, such as the coordinates of the candidate emergency centers and incident points.
Step3: Calculate the objective function value of each individual in the initial population. Perform the fast non-dominated sorting of the initial population according to the objective function value and obtain the crowding degree of each individual.
Step4: Selection, crossover and mutation of the initial population to generate the new generation population.
Step5: Merge the initial population with the new generation population. Then, the mixed populations are sorted by fast non-dominance, and the crowding degree of each individual is obtained.
Step6: Select the best number of individuals to form a new population based on their non-dominance rank and crowding degree.
Step7: Determine whether the termination condition (such as the number of termination iterations) is satisfied. If the termination condition is satisfied, jump out of the loop; if not, then return to Step 3 to continue the genetic operation on the population.
4. Algorithm Performance Comparison
To verify the effectiveness of using NSGA-II to solve the siting model constructed in this paper, this section compares the results obtained using the two methods. Both NSGA-II and CPLEX can solve siting problems with multiple constraints. CPLEX, as a commercial optimization engine, can solve four basic types of problems, including large-scale linear programming (LP), quadratic programming (QP), and quadratic programming with constraint (CPLEX can be called by the environments of Matlab, Java, Python and C++). In the case of larger models, its support for multi-threaded and distributed parallel optimization is usually beneficial in improving the speed of the solution. Here, we presume two emergency scenarios for the chemical parks. In Scenario 1, there are six accident points and five emergency center candidate sites. In Scenario 2, there are 15 accident points and 10 emergency center candidate sites. In these two scenarios, two and three sites are selected as the final sites for the emergency center. In each scenario, the values of the fitness functions obtained using the two methods are compared. For comparative purposes, the two max–min objective functions are weighted here. The first objective function is weighted by 0.7, and the second objective function is taken as the opposite value and weighted by 0.3. For the most part, TOPSIS exchange objectives, which are clashing and non-commensurable, are transformed into bi-objective commensurable and, most of the time, clashing functions. Then, the max–min [31] operator is deemed to disband the incongruity of both criteria. This study used Visual Studio 2019 as the runtime environment for NSGA-II and CPLEX, respectively, to design code programs for the two abovementioned methods so as to solve the optimization problem for the siting model, and the values of the two scenarios were factored into the siting model in the model, and the solution results are shown in Figure 4 and Figure 5.
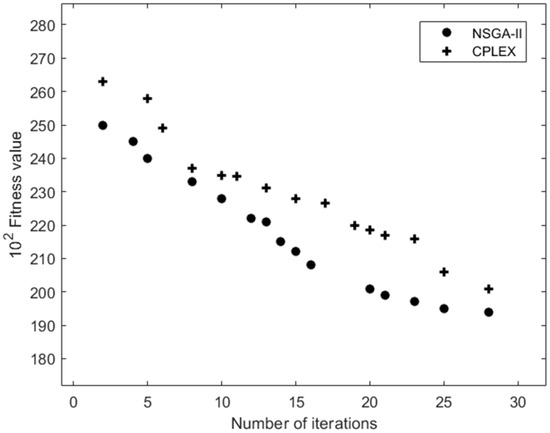
Figure 4.
Iterative graph of fitness values under scenario 1.
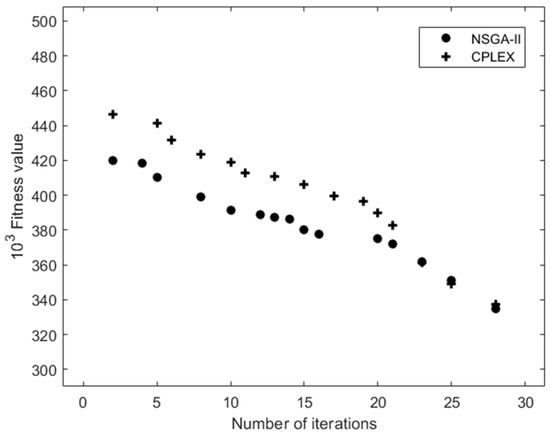
Figure 5.
Iterative graph of the fitness values in Scenario 2.
The optimal fitness values obtained by comparing NSGA-II and CPLEX after several iterations with different generations are compared. It can be seen from Figure 4 that the optimal solution obtained by NSGA-II is better than the optimal solution obtained by CPLEX for Scenario 1, with six incident points and five emergency center candidate sites. Therefore, NSGA-II outperforms the CPLEX method in Scenario 1. As can be seen in Figure 5, the optimal solution obtained by CPLEX almost overlaps with the optimal solution obtained by NSGA-II in Scenario 2, with 15 accident points and 10 emergency center candidate sites, but the performance of NSGA-II is still slightly better than that of the CPLEX method. By comparing the results of the NSGA-II and CPLEX methods by designing two emergency scenarios for chemical parks of different scales, the effectiveness of NSGA-II in solving the emergency center siting model can be verified.
5. Case Study
5.1. Case Description
A chemical park in the north is used as a context with which to discuss the optimization of the reasonable layout of the emergency rescue facilities near the park in the event of sudden fires and explosions over the course of the industrial operations in the park. The chemical park is mainly divided into four areas, containing gas and petrochemical, fine processing, pharmaceutical and building materials. There are 54 known enterprises stationed in the park, including 25 chemical enterprises, 1 gas filling and gas supply station, and 4 gas stations. According to the actual situation of the chemical park, the specific coordinates and material requirements of each emergency accident point are known, and the specific information is shown in Table 1. The hazard source identification information of each emergency accident point is shown in Table 2.

Table 1.
Coordinates of the emergency accident points.
Table 2.
Identification of the hazard sources at each emergency accident point.
Since the unexpected accident is random, the location and time of the accident cannot be predicted in advance. At the same time, if an accident occurs in the area of one enterprise in the park, the accident will spread if the emergency rescue operation is not carried out before the domino effect occurs. Therefore, in order to cope with unexpected accidents and prevent the domino effect, the layout of the emergency center site must be optimized. First, the area around the park was divided into 18 zones. Then, 15 locations among the 18 areas were selected as candidate sites for the emergency center, considering various safety factors, i.e., J = 15. Ignoring the road conditions, weather and other influencing factors, the distances between the candidate sites and each accident site are shown in Table 3.
Table 3.
Distance from the candidate emergency center to each accident point.
According to the tank failure time formula (11), the shortest tank failure time for each accident point is used as the drive time constraint, and the travel time required for the vehicles of the emergency center to reach each accident point must be controlled within the reachable drive range before the failure of the storage pipe. If it cannot arrive before the failure of the storage tank at the accident point, the emergency center cannot provide rescue for the accident point when the arrival is overdue, i.e., 0. The specific reachable travel area information is shown in Table 4.
Table 4.
Accident points reachable by vehicles.
Through the relevant data collection, the site cost of the emergency center was determined to be 15 (CNY 15 million), i.e., C = 15. The decision maker finally decided to select three of the 15 candidate sites as the final sites for the emergency center, i.e., N = 3.
5.2. Example Analysis
In summary, the final number of sites for the emergency center is known, while the combination of two objective functions with a min–max adversarial relationship are solved within the given constraints to determine the final site. The model is solved using the NSGA-II algorithm with the WIN10 operating system. The running environment is Visual Studio 2019, with a 4 GB internal memory and intel quad-core 2.5 GHz processor, and the programming language is C++. The population size is set to 100, the number of iterations is 30, the crossover probability is 0.8 and the variance probability is 0.2. Figure 6 and Figure 7 depict the convergence effect of NSGA-II in the two-objective case. From Figure 6, it can be seen that the initial solutions are divided into several different frontier classes, and most of the solutions are dominant solutions. The minimum site construction cost is 1.27 million and the maximum security value is 12,790. When the number of iterations of the algorithm reaches the set maximum, the Pareto optimal solution is formed, and all the solutions are non-dominated at this time. From Figure 7, it can be seen that the minimum site construction cost using the Pareto optimal solution is USD 662,900,000 and the maximized security value is 62,296.83, and the optimization ratio reaches 47% and 79%, respectively. Since the Pareto optimal solution is not one obtained after multiple repetitive tests, the advantages and disadvantages of each solution cannot be directly compared. Therefore, five groups of Pareto optimal site construction solutions with more occurrences were selected for the cross-sectional comparison, and the results of the five groups are shown in Table 5.
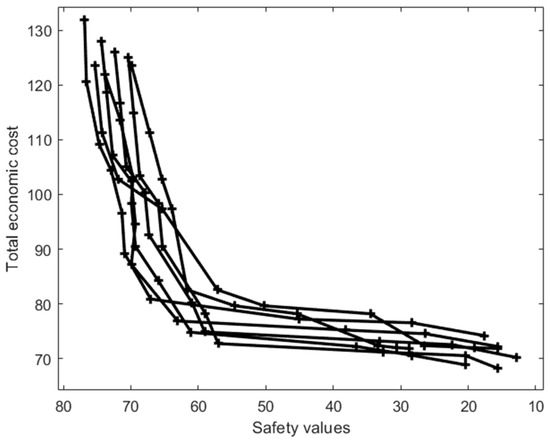
Figure 6.
Plot of the initial solution distribution under the dual objective.
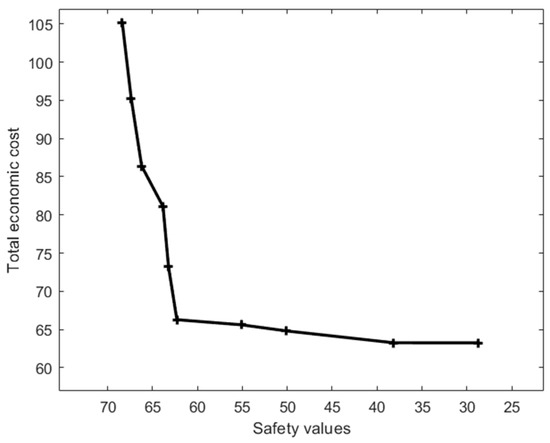
Figure 7.
Plot of the optimal solution distribution under the dual objective.
Table 5.
Pareto optimal solution for the emergency center location.
All five emergency center siting options shown in Table 5 can reach the incident point before the tank failure. Since the Pareto optimal solution is not unique, and each objective function measures different criteria, it is not possible to directly compare the advantages and disadvantages of the five siting options. Therefore, in this paper, min–max normalization is introduced to normalize the data and linearly transform the original data. Normalization refers to the process of correcting the data according to the changing relationships between the relevant variables to achieve the requirement of meeting equal needs or achieving the same purpose. Max is the maximum value of the sample data and min is the minimum value of the sample data. The conversion function is shown in Equation (12). The normalized values of each objective function after processing are shown in Table 6. The normalized, processed results are analyzed using five typical weighting coefficients, and the weighted results are shown in Table 7.
Table 6.
The objective function after normalization.
Table 7.
Pareto optimal solution weighted results.
The results show that when α = 0, β = 1, i.e., only the safety maximization is considered for the siting of the emergency center in the chemical park, Option 1 can achieve the target expectation under this weighting factor constraint. When α = 0.25, β = 0.75, i.e., both demand objectives are considered, but the priority is to maximize safety, Option 1 can achieve the target expectation under this weighting factor constraint. When α = 0.5 and β = 0.5, i.e., the two demand objectives are considered simultaneously and equivalently, Option 1 can achieve the target expectation under this weighting factor constraint. When α = 0.75 and β = 0.25, i.e., both demand objectives are considered simultaneously, but the priority is cost minimization, Option 1 can achieve the target expectation under this weighting factor constraint. When α = 1 and β = 0, i.e., only the cost minimization of the siting of the emergency center in the chemical park is considered, Option 1 can achieve the target expectation under this weighting factor constraint. The final site selection for the emergency center in the chemical park was determined as Option 1, i.e., three candidate sites, j2, j4 and j12, were selected as the final emergency center facility sites. Since the accident sites i1, i6, i7, i9, and i16 are far away from the dense enterprise area on the east side of the park, while, at the same time, their own hazardous chemical content is high, there are also a domino effect accident characteristics. Thus, we must choose one of the candidate sites j12, j13, j14, and j15 near these five accident sites to establish an emergency center. It is possible to provide timely rescue and relief to these five accident sites, while the resources of the other two candidate sites can be reasonably allocated to provide emergency services to the dense accident sites in the southeast part of the park in a timely manner, without causing waste of the resources and, at the same time, achieving the aim of cost control. The results of Option 1, obtained from the solution of the CPLEX method, are then compared with those of NSGA-II, and the results are shown in Figure 8.
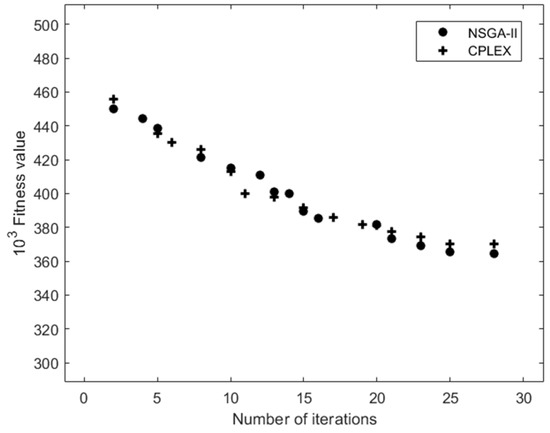
Figure 8.
Plot of the iteration of the fitness value for Scenario 1.
From Figure 8, it can be seen that the initial solution obtained by NSGA-II is better than the initial solution obtained by CPLEX, and the optimal solution obtained by NSGA-II is still slightly better than the optimal solution obtained by the CPLEX method. Therefore, the performance of NSGA-II is still better than that of the CPLEX method. From the above analysis, it can be found that the site selection result of Option 1 can enable each accident site to be rescued before the failure of the chemical storage tanks, which will prevent the domino effect and, thus, serious accidents. At the same time, the results of Option 1 are obtained under the premise that NSGA-II is more effective and closer to the target expectation after normalization. Thus, the three candidate sites of Option 1 are selected as the final site locations of the chemical park emergency center. Using the NSGA-II algorithm to solve the multi-objective emergency center siting model of chemical parks can obtain different Pareto solution sets, without falling into local optimum and premature convergence, and at the same time, it takes less time to obtain feasible results in a short time. With respect to the different decision-making judgments of decision makers, the Pareto solution set can be quadratically analyzed by placing weight constraints on the objectives, which enables decision makers to consider the site selection objectives from various perspectives and provides decision makers with a targeted reference basis for the site selection of emergency centers in chemical parks.
6. Conclusions
This paper introduces the concept of the prevention of the domino effect in relation to the traditional P-Median siting problem, constructs a multi-objective optimization model for siting emergency centers in chemical parks using the time for the failure of the storage tanks storing hazardous chemicals as a constraint, and solves the siting model using the NSGA-II algorithm to obtain an effective Pareto solution. The feasibility of the model and the superiority of the NSGA-II algorithm are analyzed in comparison to the results of the test cases obtained by solving the CPLEX method. At the same time, the model provides a scientific and reasonable reference basis for decision makers tasked with choosing the location of the emergency center in the chemical park, which is practically useful. It can fundamentally reduce the waste of resources and avoid the loss caused by hazardous chemical accidents of a given order of magnitude. However, there are some shortcomings of the study. In this paper, only one kind of emergency material was considered, and the types of emergency materials can be increased in the future. Meanwhile, there are different kinds of hazardous chemicals, and the corresponding emergency materials must be selected according to their characteristics. In the future, we will consider more complex site selection planning for the deployment of emergency materials and escape routes in the context of accidents caused by hazardous chemicals. Meanwhile, the algorithm will be improved to enhance the efficiency of the solution. A GIS-based database of hazardous materials and vehicles will also be considered and implemented using specific algorithms to improve the efficiency of the algorithm in processing the initial data and facilitate direct access to the data required for the experiment.
Author Contributions
Conceptualization, K.C. and J.G.; methodology, J.G.; software, J.G.; validation, Y.L., L.L. and L.W.; formal analysis, K.-N.C.; investigation, K.-N.C.; resources, K.C.; data curation, J.G.; writing—original draft preparation, J.G.; writing—review and editing, K.C.; visualization, L.W.; supervision, L.L.; project administration, Y.L.; funding acquisition, K.C. All authors have read and agreed to the published version of the manuscript.
Funding
This research was funded by the Korea-China Young Researchers Exchange Program (2020), the Science Foundation of Shenyang University of Chemical Technology (No.LQ2020020), and the Natural Science Foundation of Liaoning Province (No. 2021-MS-259).
Data Availability Statement
The data used to support the findings of this study are available from the corresponding author upon request.
Conflicts of Interest
The authors declare no conflict of interest.
References
- Hong, D. Progress of China’s petrochemical industry in 2013 and outlook for 2014. Chem. Ind. Eng. Prog. 2014, 33, 1633–1658. [Google Scholar]
- Wang, H.; Ma, Y. Safety risk assessment technology of Chemical Industrial Park based on grid partition and information diffusion theories. In Proceedings of the 2009 IEEE International Conference on Grey Systems and Intelligent Services (GSIS 2009), Nanjing, China, 10–12 November 2009. [Google Scholar]
- Kourniotis, S.P.; Kiranoudis, C.T.; Markatos, N.C. Statistical analysis of domino chemical accidents. J. Hazard. Mater. 2000, 71, 239–252. [Google Scholar] [CrossRef]
- Darbra, R.M.; Palacios, A.; Casal, J. Domino effect in chemical accidents: Main features and accident sequences. J. Hazard. Mater. 2010, 183, 565–573. [Google Scholar] [CrossRef]
- Liu, Y.; Zhang, G.; Su, Z.; Jiang, J. Modeling and solving multi-phase allocation and scheduling of emergency relief supplies. Control. Decis. 2019, 34, 2015–2022. [Google Scholar] [CrossRef]
- Feng, C.; Xiang, Y.; Xue, K.; Feng, R. Multi-objective Optimization Model of the Mmergency Logistics Distribution with Multicycle and Multi-item. Chin. J. Manag. Sci. 2017, 25, 124–132. [Google Scholar] [CrossRef]
- Li, S.; Teo, K.L. Post-disaster multi-period road network repair: Work scheduling and relief logistics optimization. Ann. Oper. Res. 2019, 283, 1345–1385. [Google Scholar] [CrossRef]
- Yu, X.; Li, C.; Zhou, J. A constrained differential evolution algorithm to solve UAV path planning in disaster scenarios. Knowl.-Based Syst. 2020, 204, 106209. [Google Scholar] [CrossRef]
- Ng, C.T.; Cheng, T.C.E.; Levner, E.; Kriheli, B. Optimal bi-criterion planning of rescue and evacuation operations for marine accidents using an iterative scheduling algorithm. Ann. Oper. Res. 2020, 296, 407–420. [Google Scholar] [CrossRef]
- Feng, J.; Gai, W.; Li, J. Multi-objective optimization of rescue station selection for emergency logistics management. Saf. Sci. 2019, 120, 276–282. [Google Scholar] [CrossRef]
- Xiaoxia, H.; Liying, S. An emergency logistics distribution routing model for unexpected events. Ann. Oper. Res. 2018, 269, 223–239. [Google Scholar]
- El Sayed, M.A.; Abo-Sinna Mahmoud, A. A novel Approach for Fully Intuitionistic Fuzzy Multi-Objective Fractional Transportation Problem. Alex. Eng. J. 2021, 60, 1447–1463. [Google Scholar] [CrossRef]
- Qiang, S.; Shupei, L. Locating abrupt disaster emergency logistics centres using improved artificial bee colony (IABC) algorithm. Sci. Prog. 2021, 104, 00368504211016205. [Google Scholar]
- Zhang, G.; Wang, Y.; Su, Z.; Jiang, J. Modeling and solving multi-objective allocation-scheduling of emergency relief supplies. Control. Decis. 2017, 32, 86–92. [Google Scholar] [CrossRef]
- Wang, H.; Du, L.; Ma, S. Model and Algorithms for Integrated Open Location and Routing Problem in Emergency Logistics under Earthquake. J. Ind. Eng. Eng. Manag. 2016, 30, 108–115. [Google Scholar] [CrossRef]
- Elsisy, M.A.; Elsaadany, A.S.; El Sayed, M.A. Using Interval Operations in the Hungarian Method to Solve the Fuzzy Assignment Problem and Its Application in the Rehabilitation Problem of Valuable Buildings in Egypt. Complexity 2020, 11, 9207650. [Google Scholar] [CrossRef]
- Yu, D.; Gao, L.; Zhao, S. Location-allocation Optimization Model for Emergency Facilities and Algorithm with Maximum Time Satisfaction. Syst. Eng. 2018, 36, 95–102. [Google Scholar]
- Burek, J.; Nutter, D.W. A life cycle assessment-based multi-objective optimization of the purchased, solar, and wind energy for the grocery, perishables, and general merchandise multi-facility distribution center network. Appl. Energy 2018, 235, 1427–1446. [Google Scholar] [CrossRef]
- Tao, W.; Zhongshun, S.; Canrong, Z. The hub location problem with market selection. Comput. Oper. Res. 2021, 127, 105136. [Google Scholar]
- El Sayed, M.A.; Farahat, F.A.; Elsisy, M.A. A novel interactive approach for solving uncertain bi-level multi-objective supply chain model. Comput. Ind. Eng. 2022, 169, 108225. [Google Scholar] [CrossRef]
- Elsisy, M.A.; El Sayed, M.A.; Abo Elnaga, Y. A novel algorithm for generating Pareto frontier of bi-level multi-objective rough nonlinear programming problem. Ain Shams Eng. J. 2020, 2, 2125–2133. [Google Scholar] [CrossRef]
- Kaveh, M.; Kaveh, M.; Mesgari, M.S.; Paland, R.S. Multiple criteria decision-making for hospital location-allocation based on improved genetic algorithm. Appl. Geomat. 2020, 12, 291–306. [Google Scholar] [CrossRef]
- Hu, C.; Liu, X.; Lu, J. A bi-objective two-stage robust location model for waste-to-energy facilities under uncertainty. Decis. Support Syst. 2017, 99, 37–50. [Google Scholar] [CrossRef]
- Khalili-Damghani, K.; Tavana, M.; Ghasemi, P. A stochastic bi-objective simulation–optimization model for cascade disaster location-allocation-distribution problems. Ann. Oper. Res. 2021, 309, 103–141. [Google Scholar] [CrossRef]
- Wu, X.; Cao, Y.; Xiao, Y.; Guo, J. Finding of urban rainstorm and waterlogging disasters based on microblogging data and the location-routing problem model of urban emergency logistics. Ann. Oper. Res. 2018, 290, 221–258. [Google Scholar]
- Landucci, G.; Molag, M.; Reinders, J.; Cozzani, V. Experimental and analytical investigation of thermal coating effectiveness for 3m 3 LPG tanks engulfed by fire. J. Hazard. Mater. 2008, 161, 1182–1192. [Google Scholar] [CrossRef] [PubMed]
- Deb, K.; Agrawal, S.; Pratap, A.; Meyarivan, T. A fast and elitist multiobjective genetic algorithm: NSGA-II. IEEE Trans. Evol. Comput. 2002, 6, 182–197. [Google Scholar] [CrossRef]
- Abido, M.A.; Elazouni, A. Modified multi-objective evolutionary programming algorithm for solving project scheduling problems. Expert Syst. Appl. 2021, 183, 115338. [Google Scholar] [CrossRef]
- Hu, R. Research on Multi-Objective Optimization Algorithm Based on Hybrid Population Intelligence; Dalian Maritime University: Dalian, China, 2019. [Google Scholar] [CrossRef]
- Gaurav, S.; Alok, S.; Rammohan, M. NSGA-II with objective-specific variation operators for multiobjective vehicle routing problem with time windows. Expert Syst. Appl. 2021, 176, 114779. [Google Scholar]
- El Sayed, M.A.; Baky, I.A.; Singh, P. A modified TOPSIS approach for solving stochastic fuzzy multi-level multi-objective fractional decision making problem. Opsearch 2020, 57, 1374–1403. [Google Scholar] [CrossRef]
Publisher’s Note: MDPI stays neutral with regard to jurisdictional claims in published maps and institutional affiliations. |
© 2022 by the authors. Licensee MDPI, Basel, Switzerland. This article is an open access article distributed under the terms and conditions of the Creative Commons Attribution (CC BY) license (https://creativecommons.org/licenses/by/4.0/).