Article

Targeted Metabolic Analysis and MFA of Insect Cells Expressing Influenza HA-VLP

by
Alexandre B. Murad
1,2,3,
Marcos Q. Sousa
2,3,†,
Ricardo Correia
2,3,
Inês A. Isidro
2,3,
Manuel J. T. Carrondo
2 and
António Roldão
2,3,*
1
Laboratório de Engenharia de Cultivos Celulares, COPPE, Universidade Federal do Rio de Janeiro, Av. Pedro Calmon, s/n, Rio de Janeiro 21941-596, Brazil
2
iBET, Instituto de Biologia Experimental e Tecnológica, Apartado 12, 2781-901 Oeiras, Portugal
3
Instituto de Tecnologia Química e Biológica António Xavier, Universidade Nova de Lisboa, Av. da República, 2780-157 Oeiras, Portugal
*
Author to whom correspondence should be addressed.
Current address: Bayer AG, Pharmaceuticals-Product Supply, 40789 Leverkusen, Germany.
Processes 2022, 10(11), 2283; https://doi.org/10.3390/pr10112283
Submission received: 20 September 2022 / Revised: 25 October 2022 / Accepted: 1 November 2022 / Published: 4 November 2022
(This article belongs to the Special Issue State of the Art of Protein Expression Systems)

Abstract

:
Virus-like particles (VLPs) are versatile vaccine carriers for conferring broad protection against influenza by enabling high-level display of multiple hemagglutinin (HA) strains within the same particle construct. The insect cell-baculovirus expression vector system (IC-BEVS) is amongst the most suitable platforms for VLP expression; however, productivities vary greatly with particle complexity (i.e., valency) and the HA strain(s) to be expressed. Understanding the metabolic signatures of insect cells producing different HA-VLPs could help dissect the factors contributing to such fluctuations. In this study, the metabolic traces of insect cells during production of HA-VLPs with different valences and comprising HA strains from different groups/subtypes were assessed using targeted metabolic analysis and metabolic flux analysis. A total of 27 different HA-VLP variants were initially expressed, with titers varying from 32 to 512 HA titer/mL. Metabolic analysis of cells during the production of a subset of HA-VLPs distinct for each category (i.e., group 1 vs. 2, monovalent vs. multivalent) revealed that (i) expression of group-2 VLPs is more challenging than for group-1 ones; (ii) higher metabolic rates are not correlated with higher VLP expression; and (iii) specific metabolites (besides glucose and glutamine) are critical for central carbon metabolism during VLPs expression, e.g., asparagine, serine, glycine, and leucine. Principal component analysis of specific production/consumption rates suggests that HA group/subtype, rather than VLP valency, is the driving factor leading to differences during influenza HA-VLPs production. Nonetheless, no apparent correlation between a given metabolic footprint and expression of specific HA variant and/or VLP design could be derived. Overall, this work gives insights on the metabolic profile of insect High Five cells during the production of different HA-VLPs variants and highlights the importance of understanding the metabolic mechanisms that may play a role on this system’s productivity.

1. Introduction

Virus-like particles (VLPs) are nanoparticles that mimic the organization and shape of native viruses but lack a viral genome, thereby being safe vaccine carriers. VLPs present several advantages over other subunit vaccines, such as highly repetitive presentation of conformational epitopes [1]. Commercially available VLP-based vaccines include those against hepatitis B and E viruses, and human papillomavirus [2,3].
VLPs technology has been broadly used at the academic level to develop vaccine candidates against a broad range of infectious diseases, including influenza [4,5,6]. Antigenic drift (accumulation of amino acids mutation caused by error-prone viral polymerase action, especially for influenza’s main antigen protein hemagglutinin (HA)) [7] and shift (genetic reassortment in animal reservoirs) [8] can result in the emergence of viruses capable of avoiding a pre-immunized host immune system, potentially causing epidemic and pandemic outbreaks and demanding the annual update of influenza vaccines [9]. Several collaborative initiatives have emerged over the years aimed at developing a “universal” influenza vaccine that can provide longer lasting and broader protection against multiple strains of influenza virus. These include vaccine candidates targeting the conserved HA stalk domain or other influenza proteins [10] comprising chimeric [11] or computationally optimized [12] HA, or including multiple HA variants displayed on the surface of the same nanoparticle [13].
The insect cell baculovirus expression vector system (IC-BEVS) has emerged as a powerful tool to produce recombinant proteins that require a high degree of post-translational processing, such as in most vaccine-oriented antigens. Baculoviruses are rod-shaped virus particles with doubled-stranded DNA genomes [14] that can be genetically engineered for inclusion of genes coding for the proteins of interest; these recombinant baculoviruses (rBac) allow high-level expression of recombinant foreign proteins in insect cells [15,16]. Insect cells possess some mechanisms avoiding overflow metabolism in comparison with other animal cells, such as GS/GOGAT enzymes in insect Sf-9 cells, which prevents ammonia accumulation by producing alanine [17]. Insect cells can also count on specific inhibitors preventing proteolytic degradation of the recombinant proteins being expressed [18,19].
The Trichoplusia ni (TN-5B1-4, hereon named High Five) cell line has been employed to express recombinant proteins using IC-BEVS at higher levels than in other insect cell lines, including expression of influenza VLPs [20,21,22]. Comparative (targeted or untargeted) metabolic studies between insect Sf-9 and High Five cells have shown that the latter have a more active metabolism than the former, particularly after infection, allowing increased expression of recombinant protein while producing 5–10 times less infectious rBac [23,24]. Nonetheless, studies regarding the metabolism of High Five cells for protein expression are limited, unlike for other insect cell lines [19,20,21,22], particularly regarding the production of vaccine candidates (e.g., VLPs-based) with distinct complexities (e.g., comprising one or multiple HA variants); such understanding could help fine-tuning the production of universal influenza vaccine targets.
This work aims at assessing and comparing the metabolic behavior of insect High Five cells upon infection with rBac for expression of monovalent and multivalent influenza HA-displaying VLPs (HA-VLPs) from different groups/subtypes using targeted metabolic analysis and metabolic flux analysis (MFA).

2. Materials and Methods

2.1. Cell Line and Culture Media

Insect High Five cells (Invitrogen, Waltham, MA USA) were routinely sub-cultured to 0.3–0.5 × 10⁶ cells/mL every 2–3 days until the viable cell concentration reached 2–3 × 10⁶ cells/mL using 125–250 mL shake flasks. Cells were cultured using Insect-XPRESS medium (Sartorius, Gottingen, Germany) and maintained at 27 °C in a Innova 44R incubator (Eppendorf, Hamburg, Germany) set to 100 rpm with an orbital motion diameter of 2.54 cm.

2.2. Baculovirus Amplification and Storage

Recombinant baculovirus (rBac) stocks were kindly provided by Redbiotec AG (Schlieren, Switzerland), containing influenza M1 (as VLP scaffold) and different sets of influenza HA genes (as displayed antigen), as described in Table 1. Amplification of baculovirus stocks was performed as described elsewhere [25]. In short, Sf-9 cells cultivated in Sf-900TM II medium (Gibco, Waltham, MA, USA) were infected at a cell concentration at infection (CCI) of 1 × 10⁶ cell/mL using a multiplicity of infection (MOI) of 0.1 plate-forming unit per viable cell (pfu/cell). When cell viability reached 70–85%, cultures were harvested and centrifuged at 200× g for 10 min at 4 °C and at 2000× g for 20 min at 4 °C. The clarified supernatant was stored at 4 °C until further use.

2.3. Production of HA-VLPs

HA-VLPs were produced using the aforementioned rBac in computer-controlled bioreactors using a BIOSTAT B-DCU 2 L stirred tank (Sartorius) and 20 L WAVE (Cytiva, Marlborough, MA, USA). The pO2 was set to 30% of air saturation and was maintained by varying the percentage of O2 in the gas mixture from 0 to 100%, and agitation was set to 70–250 rpm (stirred tank) or 18 rpm/2°–12° (WAVE). The gas flow rate was set to 0.01 vvm, and the temperature was kept at 27 °C. Cells were seeded at 0.4 × 10⁶ cell/mL and infected at CCI of 2.0 × 10⁶ cell/mL using a MOI of 1 pfu/cell.

2.4. Purification of HA-VLPs

HA-VLPs were purified as described elsewhere [26,27]. In brief, culture bulk was clarified by dead-end filtration, concentrated using tangential flow filtration, and polished by size exclusion chromatography. Fractions corresponding to HA-VLPs were concentrated; diafiltrated with storage buffer, i.e., 50 mM HEPES, 300 mM NaCl, and trehalose 15 % (w/v) at pH 6.6–7.4; sterile filtered; and stored at −80 °C until further use.

2.5. Analytics

2.5.1. Cell Concentration and Viability

Cell counting was performed in a Fuchs Rosenthal hemocytometer chamber (Brand), and viability was assessed the trypan-blue exclusion method.

2.5.2. Metabolite Analysis

Cell culture samples were centrifuged at 200× g for 10 min at 4 °C, and supernatant was collected and stored at −20 °C for metabolite analysis. For glucose and lactate concentration quantification, samples were measured in a YSI 7100 biochemical analyzer (Xylem, Rye Brook, NY, USA). For amino acid quantification, samples were derivatized using the AccQ. Fluor Reagent Kit (Waters, Milford, MA, USA), according to the manufacturer’s instructions, and quantified using a Hitachi Elite LaCHrom HPLC (VWR, Pennsylvania, PA, USA) with a reversed-phase AccQTag Column (Waters).

2.5.3. Baculovirus Titration

Baculovirus titers were determined using an MTT assay (measures infectious baculovirus particles) as described elsewhere [28,29].

2.5.4. Hemagglutination Assay

The HA titer was determined using the hemagglutination assay, as described elsewhere [13]. Briefly, samples (25 µL) were serially diluted 1:1 with DPBS (-/-) 1X (Gibco) in V-bottom 96-well plates (Thermo Scientific, Waltham, MA, USA) and gently mixed 1:1 with 1% chicken erythrocytes (Lohmann Tierzucht). Plates were incubated for 30 min at 4 °C. The titer of HA was estimated as being the inverse of the highest dilution of the sample that completely inhibited hemagglutination.

2.5.5. SDS-PAGE and Western Blot

Samples were reduced by mixing with 1× LDS Sample Buffer (Thermo Fisher Scientific) and 1× Sample Reducing Agent (Thermo Fisher Scientific) and denatured by heating for 10 min at 70 °C. Denatured samples were separated under reducing conditions in a 4–12% Bis-Tris protein gel (Thermo Fisher Scientific), using MOPS running buffer (Thermo Fisher Scientific) and SeeBlue Plus2 Prestained Standard (ThermoFisher Scientific) as a molecular weight marker. After electrophoresis (50 min at 200 V and 400 mA), the proteins were transferred to a nitrocellulose membrane using the iBlot gel transfer equipment (Thermo Fisher Scientific). Membranes were blocked for 1 h at room temperature with a blocking solution composed of Tris-Buffered Saline (Sigma, Saint Louis, MO, USA) with 1% (v/v) Tween-20 (Millipore) and 5% (w/v) skim milk (Millipore, Burlington, MA, USA) and incubated overnight at room temperature with primary antibodies diluted in blocking solution. Anti-HA serum for detection of HA proteins was kindly provided by NIBSC (Hertfordshire, England) and used at the dilutions ranging from 1:1000 to 1:2000. Specifically, the anti-HA FR-494 was used for detection of influenza A group-1 strains; a mixture of anti-Nanchang/NIBSC/97/612 and anti-Johannesburg/NIBSC/95/524 was used for detection of influenza A group-2 strains; and a mixture of anti-Hong Kong/NIBSC/77/568 and anti-VICTORIA/NIBSC/88/676 was used for detection of influenza B strains. To identify M1 protein, a goat monoclonal antibody (Abcam—Cat# ab20910) was used at the dilution of 1:2000. Secondary antibodies conjugated with alkaline phosphatase were used. The bands detection was performed using 1-Step™ NBT/BCIP Substrate Solution (Thermo Fisher Scientific).

2.5.6. Transmission Electron Microscopy

Purified HA-VLPs (10 μL) were fixed for 1 min on a copper grid covered by carbon-Formvar (Electron Microscopy Sciences, Hatfield, PA, USA). After incubation, the grids were washed with water and then marked with 1% (v/v) of uranyl acetate (SPI-Chem, West Chester, PA, USA) for 2 min and left to dry at room temperature. The stained samples were observed under a Hitachi H-7650 transmission electron microscope (Hitachi, Tokyo, Japan).

2.6. Mathematical Equations for Estimation of Reaction Rates

Cell growth rate, μ, is given by:
µ ( h 1 ) = 1 X   .   d X v d t   ,   0 < t < t e
where Xv is the concentration of viable cells (cell/mL) and t is the culture time (h) during the exponential growth phase (i.e., from t = 0 to t = te).
During the cell growth phase, specific metabolite j production or consumption rates (rj) are estimated by:
r j ( nmol . 10 6 cell 1 . h 1 ) = Y X / j   .   µ  
where YX/j is the yield of metabolite j consumed or produced per biomass X formed, which is defined as follows:
Y X / j ( nmol . 10 6 cell 1 ) = Δ [ j ] Δ X   ,   0 < t < t e  
during the exponential growth phase.
During the production phase, i.e., infection (from t = 0 to t = tf), specific metabolite j production or consumption rates (rj) are estimated by:
r j ( nmol . 10 6 cell 1 . h 1 ) = Cum Δ [ j ] 0 t f Xt   dt   ,   0 < t < t f  
where Cum Δ [j] is the cumulative variation in the concentration of metabolite j, and Xt is the total cell concentration (106 cell/mL).
The specific HA production rate, rHA, is given by:
r H A ( HA   titer . 10 6   cell 1 . h 1 ) = Δ H A 0 t X t   d t   ,   0 < t < t f  
where HA is the extracellular HA titer (HA titer/mL).
The specific rBAC production rate, rrBAC, is given by:
r r B A C ( h 1 ) = Δ ln [ r B A C ] 0 t X t   d t   ,   0 < t < t f  
where [rBAC] is the extracellular infectious rBAC titer (pfu/mL) estimated by the MTT assay during the production phase.
The specific oxygen consumption rate, rO2, is given by:
r O 2 ( mmol . 10 6   cell 1 . h 1 ) = Δ O 2   c o n s 0 t X t   d t   ,   0 < t < t f  
O 2   c o n s   ( mmol mL ) = O U R × Δ t  
O U R   ( mmol mL   h ) = k L a × ( c c )
where O2 cons is the volumetric oxygen consumption (mmol/mL), OUR is the oxygen uptake rate, kLa is the volumetric mass transfer rate (h−1), c is the saturation oxygen concentration (mmol/mL), and c is the dissolved oxygen concentration (mmol/mL).

2.7. Metabolic Flux Analysis

A previously established metabolic network model [24] was adapted to reflect the central carbon metabolism of insect High Five cells. A complete list of the metabolic reactions considered and the details for the biomass synthesis equations are described in Supplementary Table S1. Fluxes were estimated by metabolic flux analysis (MFA) independently for cell growth phase (before infection) and infection phase (0–72 h post-infection). MFA fluxes were calculated using the CellNetAnalyzer toolbox [30] in MATLAB 2015a (MathWorks Inc., Natick, MA, USA).

2.8. Principal Component Analysis

Principal component analysis (PCA) was performed using JMP 14.1 software (SAS Institute, Cary, NC, USA). The t tests were performed using GraphPad Prism 9.4.1 software (Dotmatics, Boston, MA, USA).

2.9. Data Availability Statement

The sensitive nature of some of the reagents used in this study (e.g., cell lines, plasmids, baculoviruses, and antibodies) means that they are only readily available internally for the author’s institution staff for R&D purposes. For external researchers, the approval of reagents’ request may be obtained via email addressed to the corresponding author.

3. Results

3.1. Production of HA-VLPs

Influenza mono- and multi-valent HA-VLPs comprising HA from different groups and subtypes (27 different VLPs formats in total) were produced at 2 L bioreactor scale, by infecting insect High Five cells with one of the polycistronic recombinant baculovirus described in Table 1.
Cell growth kinetics were comparable amongst infections with baculovirus comprising HA from the same group/subtype, regardless of particle valency (i.e., mono- or multi-valent VLPs) (Figure 1A). Noteworthily, expression of HA-VLPs was highly variable, as denoted by the different HA titers estimated (Figure 1B). Importantly, influenza M1 and HA proteins were successfully identified by Western blot in all HA-VLPs produced (Figure 1C).
Overall, these results show that productivity is dependent on both the strain from which HA is derived and the complexity of the HA-VLPs being produced, suggesting that there is no trend of higher productivity towards a specific group/subtype or particle valency. The underlying metabolic mechanisms involved in the production of HA-VLPs with different valency and comprising HA from different subtypes were further investigated.

3.2. The impact of HA-VLPs’ Valency and HA Subtype on the Metabolic Profile of Insect Cells

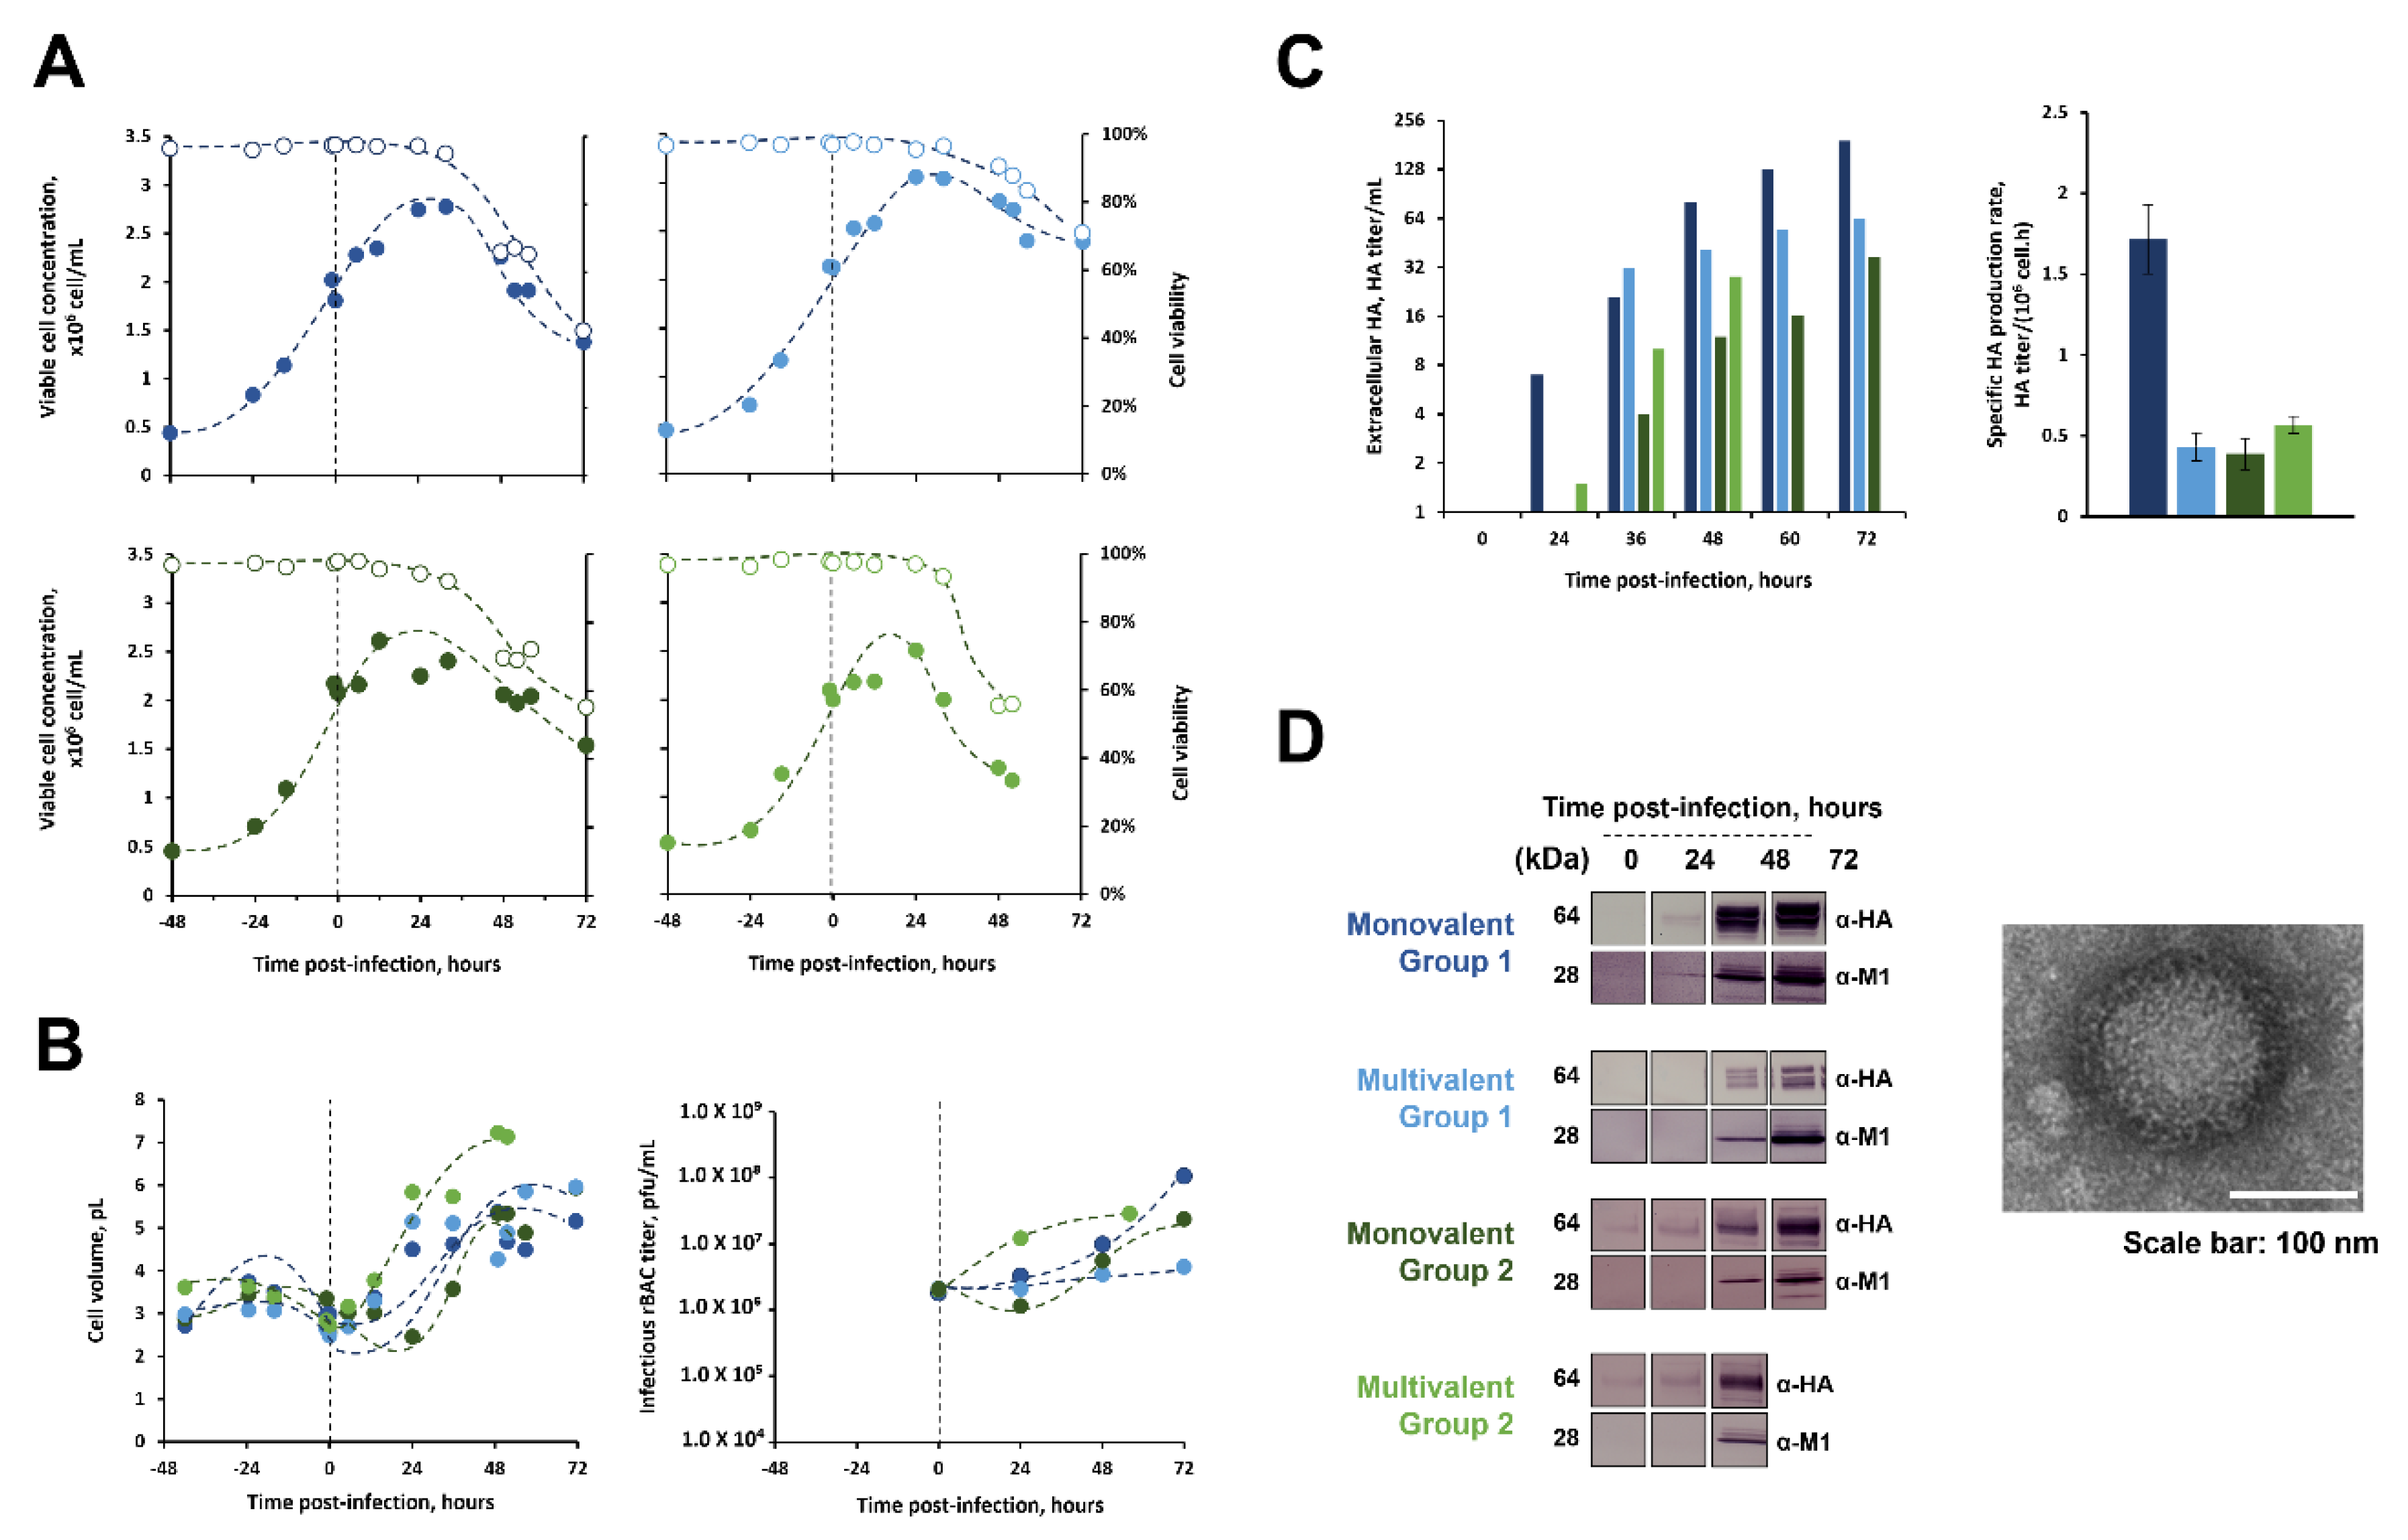
To further investigate the different dynamics of producing mono- and multi-valent influenza HA-VLPs of different groups/subtypes, insect High Five cells were cultured in 20 L Wave bioreactors and infected with a subset of recombinant baculovirus distinctive for each category: rBAC #5 and 12, representative of monovalent HA-VLPs from group 1 and 2, respectively (hereafter named “Monovalent Group 1” and “Monovalent Group 2”), and rBac #7 and 20, representative of multivalent HA-VLPs from groups 1 and 2, respectively (hereafter named “Multivalent Group 2” and “Multivalent Group 2”) (Table 1). Cell growth, infectious baculovirus generation, protein (HA and M1) expression kinetics, and the metabolic behavior of insect High Five cells upon infection were assessed and compared accordingly.

3.2.1. Infection Kinetics and HA-VLPs’ Expression

Cell growth rate (0.039 ± 0.004 h−1) and viability (≥95%) were similar prior to infection in all four production runs (Figure 2A). Upon infection, cells showed typical behavior of insect cells infected with baculovirus at MOI = 1 pfu/cell, i.e., cell growth arrest after infection concomitantly with an increase in cell volume (Figure 2B—left panel), followed by a decrease in cell viability at 16—18 h post-infection (hpi) as a consequence of baculovirus replication (Figure 2B—right panel). Time of harvest (TOH) was defined at 72 hpi for all production runs, except for multivalent group 2 (TOH = 48 hpi) as a consequence of a more pronounced cell viability drop. Specific HA production rates and HA titers were strain-dependent (Figure 2C). Production of HA and M1 proteins was confirmed by Western blot (Figure 2D—left panel), and the presence of particles resembling influenza HA-VLPs, both in size and morphology, was confirmed by TEM (Figure 2D—right panel).
The results herein obtained demonstrate the scalability of this strategy (i.e., insect High Five cells cultured in WAVE bioreactors) for production of mono- and multi-valent HA-VLPs and confirm that productivity varies across groups/subtypes and particle valency.

3.2.2. Major Metabolite Consumption and Production Rates

Insect cells showed distinct metabolic behavior before and after infection and during the production of the different HA-VLPs variants, as shown by the estimated specific metabolite production or consumption rates (Table 2).
The main carbon and nitrogen sources consumed were glucose and asparagine/glutamine, respectively, whereas the main by-products produced were alanine, lactate, and ammonia. Except for glucose, all these metabolites were either consumed or produced at higher rates before infection than during infection phase.
During the production of monovalent HA-VLPs, cells expressing HA from group 1 showed different energy metabolism traces than those observed for group 2 (e.g., lower glucose and asparagine consumption rates, and higher cysteine and isoleucine consumption rates); similar consumption or production rates were observed for the remaining metabolites. When producing multivalent HA-VLPs, cells expressing HA from group 1 showed increased energy metabolism, a higher cysteine consumption rate, and inverted lactate metabolism (i.e., consumed this metabolite), compared to group 2.
Comparing mono- and multi-valent HA-VLP production runs, major differences in cell metabolism relate to the consumption rates of glucose (higher in multivalent) and glutamine (lower in multivalent), and to the production rates of by-products such as alanine and ammonium (lower in multivalent), irrespective of the group/subtype; all other specific production or consumption rates are rather similar.

3.2.3. Intracellular Metabolic Fluxes Estimated by MFA

Aiming to further understand how cells’ metabolism differs during the production of the different HA-VLPs variants, non-quantified intracellular fluxes were estimated using MFA (absolute values are provided in Supplementary Table S2).
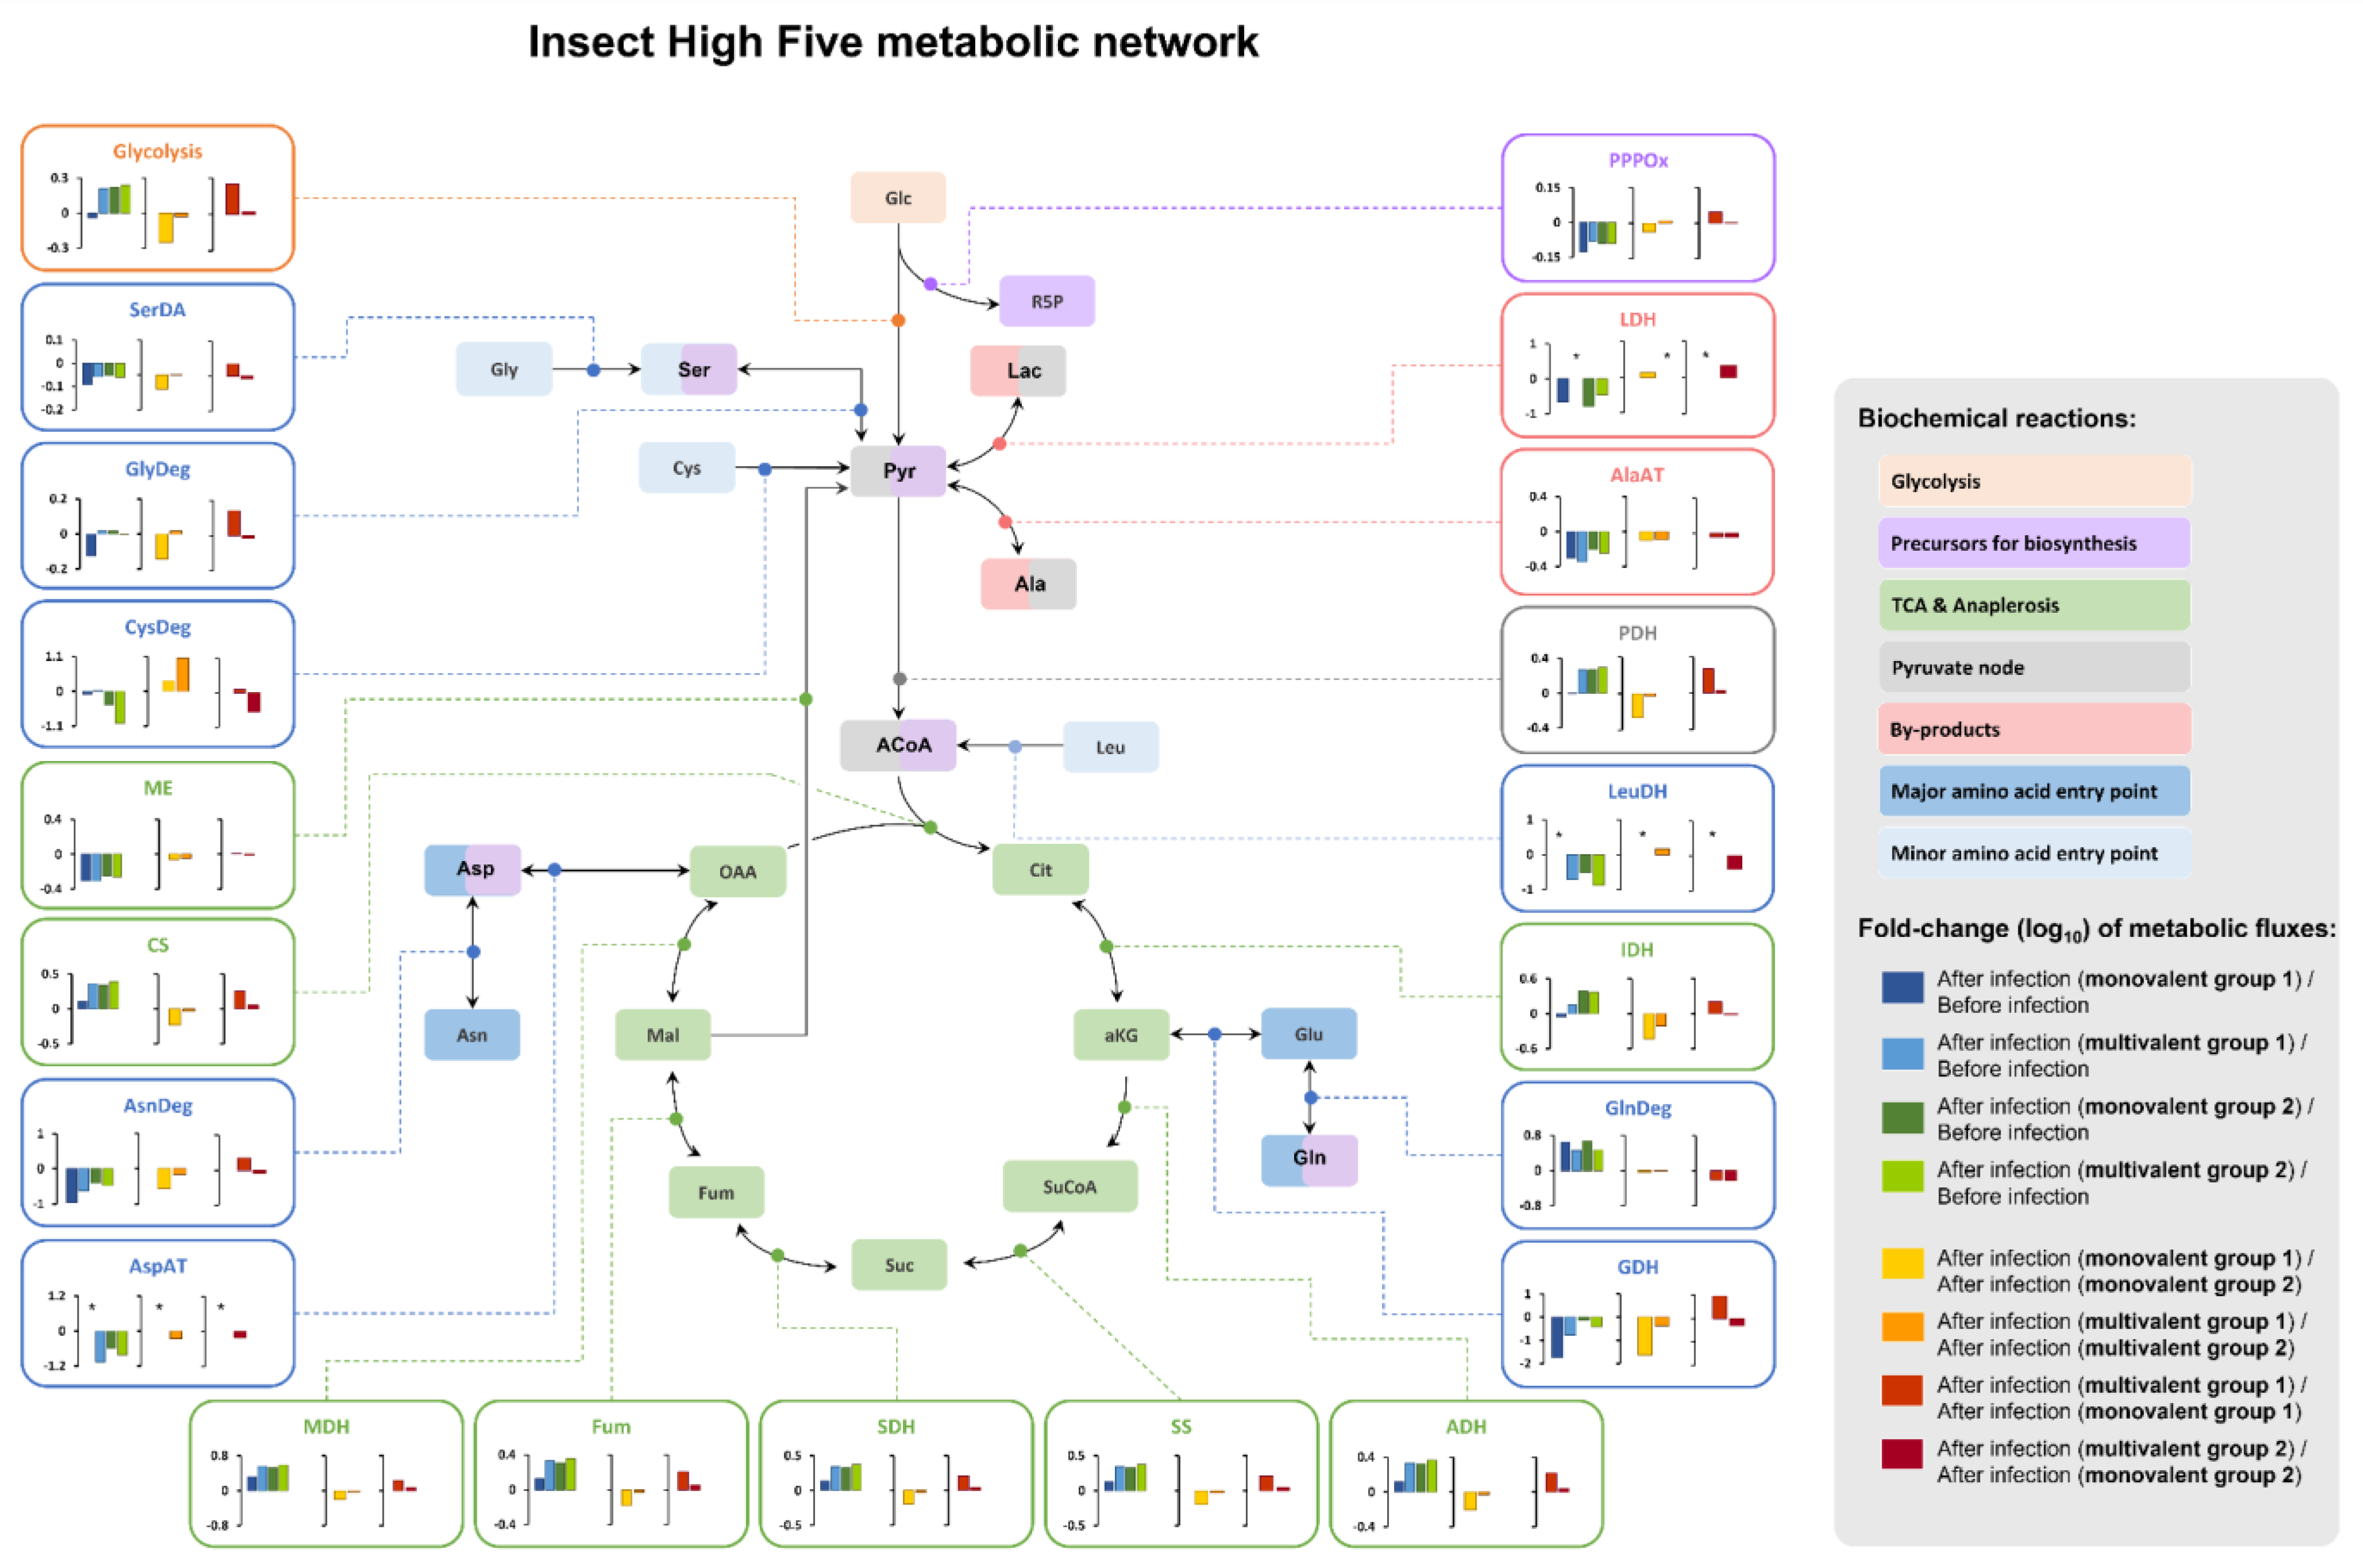
Fluxes involved in glycolysis, asparagine, alanine, and lactate metabolism (Figure 3) followed similar trends upon infection to those shown in the previous section. Noteworthily, conversion of pyruvate into acetyl-CoA and tricarboxylic acid (TCA) cycle fluxes increased upon infection, whereas fluxes involved in major (glutamate, aspartic acid, asparagine) and minor (leucine) amino acid entry points to the TCA cycle decreased.
During the production of monovalent HA-VLPs, cells expressing HA from group 1 showed lower fluxes involved in glycolysis, conversion of pyruvate into acetyl-CoA, TCA cycle and amino acid entry points to the TCA cycle, than group 2; lactate and cysteine fluxes followed the opposite trend (1.3 and 2.1-fold higher, respectively). When producing multivalent HA-VLPs, there were no apparent differences in estimated fluxes involved in glycolysis, conversion of pyruvate into acetyl-CoA, and TCA cycle between groups; a major variation was observed in cysteine flux, which was 10.9-fold higher in group 1.
Comparing mono- and multi-valent HA-VLPs production runs, fluxes related with glycolysis, conversion of pyruvate into acetyl-CoA, TCA cycle, and lactate formation were in general higher for the multivalent HA-VLPs runs irrespective of the group/subtype. A similar trend was observed for the fluxes involved in amino acid entry points to the TCA cycle, but in this case only for group 2; in group 1, these fluxes were mostly lower for the multivalent HA-VLP run.
Overall, these results confirm that cellular metabolism is highly impacted by the VLP design to be expressed; it was not possible to find a clear correlation between VLP’s subtype and/or valency and a specific metabolic trait.

3.2.4. Clustering HA-VLPs’ Production Processes Using PCA

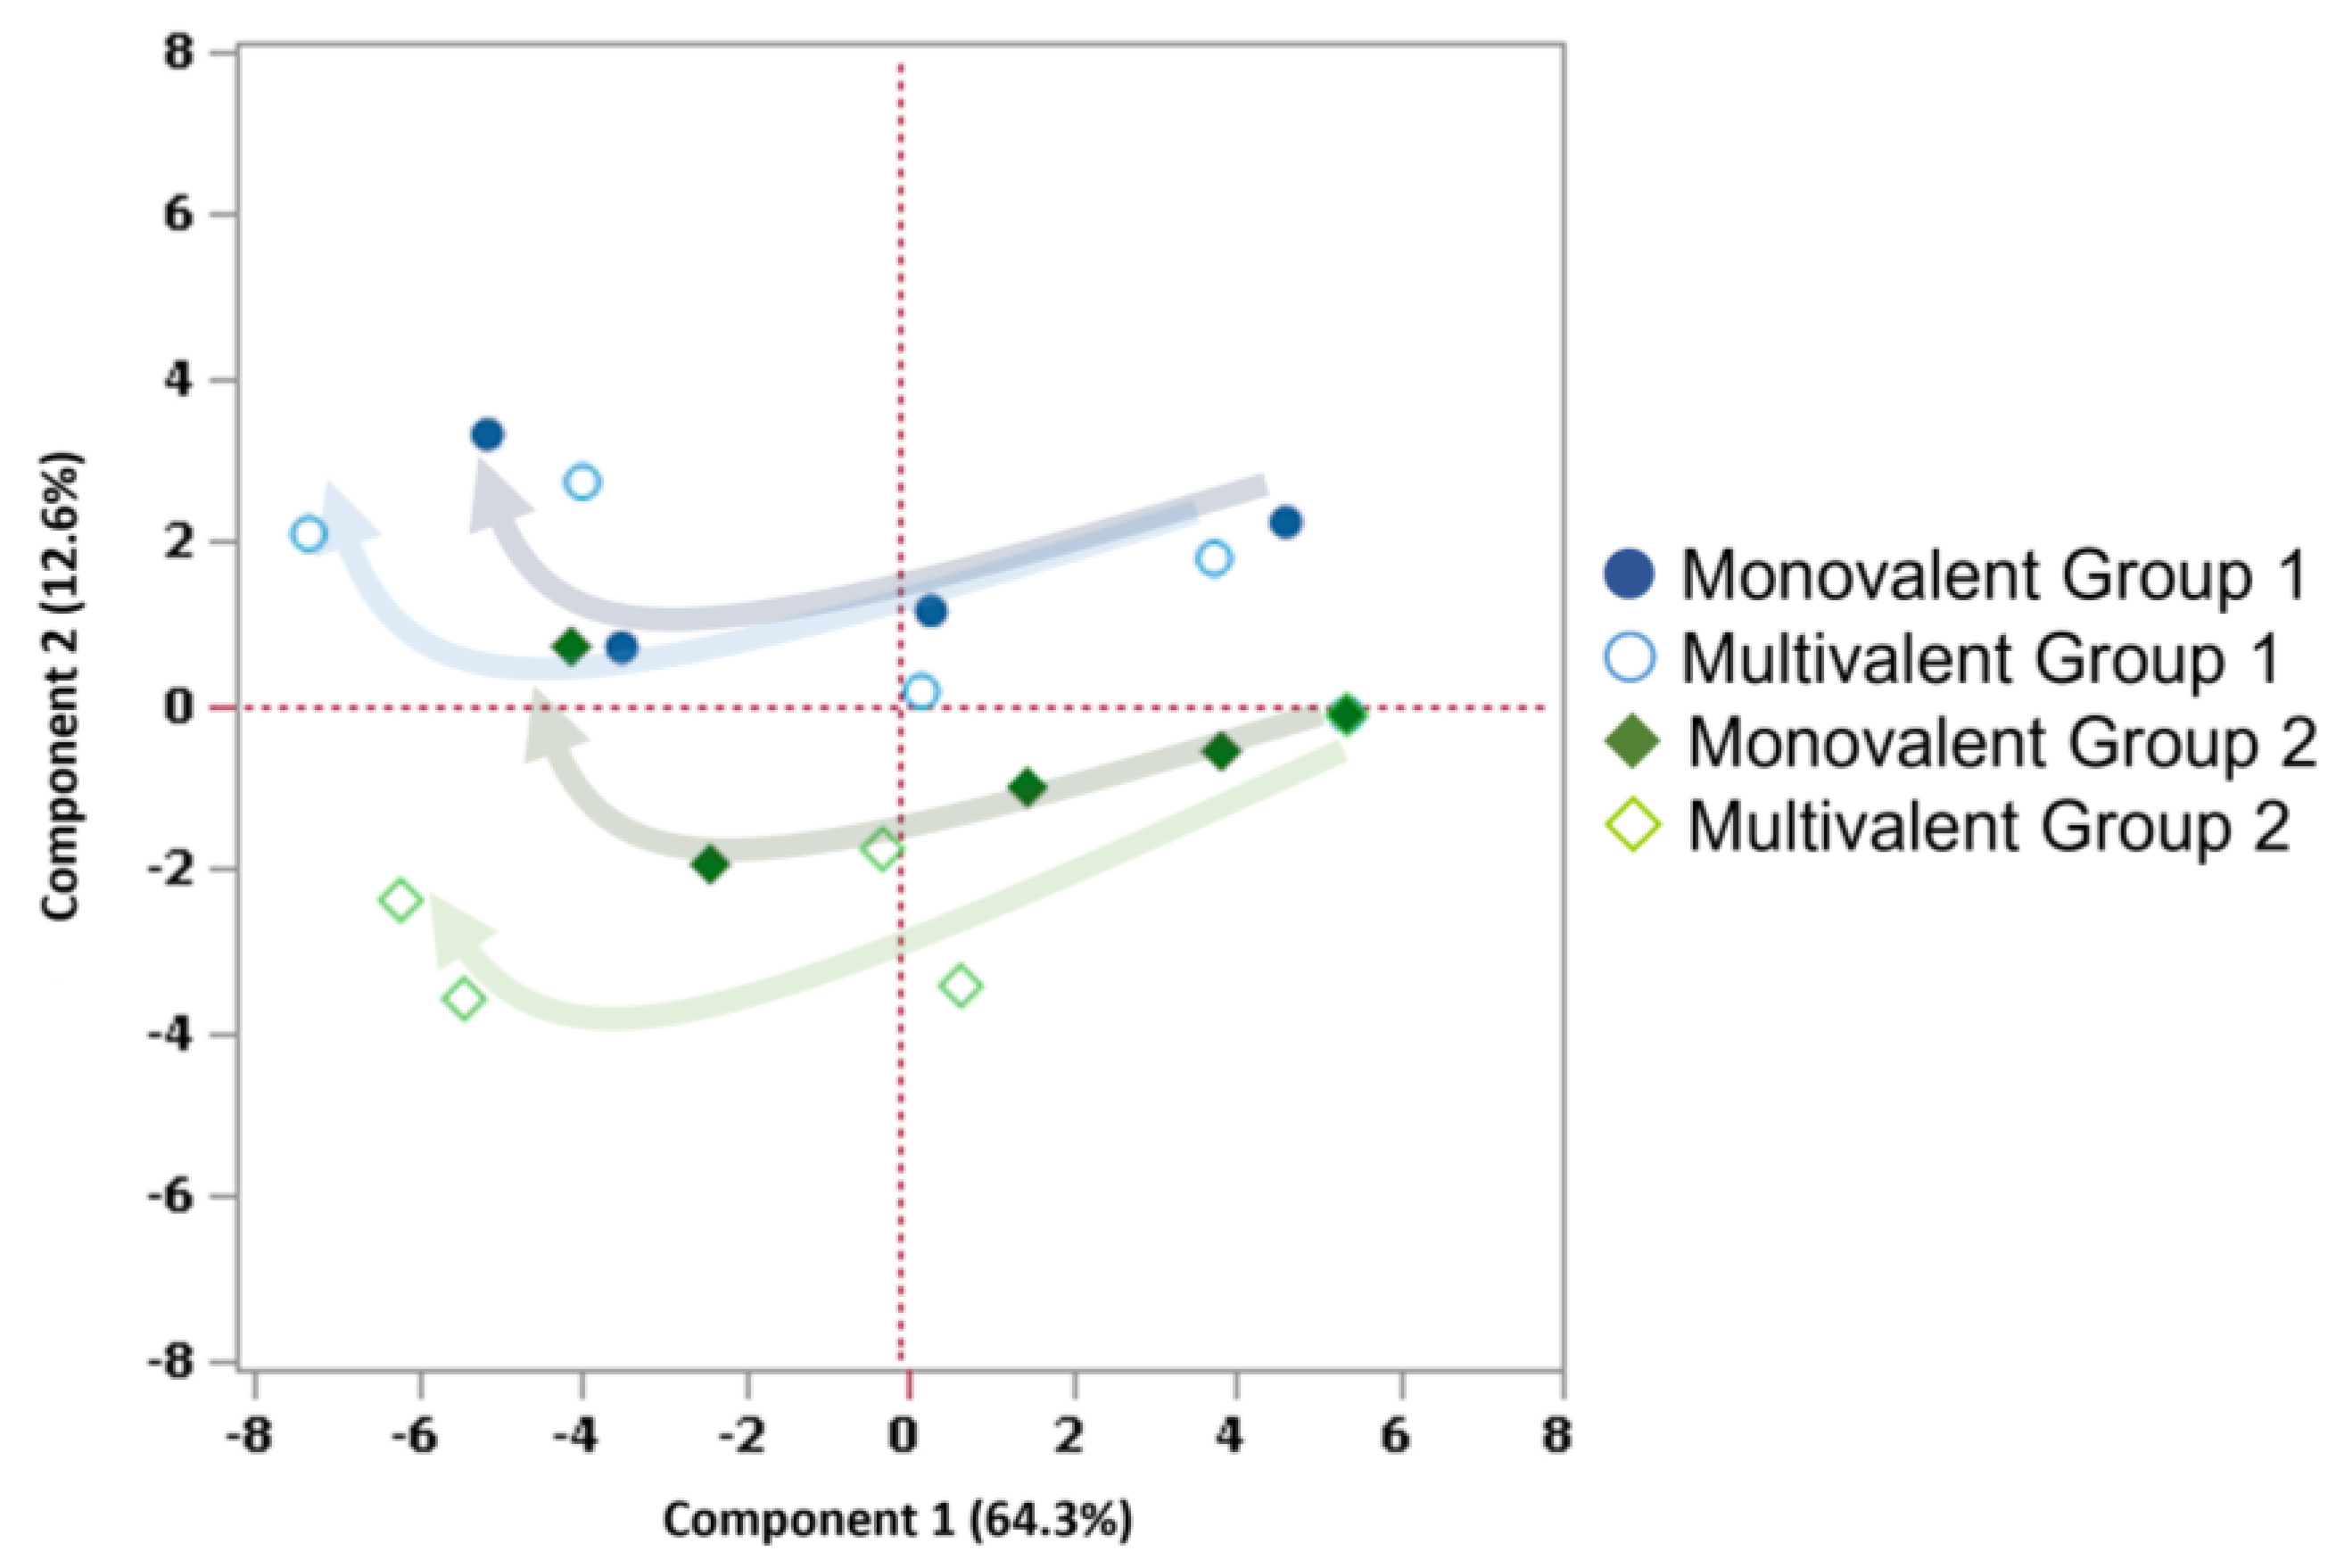
Aiming at further assessing similarities between the four production runs, a PCA was performed comprising the metabolites and bioprocess related parameters’ concentrations/values assessed throughout the infection phase. The PCA model could create two main clusters separating group 1 HA-VLPs from group 2 (Figure 4), suggesting that HA group/subtype rather than VLP valency is the driving factor leading to differences during influenza HA-VLPs production. PCA loading plots were used to identify which metabolites and/or bioprocess-related parameters have most impacted the formation of these clusters. Alanine, ammonium, asparagine, aspartate, cysteine, glucose, HA, baculovirus, and oxygen were those showing higher effects on the principal components, in agreement with the differences (group 1 vs. group 2) observed in their rates (Table 2 and Table 3). In most cases, the specific consumption and production rates of these metabolites and bioprocess parameters were apparently lower in group 1; to evaluate their statistical significance, t test analysis comparing group 1 and group 2 was performed. For all compared rates except the specific production rate of alanine (p-value = 0.0145), we could not conclude that the difference was significant.

4. Discussion

In this work, targeted exo-metabolome analysis and MFA of insect (High Five) cells pre- and post-infection with baculovirus for production of HA-VLPs of different influenza group/subtypes and valences was performed with the aim of correlating metabolic footprints with limited expression of specific HA variants and/or VLP designs.
Insect cells showed similar behavior during the cell growth phase in all cultures and in accordance with previous reports [31,32,33]. Upon infection, cell growth was arrested concomitantly with an increase in cell volume as a result of viral replication and VLP expression [34]. No evident pattern of higher HA-VLP expression towards a specific subtype and/or particle valency could be observed. In addition, expression of group-2 HA-VLPs proved to be difficult, similar to what others have also observed, i.e., expression of H7 (group 2) HA-VLPs was more challenging than the H5 (group 1) subtype [35]. It has been suggested that group-2 HA may require a higher degree of post-translational control prior to trafficking to the cell membrane, compromising its extracellular expression [36].
Before infection, cells consumed both glucose and amino acids to produce pyruvate and TCA intermediates. This behavior allows one to complement the mitochondria redox potential and facilitate the supply of O2 for aerobic respiration, generating enough energy for cellular growth [19,24,37]. Upon infection, cells changed their metabolism considerably; cells started to use almost exclusively glucose as a carbon source and decreased the use of amino acids as a source of TCA cycle intermediates, as previously reported [38,39,40]. Deviation of amino acid consumption from the energy route towards viral production and VLP protein expression has been suggested before [41]. Within infected insect cell cultures, cells producing group 1 monovalent HA-VLPs showed lower metabolic rates when compared to those producing the group 2 monovalent variant; nevertheless, HA production in the former was significantly higher (4-fold). Comparative transcriptome analysis in High Five cells expressing different recombinant proteins has suggested a link between molecule complexity and cell transcription capability, showing that higher molecule complexity requires higher cell commitment (i.e., higher energy demand for secretion) [42]. Our observation that higher metabolic rates were not correlated with higher VLP expression supports the hypothesis that metabolism may be intensified due to the complexity of the protein (HA) rather than amount of VLPs being produced.
Specific metabolites were found to be important for central carbon metabolism during VLP expression, e.g., asparagine, serine, glycine, and leucine. These amino acids not only have an important structural role due to their hydrophilic (asparagine and serine) or hydrophobic (glycine and leucine) nature, but also play a role in High Five cells’ central metabolism. Asparagine is the second major carbon source (after glucose), leucine is used as an amino acid entry point to the TCA cycle (as acetyl-CoA precursor) [24], and serine and glycine are used as protein, nucleic acid, lipid, co-factor, and antioxidant precursors [43]. The use of fed-batch operation could avoid the depletion of these nutrients [13]. During all four production runs, only glutamine and asparagine achieved a potential limiting concentration at 24 h post-infection; a tailor-performed glutamine/asparagine feeding regime could be implemented to optimize HA-VLP expression.
This study confirms that insect cell metabolism varies drastically with the complexity of the HA-VLP to be expressed; the exact explanation for these different metabolic traces and their effect on system productivity remain unknown. Extending the metabolic analysis herein to other HA strains, with different degrees of similarity and/or displayed in particles with different valences, could help dissect a possible correlation between a given metabolic footprint and productivity. Such understanding could motivate the use of specific insect cell lines or cell culture conditions [44,45] to provide the optimal metabolic activity and potentiate the production of each specific HA strain and/or particle type. Nuclear magnetic resonance and mass spectrometry [45,46] could be used to increase the number of nutrients to be analyzed, including intracellular metabolites, thereby expanding the range of information regarding the metabolic behavior of cells after infection. Furthermore, analyzing other key substrates (e.g., lipids, vitamins, enzyme activity, and secretory machinery) could prove useful to complementing the insights obtained from this metabolic analysis.

5. Conclusions

This work assessed the differences in the metabolism of insect High Five cells pre- and post-infection with recombinant baculovirus for the production of HA-VLPs with different valences and comprising HA from distinct groups/subtypes. The results obtained revealed that cellular metabolism is highly impacted by the VLP design to be expressed, having no apparent correlation between a given metabolic footprint and expression of a specific HA variant and/or VLP design. This motivates the search for more fundamental understanding of the metabolic profiling of insect cells producing influenza HA-VLPs, as modulating specific metabolic networks could be the key to producing difficult-to-express antigen variants and/or complex vaccine constructs (e.g., multivalent VLPs) in higher yields.

Supplementary Materials

The following supporting information can be downloaded at: https://www.mdpi.com/article/10.3390/pr10112283/s1. Table S1: List of biochemical reactions considered in insect High Five cells metabolic model. Table footnote: Reaction Reversibility: 0—reversible/−1—irreversible. Acronym codes: αKG–alpha-ketoglutarate; ACoA–Acetyl-CoA; ADP—Adenosine diphosphate; Ala—Alanine; Arg—Arginine; Asn—Asparagine; Asp—Aspartic acid; ATP—Adenosine triphosphate; Cit—Citrate; CO2—Carbon dioxide; Cys—Cysteine; DNA—Desoxyribonucleic acid; F6P—Fructose 6-phosphate; FA—Fatty acid; FAD/FADH2—Flavin adenine dinucleotide; Fum—Fumarate; G6P—Glucose 6-phosphate; GAP—Glycerol aldehyde phosphate; Glc—Glucose; Gln—Glutamine; Glu—Glutamic acid; Gly—Glycine; His—Histidine; Ile—Isoleucine; Leu—Leucine; Lys—Lysine; Mal—Malate; Met—Methionine; NAD/NADH—Nicotinamide adenine dinucleotide; NADP/NADPH—Nicotinamide adenine dinucleotide phosphate; NH4+—Ammonium; O2—oxygen; OAA—Oxaloacetic acid; PEP—Phosphoenol pyruvate; Phe—Phenylalanine; Pyr—Pyruvate; R5P–Ribose-5-phosphate; RNA—Ribonucleic acid; Ser—Serine; Suc—Succinate; SuCoA–Succinate-CoA; Thr—Threonine; Tyr—Tyrosine; Val—Valine; Table S2: Biochemical reactions rates assessed by MFA analysis. Table footnote: For cell growth phase, data is expressed as mean ± standard deviation (SD) of four biological replicates (n = 4); for infection phase, data is relative to one biological replicate (n = 1), N/D—Not Determined.

Author Contributions

Conceptualization, A.B.M., M.Q.S. and A.R.; data curation, I.A.I.; formal analysis, A.B.M., R.C., I.A.I. and A.R.; funding acquisition, M.J.T.C. and A.R.; investigation, A.B.M., M.Q.S., R.C. and I.A.I.; methodology, A.B.M., M.Q.S. and I.A.I.; project administration, M.J.T.C. and A.R.; resources, M.J.T.C. and A.R.; supervision, M.J.T.C. and A.R.; validation, I.A.I. and A.R.; visualization, A.B.M., M.Q.S., R.C., I.A.I., M.J.T.C. and A.R.; writing—original draft preparation, A.B.M.; writing—review and editing, A.B.M., M.Q.S., R.C., I.A.I., M.J.T.C. and A.R. All authors have read and agreed to the published version of the manuscript.

Funding

This research was funded by EU-funded project “EDUFLUVAC” (FP7-HEALTH-2013-INNOVATION-1, GA n. 602640) and by Fundação para a Ciência e Tecnologia/Ministério da Ciência, Tecnologia e Ensino Superior (FCT/MCTES, Portugal) through the following initiatives: iNOVA4Health (UIDB/04462/2020 and UIDP/04462/2020), Associate Laboratory LS4FUTURE (LA/P/0087/2020), “Investigador FCT” Program (IF/01704/2014), Exploratory Research and Development Project (IF/01704/2014/CP1229/CT0001), and PhD fellowship (Ricardo Correia-SFRH/BD/134107/2017). This research was also supported by PhD fellowship (Alexandre Murad-SWE program, CAPES 2000116/2016-9) and PVE program (CAPES 407565/2013-2).

Institutional Review Board Statement

Not applicable.

Informed Consent Statement

Not applicable.

Data Availability Statement

The sensitive nature of some of the reagents used in this study (e.g., cell lines, plasmids, baculoviruses, and antibodies) means that they are only readily available internally for the author’s institution staff for R&D purposes. For external researchers, the approval of reagents’ request may be obtained via email addressed to the corresponding author.

Acknowledgments

The authors wish to thank: Paula Alves for the scientific support, João Sá and Hélder Vila-Real for the useful discussion and support in metabolic analysis and E.M. Tranfield from the Electron Microscopy Facility at Instituto Gulbenkian de Ciência for technical support in TEM.

Conflicts of Interest

All authors have no conflict of interest to declare.

References

  1. Roldão, A.; Mellado, M.C.M.; Castilho, L.R.; Carrondo, M.J.; Alves, P.M. Virus-like Particles in Vaccine Development. Expert Rev. Vaccines 2010, 9, 1149–1176. [Google Scholar] [CrossRef] [PubMed]
  2. Donaldson, B.; Lateef, Z.; Walker, G.F.; Young, S.L.; Ward, V.K. Virus-like Particle Vaccines: Immunology and Formulation for Clinical Translation. Expert Rev. Vaccines 2018, 17, 833–849. [Google Scholar] [CrossRef] [PubMed]
  3. Lua, L.H.L.; Connors, N.K.; Sainsbury, F.; Chuan, Y.P.; Wibowo, N.; Middelberg, A.P.J. Bioengineering Virus-Like Particles as Vaccines. Biotechnol. Bioeng. 2014, 111, 425–440. [Google Scholar] [CrossRef]
  4. Zhao, Y.; Li, Z.; Voyer, J.; Li, Y.; Chen, X. Flagellin/Virus-like Particle Hybrid Platform with High Immunogenicity, Safety, and Versatility for Vaccine Development. ACS Appl. Mater. Interfaces 2022, 14, 21872–21885. [Google Scholar] [CrossRef] [PubMed]
  5. Carvalho, S.B.; Silva, R.J.S.; Sousa, M.F.Q.; Peixoto, C.; Roldão, A.; Carrondo, M.J.T.; Alves, P.M. Bioanalytics for Influenza Virus-Like Particle Characterization and Process Monitoring. Front. Bioeng. Biotechnol. 2022, 10, 805176. [Google Scholar] [CrossRef] [PubMed]
  6. Kang, H.-J.; Chu, K.-B.; Yoon, K.-W.; Eom, G.-D.; Mao, J.; Kim, M.-J.; Lee, S.-H.; Moon, E.-K.; Quan, F.-S. Multiple Neuraminidase Containing Influenza Virus-Like Particle Vaccines Protect Mice from Avian and Human Influenza Virus Infection. Viruses 2022, 14, 429. [Google Scholar] [CrossRef]
  7. Cheung, P.P.H.; Watson, S.J.; Choy, K.-T.; Fun Sia, S.; Wong, D.D.Y.; Poon, L.L.M.; Kellam, P.; Guan, Y.; Malik Peiris, J.S.; Yen, H.-L. Generation and Characterization of Influenza A Viruses with Altered Polymerase Fidelity. Nat. Commun. 2014, 5, 4794. [Google Scholar] [CrossRef] [PubMed] [Green Version]
  8. Smith, D.J.; Lapedes, A.S.; de Jong, J.C.; Bestebroer, T.M.; Rimmelzwaan, G.F.; Osterhaus, A.D.M.E.; Fouchier, R.A.M. Mapping the Antigenic and Genetic Evolution of Influenza Virus. Science 2004, 305, 371–376. [Google Scholar] [CrossRef] [Green Version]
  9. Bouvier, N.M.; Palese, P. The Biology of Influenza Viruses. Vaccine 2008, 26 (Suppl. 4), D49–D53. [Google Scholar] [CrossRef] [Green Version]
  10. Nachbagauer, R.; Krammer, F. Universal Influenza Virus Vaccines and Therapeutic Antibodies. Clin. Microbiol. Infect. 2017, 23, 222–228. [Google Scholar] [CrossRef]
  11. Nachbagauer, R.; Feser, J.; Naficy, A.; Bernstein, D.I.; Guptill, J.; Walter, E.B.; Berlanda-Scorza, F.; Stadlbauer, D.; Wilson, P.C.; Aydillo, T.; et al. A Chimeric Hemagglutinin-Based Universal Influenza Virus Vaccine Approach Induces Broad and Long-Lasting Immunity in a Randomized, Placebo-Controlled Phase I Trial. Nat. Med. 2021, 27, 106–114. [Google Scholar] [CrossRef] [PubMed]
  12. Sautto, G.A.; Kirchenbaum, G.A.; Abreu, R.B.; Ecker, J.W.; Pierce, S.R.; Kleanthous, H.; Ross, T.M. A Computationally Optimized Broadly Reactive Antigen Subtype–Specific Influenza Vaccine Strategy Elicits Unique Potent Broadly Neutralizing Antibodies against Hemagglutinin. J. Immunol. 2020, 204, 375–385. [Google Scholar] [CrossRef] [PubMed]
  13. Sequeira, D.P.; Correia, R.; Carrondo, M.J.T.; Roldão, A.; Teixeira, A.P.; Alves, P.M. Combining Stable Insect Cell Lines with Baculovirus-Mediated Expression for Multi-HA Influenza VLP Production. Vaccine 2018, 36, 3112–3123. [Google Scholar] [CrossRef] [PubMed]
  14. Kong, M.; Zuo, H.; Zhu, F.; Hu, Z.; Chen, L.; Yang, Y.; Lv, P.; Yao, Q.; Chen, K. The Interaction between Baculoviruses and Their Insect Hosts, Developmental & Comparative Immunology. Dev. Comp. Immunol. 2018, 83, 114–123. [Google Scholar] [CrossRef]
  15. Granados, R.R.; Guoxun, L.; Derksen, A.C.G.; McKenna, K.A. A New Insect Cell Line from Trichoplusia Ni (BTI-Tn-5B1-4) Susceptible to Trichoplusia Ni Single Enveloped Nuclear Polyhedrosis Virus. J. Invertebr. Pathol. 1994, 64, 260–266. [Google Scholar] [CrossRef]
  16. Stolt-Bergner, P.; Benda, C.; Bergbrede, T.; Besir, H.; Celie, P.H.N.; Chang, C.; Drechsel, D.; Fischer, A.; Geerlof, A.; Giabbai, B.; et al. Baculovirus-Driven Protein Expression in Insect Cells: A Benchmarking Study. J. Struct. Biol. 2018, 203, 71–80. [Google Scholar] [CrossRef] [Green Version]
  17. Drews, M.; Doverskog, M.; Ohman, L.; Chapman, B.E.; Jacobsson, U.; Kuchel, P.W.; Häggström, L. Pathways of Glutamine Metabolism in Spodoptera Frugiperda (Sf9) Insect Cells: Evidence for the Presence of the Nitrogen Assimilation System, and a Metabolic Switch by 1H/15N NMR. J. Biotechnol. 2000, 78, 23–37. [Google Scholar] [CrossRef]
  18. Wang, Y.; Oberley, L.W.; Murhammer, D.W. Antioxidant Defense Systems of Two Lipidopteran Insect Cell Lines. Free. Radic. Biol. Med. 2001, 30, 1254–1262. [Google Scholar] [CrossRef]
  19. Martensen, P.; Justesen, J. Specific Inhibitors Prevent Proteolytic Degradation of Recombinant Proteins Expressed in HighFiveTM Cells. BioTechniques 2001, 30, 782–792. [Google Scholar] [CrossRef]
  20. Keith, M.B.; Farrell, P.J.; Iatrou, K.; Behie, L.A. Screening of Transformed Insect Cell Lines for Recombinant Protein Production. Biotechnol. Prog. 1999, 15, 1046–1052. [Google Scholar] [CrossRef]
  21. Krammer, F.; Schinko, T.; Palmberger, D.; Tauer, C.; Messner, P.; Grabherr, R. Trichoplusia Ni Cells (High Five) Are Highly Efficient for the Production of Influenza A Virus-Like Particles: A Comparison of Two Insect Cell Lines as Production Platforms for Influenza Vaccines. Mol. Biotechnol. 2010, 45, 226–234. [Google Scholar] [CrossRef] [PubMed]
  22. Yamaji, H.; Konishi, E. Production of Japanese Encephalitis Virus-Like Particles in Insect Cells. Bioengineered 2013, 4, 438–442. [Google Scholar] [CrossRef] [PubMed] [Green Version]
  23. Monteiro, F.; Bernal, V.; Saelens, X.; Lozano, A.B.; Bernal, C.; Sevilla, A.; Carrondo, M.J.T.; Alves, P.M. Metabolic Profiling of Insect Cell Lines: Unveiling Cell Line Determinants behind System’s Productivity. Biotechnol. Bioeng. 2014, 111, 816–828. [Google Scholar] [CrossRef]
  24. Monteiro, F.; Bernal, V.; Alves, P.M. The Role of Host Cell Physiology in the Productivity of the Baculovirus-Insect Cell System: Fluxome Analysis of Trichoplusia Ni and Spodoptera Frugiperda Cell Lines. Biotechnol. Bioeng. 2017, 114, 674–684. [Google Scholar] [CrossRef]
  25. Vieira, H.L.A.; Estêvão, C.; Roldão, A.; Peixoto, C.C.; Sousa, M.F.Q.; Cruz, P.E.; Carrondo, M.J.T.; Alves, P.M. Triple Layered Rotavirus VLP Production: Kinetics of Vector Replication, MRNA Stability and Recombinant Protein Production. J. Biotechnol. 2005, 120, 72–82. [Google Scholar] [CrossRef] [PubMed]
  26. Correia, R.; Meneses, L.; Richheimer, C.; Alves, P.M.; Carrondo, M.J.T.; Duarte, A.R.C.; Paiva, A.; Roldão, A. Improved Storage of Influenza HA-VLPs Using a Trehalose-Glycerol Natural Deep Eutectic Solvent System. Vaccine 2021, 39, 3279–3286. [Google Scholar] [CrossRef] [PubMed]
  27. Carvalho, S.B.; Moreira, A.S.; Gomes, J.; Carrondo, M.J.T.; Thornton, D.J.; Alves, P.M.; Costa, J.; Peixoto, C. A Detection and Quantification Label-Free Tool to Speed up Downstream Processing of Model Mucins. PLoS ONE 2018, 13, e0190974. [Google Scholar] [CrossRef] [Green Version]
  28. Mena, J.; Ramirez, O.; Palomares, L. Titration of Non-Occluded Baculovirus Using a Cell Viability Assay. BioTechniques 2003, 34, 260–264. [Google Scholar] [CrossRef]
  29. Roldão, A.; Oliveira, R.; Carrondo, M.J.T.; Alves, P.M. Error Assessment in Recombinant Baculovirus Titration: Evaluation of Different Methods. J. Virol. Methods 2009, 159, 69–80. [Google Scholar] [CrossRef]
  30. Klamt, S.; Saez-Rodriguez, J.; Gilles, E. Structural and Functional Analysis of Cellular Networks with CellNetAnalyzer. BMC Syst. Biol. 2007, 1, 2. [Google Scholar] [CrossRef]
  31. Xu, Y.; Ma, S.; Huang, Y.; Chen, F.; Chen, L.; Ding, D.; Zheng, Y.; Li, H.; Xiao, J.; Feng, J.; et al. Virus-like Particle Vaccines for Poliovirus Types 1, 2, and 3 with Enhanced Thermostability Expressed in Insect Cells. Vaccine 2019, 37, 2340–2347. [Google Scholar] [CrossRef] [PubMed]
  32. Imasaki, T.; Wenzel, S.; Yamada, K.; Bryant, M.L.; Takagi, Y. Titer Estimation for Quality Control (TEQC) Method: A Practical Approach for Optimal Production of Protein Complexes Using the Baculovirus Expression Vector System. PLoS ONE 2018, 13, e0195356. [Google Scholar] [CrossRef] [PubMed] [Green Version]
  33. Pastor, A.R.; González-Domínguez, G.; Díaz-Salinas, M.A.; Ramírez, O.T.; Palomares, L.A. Defining the Multiplicity and Time of Infection for the Production of Zaire Ebola Virus-like Particles in the Insect Cell-Baculovirus Expression System. Vaccine 2019, 37, 6962–6969. [Google Scholar] [CrossRef]
  34. Üstün-Aytekin, Ö.; Gürhan, İ.D.; Ohura, K.; Imai, T.; Öngen, G. Monitoring of the Effects of Transfection with Baculovirus on Sf9 Cell Line and Expression of Human Dipeptidyl Peptidase IV. Cytotechnology 2014, 66, 159–168. [Google Scholar] [CrossRef] [Green Version]
  35. Nerome, K.; Matsuda, S.; Maegawa, K.; Sugita, S.; Kuroda, K.; Kawasaki, K.; Nerome, R. Quantitative Analysis of the Yield of Avian H7 Influenza Virus Haemagglutinin Protein Produced in Silkworm Pupae with the Use of the Codon-Optimized DNA: A Possible Oral Vaccine. Vaccine 2017, 35, 738–746. [Google Scholar] [CrossRef] [PubMed]
  36. Chlanda, P.; Mekhedov, E.; Waters, H.; Sodt, A.; Schwartz, C.; Nair, V.; Blank, P.S.; Zimmerberg, J. Palmitoylation Contributes to Membrane Curvature in Influenza A Virus Assembly and Hemagglutinin-Mediated Membrane Fusion. J. Virol. 2017, 91, e00947-17. [Google Scholar] [CrossRef] [PubMed] [Green Version]
  37. Bedard, C.; Tom, R.; Kamen, A. Growth, Nutrient Consumption, and End-Product Accumulation in Sf-9 and BTI-EAA Insect Cell Cultures: Insights into Growth Limitation and Metabolism. Biotechnol. Prog. 1993, 9, 615–624. [Google Scholar] [CrossRef]
  38. Radford, K.; Reid, S.; Greenfield, P. Substrate Limitation in the Baculovirus Expression Vector System. Biotechnol. Bioeng. 1997, 56, 32–44. [Google Scholar] [CrossRef]
  39. Vallazza, M.; Petri, T. Optimization of the Production of Triabin, a Novel Thrombin Inhibitor, in High FiveTM Insect Cells Infected with a Recombinant Baculovirus. Cytotechnology 1999, 29, 85–92. [Google Scholar] [CrossRef]
  40. Doverskog, M.; Ljunggren, J.; Öhman, L.; Häggström, L. Physiology of Cultured Animal Cells. J. Biotechnol. 1997, 59, 103–115. [Google Scholar] [CrossRef]
  41. Koczka, K.; Peters, P.; Ernst, W.; Himmelbauer, H.; Nika, L.; Grabherr, R. Comparative Transcriptome Analysis of a Trichoplusia Ni Cell Line Reveals Distinct Host Responses to Intracellular and Secreted Protein Products Expressed by Recombinant Baculoviruses. J. Biotechnol. 2018, 270, 61–69. [Google Scholar] [CrossRef] [PubMed]
  42. Geck, R.C.; Toker, A. Nonessential Amino Acid Metabolism in Breast Cancer. Adv. Biol. Regul. 2016, 62, 11–17. [Google Scholar] [CrossRef] [PubMed]
  43. Correia, R.; Fernandes, B.; Alves, P.M.; Carrondo, M.J.T.; Roldão, A. Improving Influenza HA-Vlps Production in Insect High Five Cells via Adaptive Laboratory Evolution. Vaccines 2020, 8, 589. [Google Scholar] [CrossRef] [PubMed]
  44. Fernandes, B.; Vidigal, J.; Correia, R.; Carrondo, M.J.T.; Alves, P.M.; Teixeira, A.P.; Roldão, A. Adaptive Laboratory Evolution of Stable Insect Cell Lines for Improved HIV-Gag VLPs Production. J. Biotechnol. 2020, 307, 139–147. [Google Scholar] [CrossRef]
  45. Ramon, C.; Gollub, M.G.; Stelling, J. Integrating–Omics Data into Genome-Scale Metabolic Network Models: Principles and Challenges. Essays Biochem. 2018, 62, 563–574. [Google Scholar] [CrossRef]
  46. Tsugawa, H. Advances in Computational Metabolomics and Databases Deepen the Understanding of Metabolisms. Curr. Opin. Biotechnol. 2018, 54, 10–17. [Google Scholar] [CrossRef]
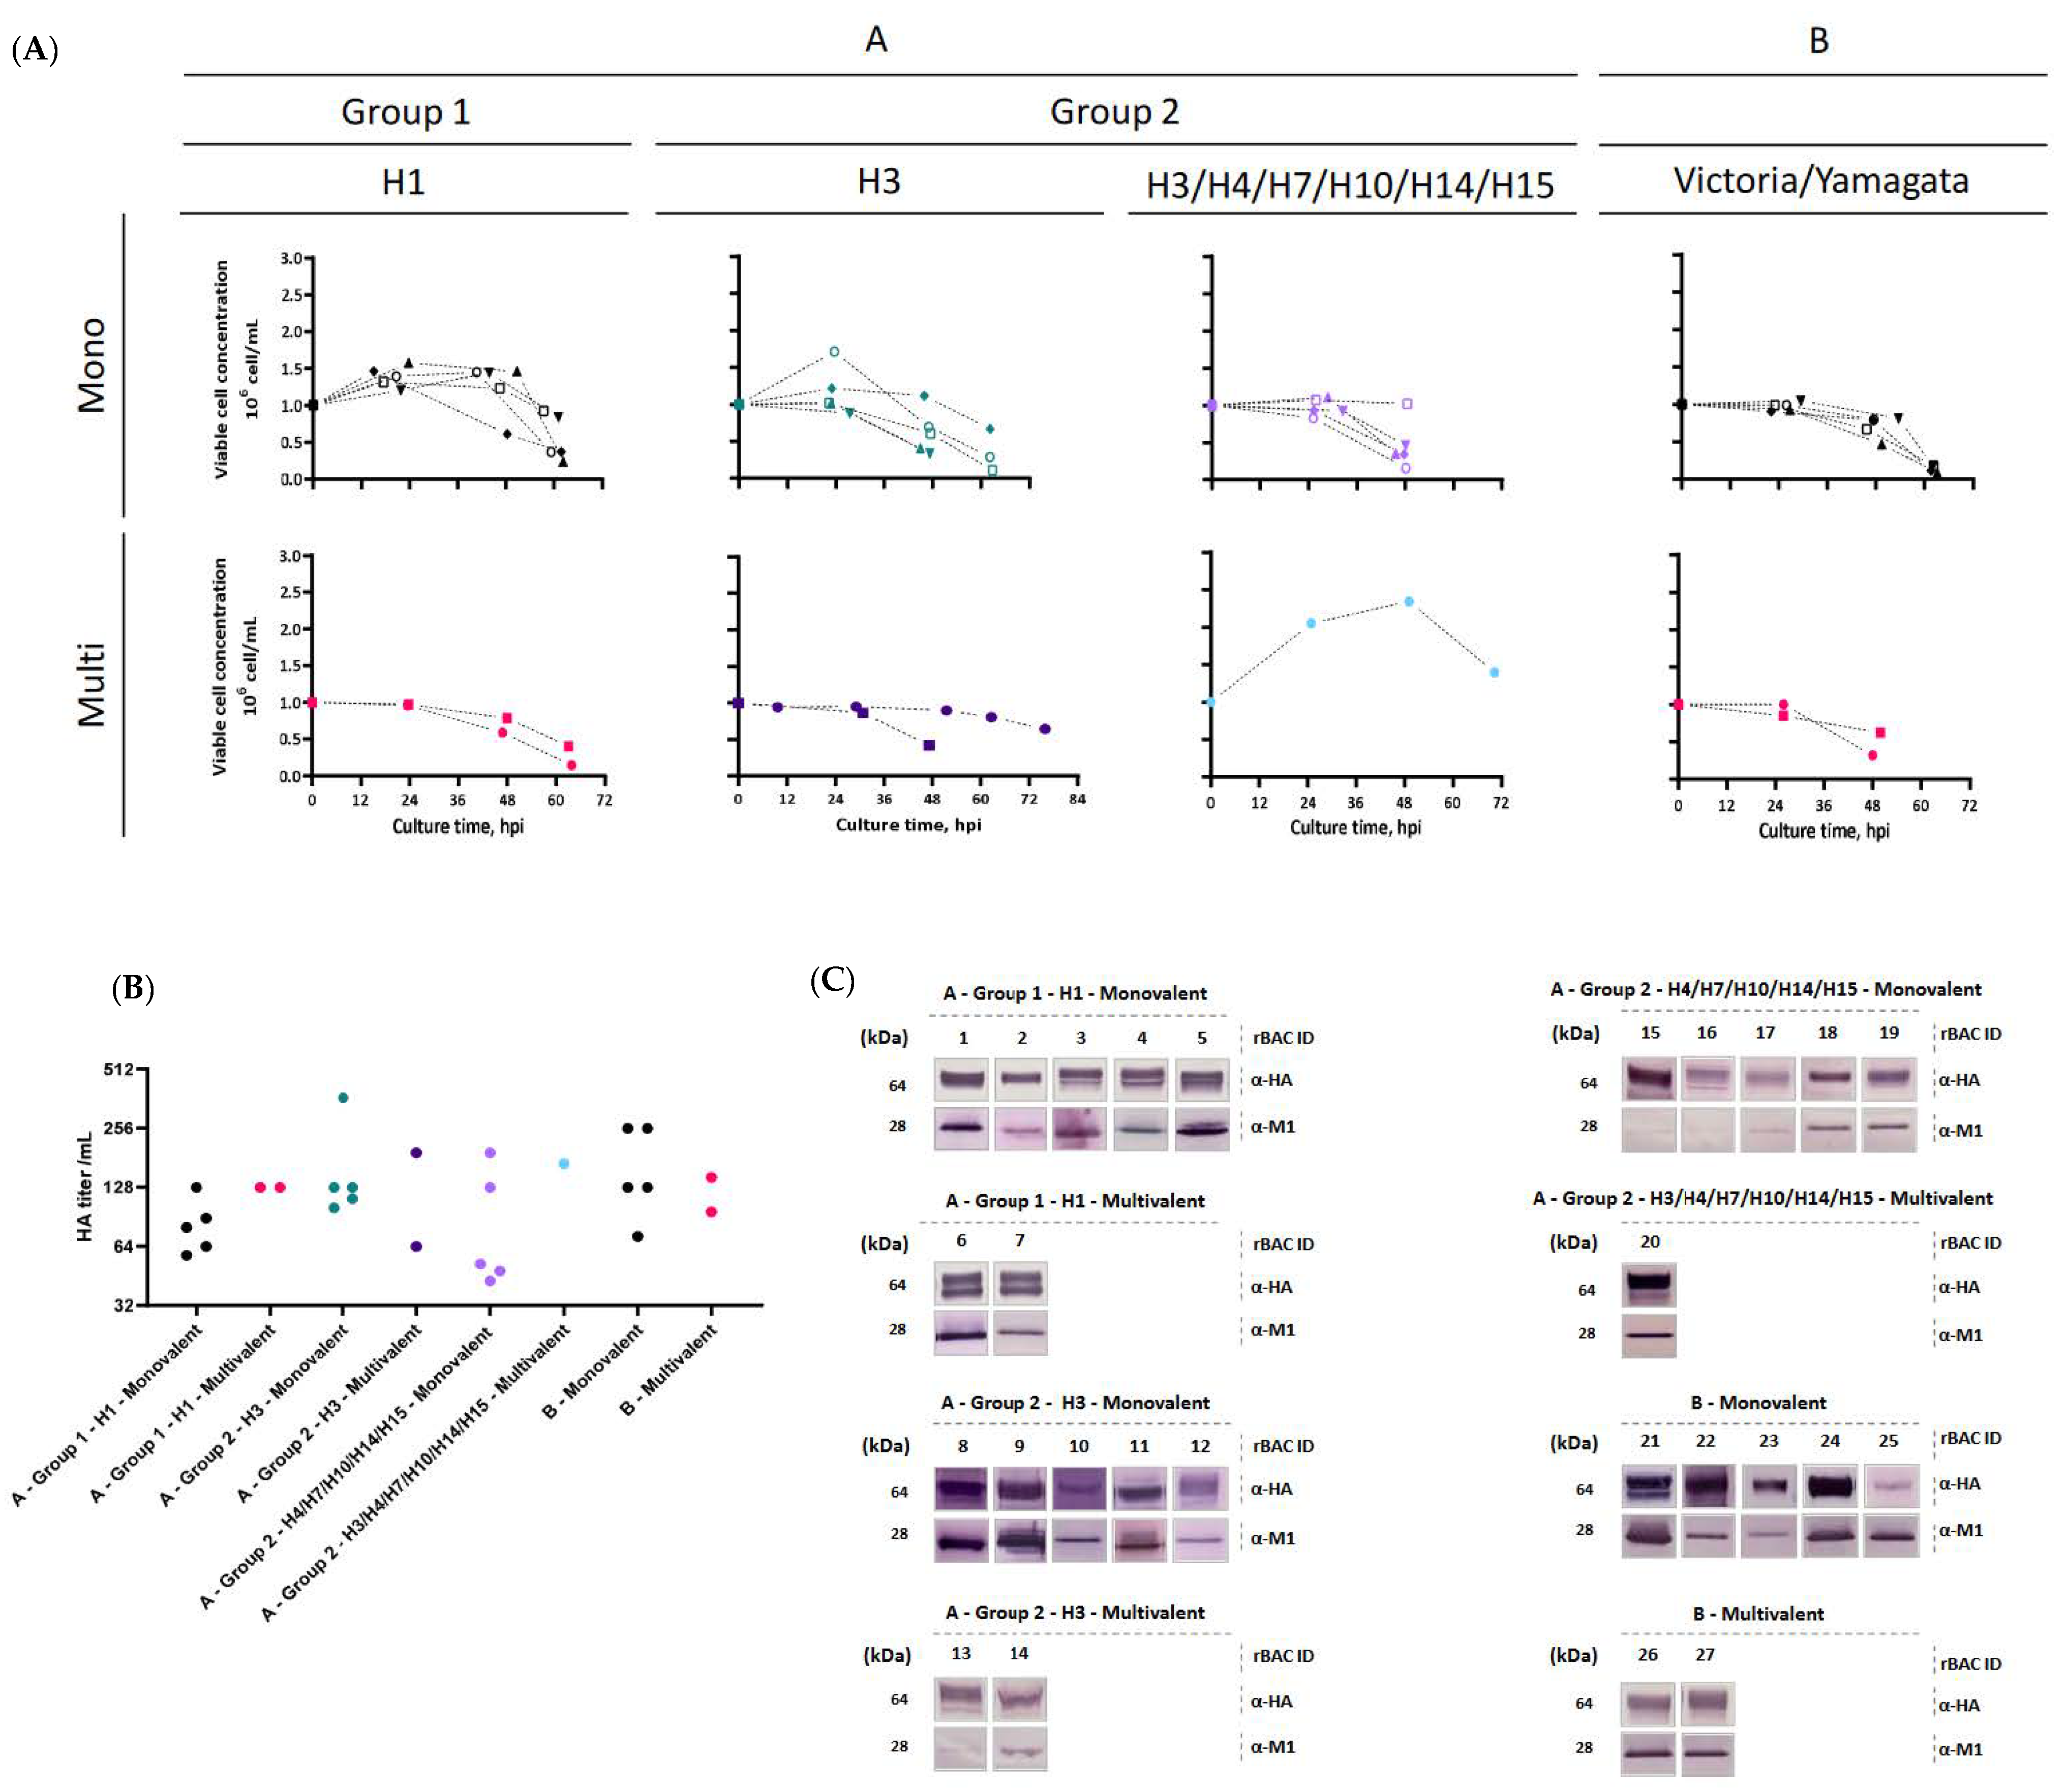
Figure 1. Production of influenza HA-VLPs at the 2 L bioreactor scale. (A) Cell growth kinetics. (B) Extracellular HA titer at time of harvest. (C) Identification of influenza HA and M1 proteins by Western blot. The color code in subfigures A and B corresponds to: black icons—influenza A group 1 H1 monovalent cell growth kinetics; red icons—influenza A group 1 H1 multivalent cell growth kinetics; green icons—influenza A group 2 H3 monovalent cell growth kinetics; purple icons—influenza A group 2 H3 multivalent cell growth kinetics; lilac icons—influenza A group 2 H4/H7/H10/H14/H15 monovalent cell growth kinetics; light blue icons—influenza A group 2 H4/H7/H10/H14/H15 multivalent cell growth kinetics; dark grey icons—influenza B monovalent cell growth kinetics; pink icons—influenza B multivalent cell growth kinetics.
Processes 10 02283 g001
Figure 2. Production of influenza HA-VLPs at 20 L bioreactor scale. (A) Cell growth kinetics. (B) Cell volume pre- and post-infection (left panel) and infectious baculovirus titer (right panel). (C) Extracellular HA titer throughout infection (left panel) and specific HA productivity (right panel). (D) Identification of influenza M1 and HA proteins by Western blot and influenza HA VLPs by TEM. Color code: Monovalent Group 1 (dark blue), Monovalent Group 2 (dark green), multivalent group 1 (light blue), multivalent group 2 (light green).
Processes 10 02283 g002
Figure 3. Insect High Five cells metabolic network. Acronyms: αKG—alpha-ketoglutarate; αKGDH—alpha-ketoglutarate dehydrogenase; ACoA—acetyl-CoA; Ala—alanine; AlaAT—alanine aminotransferase; Asn—asparagine; AsnDeg—asparaginase; Asp—aspartic acid; AspAT—aspartase aminotransferase; Cit—citrate; CS—citrate synthase Cys—cysteine; CysDeg—cysteine lyase; Fum—fumarate/fumarase; GDH—glutamate dehydrogenase; Glc—glucose; Gln—glutamine; GlnDH—glutamine dehydrogenase; Glu—glutamic acid; Gly—glycine; GlyDeg—glycine hydroxitransferase; Lac—lactate; LDH—lactate dehydrogenase; Leu—leucine; LeuDH—leucine dehydrogenase; Mal—malate; MDH—malate dehydrogenase; ME—malic enzyme; OAA—oxaloacetic acid; PDH—pyruvate dehydrogenase; PPPOx—glucose-6-phosphate dehydrogenase; Pyr—pyruvate; R5P—ribose-5-phosphate; SDH—succinyl dehydrogenase; Ser—serine; SerDA—serine deaminase; Suc—succinate; SucDH—succinate dehydrogenase; SuCoA—succinate-CoA; SS—SuCoA synthetase.
Processes 10 02283 g003
Figure 4. Principal component analysis (PCA) of metabolites and bioprocess-related parameters’ concentrations/values assessed throughout the infection phase for the four HA-VLP production runs at WAVE 20 L bioreactor scale. Color code: Monovalent Group 1 (dark blue), Multivalent Group 1 (light blue), Monovalent Group 2 (dark green), Multivalent Group 2 (light green). Arrows indicate the separation trend over the course of infection.
Processes 10 02283 g004
Table 1. List of recombinant baculovirus used for the production of influenza HA-VLPs at the 2 L bioreactor scale.
Influenza Type/Group/SubtypeValencyHemagglutinin (HA) from Strain:Abbr.rBac ID
AGroup 1H1MonovalentA/Puerto_Rico/8/1934PR341
A/USSR/90/1978USSR782
A/Texas/36/1991Te913
A/New_Caledonia/20/1999NC994
A/Brisbane/59/2007Br075
MultivalentPR8 + Tx36 + Bb59-6
PR8 + USSR90 + Tx36 + NC20 + Bb59-7
Group 2H3MonovalentA/Hong_Kong/1/1968HK688
A/England/321/1977En779
A/Sichuan/2/1987Si8710
A/Johannesburg/33/1994Jo9411
A/Fujian/411/2002Fu0212
MultivalentHK68 + Si87 + Fu02-13
HK68 + En77 + Si87 + Jo94 + Fu02-14
H4MonovalentA/mallard/Alberta/47/1998Al9815
H7A/cinnamon teal/Bolivia/4537/2001Bo0116
H10A/quail/NJ/25254-22/1995NJ9517
H14A/herring gull/Astrakhan/267/1982As8218
H15A/Australian shelduck/Western Australia/1762/1979WA7919
H3/H4/H7/H10/H14/H15MultivalentJo94 + Al98 + Bo01 + NJ95 + As82 + WA79-20
B-Victoria/YamagataMonovalentB/Hong Kong/8/1973HK7321
VictoriaB/Victoria/2/1987Vi8722
YamagataB/Yamagata/16/1988Ya8823
YamagataB/Jiangsu/10/2003Ji0324
VictoriaB/Malaysia/2506/2004Ma0425
-MultivalentHK73 + Ji03 + Ma04-26
HK73 + Vi87 + Ya88 + Ji03 + Ma04-27
Ml from strain: A/California/06/2009 was used for all production runs; Abbr.—abbreviations; rBac—recombinant baculovirus.
Table 2. Specific metabolite consumption and production rates.
Specific Metabolite (j) Production or Consumption Rates (rj), μM/106 Cells.h
Cell Growth PhaseInfection Phase
Group 1Group 2
MonovalentMultivalentMonovalentMultivalent
MetaboliteRate±SDRate±SERate±SERate±SERate±SE
Alanine65.4±9.429.6±2.224.9±6.238.6±1.033.5±3.2
Ammonium31.3±6.89.5±1.46.7±1.811.9±2.27.2±5.4
Arginine−5.1±1.8−6.4±0.9−6.5±0.4−5.6±1.4−6.1±1.1
Asparagine−67.8±2.6−10.2±4.1−19.0±5.6−28.5±3.3−25.2±2.5
Aspartate3.5±5.6−2.1±4.6−3.7±1.22.2±1.40.6±1.7
Cysteine−4.1±1.2−2.8±0.0−3.7±0.0−1.8±0.2−0.64±0.05
Glucose−120.7±33.2−109.1±15.2−189.2±22.0−191.9±3.0−202.5±5.0
Glutamine−28.3±2.5−35.2±1.4−31.0±2.5−37.8±7.2−30.9±1.5
Glutamate−2.1±11.1−0.6±3.1−2.2±1.42.1±2.4−2.2±4.9
Glycine−5.6±6.4−2.0±1.3−1.6±0.4−1.7±0.6−2.1±0.9
Histidine−1.4±0.8−1.5±0.6−1.2±0.2−1.3±0.2−1.4±0.2
Isoleucine−2.6±3.5−5.1±1.4−4.6±0.6−1.9±0.6−5.1±2.2
Lactate18.7±6.24.2±0.5−8.3±2.83.1±0.26.5±4.6
Leucine−5.0±1.9−8.0±0.8−6.1±0.4−5.6±0.4−6.1±0.6
Lysine−4.1±2.2−5.9±0.8−5.2±0.5−4.7±0.5−5.4±1.3
Methionine−2.7±4.2−3.5±1.4−3.7±0.6−3.4±1.6−3.7±2.2
Phenylalanine−1.9±3.3−3.3±1.4−3.6±0.6−2.9±1.3−3.6±2.3
Proline−5.0±2.3−6.5±1.2−5.6±0.8−5.4±1.6−5.2±0.2
Serine−2.3±5.8−2.0±1.1−3.2±0.6−2.3±0.2−2.8±0.1
Threonine−3.4±1.1−4.5±0.7−4.5±0.3−4.0±0.2−3.9±0.5
Tyrosine−2.3±1.4−3.2±0.5−2.4±0.42.54±0.05−2.5±0.4
Valine−3.3±2.7−5.3±1.2−4.6±0.5−3.4±0.7−4.7±1.6
Table footnote: SD—standard deviation (data relative to four biological replicates, n = 4); SE—standard error (data relative to one biological replicate, n = 1). Data are shown as linearization mean ± error using all time-points.
Table 3. Bioprocess-related reaction rates during the production of influenza VLPs.
Infection Phase
Group 1Group 2
MonovalentMultivalentMonovalentMultivalent
Rate±SERate±SERate±SERate±SE
Specific O2 consumption rate
(mmol/106 cell.h)
71±265±192±5164±8
Specific HA production rate
(HA titer/106 cell.h)
1.7±0.20.4±0.10.4±0.10.6±0.1
Specific rBAC production rate
(h−1)
0.013±0.0050.0025±0.00040.0131±0.00030.012±0.002
Table footnote: SE—standard error (data relative to one biological replicate, n = 1). Data are shown as linearization mean ± error using all time-points.
Publisher’s Note: MDPI stays neutral with regard to jurisdictional claims in published maps and institutional affiliations.