Article

Coupling Coordination Analysis of Regional IEE System: A Data-Driven Multimodel Decision Approach

Business School, Suzhou University, Suzhou 234000, China
*
Author to whom correspondence should be addressed.
Processes 2022, 10(11), 2268; https://doi.org/10.3390/pr10112268
Submission received: 20 September 2022 / Revised: 28 October 2022 / Accepted: 31 October 2022 / Published: 3 November 2022
(This article belongs to the Special Issue Sustainable Supply Chains in Industrial Engineering and Management)

Abstract

:
Coordinating regional innovation–economy–ecology (IEE) systems is an important prerequisite for overall continuous regional development. To fully understand the coordination relationship among the three, this study builds a data-driven multimodel decision approach to calculate, assess, diagnose, and improve the regional IEE system. First, the assessment indicator system of the regional IEE system is established. Secondly, the range method, entropy weight method, and weighted summation method are employed to calculate the synthetic developmental level. Thirdly, a multimodel decision approach including the coupling degree model, the coordination degree model, and the obstacle degree model is constructed to assess the spatiotemporal evolution characteristics of the regional IEE system coupling coordination and diagnose the main obstacles hindering its development. Finally, the approach is tested using Anhui Province as a case study. The results show that the coupling coordination degree of the Anhui IEE system presents a stable growth trend, but the coupling degree is always higher than the coordination degree. The main obstacle affecting its development has changed from the original innovation subsystem to the current ecology subsystem. Based on this, some countermeasures are put forward. This study, therefore, offers decision support methods to aid in evaluating and improving the regional IEE system.

1. Introduction

Along with the fast development of the worldwide economy, new requirements have been put forward for economic growth [1,2], scientific and technological innovation [3,4], and ecological environment construction [5,6]. In this new era, all countries face the task of integrating the construction of ecological civilization and scientific and technological innovation with economic construction [7] and must move toward green and coordinated development [8]. Ecology links production and consumption, and the construction of ecological civilization is determined to a great extent by the economic structure and economic development mode. With continuous changes in cloud computing, artificial intelligence, big data, and other modern information technologies, regional innovation has become the main force promoting regional economic [9] and ecological civilization construction [10]. Therefore, local governments and in-depth academic studies are very concerned about the important issues of how to coordinate relationships among the three systems of regional innovation, regional economy, and regional ecology, and exploring the high-quality development model promoted by regional coordinated development. In particular, scholars have conducted several studies examining the interaction between two of the three systems: between regional innovation and regional economy [11], between regional innovation and regional ecology [12,13], and between regional economy and regional ecology [14].
Numerous studies report on the connection between regional innovation and regional economy, however, most scholars begin with the angle of technological innovation [15] to analyze how regional innovation impacts and promotes regional economic growth [16]. Scholars generally agree that innovation is the basic motivity and source of economic growth and development activities [17,18]. Antonioli et al. [19] emphasized that innovation and institutional change could contribute to a rapidly developing economy. Adak [20] explored this linkage between scientific and technological innovation and economic growth, and analyzed the path from technology introduction, to the number of patents, to economic development. Liang et al. [21] discussed the co-evolution principle between technological innovation and regional economic development and studied the co-evolution law and crucial influencing properties between them through the use of the dynamical coupling model and geographical detector method. Cheng and Wang [22] explored the multiplier effect of science and technology innovation on community economic development through empirical data analysis from seaside cities. Chen and Zhang [23] applied this coupling coordination degree model and geographical detector for conducting the multi-scale evaluation of the coupling coordinative degree between innovation and economic development, taking resource-based cities as an example. This model was also used by Tian et al. [24] to reveal the synergistic condition between green innovation efficiency and economic development. Pradhan et al. [25] discussed the relationship between innovation and economic growth in Euro area countries, while Qamruzzaman and Jianguo [26] pointed out that there is a long-term cointegration relationship between financial innovation and economic growth in South Asia. Furthermore, Pala [27] selected 25 developing countries as research objects to explore the impact of innovation on economic growth.
Research has produced rich findings on the interaction between the regional economy and regional ecology, and several mature theories and models have been formed and widely used, such as the coordinated development theory [28], correlation analysis between economy and environment [29,30], and economic energy environment impact model [31]. Peng et al. [32] analyzed the external and inherent connections between the ecological environment and economic development by means of the coupled coordination theory. Fan et al. [33,34] investigated the coupling state between the urban social economy and the ecological environment. Liu et al. [35] explored the coupling mechanism and space-time coordination between the development of the economy and ecological environment along the Yellow River Basin. Taking the Beijing-Tianjin-Hebei region as the research target, Liao et al. [36] also examined the coupling and coordination level between them. Shi et al. [37] also analyzed the coupling coordination and spatial-temporal heterogeneity between them by applying a geographically and temporally weighted regression model. Finally, Adami and Schiavon [38] elaborated on the nature of the interrelation between economy and ecology.
The research stream on the interplay relationship between regional innovation and regional ecology is growing. Liu et al. [39] analyzed the mechanism of new knowledge growth and explored theoretically the effects of technological innovation on ecological environment quality improvement. After the environmental Kuznets curve hypothesis [40,41] was proposed, several topics emerged, such as the relationships between economic growth and suspended solids [42], between economic growth and sulfur dioxide emissions [43], between economic growth and carbon dioxide emissions, [44] and between economic growth and air pollution [45]. Xia and Bing [46] explored the impact mechanism of environmental optimization on the improvement of regional innovation performance and noted that the former can promote the latter. Ke et al. [47] took advantage of a spatial measurement technique to present the spatial effect of innovation efficiency on ecological footprints. Moreover, Meirun et al. [48] explored green technology innovation’s dynamic impact on Singapore’s economic growth and carbon dioxide emissions. Brancalion [49] emphasized the importance of innovation in regional ecological restoration. Furthermore, Murphy and Gouldson [50] pointed out that ecological and economic benefits can be achieved through innovation.
With the continuous expansion of research, the coordinated research among the three is expanding, such as innovation-economy-education [51,52], economy-ecology-health [53,54], and ecology-innovation-climate change [55]. For instance, Wang and Tan [56] explored the coupling conditions among finance development, scientific and technical innovation, and economic growth. Zhang [57] explored the coupled and coordinated state of the regional economy, tourism, and ecological environment. Liu et al. [58,59] explored the space-coupled and coordinated degree of the energy-economy-environment system. Similarly, Yan et al. [60] described the coupled and coordinated state among the three by using Australian data from 2007 to 2016. Taking the Huai-Hai economic region as an example, Zheng et al. [61] examined the coupling relationship and its heterogeneity among technological innovation, industrial transformation, and environmental efficiency based on models such as the super efficiency relaxation measurement model and grey correlation analysis. Furthermore, Xu et al. [62] worked to identify methods for achieving regional coordinated development using aspects of technological innovation, industrial upgrading, the ecological environment, and their interactions. Huang et al. [63] explored the coupling research on technological innovation, talent accumulation, and the ecological environment. Yin et al. [64] used the coupling coordination model to determine the coordination degree among environmental regulations, scientific and technical innovation, and green development. Wu [65] measured and evaluated the regional technology-economy-ecology coordination relationship. Essentially, it can be seen that the interrelationship and interaction among regional innovation, economy, and ecology are viewed with consensus. However, relevant studies on the analysis of the coupling and coordination of the three factors are limited.
The above research findings indicate that scholars have mostly focused on researching the pairwise relationships among regional economy, regional innovation, and regional ecology. This research stream is relatively mature, which provides a certain foundation for studying the relationships among the three; however, room still exists for further in-depth research. First, few studies place the regional innovation, regional economy, and regional ecology systems into the same framework to quantitatively assess coupling and coordination among them. Second, the existing literature provides little discussion on the spatial and temporal evolution trend for coupling coordination development among the three systems; thus, it is necessary to further analyze its spatial and temporal evolution characteristics and heterogeneity. Third, proposed policy recommendations have been relatively broad, making it necessary to further identify obstacles blocking the coordinated development of the three systems, and subsequently, formulate targeted countermeasures and suggestions. Challenged by the above, this study builds a data-driven multimodel decision approach for calculating, assessing, diagnosing, and improving the regional innovation–economy–ecology (IEE) system to provide a scientific foundation and reference for harmony and the integrated planning of sustainable regional development.
This study is of great theoretical and applied significance. On its theoretical significance, first, the assessment indicator system of the regional IEE system coupling coordination development is established, providing researchers with a new study vision of the good coupling and orderly coordination of three subsystems. Second, a data-driven multimodel decision approach for regional IEE coupling coordination development is established, and the spatial and temporal evolution laws and factors affecting its development are identified, thereby enriching the assessment method system. Third, this study reveals the trend of coupling and coordination and the function mechanism of the regional IEE system, expanding the framework of coupling coordination theory. However, the practical significance must also be considered. First, this study takes Anhui Province as a case study. By evaluating the development level and coupling coordination degree of Anhui’s IEE system, it explores the coupling and coordination development state, identifies its key obstacle factors, and comprehensively reveals the internal mechanism of Anhui’s IEE system development. Second, it analyzes the spatio-temporal evolution characteristics of the coupling and coordinated development of Anhui’s IEE system, explores the internal mechanism of its coupling and coordinated development, and then proposes targeted strategies to provide decision-making guidance for relevant government departments and enterprises. Third, it actively implements the sustainable development goals of the United Nations, which provides an important reference for the realization of regional innovation-economic-ecological sustainable development goals.
The basic structure of the thesis is as follows: Part 2 elaborates on the research method. Part 3 displays a case study, in which Anhui Province is selected as a case to verify the method’s effectiveness and feasibility, and then provides effective countermeasures. Lastly, Part 4 presents the conclusion and sums up the essay.

2. Method

This part of the paper mainly discusses our research methods, involving the calculation, assessment, and diagnosis methods of the coupling coordination development of the regional IEE system. Its contents include method flow, data collection, data processing, and data modeling.

2.1. Method Flow

Promoting sustainable regional development necessitates placing the three systems—regional innovation, regional economy, and regional ecology—into the same framework, constructing the calculation framework and assessment system for the three subsystems’ coupled coordinated development from the systems theory perspective, and conducting a systematic, integrated, and collaborative reform from the global optimization perspective [66,67]. This is urgently needed for high-quality coordinated regional development. However, given the complicacy and diversification of the three systems’ data indicators, research has faced challenges regarding how to apply efficacious methods to calculate, assess, diagnose, and improve the three systems’ coupling coordination development level.
To address this challenge and improve regional coordination development levels, this study constructs the data-driven multimodel decision approach [68,69] for the calculation, assessment, diagnosis, and promotion of regional IEE system coupling coordination development. In the data collection stage, we used surveys and research methods to define the data range. The collected data primarily includes statistical data on regional innovation, the regional economy, and the regional ecology. Empirical analysis is used in data processing and data modeling. Data processing mainly uses the range method-entropy weight method-weighted summation method to obtain the data standardization value, indicator weight, and synthetic developmental level score. Data modeling is used to build the coupling degree model and the coordination degree model for calculating the regional IEE system. Then, the coupling degree and coordination degree are identified as well as the key obstacles blocking the system’s development using the obstacle degree model. The innovative practice applies the integrated method to the case of Anhui Province, verifies the integrated method’s effectiveness, obtains the assessment results, and proposes targeted policy recommendations. The method flow chart of the study is illustrated in Figure 1.

2.2. Data Collection

Data collection is the basis of scientific data analysis. The accuracy of collected data is directly related to the value of the data analysis results. This study uses survey research methods to extract the desired data from the huge data. First of all, the source of the data should be clarified. The data of this study are from public publications and second-hand data collection. The main advantages of this data source are convenience, cost-saving, and accurate data. Therefore, this study’s sample data are mainly observed from government statistical data resources, such as the “Statistical Yearbook”, every year. Secondly, the scope of data collection must be defined. Based on the element connotation of the regional IEE system and the scientific and quantifiable principle, this study identifies the main indicators that can reflect the three subsystems, constructs an indicator system for the coordinated development of the regional IEE system, and determines the sample data capacity. Finally, according to the scope of the data collection, the data are collected through the data collection channels of the statistical yearbook, and the collected data are counted and summarized in an EXCEL table to lay a data foundation for the next stage of data processing.

2.3. Data Processing

2.3.1. Range Method

This composite regional IEE indicator system includes three subsystems, with several criterion layers under the subsystem and several assessment indicators under the criterion layer because different indicators have different measurement units, which present non-comparability. Therefore, this study applies the range method for standardizing each indicator value to eliminate the measurement unit problem. The standardized calculation formula is:
X i j = { x i j β j α j β j × 0.99 + 0.01 x j   i s   a   p o s i t i v e   i n d i c a t o r α j x i j α j β j × 0.99 + 0.01 x j   i s   a   n e g a t i v e   i n d i c a t o r
where X i j is the sample value, x i j is the standardized date value, and α j and β j are the highest and the lowest values of indicator j , respectively. The value range of x i j is between {0.01, 1}.

2.3.2. Entropy Weight Method

When calculating the comprehensive assessment score of each subsystem, it is necessary to weigh each indicator in the system. In view of the widespread use of the objective weight method-entropy weight method [70,71], we use this method to measure each indicator weight in each subsystem.
First, indicator weight R i j is calculated using standardized data:
R i j = X i j i = 1 t X i j i = 1 , 2 , 3 , t ; j = 1 , 2 , 3 , m
Let k = 1 ln ( t ) > 0 , as the adjustment coefficient, and calculate indicator information entropy e j :
e j = k i = 1 t R i j ln R i j i = 1 , 2 , 3 , t ; j = 1 , 2 , 3 , m
Determine indicator weight W j :
W j = 1 e j m j = 1 m e j j = 1 n W j = 1 , j = 1 , 2 , 3 , m
where W j represents the weight coefficient of indicator j , and 0 < W j < 1 , n represents the number of selected indicators. Using the weights of the indicators, we derive comprehensive assessment scores for the regional innovation ( U A ), regional economy ( U B ), and regional ecology ( U C ) subsystems.

2.3.3. Weighted Summation Method

The weighted summation method is adopted in this study to determine the synthetic developmental level score of the regional innovation subsystem ( U A ), the synthetic developmental level score of the regional economic subsystem ( U B ), and the synthetic developmental level score of regional ecological subsystem ( U C ). The specific formula is as follows:
U A   o r   U B o r U C = j = 1 n W j × X i j
where U A ,   U B ,   and   U C are the comprehensive assessment score of the regional innovation subsystem, regional economy subsystem, and regional ecology subsystem. W j is the indicator weight of the response system and X i j is the standardized indicator value.

2.4. Data Modeling

The coupling coordination degree model [72] is a widespread application that incomprehensively calculates the degree of interaction, influence, and promotion between the interior factors of a complex system in a specific range. Coupling represents the interaction relationship [73], coordination is the constraint condition for the development process [74], and development is the ultimate goal. This model is often used to calculate and assess two systems [75,76], three systems [77,78], and multi-systems [71]. In this study, a multimodel decision approach of the regional IEE system is established, which includes the coupling degree model, coordination degree model, and obstacle degree model.

2.4.1. Coupling Degree Model

The coupling degree model can be applied to represent the influence degree of interaction of two or more systems. Referring to the research of relevant scholars [75,79], the three subsystems coupling degree model for the regional IEE system is derived as follows:
C = 3 · ( U A · U B · U C ) 1 3 U A + U B + U C
where   C is the coupling degree score, with a value range from {0,1}. The higher the C value is, the stronger the interaction among the three subsystems and the better the coupling condition. Drawing on the views of relevant scholars [65,73], we divide the coupling degree into four stages. When C [ 0 ,   0.3 ] , it is in a stage of low-level coupling. When C ( 0.3 ,   0.5 ] , it is in the confrontation stage. When C ( 0.5 ,   0.8 ] , it is in the running stage. When C ∈ (0.8,0.1], it is in the high-level coupling stage.

2.4.2. Coordination Degree Model

Based on the result of the former model, we calculate the coordination degree of three systems and two systems. The coordination degree can clearly display the function degree size of interaction and influence among systems and can determine whether the systems develop harmoniously. This study represents the formula derivation of the coordination degree model.
D = C × Y
Among them, the coordination coefficients of two systems:
Y = α U A + β U B   o r   α U A + β U C   o r   α U B + β U C
Three system coordination coefficients:
Y = a U A + b U B + c U C
where   Y is the synthetic developmental level score, a ,   b ,   c are the undetermined weights of the synthetic developmental level scores of the three systems, and α , β is the undetermined weight of the synthetic developmental level score of the two systems. Regional innovation, regional economy, and regional ecology are equally important. With reference to the practices of relevant scholars [32,80], the undetermined weight of the synthetic developmental level score of the three systems is a = b = c = 1 / 3 , and the undetermined weight of the synthetic developmental level score of two systems is α = β = 1 / 2 . D is the coordination degree, which is in the range from 0 to 1. The classification of coordination degree D refers to the classification basis of relevant scholars [72,81], and the classification level is illustrated in Figure 2.

2.4.3. Obstacle Degree Model

This study uses the obstacle degree model [82,83] to diagnose and distinguish the major factors blocking the coupling coordinated development of the regional IEE system, which is helpful for the government when adopting targeted policies and measures to promote coordinated development. This is calculated as follows:
M j = ( 1 X i j ) × ( P i × W i j ) × 100 / ( 1 X i j ) × ( P i × W i j )
T i = M i j
where X i j represents the standardized value of a single indicator x i j , M i j is the obstacle degree of the indicator j , and T i represents the obstacle degree score of the subsystem i .   P i is the weight of subsystem i and W i j is the weight of indicator j in system i .
To sum up, this study builds a coupling degree model, coordination degree model, obstacle degree model, and other technical means to measure the coupling, coordination, and obstacle degrees of the regional IEE system. This reveals the space-time evolution law of the coupling and coordinated development of the regional IEE system, clarifies the main factors affecting its development, and lays a solid foundation for promoting the sustainable development of the regional IEE system.

3. Case Study

We take Anhui Province as the object of study for validating the data-driven multimodel decision approach proposed and verifying the effectiveness of the approach. In 2014, Anhui’s GDP broke through the 2 trillion mark for the first time, ushering in new breakthroughs in economic development. At the same time, 2014 was also the first year for Anhui to carry out the pilot work of building an innovative province. In addition, in 2014, Anhui Province carried out the construction of provincial ecological civilization pilot demonstration areas for the first time. Since then, Anhui’s scientific and technological innovation, economic development, and ecological environment protection have ushered in a new stage, with accelerated progress and remarkable achievements. Therefore, 2014 is selected as the starting year of this study. At the same time, since the 2021 statistical yearbook has not been published yet, in view of the availability of data collection, this study chooses 2020 as the end year of the study. To sum up, the sample data used in this study are mainly from the statistical data resources of Anhui Province from 2014 to 2020, which is a good model and reference for regional research. In this section, we include the study area, results analysis, and discussion and managerial implications.

3.1. Study Area

Anhui Province is located in East China, between 114°54′–119°37′ E and 29°41′–34°38′ N, as shown in Figure 3. It is approximately 450 km wide from east to west and 570 km long from north to south. The land area is 139,400 km2, which occupies 1.45% of the national territory. Anhui is an ecological resort with good mountains and water. It is the only province covered by the two national strategies of the Yangtze River Delta Yangtze Regional Integration and the Rise of the Central Region. Anhui is experiencing “three historical changes”, from everything waiting to be done to a flourishing economy, a traditional agricultural province to a new industrial province, and innovation catching up to innovation leading. At present, how to deeply integrate regional innovation, economic development, and ecological construction, as well as actively explore innovation guidance, ecological priority, and high-quality economic development, have become important topics. Therefore, there is a need to calculate, assess, diagnose, and promote the coupling coordinated development of the Anhui regional IEE system.

3.2. Results Analysis

3.2.1. Data Collection Results

Regional innovation, regional economy, and regional ecology are complex systems that affect and promote each other. The regional economy provides material demand guarantees for regional innovation and is restricted by the ecological environment and regional innovation level. Regional innovation is the first driving force leading development [84], as well as key to improving economic development quality [85] and promoting the transformation and upgrade of economic structures [86]. It also promotes ecological civilization construction by improving energy utilization efficiency and reducing energy consumption and three wastes discharge [87]. Further, regional eco-civilization construction is a strong base for increasing regional economic sustainability [6,10,88]. Therefore, the three subsystems—regional innovation, economy, and ecology—interact with, promote and support each other, and share a relationship of coupling coordination development.
Constructing the indicator system is a precondition and an important guarantee for calculation and assessment. This study follows the principles of scientific, hierarchical, and systematic indicator system construction and comprehensively considers the availability and persuasiveness of the indicator data. The indicator system constructed in this study includes 3 subsystems (system layer), 9 major criteria (criteria layer), and 35 basic indicators (indicator layer). The three subsystems include the innovation subsystem, regional economic subsystem, and ecological subsystem, and there is a coupling and coordination relationship among them [62,65].
The regional innovation subsystem refers to the regional innovation environment and innovation input and output [89,90]. The innovation environment refers to various software and hardware environments that affect the innovation of the innovation subject in the innovation process, such as a good policy environment, social environment, and cultural environment [91]. Compared with the existing research [92,93], this study increased the number of legal entities in cultural and related industries above the designated size (A11) [94] and the number of public library institutions (A12) [95] in the innovation environment criteria layer. Innovation input refers to the resources consumed for scientific research and technological innovation, mainly embodied in human and capital input [96]. Therefore, this paper selects the internal expenditure of R&D funds (A21), the number of college students per 10,000 population (A22), the full-time equivalent of R&D personnel (A23), and R&D personnel input/person (A24) to evaluate innovation input. Innovation output directly reflects the operation result of innovation, which is manifested as knowledge output and economic output [97]. Knowledge output is mainly manifested in scientific and technological achievements and patents. The economic output reflects the economic value created by innovation. This paper selects the technology market turnover (A31), number of registered scientific and technological achievements at or above the provincial or ministerial level (A32), invention patent authorization (A33), and patent application authorization (A34) to evaluate the innovation output.
For the regional economic subsystem, this study combines the current focus of regional economic development, referring to previous research [35], and expands the connotation of the regional economic subsystem from three aspects: economic scale, economic quality, and economic structure [98]. Economic scale is the material basis for economic development. This paper selects the GDP (B11), total retail sales of consumer goods (B12), total import and export trade (B13), and total investment in fixed assets (B14) to reflect the economic scale. Economic quality is reflected in economic benefits, social benefits, and ecological benefits. Compared with the existing research [99], per capita GDP (B21) and urban per capita disposable income (B23) have been added to relevant indicators of economic quality in this study. Economic structure refers to the composition and structure of the national economy, involving industrial structure, labor structure, and consumption structure [100]. This paper selects the proportion of employees in the tertiary industry (B31), the proportion of the added value of the tertiary industry in GDP (B32), and the urbanization rate (B33), to reflect the economic structure.
Drawing on the “China Sustainable Development Strategy Report” issued by the Chinese Academy of Sciences and relevant previous studies [59,101], the regional ecological subsystem is mainly assessed from three dimensions: the ecological basis, ecological pressure, and ecological response [102]. The ecological basis represents the ecological environment state and environmental change in a specific time period. This paper selects the percentage of forest cover (C11), urban per capita park green area (C12), area of nature reserve (C13), and per capita water resources (C14) to reflect the ecological foundation. Ecological pressure represents the load of human economic and social activities on the environment [103]. Compared with existing studies [104,105], this study adds industrial wastewater emissions (C21), industrial sulfur dioxide emissions (C22), and industrial solid waste output (C23) to the relevant indicators of ecological pressure. Ecological response refers to the actions and measures taken by human society to maintain the stability of the ecological environment. In this paper, the green coverage rate of urban built-up areas (C31), centralized sewage treatment rate (C32), the comprehensive utilization rate of general industrial solid waste (C33), and the harmless treatment rate of urban domestic garbage (C34) [106] are selected to evaluate the ecological response.
Finally, this study establishes a comprehensive assessment indicator system for the coupling coordination development of the regional IEE system, as described in Table 1. “Direction” refers to whether an indicator is a positive indicator or a negative indicator in Table 1. Positive indicators and negative indicators have different meanings. Positive indicators are represented by “+”, and the larger the value, the better. Negative indicators are represented by “−”, and the smaller the value, the better.
The final assessment indicator system includes 3 subsystems (system layer), 9 major criteria (criteria layer), and 35 basic indicators (indicator layer). On this basis, we collect corresponding sample indicator data. All the indicator data used in this paper are from Anhui Statistical Yearbook (2014–2020) [107], China Statistical Yearbook (2014–2020), China Environmental Statistical Yearbook (2014–2020), and China Industrial Statistical Yearbook (2014–2020) [108].

3.2.2. Indicator Weight Analysis

In this study, the entropy weight method is used to determine the weight of each indicator. Before the entropy weight method [70] is adopted, we need to standardize the collected data to obtain the standardized value. The range method [71] is used in the standardization process, as shown in Formula (1). After using Formula (1) to obtain the standardized value, we use the entry weight method as shown in Formulas (2) and (3) to find the weight of each specific indicator in the subsystem. The weight of the criteria layer is obtained from the sum of its subordinate specific indicator weight. The weight determination process of each subsystem is the same. All calculation processes of obtained weight data resources were implemented in an EXCEL table. Finally, the weight of the Anhui IEE system coupling and coordinated development indicator system is shown in Table 2.
As Table 2 illustrates, among the innovation subsystem’s three criteria layers, the proportion of innovation input is the highest, reaching 0.444. The proportion of innovation environment is the lowest, with a weight value of 0.194. The proportion of innovation output is in the middle, with a weight value of 0.362. The number of college students per 10,000 population/person (A22) is the index with the largest weight in the innovation subsystem, and its weight value reaches 0.178. The scale of higher education is closely related to regional innovation. Then, in the economic subsystems’ three criteria layers, the proportion of economic quality is the highest, reaching 0.402. The proportion of economic structure is the lowest, with a weight value of 0.242. The proportion of the economic scale is in the middle, with a weight value of 0.357. Whole-society productivity (B24) is the indicator with the largest weight in the economic subsystem, and its weight value reaches 0.123. It is evident that labor productivity is an important indicator to evaluate the level of regional economic development. Finally, in the three criteria layers of the ecological subsystem, the proportion of ecological foundation is the highest, reaching 0.409. The proportion of ecological response is the lowest, with a weight value of 0.246. The proportion of ecological pressure is in the middle, with a weight value of 0.345. The area of nature reserve/filling ecosystems (C13) has the largest weight in the ecosystem, and the area of nature reserve/filling ecosystems mainly reflects the stability and quality of regional ecosystems.

3.2.3. Synthetic Developmental Level Analysis

The development level and synthetic developmental level of each subsystem in Anhui Province from 2014 to 2020 are calculated using Equations (1)–(5), as illustrated in Figure 4.
As Figure 4 illustrates, the development level of the innovation subsystem follows a rapid upward trend, and the innovation environment is steadily optimized. Innovation input and output have been increasing since 2018 and 2017, respectively. This is highly consistent with the innovative development practices of Anhui Province. Anhui’s regional innovation capacity has ranked first nationwide for ten consecutive years, and it is the province with the largest increase in the ranking of East China. The development level of the economic subsystem presents a strong uptrend, and the development level of the economic scale and economic quality criteria are the major drivers supporting the development of the economic subsystem. The development level of the ecological subsystem shows a rapid upward trend, with a good ecological foundation and strong ecological elasticity. This is consistent with Anhui’s efforts to build an “ecological barrier” in the Yangtze River Delta and create a “green economy” growth point. On the whole, the synthetic developmental level of the innovation economy ecology shows a steady upward trend during the study period, resulting from the joint action of the three subsystems. However, the contribution degree of each subsystem is different. The contribution degree order is as follows: ecological subsystem > economic subsystem > innovation subsystem. It is thus clear that the main driving force of Anhui’s synthetic developmental level has changed throughout the study period. Regarding the relationships among the three subsystems, the development level gradually trends toward coordination during the study period.

3.2.4. Coupling Coordination Development Level Analysis

With regard to the development level data and the coupling coordination degree model, we use Excel 2018 software to calculate the coupling degree and coordination degree of the three systems and two systems of Anhui IEE. Table 3 illustrates the calculation results. On this basis, we describe the spatial and temporal evolution pattern of the coupling coordination of three systems and two systems from 2014 to 2020 (Figure 5) to analyze their spatial differences and evolution characteristics more intuitively.
As the data in Table 3 indicates, Y is the synthetic developmental level score; C is the coupling degree score; and D is the coordination degree. During the investigation period, the coupling degree among the three systems was at the high-level coupling stage, except for in 2014, when it was at the running-in stage. The coupling degrees of the innovation–economic and innovation–ecological subsystems were at a high-level coupling stage in all years except 2014, when they were at the running-in stage. The coupling degree of the economic ecological subsystem was at the high-level coupling stage in this investigation period. In addition, the coupling degree values of these high-level coupling stages are all above 0.927, which is a high level. However, a high coupling level does not mean a high coordination level. As Table 3 illustrates, in 2014–2019, the coordination degree of each system lagged behind the coupling degree. By 2020, the gap between the coordination degree and coupling degree was not apparent, and the gap value was below 0.06.
Figure 5 illustrates the coordination development and evolution of three subsystems and two subsystems in Anhui Province. The IEE system indicates that the innovation–economy and innovation–ecology subsystems experienced the evolution track of “modern disorder-on the verge of disorder-barely coordinated-primary coordination-good coordination-high quality coordination”. Over the course of the research, the level of coordination development improved consistently. The coordination degree of the economic ecological subsystem experienced the evolution track of “middle disorder-on the verge of disorder barely coordinated primary coordination-intermediate coordination-good coordination-high quality coordination”. In addition, we find that, from 2014 to 2019, the coordination state of the two systems showed the following relationship: “economy-ecology > innovation–ecology > innovation–economy”. In 2020, its coordination state showed the following relationship: “innovation–economy > innovation–ecology > economy–ecology”. Anhui can be observed to shift from being driven by ecological factors to being driven by innovation, owing to Anhui’s in-depth implementation of an innovation-driven development strategy, thereby promoting the transfer of science and technology into a real productive force and highlighting the regional innovation output benefits.

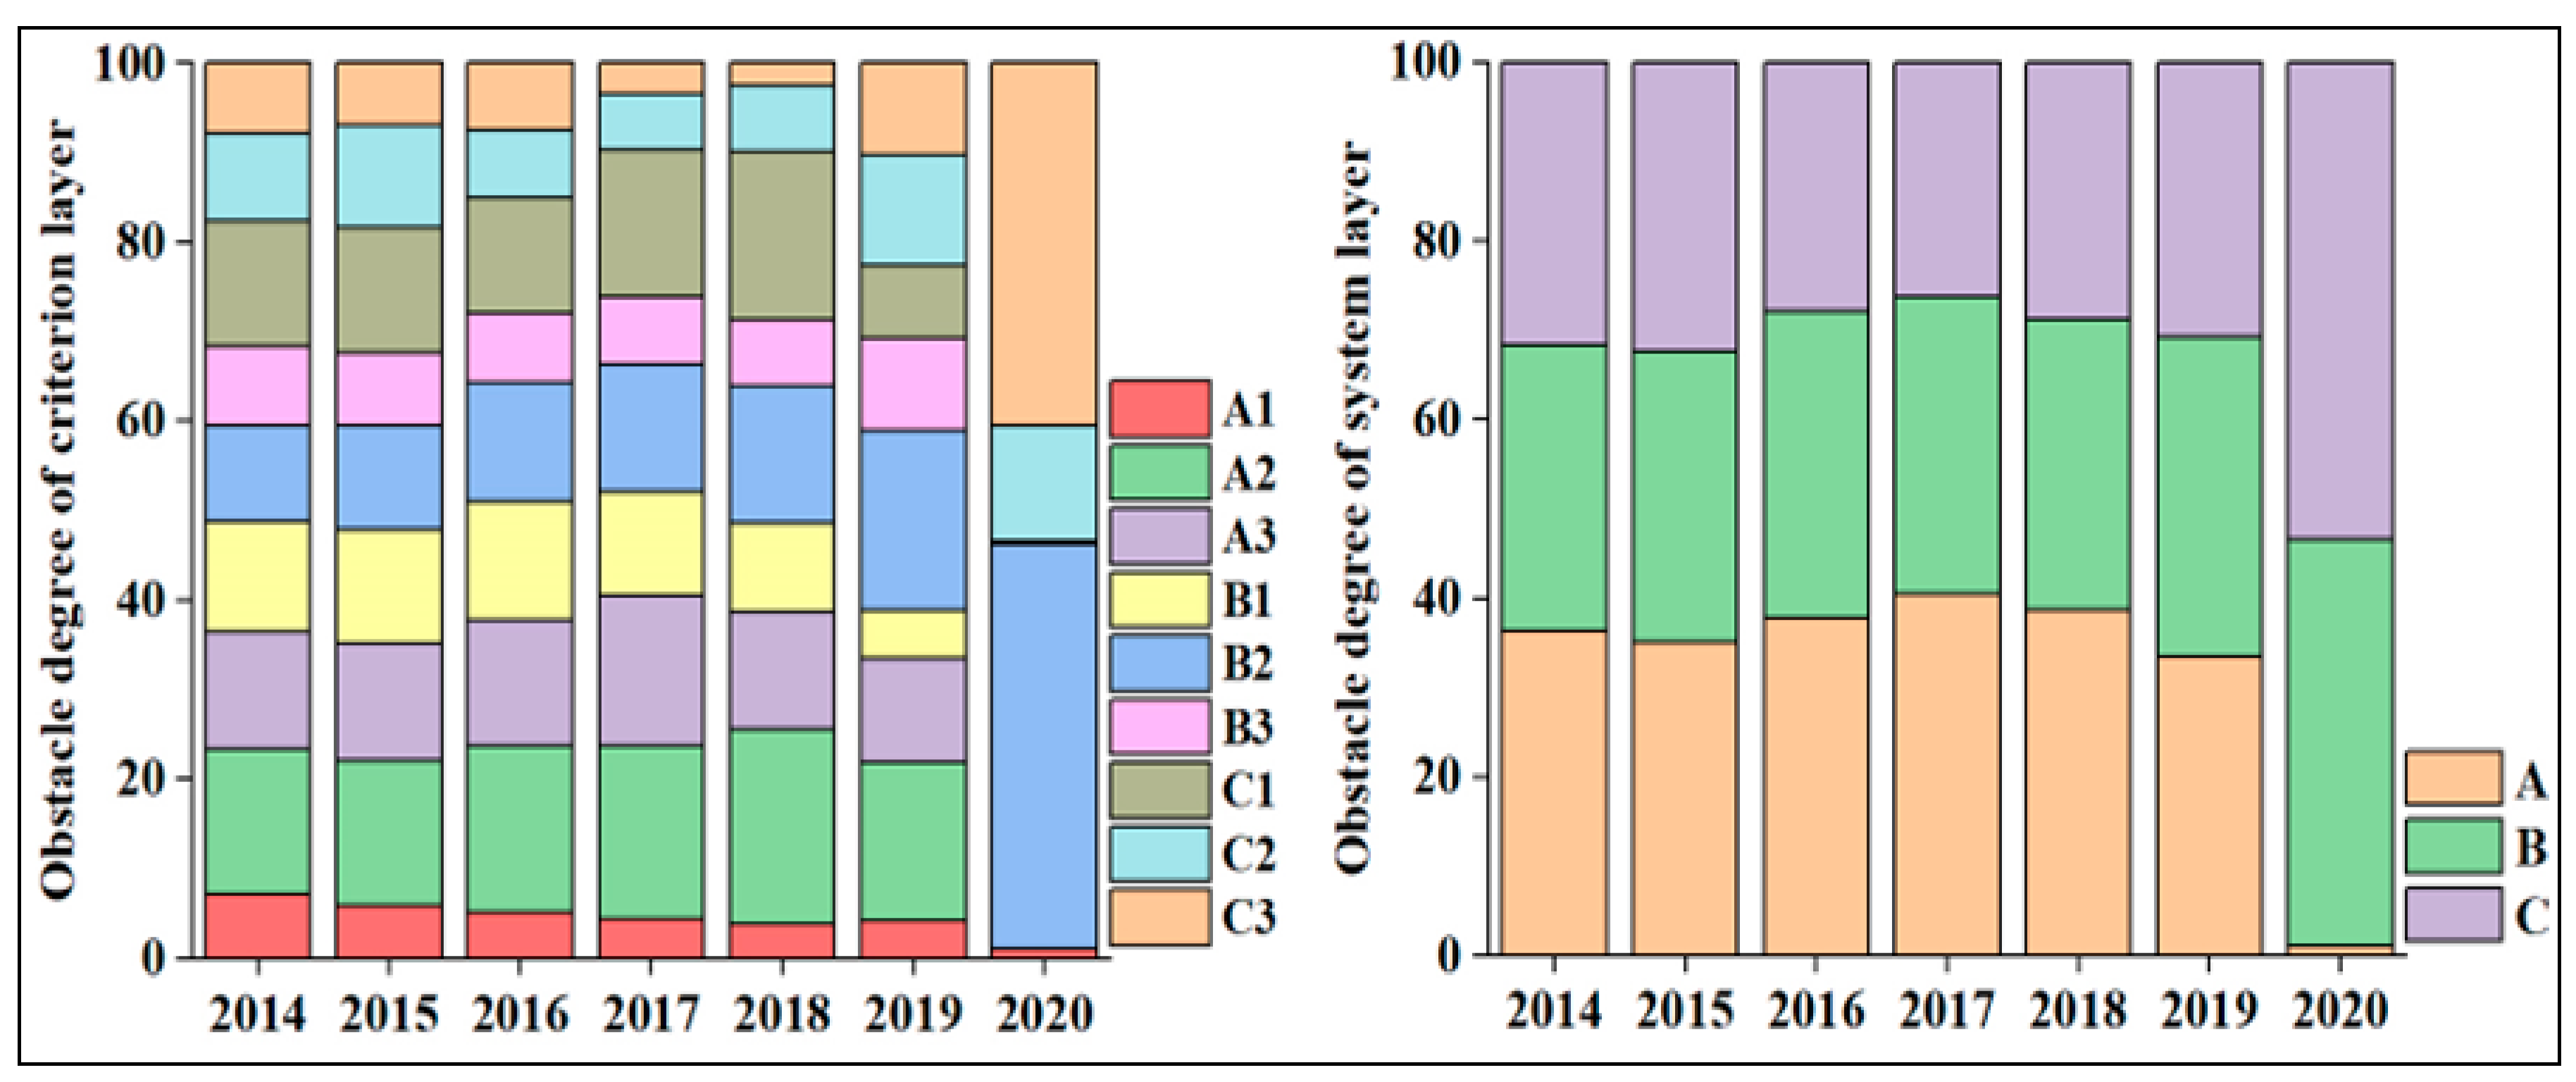
3.2.5. Obstacle Degree Analysis

By the use of the obstacle degree model, the obstacle degree score of the system, criterion, and indicator layers of the IEE system in Anhui Province during 2014–2019 is computed. The computed results are illustrated in Table 4 and Table 5.
As Table 4 and Figure 6 show, at the system level, from 2014 to 2019, the largest obstacle blocking the coordinated development of Anhui’s IEE system was the innovation subsystem. In 2020, the obstacles of the innovation subsystem gradually disappeared, and the ecological subsystem became the largest development obstacle, followed by the economic subsystem. The economic rise of the innovation region in Anhui also placed certain pressures on the ecological environment. It is an important task for regional economic planning to seek the coupling coordination development of three subsystems: innovation, economy, and ecology. At the criterion level, innovation input (A2), innovation output (A3), economic scale (B1), economic quality (B2), and ecological basis (C1) were the top five projects in terms of barrier degree from 2014 to 2018. In 2019, the economic scale (B1) and ecological basis (C1) were replaced in the top five by ecological pressure (C2) and ecological response (C3), respectively. In 2020, the barrier degree of economic quality (B2) to the coupling coordination development of complex systems reached 45.15, and the barrier degree of ecological response (C3) to the coupling coordination development of complex systems reached 40.42, becoming the main obstacle of Anhui’s IEE system. These results are consistent with those for the system layer.
Finally, we sorted and ranked the obstacle degree results of 35 specific indicators in the indicator layer, and identified the top five major obstacle factors in Anhui Province from 2014 to 2020 (Table 5).
As Table 5 illustrates, from 2014 to 2017, the top four barrier factors remained unchanged: “C13 > A22 > A32 > B24.” The fifth obstacle factor was C31 in 2015, and B31 in the other three years. The top five barrier factors in 2018, 2019, and 2020 were “C13 > A22 > B22 > A32 > B42”, “B22 > A22 > B31 > C14 > C33”, and “B22 > C31 > C33 > C23 > A11”, respectively. We find that the changing trend of the barrier factors in the indicator layer is consistent with the change in the criteria layer and the system layer. During the study period, the obstacle degree of innovation indicators gradually decreased, while the obstacle degree of economic and ecological indicators gradually increased. It is thus clear that the key to realizing the coordinated development of Anhui’s IEE system lies in giving consideration to innovation and focusing on enhancing the sustainable harmony development level of the economic and ecological subsystems.

4. Discussion and Managerial Implications

Apart from the existing literature [30,48,109], this paper gains significant advantages. First, an assessment indicator system of the coupling coordination development of regional IEE systems is established, which enriches the theoretical model of the coupled and coordinated relationship between regional systems. Second, a data-driven dynamic integration model method for the coupling coordination relationship of regional IEE systems is established to calculate and assess the coupling coordination degree of three systems and two systems, which enriches the empirical model of the coupling coordination relationship between regional systems. Third, constructing the obstacle factor diagnosis and identification mechanism that affects its development helps to optimize the path of the coupling coordination development of the three systems.
Promoting the coupling coordination development of regional innovation, regional economy, and regional ecology is the internal requirement for sustainable regional development [110] and has important practical significance for regional eco-civilization construction and innovation driven-development. Combined with the above, we identify three managerial implications. First, realizing the good coordination development of regional innovation, the regional economy, and the regional ecosystem is key to promoting high-quality regional development. Objective quantitative comprehensive assessment of the coupling coordination development of the three systems in the specific region will help reveal the region’s spatial and temporal evolution law. Second, from a systems theory and synergy theory perspective, it becomes essential to correctly understand the coordination development relationship of regional innovation, regional economy, and regional ecology, identify the obstacles blocking coordinated development, and formulate a systematic and complete countermeasure system with a comprehensive top-level design and rigorous and detailed supporting measures. Third, the three subsystems of regional innovation, regional economy, and regional ecology are interdependent and interactive. To realize the sustainable and coordinated development of the economy and ecological environment, support and guidance should be provided for innovation; innovation will be the only way to maintain a green economic growth pattern.

5. Conclusions

Realizing high-level coupling coordination development of the regional IEE system is a very urgent request for achieving regional high-quality, sustainable healthy development. Therefore, calculating, assessing, diagnosing, and improving its development level are urgent tasks. Accordingly, this study proposes a data-driven comprehensive assessment mechanism for the coupling coordination development of the regional IEE system.
This study builds a data-driven multimodel decision approach to calculate, assess, diagnose, and improve the regional IEE system. Then, the data-driven multimodel decision approach is applied to the case of Anhui. The main conclusions are as follows: (1) The synthetic development level of the Anhui IEE system presents a stable growth trend. The contribution degree order of the three subsystems is as follows: ecological subsystem > economic subsystem > innovation subsystem. (2) The coupling coordination degree of the Anhui IEE system presents a stable growth trend, but the coordination degree has failed to achieve synchronous development with the coupling degree and still lags behind the coupling degree. (3) In the process of the coupling coordination development of the Anhui IEE system, the main obstacle at the system layer has changed from the original innovation subsystem to the current ecology subsystem. The main obstacles in the criteria layer have been the economic quality (B2) and ecological response (C3). The GDP energy intensity (B22), the green coverage rate of urban built-up areas (C31), the comprehensive utilization rate of general industrial solid waste (C33), and industrial solid waste output (C23) are the main obstacles affecting the coordinated development of the Anhui IEE system coupling. This shows that it is necessary to further break down the obstacle factors that hinder the orderly progress and coordinated development of the three subsystems in the future, especially to strengthen the ecological environment governance.
Regarding the innovations this study provides, first, from the systems theory perspective, the coupling coordination mechanism among the three systems is revealed, and the assessment indicator system on the coupling coordination development of regional innovation, regional economy, and regional ecology is established, covering 3 systems, 9 criteria, and 35 basic indicators. Second, based on the viewpoint of coupling coordination theory, a data-driven, three-system coupling coordination model is established to reveal the spatial and temporal evolution law of regional IEE system coupling coordination. Third, from a global perspective, a data-driven obstacle model is established to diagnose the factors impeding the development of the IEE system, and then formulate scientific, objective, and reasonable optimization countermeasures.
This article provides a new method and idea for the study of the coupling and coordinated development of regional IEE systems and provides a decision-making basis for the formulation of government coordination policies and the transformation and upgrading of enterprises. However, the regional IEE system is a complicated and poly-level operating system, involving many factors. In this study, only representative and available data indicators are included in the assessment system. Thus, indicator selection may not be comprehensive, and some deficiencies exist. Therefore, in future research, more data would be collected to calculate and assess the IEE system more objectively and provide additional support for regional synergy development.

Author Contributions

Conceptualization, Y.Y. and F.H.; methodology, F.H.; software, L.D.; validation, F.H.; formal analysis, X.W.; investigation, L.D.; resources, L.D.; data curation, L.D.; writing—original draft preparation, Y.Y.; writing—review and editing, Y.Y.; visualization, X.W.; supervision, X.W.; project administration, F.H.; funding acquisition, Y.Y. All authors have read and agreed to the published version of the manuscript.

Funding

This work was supported in part by a youth project of the Anhui Social Science Planning Project, No. AHSKQ2021D37.

Informed Consent Statement

Not applicable.

Data Availability Statement

Not applicable.

Conflicts of Interest

The authors declare no conflict of interest.

References

  1. Acheampong, A.O.; Boateng, E.; Amponsah, M.; Dzator, J. Revisiting the economic growth–energy consumption nexus: Does globalization matter? Energy Econ. 2021, 102, 105472. [Google Scholar] [CrossRef]
  2. Lin, B.; Zhou, Y. Measuring the green economic growth in China: Influencing factors and policy perspectives. Energy 2022, 241, 122518. [Google Scholar] [CrossRef]
  3. Sovacool, B.K.; Newell, P.; Carley, S.; Franzo, J. Equity, technological innovation and sustainable behaviour in a low-carbon future. Nat. Hum. Behav. 2022, 6, 326–337. [Google Scholar] [CrossRef] [PubMed]
  4. Holroyd, C. Technological innovation and building a ‘super smart’ society: Japan’s vision of society 5.0. J. Asian Public Policy 2022, 15, 18–31. [Google Scholar] [CrossRef]
  5. Yang, Y.; Lu, H.; Liang, D.; Tian, P.; Xia, J.; Wang, H.; Lei, X. Ecological sustainability and its driving factor of urban agglomerations in the Yangtze River Economic Belt based on three-dimensional ecological footprint analysis. J. Clean. Prod. 2022, 330, 129802. [Google Scholar] [CrossRef]
  6. Amirgaliev, N.A.; Askarova, M.; Opp, C.; Medeu, A.; Kulbekova, R.; Medeu, A.R. Water quality problems analysis and assessment of the ecological security level of the Transboundary Ural-Caspian Basin of the Republic of Kazakhstan. Appl. Sci 2022, 12, 2059. [Google Scholar] [CrossRef]
  7. Boons, F.; Wagner, M. Assessing the relationship between economic and ecological performance: Distinguishing system levels and the role of innovation. Ecol. Econ. 2009, 68, 1908–1914. [Google Scholar] [CrossRef]
  8. Liao, B.; Li, L. Spatial division of labor, specialization of green technology innovation process and urban coordinated green development: Evidence from China. Sustain. Cities Soc. 2022, 80, 103778. [Google Scholar] [CrossRef]
  9. Gertler, M.S.; Wolfe, D.A.; Garkut, D. No place like home? The embeddedness of innovation in a regional economy. Rev. Int. Political Econ. 2000, 7, 688–718. [Google Scholar] [CrossRef]
  10. Gai, M.; Wang, X.; Qi, C. Spatiotemporal evolution and influencing factors of ecological civilization construction in China. Complexity 2020, 2020, 8829144. [Google Scholar] [CrossRef]
  11. Potts, T. The natural advantage of regions: Linking sustainability, innovation, and regional development in Australia. J. Clean. Prod. 2010, 18, 713–725. [Google Scholar] [CrossRef]
  12. Wang, S.; Wang, X.; Lu, F.; Fan, F. The impact of collaborative innovation on ecological efficiency–empirical research based on China’s regions. Technol. Anal. Strateg. Manag. 2021, 33, 242–256. [Google Scholar] [CrossRef]
  13. Yasmeen, H.; Tan, Q.; Zameer, H.; Tan, J.; Nawaz, K. Exploring the impact of technological innovation, environmental regulations and urbanization on ecological efficiency of China in the context of COP21. J. Environ. Manag. 2020, 274, 111210. [Google Scholar] [CrossRef] [PubMed]
  14. Wang, J.; Wei, X.; Guo, Q. A three-dimensional evaluation model for regional carrying capacity of ecological environment to social economic development: Model development and a case study in China. Ecol. Indic. 2018, 89, 348–355. [Google Scholar] [CrossRef]
  15. Perroux, F. Economic space: Theory and applications. Q. J. Econ. 1950, 64, 89–104. [Google Scholar] [CrossRef]
  16. Solow, R.M. Technical change and the aggregate production function. Rev. Econ. Stat. 1957, 39, 554–562. [Google Scholar] [CrossRef] [Green Version]
  17. Sener, S.; Saridogan, E. The effects of science-technology-innovation on competitiveness and economic growth. Procedia Soc. Behav. Sci. 2011, 24, 815–828. [Google Scholar] [CrossRef] [Green Version]
  18. Droste, N.; Hansjürgens, B.; Kuikman, P.; Otter, N.; Antikainen, R.; Leskinen, P.; Pitkänen, K.; Saikku, L.; Loiseau, E.; Thomsen, M. Steering innovations towards a green economy: Understanding government intervention. J. Clean. Prod. 2016, 135, 426–434. [Google Scholar] [CrossRef] [Green Version]
  19. Antonioli, D.; Mazzanti, M. Towards a green economy through innovations: The role of trade union involvement. Ecol. Econ. 2017, 131, 286–299. [Google Scholar] [CrossRef]
  20. Mehmet, A. Technological progress, innovation and economic growth; the case of Turkey. Procedia Soc. Behav. Sci. 2015, 195, 776–782. [Google Scholar]
  21. Liang, L.; Wang, Z.B.; Luo, D.; Wei, Y.; Sun, J. Synergy effects and it’s influencing factors of China’s high technological innovation and regional economy. PLoS ONE 2020, 15, e0231335. [Google Scholar] [CrossRef] [PubMed]
  22. Cheng, H.; Wang, B. Multiplier effect of science and technology innovation in regional economic development: Based on panel data of coastal cities. J. Coast. Res. 2019, 94, 883. [Google Scholar] [CrossRef]
  23. Chen, Y.; Zhang, D. Multiscale assessment of the coupling coordination between innovation and economic development in resource-based cities: A case study of Northeast China. J. Clean. Prod. 2021, 318, 128597. [Google Scholar] [CrossRef]
  24. Tian, Y.; Huang, P.; Zhao, X. Spatial analysis, coupling coordination, and efficiency evaluation of green innovation: A case study of the Yangtze River Economic Belt. PLoS ONE 2020, 15, e0243459. [Google Scholar] [CrossRef] [PubMed]
  25. Pradhan, R.P.; Arvin, M.B.; Nair, M.; Bennett, S.E. The dynamics among entrepreneurship, innovation, and economic growth in the Eurozone countries. J. Policy Model. 2020, 42, 1106–1122. [Google Scholar] [CrossRef]
  26. Qamruzzaman, M.; Jianguo, W. Nexus between financial innovation and economic growth in South Asia: Evidence from ARDL and nonlinear ARDL approaches. Financ. Innov. 2018, 4, 20. [Google Scholar] [CrossRef] [Green Version]
  27. Pala, A. Innovation and economic growth in developing countries: Empirical implication of swamy’s random coefficient model (RCM). Procedia Comput. Sci. 2019, 158, 1122–1130. [Google Scholar] [CrossRef]
  28. Norgaard, R.B. Economic indicators of resource scarcity: A critical essay. J. Environ. Econ. Manag. 1990, 19, 19–25. [Google Scholar] [CrossRef]
  29. Boulding, K.E. The Economics of the Coming Spaceship Earth; Routledge: New York, NY, USA, 1966; pp. 1–17. [Google Scholar]
  30. Liu, C.; Cai, W.; Zhai, M.; Zhu, G.; Zhang, C.; Jiang, Z. Decoupling of wastewater eco-environmental damage and China’s economic development. Sci. Total Environ. 2021, 789, 147980. [Google Scholar] [CrossRef]
  31. Oliveira, C.; Antunes, C.H. A multi-objective multi-sectoral economy–energy–environment model: Application to Portugal. Energy 2011, 36, 2856–2866. [Google Scholar] [CrossRef]
  32. Peng, B.; Sheng, X.; Wei, G. Does environmental protection promote economic development? From the perspective of coupling coordination between environmental protection and economic development. Environ. Sci. Pollut. Res. 2020, 27, 39135–39148. [Google Scholar] [CrossRef] [PubMed]
  33. Fan, Y.; Wu, S.Z.; Lu, Y.T.; Zhao, Y.H. Study on the effect of the environmental protection industry and investment for the national economy: An input-output perspective. J. Clean. Prod. 2019, 227, 1093–1106. [Google Scholar] [CrossRef]
  34. Fan, Y.P.; Fang, C.L.; Zhang, Q. Coupling coordinated development between social economy and ecological environment in Chinese provincial capital cities-assessment and policy implications. J. Clean. Prod. 2019, 229, 289–298. [Google Scholar] [CrossRef]
  35. Liu, K.; Qiao, Y.; Shi, T.; Zhou, Q. Study on coupling coordination and spatiotemporal heterogeneity between economic development and ecological environment of cities along the Yellow River Basin. Environ. Sci. Pollut. Res. 2021, 28, 6898–6912. [Google Scholar] [CrossRef] [PubMed]
  36. Liao, M.L.; Chen, Y.; Wang, Y.J.; Lin, M.S. Study on the coupling and coordination degree of high-quality economic development and ecological environment in Beijing-Tianjin-Hebei region. Appl. Ecol. Environ. Res. 2019, 17, 11069–11083. [Google Scholar] [CrossRef]
  37. Shi, T.; Yang, S.; Zhang, W.; Zhou, Q. Coupling coordination degree measurement and spatiotemporal heterogeneity between economic development and ecological environment—Empirical evidence from tropical and subtropical regions of China. J. Clean. Prod. 2020, 244, 118739. [Google Scholar] [CrossRef]
  38. Adami, L.; Schiavon, M. From circular economy to circular ecology: A review on the solution of environmental problems through circular waste management approaches. Sustainability 2021, 13, 925. [Google Scholar] [CrossRef]
  39. Liu, W.W.; Sun, R.; Li, Q. Measurement of coupling degree between regional knowledge innovation and technological innovation: An empirical analysis based on provincial panel data in China during 2010-2014. J. Interdiscip. Math. 2017, 20, 125–139. [Google Scholar] [CrossRef]
  40. Stern, D.I. Progress on the environmental Kuznets curve? Environ. Dev. Econ. 1998, 3, 173–196. [Google Scholar] [CrossRef]
  41. Cole, M.A.; Rayner, A.J.; Bates, J.M. The environmental Kuznets curve: An empirical analysis. Environ. Dev. Econ. 1997, 2, 401–416. [Google Scholar] [CrossRef]
  42. Solakoglu, E.G. The effect of property rights on the relationship between economic growth and pollution for transition economies. East. Europ. Econ. 2007, 45, 77–94. [Google Scholar] [CrossRef]
  43. Bakhsh, K.; Akmal, T.; Ahmad, T.; Abbas, Q. Investigating the nexus among sulfur dioxide emission, energy consumption, and economic growth: Empirical evidence from Pakistan. Environ. Sci. Pollut. Res. 2022, 29, 7214–7224. [Google Scholar] [CrossRef] [PubMed]
  44. Shikwambana, L.; Mhangara, P.; Kganyago, M. Assessing the relationship between economic growth and emissions levels in South Africa between 1994 and 2019. Sustainability 2021, 13, 2645. [Google Scholar] [CrossRef]
  45. Jiang, M.; Kim, E.; Woo, Y. The relationship between economic growth and air pollution—A regional comparison between China and South Korea. Int. J. Environ. Res. Public Health 2020, 17, 2761. [Google Scholar] [CrossRef] [PubMed]
  46. Xia, C.; Bing, Y. Strategic leadership, environmental optimisation, and regional innovation performance with the regional innovation system coupling synergy degree: Evidence from China. Technol. Anal. Strateg. Manag. 2022, 1–14. [Google Scholar] [CrossRef]
  47. Ke, H.; Dai, S.; Yu, H. Spatial effect of innovation efficiency on ecological footprint: City-level empirical evidence from China. Environ. Technol. Innov. 2021, I, 101536. [Google Scholar] [CrossRef]
  48. Meirun, T.; Mihardjo, L.W.W.; Haseeb, M.; Khan, S.A.R.; Jermsittiparsert, K. The dynamics effect of green technology innovation on economic growth and CO2 emission in Singapore: New evidence from bootstrap ARDL approach. Environ. Sci. Pollut. Res. 2021, 28, 4184–4194. [Google Scholar] [CrossRef]
  49. Brancalion, P.H.S.; van Melis, J. On the need for innovation in ecological restoration1. Ann. Mo. Bot. Gard. 2017, 102, 227–236. [Google Scholar] [CrossRef]
  50. Murphy, J.; Gouldson, A. Environmental policy and industrial innovation: Integrating environment and economy through ecological modernisation. Ecol. Mod. Read. 2020, 31, 275–294. [Google Scholar]
  51. Aribi, I.; Hassen, L.B. Phases of economic development in an endogenous growth model with innovation and education. Oradea J. Bus. Econ. 2021, 6, 78–87. [Google Scholar] [CrossRef]
  52. Wu, N.; Liu, Z.K. Higher education development, technological innovation and industrial structure upgrade. Technol. Forecast. Soc. Chang. 2021, 162, 120400. [Google Scholar] [CrossRef]
  53. Jogova, M.; Song, J.E.S.; Campbell, A.C.; Warbuton, D.; Warshawski, T.; Chanoine, J.-P. Process evaluation of the Living Green, Healthy and Thrifty (LiGHT) web-based child obesity management program: Combining health promotion with ecology and economy. Can. J. Diabetes 2013, 37, 72–81. [Google Scholar] [CrossRef] [PubMed]
  54. Pontzer, H.; Wood, B.M. Effects of evolution, ecology, and economy on human diet: Insights from hunter-gatherers and other small-scale societies. Annu. Rev. Nutr. 2021, 41, 363–385. [Google Scholar] [CrossRef]
  55. Sovacool, B.K. Who are the victims of low-carbon transitions? Towards a political ecology of climate change mitigation. Energy Res. Soc. Sci. 2021, 73, 101916. [Google Scholar] [CrossRef]
  56. Wang, R.; Tan, J. Exploring the coupling and forecasting of financial development, technological innovation, and economic growth. Technol. Forecast Soc. Chang. 2021, 163, 120466. [Google Scholar]
  57. Zhang, F.; Sarker, M.N.I.; Lv, Y. Coupling coordination of the regional economy, tourism industry, and the ecological environment: Evidence from western China. Sustainability 2022, 14, 1654. [Google Scholar] [CrossRef]
  58. Liu, Y.; Liu, W.; Yan, Y.; Liu, C. A perspective of ecological civilization: Research on the spatial coupling and coordination of the energy-economy-environment system in the Yangtze River Economic Belt. Environ. Monit. Assess. 2022, 194, 403. [Google Scholar] [CrossRef]
  59. Liu, J.; Tian, Y.; Huang, K.; Yi, T. Spatial-temporal differentiation of the coupling coordinated development of regional energy-economy-ecology system: A case study of the Yangtze River Economic Belt. Ecol. Indic. 2021, 124, 107394. [Google Scholar]
  60. Yan, X.; Chen, M.; Chen, M.Y. Coupling and coordination development of Australian energy, economy, and ecological environment systems from 2007 to 2016. Sustainability 2019, 11, 6568. [Google Scholar] [CrossRef] [Green Version]
  61. Zheng, Z.; Zhu, Y.; Qiu, F.; Wang, L. Coupling relationship among technological innovation, industrial transformation and environmental efficiency: A case study of the Huaihai Economic Zone, China. Chin. Geogr. Sci. 2022, 32, 686–706. [Google Scholar] [CrossRef]
  62. Xu, X.; Zhou, Y. Spatio-Temporal differentiation characteristics and determinants of coupling coordination degree in technological innovation-industrial upgrading-ecological environment system: A case study of Jiangsu Province, China. Pol. J. Environ. Stud. 2021, 30, 3341–3355. [Google Scholar] [CrossRef]
  63. Huang, J.; Wang, J.; Tian, G. Research on the coupling of technological innovation, talent accumulation and ecological environment. Ekoloji 2018, 27, 1735–1742. [Google Scholar]
  64. Yin, K.; Zhang, R.; Jin, X.; Yu, I. Research and optimization of the coupling and coordination of environmental regulation, technological innovation, and green development. Sustainability 2022, 14, 501. [Google Scholar] [CrossRef]
  65. Wu, D. Research on regional technology—Economy—Ecology coordination evaluation system in China. In 1st International Symposium on Innovative Management and Economics (ISIME 2021); Atlantis Press: Paris, France, 2021; pp. 108–120. [Google Scholar]
  66. Liu, Z.; Li, K.W.; Tang, J.; Gong, B.; Huang, J. Optimal operations of a closed-loop supply chain under a dual regulation. Int. J. Prod. Econ. 2021, 233, 107991. [Google Scholar] [CrossRef]
  67. Liu, Z.; Zheng, X.X.; Li, D.F.; Liao, C.N.; Sheu, J.B. A novel cooperative game-based method to coordinate a sustainable supply chain under psychological uncertainty in fairness concerns. Transp. Res. Part E Logist. Transp. Rev. 2021, 147, 102237. [Google Scholar] [CrossRef]
  68. Liu, C.; Gao, M.; Zhu, G.; Zhang, C.; Zhang, P.; Chen, J.; Cai, W. Data driven eco-efficiency evaluation and optimization in industrial production. Energy 2021, 224, 120170. [Google Scholar] [CrossRef]
  69. Yang, Y.; Wu, X.; Liu, F.; Zhang, Y.; Liu, C. Promoting the efficiency of scientific and technological innovation in regional industrial enterprises: Data-driven DEA-Malmquist evaluation model. J. Intell. Fuzzy Syst. 2022, 43, 4911–4928. [Google Scholar] [CrossRef]
  70. Li, J.; Fang, H.; Fang, S.; Siddika, S.E. Investigation of the relationship among university–research institute–industry innovations using a coupling coordination degree model. Sustainability 2018, 10, 1954. [Google Scholar] [CrossRef] [Green Version]
  71. Wang, M.; Zhao, X.; Gong, Q.; Ji, Z. Measurement of regional green economy sustainable development ability based on entropy weight-topsis-coupling coordination degree—A case study in Shandong Province, China. Sustainability 2019, 11, 280. [Google Scholar] [CrossRef] [Green Version]
  72. Dong, L.; Longwu, L.; Zhenbo, W.; Liangkan, C.; Faming, Z. Exploration of coupling effects in the economy–society–environment system in urban areas: Case study of the Yangtze River Delta urban agglomeration. Ecol. Indicat. 2021, 128, 107858. [Google Scholar] [CrossRef]
  73. Xing, L.; Xue, M.; Hu, M. Dynamic simulation and assessment of the coupling coordination degree of the economy–resource–environment system: Case of Wuhan City in China. J. Environ. Manag. 2019, 230, 474–487. [Google Scholar] [CrossRef] [PubMed]
  74. Sun, Y.; Zhao, T.; Xia, L. Spatial-temporal differentiation of carbon efficiency and coupling coordination degree of Chinese county territory and obstacles analysis. Sustain. Cities Soc. 2022, 76, 103429. [Google Scholar] [CrossRef]
  75. Song, Q.; Zhou, N.; Liu, T.; Siehr, S.A.; Qi, Y. Investigation of a “coupling model” of coordination between low-carbon development and urbanization in China. Energy Policy 2018, 121, 346–354. [Google Scholar] [CrossRef] [Green Version]
  76. Xiao, Y.; Wang, R.; Wang, F.; Huang, H.; Wang, J. Investigation on spatial and temporal variation of coupling coordination between socioeconomic and ecological environment: A case study of the Loess Plateau, China. Ecol. Indicat. 2022, 136, 108667. [Google Scholar] [CrossRef]
  77. Hou, C.; Chen, H.; Long, R. Coupling and coordination of China’s economy, ecological environment and health from a green production perspective. Int. J. Environ. Sci. Technol. 2022, 19, 4087–4106. [Google Scholar] [CrossRef]
  78. Pan, Y.; Weng, G.; Li, C.; Li, J. Coupling coordination and influencing factors among tourism carbon emission, tourism economic and tourism innovation. Int. J. Environ. Res. Public Health 2021, 18, 1601. [Google Scholar] [CrossRef]
  79. Li, Y.; Li, Y.; Zhou, Y.; Shi, Y.; Zhu, X. Investigation of a coupling model of coordination between urbanization and the environment. J. Environ. Manag. 2012, 98, 127–133. [Google Scholar] [CrossRef]
  80. Yang, Y.; Wang, Y.; Zhang, Y.; Liu, C. Data-driven coupling coordination development of regional innovation EROB composite system: An integrated model perspective. Mathematics 2022, 10, 2246. [Google Scholar] [CrossRef]
  81. Liu, C.; Zhang, R.; Wang, M.; Xu, J. Measurement and prediction of regional tourism sustainability: An analysis of the Yangtze River economic zone, China. Sustainability 2018, 10, 1321. [Google Scholar] [CrossRef] [Green Version]
  82. Lei, X.; Robin, Q.; Liu, Y. Evaluation of regional land use performance based on entropy TOPSIS model and diagnosis of its obstacle factors. Trans. Chin. Soc. Agric. Eng. 2016, 32, 243–253. [Google Scholar]
  83. Zhang, F.; Sun, C.; An, Y.; Luo, Y.; Yang, Q.; Su, W.; Gao, L. Coupling coordination and obstacle factors between tourism and the ecological environment in Chongqing, China: A multi-model comparison. Asia Pac. J. Tour. Res. 2021, 26, 811–828. [Google Scholar] [CrossRef]
  84. Çalışkan, H.K. Technological change and economic growth. Procedia Soc. Behav. Sci 2015, 195, 649–654. [Google Scholar] [CrossRef] [Green Version]
  85. Fang, Y. The impact of innovation efficiency factors on the level of regional economic development. Open J. Soc. Sci. 2020, 8, 343. [Google Scholar] [CrossRef] [Green Version]
  86. Leyden, D.P. Public-sector entrepreneurship and the creation of a sustainable innovative economy. Small Bus. Econ. 2016, 46, 553–564. [Google Scholar] [CrossRef]
  87. Wang, J.; Wang, C.; Yu, S.; Li, M.; Cheng, Y. Coupling coordination and spatiotemporal evolution between carbon emissions, industrial structure, and regional innovation of counties in Shandong Province. Sustainability 2022, 14, 7484. [Google Scholar] [CrossRef]
  88. Xu, L.; Zhao, X.; Chen, J. Exploring the governance dilemma of nuclear wastewater in Fukushima: A tripartite evolutionary game model. Ocean. Coast. Manag. 2022, 225, 106220. [Google Scholar] [CrossRef]
  89. Buesa, M.; Heijs, J.; Pellitero, M.M.; Baumert, T. Regional systems of innovation and the knowledge production function: The Spanish case. Technovation 2004, 26, 463–472. [Google Scholar] [CrossRef]
  90. Zhao, S.L.; Cacciolatti, L.; Lee, S.H.; Song, W. Regional collaborations and indigenous innovation capabilities in China: A multivariate method for the analysis of regional innovation systems. Technol. Forecast. Soc. Chang. 2015, 94, 202–220. [Google Scholar] [CrossRef] [Green Version]
  91. Efrat, K. The direct and indirect impact of culture on innovation. Technovation 2014, 34, 12–20. [Google Scholar] [CrossRef]
  92. Shan, D. Research of the construction of regional innovation capability evaluation system: Based on indicator analysis of Hangzhou and Ningbo. Procedia Eng. 2017, 174, 1244–1251. [Google Scholar] [CrossRef]
  93. Li, X. Empirical analysis on the change of China’s regional innovation capability: Based on the viewpoint of innovation system. Manage World 2007, 12, 18–22. [Google Scholar]
  94. Tonghui, D.; Junfei, C. Evaluation and obstacle factors of coordination development of regional water-energy-food-ecology system under green development: A case study of Yangtze River Economic Belt, China. Stoch. Environ. Res. Risk Assess. 2021, 1–17. [Google Scholar] [CrossRef]
  95. Polina, E.A.; Solovyeva, I.A. Methodology for comprehensive assessment of regional innovative development. R-Economy 2019, 5, 79–91. [Google Scholar] [CrossRef]
  96. Romer, P.M. Endogenous technological change. J. Political Econ. 1990, 5, S71–S102. [Google Scholar] [CrossRef] [Green Version]
  97. Sleuwaegen, L.; Boiardi, P. Creativity and regional innovation: Evidence from EU regions. Res. Policy 2014, 43, 1508–1522. [Google Scholar] [CrossRef]
  98. Xu, M.Y.; Chen, C.T.; Deng, X.Y. Systematic analysis of the coordination degree of China’s economy-ecological environment system and its influencing factor. Environ. Sci. Pollut. Res. 2019, 26, 29722–29735. [Google Scholar] [CrossRef]
  99. Lanchun, L.; Wei, C.; Kaimo, G.; Fang, Y.; Yun, T.; Ke, Z. Research on the evaluation system construction of county innovation driven development-based on evaluation and measurement model. In Artificial Intelligence in China; Liang, Q., Wang, W., Mu, J., Liu, X., Na, Z., Eds.; Springer: Singapore, 2022; pp. 218–225. [Google Scholar]
  100. Deng, M.; Chen, J.; Tao, F.; Zhu, J.; Wang, M. On the coupling and coordination development between environment and economy: A case study in the Yangtze River Delta of China. Int. J. Environ. Res. Public Health 2022, 19, 586. [Google Scholar] [CrossRef]
  101. Hu, X.; Xu, H. A new remote sensing indicator based on the pressure-state-response framework to assess regional ecological change. Environ. Sci. Pollut. Res. 2019, 26, 5381–5393. [Google Scholar] [CrossRef]
  102. Lai, S.; Sha, J.; Eladawy, A.; Li, X.; Wang, J.; Kurbanov, E.; Lin, Z.; Wu, L.; Han, R.; Su, Y.C. Evaluation of ecological security and ecological maintenance based on pressure-state-response (PSR) model, case study: Fuzhou city, China. Hum. Ecol. Risk Assess. 2022, 28, 734–761. [Google Scholar] [CrossRef]
  103. Shmelev, S.E.; Shmeleva, I.A. Global urban sustainability assessment: A multidimensional approach. Sustain. Dev. 2018, 26, 904–920. [Google Scholar] [CrossRef]
  104. Su, Y.; Liang, D.; Guo, W. Application of multiattribute decision-making for evaluating regional innovation capacity. Math. Probl. Eng. 2020, 2020, 1–20. [Google Scholar] [CrossRef]
  105. Xu, K.; Loh, L.; Chen, Q. Sustainable innovation governance: An analysis of regional innovation with a super efficiency slack-based measure model. Sustainability 2020, 12, 3008. [Google Scholar] [CrossRef] [Green Version]
  106. Neri, A.C.; Dupin, P.; Sanchez, L.E. A Pressure-State-Response Approach to Cumulative Impact Assessment. J. Clean. Prod. 2016, 126, 288–298. [Google Scholar] [CrossRef]
  107. Anhui Provincial Bureau of Statistics. Available online: http://tjj.ah.gov.cn/ssah/qwfbjd/tjnj/index.html (accessed on 10 December 2021).
  108. National Bureau of Statistics. Available online: http://www.stats.gov.cn (accessed on 10 December 2021).
  109. Guo, Y.; Ding, H. Coupled and coordinated development of the data-driven logistics industry and digital economy: A case study of Anhui Province. Processes 2022, 10, 2036. [Google Scholar] [CrossRef]
  110. Glavič, P.; Pintarič, Z.N.; Bogataj, M. Process design and sustainable development—A European perspective. Processes 2021, 9, 148. [Google Scholar] [CrossRef]
Figure 1. Method flow chart.
Processes 10 02268 g001
Figure 2. Classification types of the coordination degree.
Processes 10 02268 g002
Figure 3. Administrative area map of the study area.
Processes 10 02268 g003
Figure 4. Development level and synthetic developmental level of each subsystem in Anhui.
Processes 10 02268 g004
Figure 5. Spatial and temporal evolution of IEE coordination in Anhui Province.
Processes 10 02268 g005
Figure 6. Change trends of the obstacle degrees of the system and criterion layers.
Processes 10 02268 g006
Table 1. Indicator system for the coordination development of the regional IEE system.
System LayerCriteria LayerIndicator LayerDirection
A. Innovation subsystemA1 Innovation environment A11 Number of legal entities in cultural and related industries above designated size/unit+
A12 Number of public library institutions/unit+
A13 Public library collections per unit population/piece+
A14 Local financial expenditure on education/109 RMB+
A2 Innovation input A21 Internal expenditure of R&D funds/million RMB+
A22 Number of college students per 10,000 population/person+
A23 Full-time equivalent of R&D personnel/person year+
A24 R&D personnel input/person+
A3 Innovation output A31 Technology market turnover/million RMB+
A32 Number of registered scientific and technological achievements at or above the provincial or ministerial level/piece+
A33 Invention patent authorization/piece+
A34 Patent application authorization/piece+
B. Economic subsystemB1 Economic scale B11 GDP/10 9 RMB+
B12 Total retail sales of consumer goods/109 RMB+
B13 Total import and export trade/million USD+
B14 Total investment in fixed assets/million RMB+
B2 Economic quality B21 Per capita GDP/RMB+
B22 GDP energy intensity/tons of standard coal/million RMB
B23 Urban per capita disposable income/RMB+
B24 Whole-society productivity/RMB/person+
B3 Economic structure B31 Proportion of employees in the tertiary industry/%+
B32 Proportion of added value of the tertiary industry in GDP/%+
B33 Urbanization rate/%+
C. Ecological subsystem C1 Ecological basis C11 Percentage of forest cover/%+
C12 Urban per capita park green area/m2+
C13 Area of nature reserve/million hectares+
C14 Per capita water resources/m3/person+
C2 Ecological pressure C21 Industrial wastewater emissions/million tons
C22 Industrial sulfur dioxide emissions/million tons
C23 Industrial solid waste output/million tons
C24 Application amount of agricultural chemical fertilizer (converted amount)/million tons
C3 Ecological response C31 Green coverage rate of urban built-up area/%+
C32 Centralized sewage treatment rate/%+
C33 Comprehensive utilization rate of general industrial solid waste/%+
C34 Harmless treatment rate of urban domestic garbage/%+
Table 2. The indicator system weight for the coordinated development of the regional IEE system.
System LayerCriteria LayerWeightIndicator LayerWeight
A. Innovation subsystemA1 Innovation environment0.194A11 Number of legal entities in cultural and related industries above designated size/unit0.037
A12 Number of public library institutions/unit0.035
A13 Public library collections per unit population/piece0.069
A14 Local financial expenditure on education/109 RMB0.053
A2 Innovation input 0.444A21 Internal expenditure of R&D funds/million RMB0.076
A22 Number of college students per 10,000 population/person0.178
A23 Full-time equivalent of R&D personnel/person year0.103
A24 R&D personnel input/person0.088
A3 Innovation output0.362A31 Technology market turnover/million RMB0.105
A32 Number of registered scientific and technological achievements at or above the provincial or ministerial level/piece0.154
A33 Invention patent authorization/piece0.039
A34 Patent application authorization/piece0.064
B. Economic subsystemB1 Economic scale 0.357B11 GDP/109 RMB0.091
B12 Total retail sales of consumer goods/109 RMB0.105
B13 Total import and export trade/million USD0.098
B14 Total investment in fixed assets/million RMB0.063
B2 Economic quality 0.402B21 Per capita GDP/RMB0.091
B22 GDP energy intensity/tons of standard coal/million RMB0.111
B23 Urban per capita disposable income/RMB0.077
B24 Whole-society productivity/RMB/person0.123
B3 Economic structure 0.242B31 Proportion of employees in the tertiary industry/%0.115
B32 Proportion of added value of the tertiary industry in GDP/%0.054
B33 Urbanization rate/%0.073
C. Ecological subsystem C1 Ecological basis 0.409C11 Percentage of forest cover/%0.000
C12 Urban per capita park green area/m20.084
C13 Area of nature reserve/million hectares0.250
C14 Per capita water resources/m3/person0.075
C2 Ecological pressure 0.345C21 Industrial wastewater emissions/million tons0.086
C22 Industrial sulfur dioxide emissions/million tons0.086
C23 Industrial solid waste output/million tons0.067
C24 Application amount of agricultural chemical fertilizer (converted amount)/million tons0.106
C3 Ecological response 0.246C31 Green coverage rate of urban built-up area/%0.108
C32 Centralized sewage treatment rate/%0.070
C33 Comprehensive utilization rate of general industrial solid waste/%0.068
C34 Harmless treatment rate of urban domestic garbage/%0.000
Table 3. Anhui Province IEE coupling and coordination degree calculation results.
YearABCABACBC
YCDYCDYCDYCD
20140.0960.6500.2490.0730.5650.2030.0770.5520.2060.1371.0000.371
20150.1810.9820.4210.1690.9790.4070.1690.9790.4070.2041.0000.451
20160.2780.9490.5140.2190.9840.4640.2880.9270.5170.3270.9770.565
20170.3790.9560.6020.3120.9760.5520.3780.9350.5950.4460.9890.664
20180.4830.9910.6920.4470.9940.6670.4780.9870.6860.5250.9980.724
20190.6861.0000.8280.6741.0000.8210.6971.0000.8350.6870.9990.828
20200.9250.9980.9610.9470.9990.9730.9390.9980.9680.8881.0000.942
Table 4. Computed results of the obstacle degree of regional IEE in Anhui Province.
Year2014201520162017201820192020
A17.075.815.214.303.844.251.08
A216.2216.2218.4919.5221.7617.620.00
A313.1013.1614.1516.7113.0811.650.00
B112.5112.6313.2311.569.945.410.00
B210.6111.6313.1414.2115.3220.0545.15
B38.828.157.937.527.3610.250.46
C113.9614.1512.7816.5718.788.280.00
C29.9411.367.636.287.3812.2112.88
C37.776.907.433.332.5510.3040.42
A36.3935.1937.8540.5338.6833.511.08
B31.9432.4034.3033.2932.6135.7045.62
C31.6632.4127.8526.1728.7130.7953.31
Table 5. Main obstacles to coordinated IEE development in Anhui Province.
YearIndicator Rankings
12345
FactorObstacle DegreeFactorObstacle DegreeFactorObstacle DegreeFactorObstacle DegreeFactorObstacle Degree
2014C139.13A226.48A325.50B244.49B314.19
2015C139.70A226.15A326.08B244.50C314.34
2016C1310.71A227.85A326.95B245.08B314.52
2017C1312.45A229.32A328.16B245.30B314.68
2018C1315.21A2211.33B226.34A325.92B245.63
2019B2211.64A2210.36B318.13C147.86C337.19
2020B2245.15C3121.18C3319.25C2312.88A111.08
Publisher’s Note: MDPI stays neutral with regard to jurisdictional claims in published maps and institutional affiliations.

