Article

Coupled and Coordinated Development of the Data-Driven Logistics Industry and Digital Economy: A Case Study of Anhui Province

1
Business School, Suzhou University, Suzhou 234000, China
2
Department of Center for International Education, Philippine Christian University, Manila 1004, Philippines
*
Author to whom correspondence should be addressed.
Processes 2022, 10(10), 2036; https://doi.org/10.3390/pr10102036
Submission received: 10 September 2022 / Revised: 4 October 2022 / Accepted: 5 October 2022 / Published: 9 October 2022
(This article belongs to the Special Issue Sustainable Supply Chains in Industrial Engineering and Management)

Abstract

:
The digital transformation of the logistics industry is the current trend of development. In order to promote the integrated development of the logistics industry (LI) and the digital economy (DE), we propose a data-driven method which can be used to measure, evaluate, and identify the coupled and coordinated development (CCD) of the LI and DE. On the basis of data collection, we use the entropy weight method to measure the comprehensive development level of the LI and DE. A coordination model is then used to evaluate their CCD level. Finally, an obstacle degree model (ODM) is used to identify the key factors inhibiting the coordinated development (CD) of the two. This method is then applied to gauge the integration development of the LI and DE in Anhui Province. The results show that energy consumption and the lack of logistics employees are the main obstacles to the development of the LI in Anhui Province. The main obstacles to the development of the DE are the low development level of the electronic communications equipment manufacturing industry and the limited digitization of enterprises. Accordingly, this study puts forward corresponding countermeasures and suggestions to provide decision support for the CCD of the LI and DE.

1. Introduction

With the advancement of economic globalization and the rise of the network economy, the logistics industry (LI) has achieved unprecedented development. This industry assumes a significant part of promoting the flow of industrial factors, optimizing regional resource allocation, and improving production and operational efficiency [1]. It is the “link” connecting production, circulation, distribution, and consumption in large-scale socialized production [2]. During the prevention and control period of the global COVID-19 pandemic, the logistics industry applied digital technologies such as big data, the Internet of Things, and block chain. These technologies have helped the industry to match supply and demand more quickly and accurately, which has helped to maintain normal economic and social development. In addition, the world has entered the era of the digital economy (DE), which has a profound impact on world economic development and human life. A white paper on the global digital economy published by the China Academy of Information Technology in 2022 points out that, in 2021, the added value of the DE in 47 major countries in the world reached USD 38.1 trillion, of which, China’s digital economy reached USD 7.1 trillion [3]. The DE is a new engine for promoting the optimization of the whole industrial chain and a key force in changing the global competitive pattern. It integrates with traditional industries, promotes the upgrading and transformation of traditional industries, and provides a sustainable driving force for economic development [4]. With the improvement of the DE, the logistics industry has gradually become intelligent and networked, achieving digital transformation and upgrading, more accurately meeting supply and demand, reducing costs, and increasing efficiency [5,6]. The digital transformation of the LI is conducive to the development of industrial digitization in the DE and it provides production factors for the development of the digital economy industry. The interaction and coordinated development (CD) of the LI and DE are conducive to the integration, transformation, and upgrading of regional industries, helping to achieve efficient and sustainable industrial development [7]. This is also the key to promoting the high-quality development of regional economies [8]. Therefore, exploring the coupling and coordinated development (CCD) of the LI and DE, and identifying obstacle factors, has become the focus of academic circles and government departments.
First, the research on the improvement of the LI and DE is rich in content and diversity in perspective. Scholars have studied the ecological efficiency [9], carbon emission efficiency [10], green logistics [11,12], and sustainable development [13] of the logistics industry. Under this new situation, the logistics industry cannot achieve high-quality sustainable development without applying information technology [14]. The application of digital technology helps improve the efficiency of the LI and promotes the progress of green logistics [15]. As early as 1996, Tapscott [16] proposed the concept of the DE, and Carlsson [17] emphasized that the DE is a new business form based on the Internet that uses data and information technology to change the production, business, and social activities of various industries [18,19]. Intelligent logistics is the product of the deep integration of the LI and DE [20]. By integrating technologies such as the Internet of Things, the LI has achieved leapfrog development in terms of its service and management modes [21], laying a foundation for industrial transformation and upgrading and high-quality development.
Second, research has centered around the CD between the LI and DE as the LI and DE are two complex industrial systems [7,21]. The coupling coordination degree model (CCDM) can be used to measure the mutual promotion and interaction degree between two or more systems [22]. This method has been widely used in logistics, economics, agriculture, manufacturing, and other fields, achieving fruitful results [23]. For example, research has been conducted on the coupling and coordination of the LI and regional economy [24,25], urbanization and agricultural ecology [26], logistics industry and agriculture [27], innovative development and economy [28], and logistics industry and manufacturing industry [29]. There are also studies on the CD of the three systems, such as the logistics industry, economy, and ecological environment [30] and the economy, society, and environment [31,32]. However, research on the integration and CD of the LI using the coupling and coordination model rarely involves coupling and coordination with the DE.
Finally, another branch of the literature researches the logistics industry and the construction of the digital economy index system. There are numerous factors involved in the LI and DE, and the existing literature constructs an index system from different angles to measure these factors. From the perspective of sustainable development, these studies examine the economic basis, scale benefit, innovation capacity, environmental effect, and social responsibility of the LI [13]. Other studies construct indicator systems based on the sustainable development of industrial logistics [33]. For instance, Lan et al. constructed a metropolitan logistics index system from the total fixed asset investment in logistics, civilian truck holdings, number of logistics employees, total length of postal routes, and other factors [25]. Furthermore, other scholars measure it from the perspective of input-output [7]. At present, there is no unified indicator system for measuring the digital economy. Liu et al. measured the Internet penetration rate, number of employees, Internet-related output, and development of digital inclusive finance [34], while Liao et al. constructed indicators from three dimensions: the digital economic infrastructure index, digital economic development index, and digital economic innovation index [8]. In contrast, Wei et al. constructed indicators from four aspects: digital industrialization, industrial digitization, digital governance, and data value [35]. Some scholars have added GDP indicators, believing the DE has integrated into social life [36].
Research by international scholars on the logistics industry and digital economy gives a significant reference for exploring the coupling and coordination relationship between the regional logistics industry and the digital economy. However, there are still some deficiencies, i.e., scholars have studied the relationship between the logistics industry and the digital economy, but only considered the impact of digitalization on freight logistics [6] or the interaction between the two [7], and the impact of the application of digital technology on Imperial Retail Logistics Efficiency [14]. However, research on the coupling and coordination of the two systems needs to be deepened as several shortcomings remain:
  • Scholars have researched the relationship between the LI and DE, but most of them only consider the influence of the application of digital technology on the industrial upgrading of the LI in the context of the DE. Therefore, the research on their coupling coordination needs to be deepened.
  • The LI and DE are two complex industrial systems, involving multi-dimensional indicators, multi-source factors, and multiple dimensions. Therefore, there is an urgent need to identify how to accurately measure and evaluate the two industrial systems to promote their coordinated and sustainable development.
  • There are many factors that affect the CD of the LI and DE. Therefore, it is necessary to scientifically distinguish the pivotal obstacle factors to give a quantitative basis for putting forward policy recommendations to support the development of the LI and DE.
In order to remedy these difficulties, this paper uses the research ideas of Lan [25,37,38,39] for reference. This research is more systematic and comprehensive than the existing research [7,8,33,34] in terms of index system construction. To begin, we construct a logistics industry system by comprehensively considering the facilities’ input, energy consumption, business volume output, and carbon and exhaust emissions of the LI. In addition, an indicator system of the DE should be constructed by comprehensively considering the infrastructure construction of the DE, digital industry, and industrial digitalization, as well as innovative development. We propose a data-driven method which can be used to measure, evaluate and identify the CCD of the LI and DE. This method is then applied to Anhui Province to verify its effectiveness. Anhui Province has obvious regional advantages and is located in the middle of China. The digital development of logistics is directly related to the high-quality industrial development of adjacent regions. We then put forward targeted countermeasures and suggestions according to the evaluation and identification results. This method is conducive to providing a quantitative basis for policy recommendations and aims to provide decision support for relevant practitioners and decision makers in the logistics and digital economy industries.
The structure of this paper is as follows: Section 2 contains the materials and methods, which introduces the data collection and processing, data model, and application. Section 3 is a case study, taking Anhui Province of China as an example, to measure, evaluate, and identify the CCD of the LI and DE system. Section 4 is the discussion and, finally, Section 5 is the conclusion.

2. Materials and Methods

2.1. Study Area

We take the development of the LI and DE in Anhui Province in the Yangtze River Delta as an example. Anhui Province is located in the middle of China, in the hinterland of the Yangtze River Delta, near the sea and adjacent to rivers, with obvious geographical advantages. The strength of Anhui’s LI is directly related to the industrial integration and development of adjacent regions. The application of digital technology is profitable to promote the transformation of the LI from an extensive traditional mode to an intelligent mode, and it is conducive to meeting the region’s economic and social development needs more efficiently. The two bring about sustainable development in the process of continuous action and together promote the high-quality development of the regional economy. According to 2021 statistics released by the Anhui Provincial Bureau of Statistics in March 2022, the added value of transportation, storage, and postal services in 2021 was 205.69 billion yuan, an increase of 8.2%. The annual cargo transportation volume was 4.01 billion tons, an increase of 7.2% over the previous year. The turnover of cargo transportation was 1102.39 billion tons/kilometer, an increase of 8%. The added value of information transmission, software, and information technology services was 96.4 billion yuan, an increase of 10.6%. The operating income of other for-profit service industries, represented by emerging industries such as Internet information technology and business services, increased by 18.4% [40].
Although the two major industries exhibit stronger development over the previous year, they are also facing challenges such as industrial integration and uncoordinated development. Based on the research on the interaction and influence between the LI and DE in Anhui Province, this paper puts forward suggestions to promote the CCD of the LI and DE in Anhui Province, which is of great significance to promoting the high-quality development of industrial integration in Anhui Province.

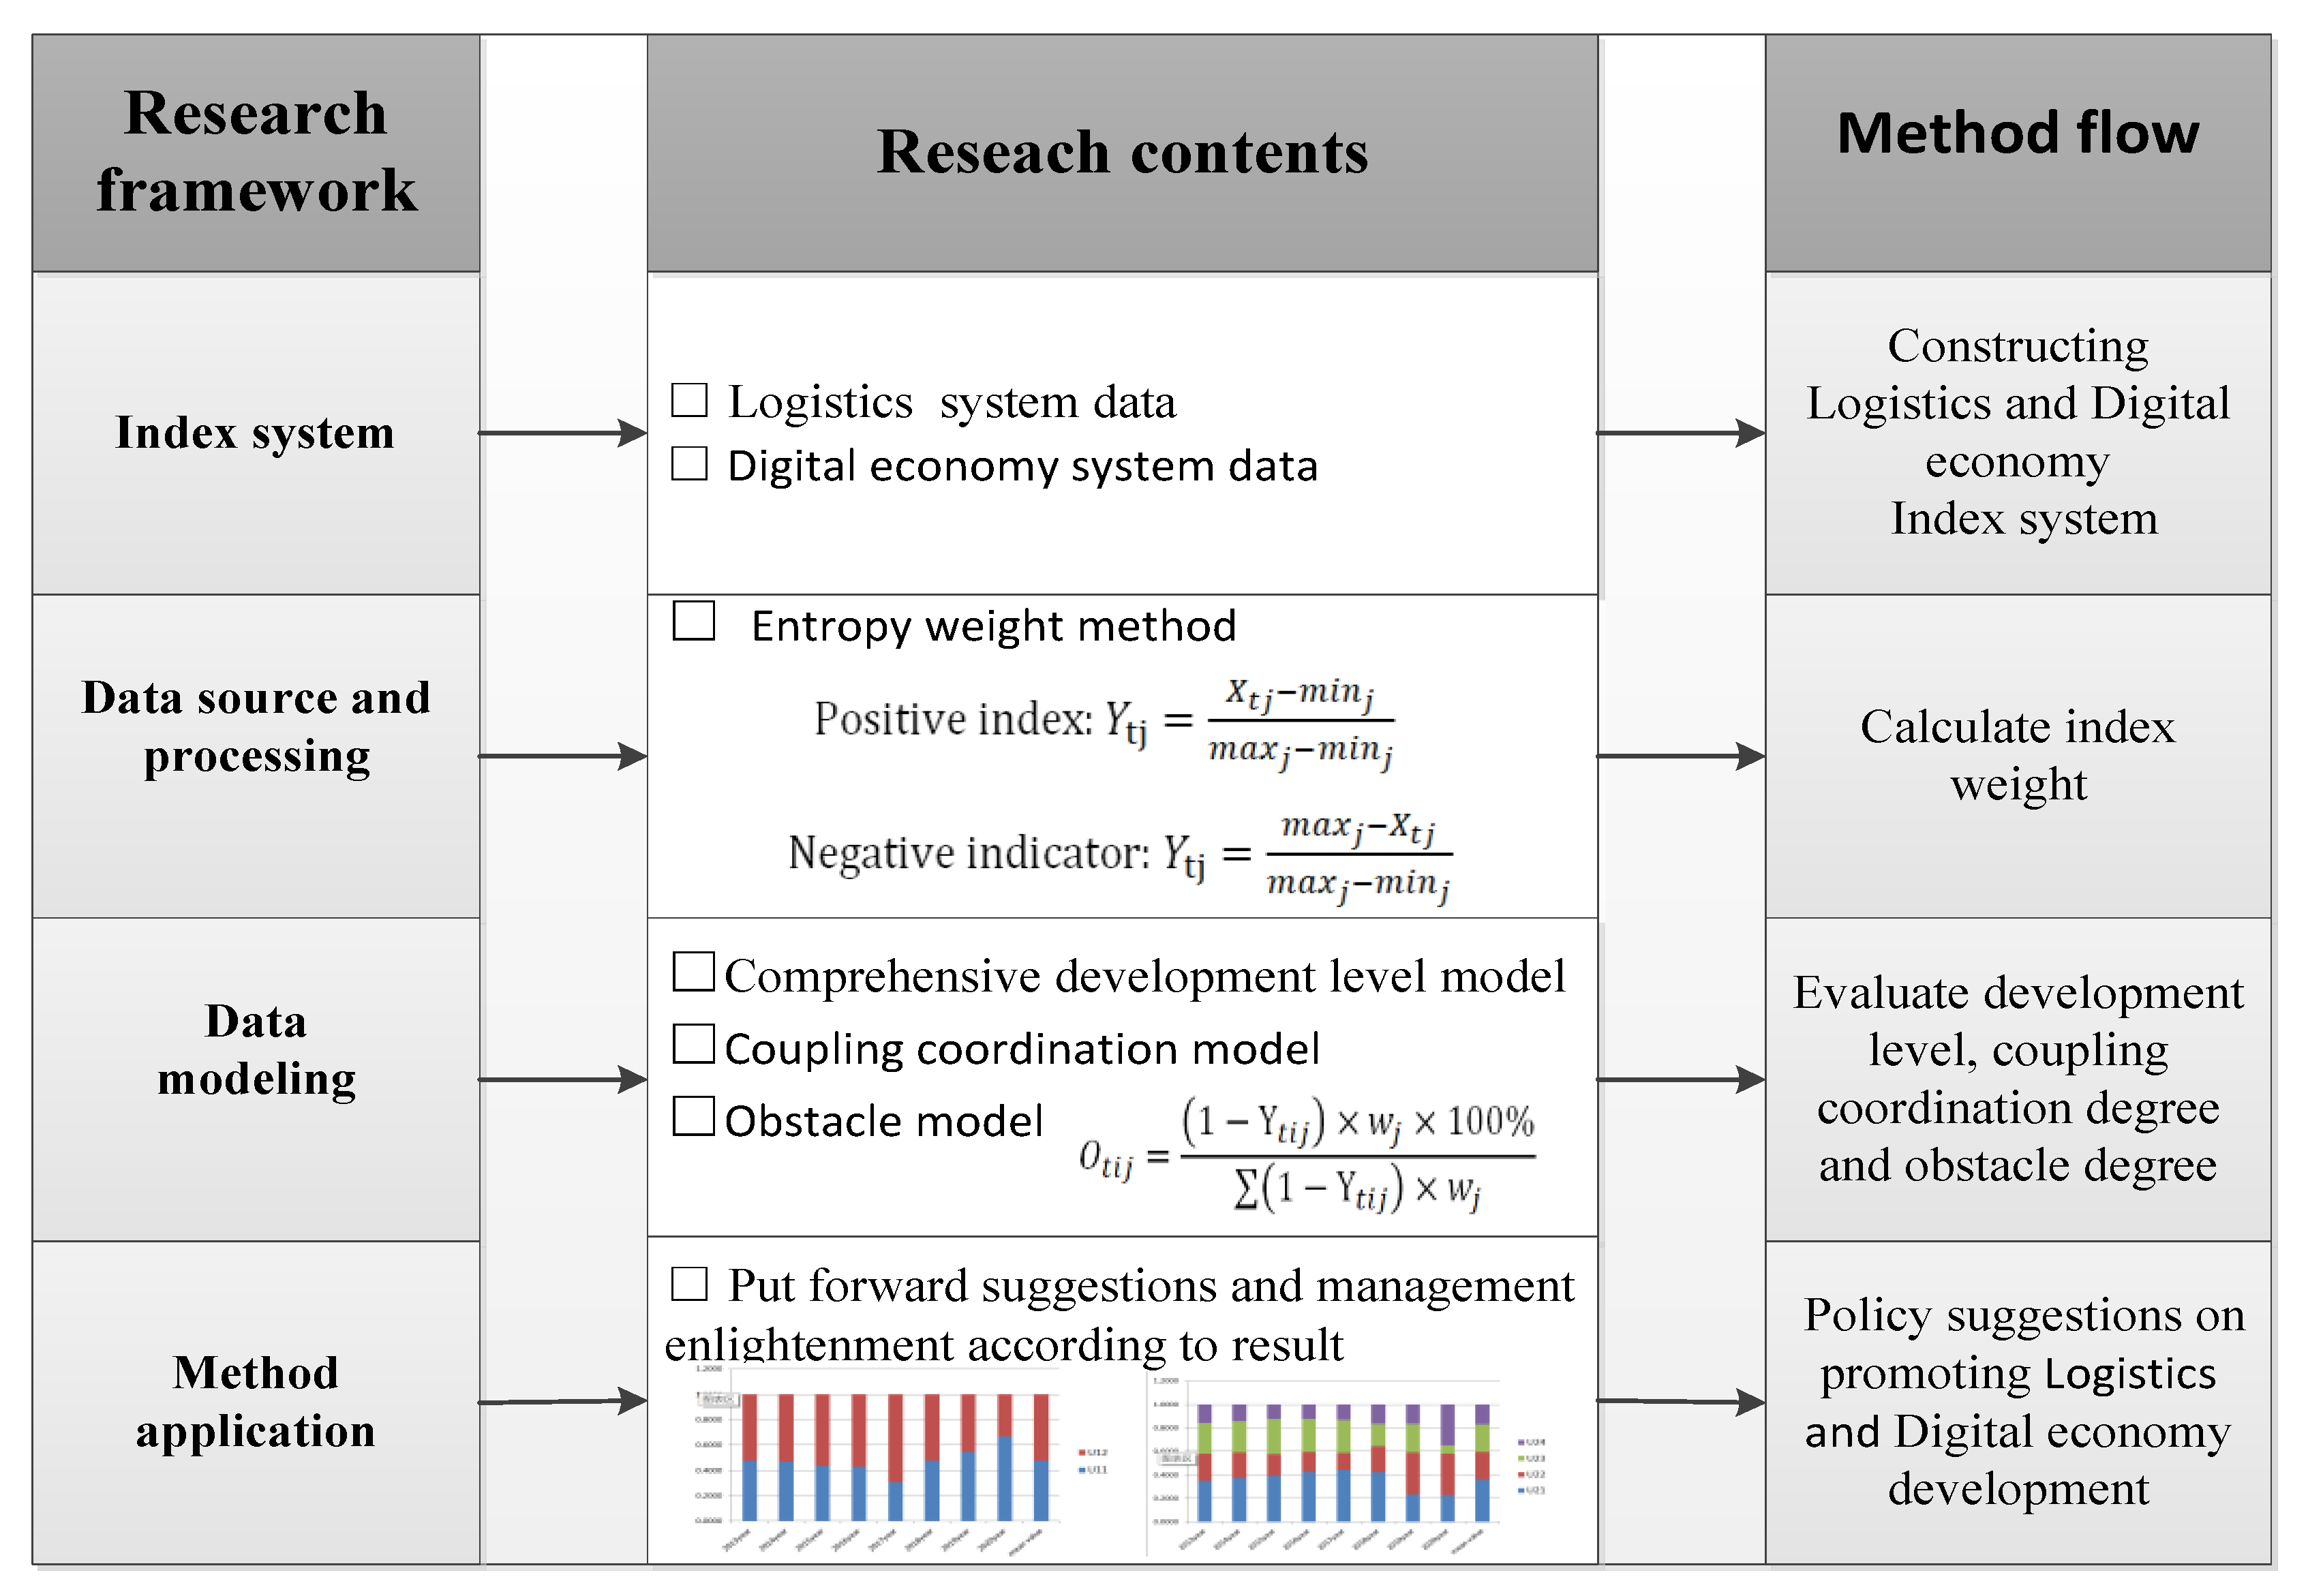
2.2. Research Framework

To improve the sustainable development level of the LI and DE, the digital transformation of the LI must be realized to better promote industrial integration and accelerate high-quality economic development. The data-driven method is proposed which is mainly embodies putting forward policy recommendations through data collection, processing, modeling, application, and other links, centering on the data of regional LI and DE development. In the face of complex regional LI and DE systems and multiple data sources, this method should be used to overcome the challenges of comprehensive and scientific indicator systems, objective data model processing, and effective policy recommendations. This method involves data collection, processing, modeling, and application to establish a coupled co-scheduling and obstacle degree model. Through this model, the degree of CD is evaluated, and the factors inhibiting the CD are identified. Compared with existing research methods [24,25,29], this method can provide a quantitative basis for policy quality. The method flow is shown in Figure 1:
When the research object involves two or more systems that interact and influence each other, and there are many data sources, multiple dimensions, and more influencing factors, the method flow in Figure 2 can be used. However, the digital transformation of the LI is conducive to achieving cost reduction and increased efficiency, better serving related industries and accelerating the pace of industrial digital transformation. The development of the DE promotes the digitalization of the LI and requires the LI to optimize the allocation of resources for its development. The two complex systems interact and develop together. The specific data application process is shown in Figure 2:
First, we collect data related to the development of the regional LI and DE to establish a database. Based on the principles of data systematization, objective rationality, scientificity, accessibility, and measurability, a development index system for the regional LI and DE is constructed. The index consists of six first-class indicators and 33 second-class indicators. Because the data are multi-source and include a wide range of information, the range method is used to make the data dimensionless.
Next, we use the entropy weight method to calculate the comprehensive development level of the LI and DE. The CCDM is then used to evaluate the CCD of the LI and DE system. The key obstacles to the CD of the regional LI and DE are identified through the obstacle degree model (ODM).
Finally, based on the quantitative research results, policy suggestions are put forward to provide a decision-making basis for relevant practitioners and managers to promote the coordinated and sustainable development of regional logistics industries and the digital economy.

2.3. Index System

Based on the research results regarding the development of the logistics industry [13,33] and digital economy [15,16,17,18,19,34,35,36], this study selects indicators that are scientific and quantifiable. From this, the index system, which includes six systems and 33 indicators, is constructed. This index is used to conduct comparative research on the CCD between systems.
The LI system indicators are constructed from the perspective of input-output. Compared with the indicators in previous studies [7,13,25], this study adds energy consumption and power consumption to the input indicators, reflecting the energy input in addition to infrastructure and talent. Correspondingly, carbon emissions and exhaust emissions are added to the output indicators. In addition to considering positive output, the negative output is also included, making the indicator system more comprehensive. Moreover, the index system for the digital economy comprehensively integrates the existing research [34,35,36]; that is, it comprehensively considers infrastructure, digital industry, digital innovation, and industrial digital level (see Table 1).

2.4. Data Source and Processing

Following Sun et al. [41], we combine the energy carbon emission coefficient and energy consumption given in “the 2006 IPCC guidelines for national greenhouse gas “inventories. The exhaust gas emission is the sum of the emissions of SO2, NOx, PM2.5, and PM10 by the LI in Anhui Province from 2013 to 2020. According to the primary energy consumption of the LI in the energy balance sheet of Anhui Province, the emission coefficient is calculated using the emission coefficient method. The emission coefficient is determined by referring to the EPA, AP-42, and Beijing emission coefficient [41,42] and combining the actual development of the LI in Anhui Province.
In this study, data on Anhui Province from 2013 to 2020 are taken as the statistical sample. The data on the regional logistics industry and the digital economy system are from the China Statistical Yearbook, China Internet development report, Anhui statistical yearbook, and China Energy Yearbook in the corresponding years. For some indicators, 2020 data are unavailable, therefore, we adopted the missing value processing method to complete the dataset [43].
We adopted the entropy weight method to weigh each index [44] in order to improve the accuracy of the results and avoid deviation of subjective weight. The specific calculation steps to prepare for measuring the comprehensive development level of the LI and DE are as follows:
First, the range standardization method is used to standardize the original logistics industry and digital economic data. Different algorithms are adopted for positive and negative indicators with different meanings. The specific calculation formulas are as follows:
Positive   index :   Y tj = X t j m i n j m a x j m i n j
Negative   indicator :   Y tj = m a x j X t j m a x j m i n j ,
where X tj and Y tj represent the values before and after the dimensionless standardization of the j-th index data (t = 1,2,3,…, n; j = 1,2,3,…, m) of the logistics industry or the digital economy subsystem in the t year, respectively. To eliminate 0 and 1 after standardization, here, m a x j represents 1.01 times the maximum value in the j-th index data of the logistics industry or the digital economic system during the study period. m i n j represents 0.99 times the minimum value in the j-th index data of the logistics industry or the digital economic system during the study period. That is to say, m a x j = 1.01 m a x X t j ;   m i n j = 0.99 m i n X t j .
The j-th index Y t j   of   the specific gravity of P i j is then calculated, as shown in Equation (3):
P t j = Y t j Y t j
Next, the information entropy,   e j , of index j is calculated, as shown in Equation (4):
e j = k P t j ln P t j ,
where, k > 0 , k = ( 1 ln n ) , n refers to the year, e j 0 .
Then, the information entropy redundancy g j , of index j is calculated, as shown in Equation (5):
g j = 1 e j
Finally, the weight, w j , of indicator j is calculated, as shown in Equation (6):
w j = g j / g j
The entropy weight method is used to give weights to the indicators of each system objectively to prepare for the next calculation of the complete and thorough development level of the LI and DE system each year.

2.5. Data Model

2.5.1. Comprehensive Development Level Model

The complete and thorough development level of the regional LI and DE is calculated using the multi-objective linear weighting method. The specific calculation Equation (7) is as follows:
F i = j = 1 m w j Y tj
The higher the value of F i , the higher the complete and thorough development level of the regional LI or DE.

2.5.2. Coupling Degree and CCDM

The concept of coupling originated from physics and refers to the phenomenon that two or more systems or motion forms affect each other through various interactions [37]. The coupling degree refers to the degree of mutual influence between systems or elements. The degree of interaction between the LI and DE, through their respective coupling elements, is defined as the degree of coupling between the LI and DE. Its magnitude indicates the degree of interaction between the two subsystems. Based on the above measurement of the complete and thorough development level of the regional LI and DE, we calculate the coupling degree of the regional LI and DE. The specific model is shown in Equation (8):
C = 2 U 1 U 2 2 U 1 + U 2
where, U 1 is the comprehensive level of the regional LI subsystem and U2 is the comprehensive development level of the DE. C refers to the coupling degree between the regional LI and DE, and the value range is 0 to 1. The higher the value of C, the stronger the relationship between the regional LI and DE and the closer to orderly development. The smaller the value of C, the closer the two systems are to disordered development.
However, when the complete and thorough development degree of the regional LI and DE is relatively low and close, that is, when the development level of the two subsystems is not high, the coupling degree of the calculation is high. Therefore, to accurately reflect the interactive development level of the LI and DE, it is necessary to further build a CCMD. The CCDM is then used to evaluate the CCD of the regional LI and DE. For details, see Equations (9) and (10):
D = C × T
T = α U i + β U i
In Equations (9) and (10), C is the coupling degree, and T is the comprehensive evaluation index used to reflect the overall level of the regional LI and DE. α, β is the specific weight of the two systems, which mainly measures the contribution of the LI and DE, of which, α + β = 1. Based on the current situation of global economic development, the importance of the LI and DE to social and economic development is the same. As such, the weights are equal and the value is α = β = 1/2. D is the coupled co-scheduling of the LI and DE, and the value is within {0,1}. The higher the value of D, the more coordinated the development levels of the LI and DE, and the closer the mutual promotion and coordination. The lower the value of D, the worse their coordination, and the weaker their mutual influence and coordination.
According to the calculated coupling degree and coupling co-scheduling and referring to existing relevant studies [26,37], the coordination status of the regional LI and DE is divided into the following levels (Table 2).

2.5.3. The ODM

To further identify the improvement direction of the CD of the regional LI and DE system, we need to identify specific influencing factors. The ODM is adopted to clarify the obstacle factors. The specific calculation steps are as follows:
O t i j = ( 1 Y t i j ) × w j × 100 % ( 1 Y t i j ) × w j
O t i = O i j
In Equation (12), O t i j is the obstacle degree of the j-th secondary index in the first index i of the LI or the DE system to the internal coupling and coordination of regional the LI or the DE. O t i represents the obstacle degree of the i-th level I index in year t. Y t i j represents the standardized value of the j-th secondary index among the i-th primary index in the t-th year; 1 Y t i j represents the deviation degree of the index; and w j is the weight of the j-th index.

3. Results

3.1. Comprehensive Development Level

Based on the collected raw data for the LI and DE in Anhui Province, this study calculates the weight of each index of the logistics industry and digital economy system according to Equation (1) through (6), and calculates the comprehensive development level of the logistics industry and digital economy using Equation (7). The results are shown in Figure 3.
Figure 3 shows that from 2013 to 2020, the development input (U11), output (U12), and comprehensive development level (U1) of the LI show a fluctuating growth trend; it also shows, from 2013 to 2020, the four first-level indicators of the DE system, i.e., digital infrastructure (U21), digital industry (U22), digital scientific and technological innovation (U23), industrial digitization (U24), and the comprehensive development level (U2), show a trend of continuous growth. From the perspective of the progress level of the LI subsystem, the comprehensive progress level declined in 2014 and 2015. At this stage, the LI was heavily taxed, which increased the cost of logistics, and the development of the LI was affected to a certain extent. From 2016 to 2020, there was an overall upward trend. The development of high-end technology in this stage opened up new space and provided new development opportunities for the LI, and the LI entered the stage of transformation and upgrading. In 2017, the input level of the LI was much higher than the output level, which is related to the 13th Five Year Plan of Anhui Province to increase the development of the LI. In 2018, the output level of the LI exceeded the input level, and by 2020, the output level reached 0.4313. This shows that the output efficiency of the logistics industry in Anhui Province has gradually improved. The application of new technologies such as big data and the Internet of Things in this period has made effective use of resource inputs. This improvement also reflects the increased demand for the LI in the global economy and network economy.
The overall comprehensive development level of the DE subsystem shows an upward trend. Although there are fluctuations in the level of the four first-level indicators: digital infrastructure (U21), digital industry (U22), digital scientific and technological innovation (U23), and industrial digitization (U24), the overall trend is still upward. Among these indicators, the digital infrastructure (U21) and the industrial digital level (U24) grew rapidly. Notably, the digital infrastructure construction level reached 0.3231 in 2020. This is inseparable from the implementation of national policies, increased digital infrastructure investment, and the strengthening of digital transformation and development of traditional industries in Anhui Province. However, the development level of the digital industry (U22) and digital technology innovation (U23) in Anhui Province was lower than that of digital infrastructure (U21) and industrial digitization (U24) in 2018 and beyond. This may have been affected by the global pandemic that occurred during this period, affecting the normal operation of innovative production inputs in relevant industries.
From the perspective of the development level of the LI system (U1) and the digital economy system (U2), the comprehensive development level of the logistics industry reached the highest level in 2020 (0.3981), while the development level of the DE reached a high of 0.2610. Therefore, the development level of the LI and DE in Anhui Province needs to be improved.

3.2. The Result of CCD

Data on the Anhui LI and DE are brought into the calculations of CD and CCD in Equation (8) through (10) to obtain the CD (C), comprehensive evaluation index (T), and coupling co-scheduling (D) of the Anhui logistics industry and digital economy system (Figure 4).
It can be observed in Figure 4 that the coupling degree (C) of LI in Anhui Province has been close to 1 since 2015, and reached a high of 0.9907 in 2017. However, the time-coupled co-scheduling (D) is 0.5163, not the highest. It should be noted that the development level of LI and DE in 2017 was low, and both need to be improved to increase their coordinated development level. The complete and thorough development index (T) and coupled co-scheduling (D) of the LI and DE in Anhui Province increased year by year from 2013 to 2020. This shows that the logistics industry and digital economy in Anhui Province are developing well, but the highest levels are no more than 0.7 and 0.8, respectively, so they still need to be strengthened.
According to the data in Figure 4, combined with the calculation results U1 and U2 of the complete and thorough development level, we can see the coupling and coordination type distribution between the logistics industry and the digital economic system in Anhui Province, as shown in Figure 5.
From Figure 5, combined with the level division in Table 2, we can note that the coupling degree between the LI and DE in Anhui Province was 0.2755 in 2013. This indicates a low-level coupling stage, and from this point, the LI and DE gradually formed a coupling. At this time, the logistics industry in Anhui Province had developed to a certain extent, while the digital economy had just started. From the above figure, it can be seen that U1 > U2 and the coupled co-scheduling (D) is 0.1753, which is a serious imbalance as the digital economy lags behind. After 2014, the CD between the LI and DE in Anhui Province is greater than 0.8, and even tends to 1 in the later stage, which indicates a highly coupled stage in which the two promote each other’s orderly development. However, the level of coupled co-scheduling (D) at this stage is not high. In 2017, the coupling degree was as high as 0.9907, which is the highest in the study year. However, the coupled co-scheduling (D) was only 0.5163, which indicates a barely coordinated stage. Moreover, U1 > U2 showing that the digital economy lags slightly. Even though the D value reaches the highest level of 0.7985 in 2020, the coordination level is intermediate, U1 > U2 still exists, and the digital economy lags slightly.
To sum up, the CCD between the LI and DE systems in Anhui Province needs to be improved. The overall situation feature is “high coupling and low coordination”. While promoting the respective development of the logistics industry and the digital economy, special attention should be paid to the CD of the LI and DE.

3.3. The Result of ODM

According to the ODM, Equations (11) and (12), the coupling and coordination barrier factors of the LI and DE in Anhui Province are calculated. As shown in Figure 6, the distribution of the barrier degree of the first-level indicators (U11-U24) of the LI and DE system in Anhui Province is as follows:
From Figure 6, we see the average U11 of the first level indicators of the LI in Anhui Province is slightly lower than U12. In 2017, the U12 of the LI in Anhui Province was higher. At that time, the social and economic development had higher requirements in terms of the service efficiency of the LI. By 2020, with the application of the Internet of Things, cloud computing, and other emerging technologies, the output efficiency of the LI was greatly improved. The barrier factor at this time is U11. From the perspective of the DE system of Anhui Province, the average ranking of the first-level indicators is U21 > U23 > U22 > U24. The main obstacle to the development of the DE is U21. However, increasing attention has been paid to the construction of a digital economic infrastructure after China proposed to increase the development of the DE. The DE foundation U21 < U22 in 2019 to 2020 is no longer the main obstacle. By 2020, the barrier degree of the first-level indicators of digital economic development is U22 > U24 > U21 > U23; therefore, U22 is the main obstacle factor.
In addition, to analyze the obstacle factors affecting the CCD of the LI and DE system in Anhui Province, we sort the obstacles of the third-level indicators according to the data in 2020, as shown in Figure 7:
Figure 7 shows the distribution of the obstacle degree for each secondary index. First, in the LI subsystem, the barrier degree of the LI development input (U11) is greater than the barrier degree of the LI development output (U12). Among the secondary indicators of the logistics subsystem, x15 > x16 > x13 > x111 > x18 > x112 are the foremost obstacles. Among the indicators of the LI development investment (U11), energy consumption (x15), power consumption (x16), and the number of employees in the LI (x13) are the foremost development obstacles. This is mainly because the development of the LI in Anhui Province is facing problems such as high resource consumption and lack of logistics talent. For example, the total energy consumption of the LI in 2020 increased by 24.17% compared with that in 2013. The total power consumption of the LI in 2020 is about 2.41 times that of 2013. The number of employees in the LI decreased by 29,000 in 2020 compared with 2019. The key obstacles in the development output (U12) index of the LI are carbon dioxide emission (x111), freight volume (x18), and exhaust gas emission (x112). This shows that environmental pollution remains a major obstacle to the development of the LI and low-carbon emissions reduction is urgently needed. In addition, in 2020, the freight volume of Anhui Province was seriously affected by the COVID-19 pandemic.
Second, we can also see from Figure 7 that the barrier degree of the first-class indicators in the DE system of Anhui Province in 2020 is U22 > U24 > U21 > U23. The main obstacles for the secondary indicators in the DE system are: x218 > x211 > X25 > x28 > x220 > x23 > X212 > x216. In industrial digitization (U24), the number of websites owned by every 100 enterprises (x218) is the main obstacle factor, followed by the number of e-commerce enterprises (x220). This indicates the digitization level of enterprises in Anhui Province is still deficient. According to the statistical yearbook of Anhui Province in 2020, the number of websites owned by every 100 enterprises (x218) and the number of e-commerce enterprises (x220) decreased by 5% and 7.7%, respectively, compared with 2019. In the digital industry (U22), the total profit (x211) and total business volume (x28) of the computer, communication, and electronic equipment manufacturing industry are the main obstacles to development. In particular, the total profit of the computer, communication, and electronic equipment manufacturing industry (x211) is the main obstacle factor. According to the data in 2020, the index data decreased by 4.7% compared with that in 2019. On the one hand, the computer and electronic equipment manufacturing industry in Anhui Province needs further development; on the other hand, it has been substantially affected by the COVID-19 pandemic, which has caused great losses to the development of the manufacturing industry. In the digital infrastructure (U21), the number of web pages per capita (X25) is the most important obstacle factor, and it is also necessary to pay attention to the improvement of the mobile phone penetration rate (x23) per 100 people. Anhui is a populous province, and the number of web pages per capita needs to be further improved. In addition, although U23 ranks the lowest among the first-class indicators, attention should also be paid to the improvement of the number of employees in the scientific research and technical service industry (x212) and the proportion of the output value of the scientific research and technical service industry in GDP (x216).

4. Discussion

4.1. Policy Suggestions

The results of the CCD of the LI and DE in Anhui Province from 2013 to 2020 are this: the overall development level shows an upward trend. The development level of the LI system in Anhui Province is semi-U-shaped, and the development level of the DE is low, but it is growing rapidly. The LI and DE in Anhui Province show the feature of “high coupling and low coordination”. The coordination degree needs to be further improved, and the development of the DE lags behind. The results of the obstacle degree calculation show that the main obstacles are the high energy consumption and power consumption of the LI as well as the urgent need for logistics talent. In addition, the development of the logistics industry also brings environmental pollution problems, such as carbon dioxide and exhaust gas emissions. Therefore, the following policy suggestions are put forward for the CD of the logistics industry and digital economy in Anhui Province:
  • Improve the comprehensive development level of the LI and DE in Anhui Province. CCD requires a high level of subsystem development to promote a high level of overall progress. In 2020, the overall development level of the LI in Anhui Province reached its highest level of 0.3981, and the overall development level of the DE reached its highest level of 0.2610. We can see that, although it reached the highest level in 2020, the comprehensive development level remains very low, and the development of the DE lags behind the development of the LI. Anhui Province should strengthen the development of its LI and DE, focus on the development of the DE because of its low starting point, and lay a foundation for the CD of the two at a higher level.
  • Promote the CD of the LI and DE in Anhui Province. From 2013 to 2020, the coupling degree between the LI and DE in Anhui Province was high, and from 2014 to 2020, it was almost 1. The LI and DE are developing in an orderly manner, but the CD of the two is low. In 2020, the highest level of coordinated dispatching was 0.7985, which is only at the intermediate coordination level. Moreover, the development of the digital economy lags behind, and there is still much room for progress. The world is seizing the opportunity of digital economic development to realize the digital transformation and development of traditional industries and win competitive advantages. Anhui Province should closely follow the pace of the times, strengthen the CD of the LI and DE, promote the digital transformation of the LI, and further realize the high-quality economic development of Anhui Province.
  • Overcome the obstacles to the CD of the LI and DE in Anhui Province. In 2020, the total energy consumption of the LI increased by 24.17% compared with 2013, and the number of logistics employees decreased by 29,000 compared with 2019. Efforts should be made to improve the output efficiency of the LI in Anhui Province, reduce energy consumption, reduce carbon dioxide and exhaust gas emissions, and realize the sustainable development of green logistics. Efforts should also be made to strengthen the education of high-level logistics practitioners to provide a talent guarantee for the development of the LI. In 2020, digital industrialization and industrial digitization were the main obstacles (U22 > U24 > U21 > U23). It is necessary to strengthen the application of new generation information technologies such as the Internet of Things, big data, and cloud computing. It is also necessary to promote the digital transformation of the logistics industry and help to increase the development level of industrial digitization in the digital economy. The development of the computer, communication, and electronic equipment manufacturing industry should be strengthened to win core competitiveness and promote the development of the digital industry. Finally, we should implement national policies and measures to promote the development of the logistics industry and digital economy, and we should increase investment in infrastructure construction.

4.2. Management Enlightenment

Compared with the existing literature [7,21,27,28,29,30,31,32,33,34,35], the following advantages and contributions are given: first, a more comprehensive evaluation index system for the CCD of regional LI and DE is established. The indicator system includes indicators reflecting the development input and output level of the LI, and it includes four subsystems reflecting the development level of the DE: digital infrastructure, digital industry, digital scientific and technological innovation, and industrial digitization, which are more systematic and scientific than indicators in previous studies. Second, using a data-driven method [39], we can more objectively and scientifically measure, evaluate, and identify the CCD level of the regional LI and DE so as to better serve relevant decision makers. Finally, the study puts forward some suggestions to promote the CD of the province’s logistics industry and digital economy. Promoting the CCD of the LI and DE has important practical significance for sustainable and high-quality development. To sum up, some management implications are drawn:
(1)
In order to achieve cost reduction, increase efficiency, and the high-quality development of LI, we should strengthen the digital transformation of the operation process of logistics and realize digital and intelligent development. The efficient development of the logistics industry has provided support for the development of the DE and is conducive to the development of digital industries such as information and communication equipment and infrastructure. Give full play to the interaction and interdependence of the two subsystems, which can effectively promote the sustainable development of industrial integration, and then promote the development of the regional economy.
(2)
With the deep integration of the development of modern information technology and the LI, the mutual influence, interaction, and development of various factors between them can be clarified, which can more accurately formulate relevant countermeasures and better serve the decision-making of local governments and local related enterprises.
(3)
The digital transformation of traditional industries is an essential a an adjustment facing the world. The LI lays a solid foundation for the integrated development of industry and the matching of resource supply and demand, ensuring sustained social and economic development. Realizing the digital transformation of the LI is conducive to accelerating the pace of industrial digitalization, which is crucial to promote the high-quality development of the regional economy. The CCD of the LI and DE should make a profound study.

5. Conclusions

Considering the acceleration of the global DE and the promotion of the digital transformation of traditional industries, we have entered a critical period for the LI. Logistics, as the leading and most basic component of economic development, is of great importance for realizing digital transformation. Promoting the CCD of the regional LI and DE is an inevitable requirement to promote the digital transformation of the regional logistics industry. This study is valuable in theory and practice. From the perspective of theoretical value, first, the evaluation index system of CCD for the LI and DE is constructed [45]. It takes into account the energy consumption, power consumption, and carbon dioxide and exhaust gas emissions of the logistics industry. In addition, it reflects the development level of the digital economy through four first-order dimension indicators. The implication of an integrated development index system for logistics and related industries is enriched. Second, a CCD model for the LI and DE is constructed. Because the model is based on development data for the logistics industry and digital economy, it provides a more scientific and objective way to quantitatively evaluate the CCD of the two. Third, through the correlation model, the factors that restrict the CCD of the logistics industry and the DE are identified. This provides a quantitative basis for the targeted design of policies for the development of the regional LI and DE. In terms of practical value, first, the research results can be used by managers of regional LI and DE-related enterprises to consider problems and make decisions from a quantitative perspective. Second, the findings provide direction for local governments to accurately form a planning strategy that promotes the development of the LI and DE. Third, new ideas for researchers focused on LI and DE are provided.
This paper evaluates and analyzes the CCD between the LI and DE and summarizes some rules and conclusions. However, due to the limitations of the current level of knowledge and objective conditions, there are still areas that need to be further improved in the research: first, in terms of the indicator system, the CCD of the LI and DE involves multiple indicator dimensions and multi-dimensional data, and the comprehensiveness of the indicator system needs to be further improved. Secondly, in terms of data collection and processing, due to the lack of data in 2021, future research should focus on timeliness. Finally, can the DE reduce the carbon emissions of the logistics industry? If so, how? These are the focus of future research.

Author Contributions

Conceptualization, Y.G. and H.D.; methodology, Y.G. and H.D. validation, H.D. and Y.G.; formal analysis, Y.G.; investigation, Y.G. and H.D.; resources, H.D.; data curation, Y.G.; writing—original draft preparation, Y.G.; writing—review and editing, Y.G. and H.D.; visualization, H.D. and Y.G.; supervision, Y.G. and H.D.; project administration, Y.G.; funding acquisition, Y.G. All authors have read and agreed to the published version of the manuscript.

Funding

This research is supported by the Major Project of Humanities and Social Sciences Research in Anhui Universities (NO.SK2021ZD0092), Anhui social science innovation and development research project (NO.2020CX093), the non-financial fund scientific research project of Suzhou University (NO.2022xhx149; NO.2022xhx150), and the Natural Science Foundation of Anhui Province (NO.2108085mg235).

Institutional Review Board Statement

Not applicable.

Informed Consent Statement

Not applicable.

Data Availability Statement

Not applicable.

Conflicts of Interest

The authors declare no conflict of interest.

References

  1. Li, M.; Wang, J. The productivity effects of two-way FDI in China’s logistics industry based on system GMM and GWR model. J. Ambient Intell. Human. Comput. 2021, 5, 1–5. [Google Scholar] [CrossRef]
  2. Huang, Q.; Ling, J. Measuring embodied carbon dioxide of the logistics industry in China: Based on industry stripping method and input-output model. Environ. Sci. Pollut. Res. 2021, 28, 52780–52797. [Google Scholar] [CrossRef]
  3. China Information and Communication Research Institute. White Paper on Global Digital Economy; China Academy of Communications: Beijing, China, 2022. [Google Scholar]
  4. Xu, G.; Lu, T.; Liu, Y. Symmetric Reciprocal Symbiosis Mode of China’s Digital Economy and Real Economy Based on the Logistic Model. Symmetry 2021, 13, 1136. [Google Scholar] [CrossRef]
  5. Popkova, E.G.; Sergi, B.S. A Digital Economy to Develop Policy Related to Transport and Logistics. Predictive Lessons from Russia. Land Use Policy 2020, 12, 105083. [Google Scholar] [CrossRef]
  6. Zhou, Z.; Wan, X. Does the Sharing Economy Technology Disrupt Incumbents? Exploring the Influences of Mobile Digital Freight Matching Platforms on Road Freight Logistics Firms. Prod. Oper. Manag. 2022, 31, 117–137. [Google Scholar] [CrossRef]
  7. Guo, Y.; Mao, H.; Ding, H.; Wu, X.; Liu, Y.; Liu, H.; Zhou, S. Data-Driven Coordinated Development of the Digital Economy and Logistics Industry. Sustainability 2022, 14, 8963. [Google Scholar] [CrossRef]
  8. Liao, X.; Yang, Z. Effect Measurement and Realization Path of Transformation and Upgrading of Digital Economy Enabling Manufacturing Industry in the Yangtze River Delta. East China Econ. Manag. 2021, 35, 22–30. [Google Scholar] [CrossRef]
  9. Zheng, W.; Wang, J.; Mao, X.; Li, J. Ecological Efficiency Evaluation and Spatiotemporal Characteristics Analysis of the Linkage Development of the Logistics Industry and Manufacturing Industry. Front. Energy Res. 2022, 9, 709582. [Google Scholar] [CrossRef]
  10. Yi, J.; Zhang, Y.; Liao, K. Regional Differential Decomposition and Formation Mechanism of Dynamic Carbon Emission Efficiency of China’s Logistics Industry. Int. J. Environ. Res. Public Health 2021, 18, 13121. [Google Scholar] [CrossRef] [PubMed]
  11. Yao, X.; Cheng, Y.; Zhou, L.; Song, M. Green efficiency performance analysis of the logistics industry in China: Based on a kind of machine learning methods. Ann. Oper. Res. 2022, 1, 727–752. [Google Scholar] [CrossRef]
  12. Qin, W.; Qi, X. Evaluation of Green Logistics Efficiency in Northwest China. Sustainability 2022, 14, 6848. [Google Scholar] [CrossRef]
  13. Ding, H.; Liu, Y.; Zhang, Y.; Wang, S.; Guo, Y.; Zhou, S.; Liu, C. Data-driven evaluation and optimization of the sustainable development of the logistics industry: Case study of the Yangtze River Delta in China. Environ. Sci. Pollut. Res. 2022, 5, 68815–68829. [Google Scholar] [CrossRef]
  14. Klumpp, M.; Loske, D. Sustainability and Resilience Revisited: Impact of Information Technology Disruptions on Empirical Retail Logistics Efficiency. Sustainability 2021, 13, 5650. [Google Scholar] [CrossRef]
  15. Li, J.; Wang, Q. Impact of the Digital Economy on the Carbon Emissions of China’s Logistics Industry. Sustainability 2022, 14, 8641. [Google Scholar] [CrossRef]
  16. Tapscott, D. The Digital Economy: Promise and Peril in the Age of Networked Intelligence; McGraw Hill: New York, NY, USA, 1996. [Google Scholar]
  17. Carlsson, B. The Digital Economy: What is new and what is not? Struct. Change Econ. D 2004, 15, 245–264. [Google Scholar] [CrossRef]
  18. Pan, W.R.; Xie, T.; Wang, Z.W.; Ma, L.S. Digital economy: An innovation driver for total factor productivity. J. Bus. Res. 2022, 139, 303–311. [Google Scholar] [CrossRef]
  19. Sidorov, A.; Senchenko, P. Regional Digital Economy: Assessment of Development Levels. Mathematics 2020, 8, 2143. [Google Scholar] [CrossRef]
  20. D’Amico, G.; Szopik-Depczyńska, K.; Dembińska, I.; Ioppolo, G. Smart and sustainable logistics of Port cities: A framework for comprehending enabling factors, domainsand goals. Sustain. Cities Soc. 2021, 69, 102801. [Google Scholar] [CrossRef]
  21. Gan, W.; Yao, W.; Huang, S.; Liu, Y. A Study on the Coupled and Coordinated Development of the Logistics Industry, Digitalization, and Ecological Civilization in Chinese Regions. Sustainability 2022, 14, 6390. [Google Scholar] [CrossRef]
  22. Bai, L.B.; Chen, H.L.; Gao, Q.; Luo, W. Project portfolio selection based on synergy degree of composite system. Soft Comput. 2018, 22, 5535–5545. [Google Scholar] [CrossRef]
  23. Shi, T.; Yang, S.Y.; Zhang, W.; Zhou, Q. Coupling coordination degree measurement and spatiotemporal heterogeneity between economic development and ecological environment—Empirical evidence from tropical and subtropical regions of China. J. Clean. Prod. 2020, 244, 118739. [Google Scholar] [CrossRef]
  24. Lan, S.L.; Zhong, R.Y. Coordinated development between metropolitan economy and logistics for sustainability. Resour. Conserv. Recycl. 2018, 128, 345–354. [Google Scholar] [CrossRef]
  25. Lan, S.; Tseng, M.L. Coordinated Development of Metropolitan Logistics and Economy Toward Sustainability. Comput. Econ. 2018, 52, 1113–1138. [Google Scholar] [CrossRef]
  26. Cai, J.; Li, X.P.; Liu, L.J.; Chen, Y.Z.; Wang, X.W.; Lu, S.H. CCD of new urbanization and agro-ecological environment in China. Sci. Total Environ. 2021, 776, 145837. [Google Scholar] [CrossRef]
  27. Shu, H.; Hu, Y. Research on Cooperative Development of Agricultural Logistics Ecosphere Based on Composite System Coupling. J. Stat. Inf. 2020, 35, 62–71. Available online: https://kns.cnki.net/kcms/detail/detail.aspx?FileName=TJLT202012007&DbName=CJFQ2020 (accessed on 10 December 2020).
  28. Chen, Y.; Zhang, D.N. Multiscale assessment of the coupling coordination between innovation and economic development in resource-based cities: A case study of Northeast China. J. Clean. Prod. 2021, 318, 128597. [Google Scholar] [CrossRef]
  29. Su, J.; Shen, T.; Jin, S. Ecological efficiency evaluation and driving factor analysis of the coupling coordination of the logistics industry and manufacturing industry. Environ. Sci. Pollut. Res. 2022, 9, 62458–62474. [Google Scholar] [CrossRef] [PubMed]
  30. Zhang, W.; Zhang, X.; Zhang, M.; Li, W. How to Coordinate Economic, Logistics and Ecological Environment? Evidences from 30 Provinces and Cities in China. Sustainability 2020, 12, 1058. [Google Scholar] [CrossRef] [Green Version]
  31. Dong, L.; Longwu, L.; Zhenbo, W.; Liangkan, C.; Faming, Z. Exploration of coupling effects in the Economy-Society-Environment system in urban areas: Case study of the Yangtze River Delta Urban Agglomeration. Ecol. Indic. 2021, 128, 107858. [Google Scholar] [CrossRef]
  32. Xu, M.X.; Hu, W.Q. A research on coordination between economy, society and environment in China: A case study of Jiangsu. J. Cleaner Prod. 2020, 258, 120641. [Google Scholar] [CrossRef]
  33. Li, S. Study on the sustainable development evaluation of logistics enterprise for industry manufacturing based on data envelopment analysis. Appl. Mech. Mater. 2013, 345, 380–383. [Google Scholar] [CrossRef]
  34. Liu, W.; Wang, Y. Effect and Mechanism of Digital Economy Empowering Urban Green and High-quality Development. South China J. Econ. 2022, 8, 73–91. [Google Scholar] [CrossRef]
  35. Wei, L.; Hou, Y. Research on the Impact of China’s Digital Economy on Urban Green Development. J. Quant. Tech. Econ. 2022, 39, 60–79. [Google Scholar] [CrossRef]
  36. Brynjolfsson, E.; Collis, A. How Should We Measure the Digital Economy? Harv. Bus. Rev. 2019, 6, 140–150. [Google Scholar]
  37. Ariken, M.; Zhang, F.; Liu, K.; Fang, C.L.; Kung, H.T. Coupling coordination analysis of urbanization and eco-environment in Yanqi Basin based on multi-source remote sensing data. Ecol. Indic. 2020, 114, 106331. [Google Scholar] [CrossRef]
  38. Cheng, X.; Long, R.Y.; Chen, H.; Li, Q.W. Coupling coordination degree and spatial dynamic evolution of a regional green competitiveness system—A case study from China. Ecol. Indic. 2019, 104, 489–500. [Google Scholar] [CrossRef]
  39. Liu, C.; Gao, M.; Zhu, G.; Zhang, C.; Zhang, P.; Chen, J.; Cai, W. Data driven eco-efficiency evaluation and optimization in industrial production. Energy 2021, 224, 120170. [Google Scholar] [CrossRef]
  40. Anhui Provincial Bureau of Statistics. Anhui Statistical Yearbook. 2021. Available online: http://tjj.ah.gov.cn/ssah/qwfbjd/tjnj/index.html (accessed on 10 April 2022).
  41. Sun, H.; Hu, X.; Nie, F. Spatio-temporal evolution and socio-economic drivers of primary air pollutants from energy consumption in the Yangtze River Delta. China Environ. Manag. 2019, 11, 71–78. [Google Scholar] [CrossRef]
  42. Li, L.; Lei, Y.; Wu, S.; Huang, Z.; Luo, J.; Wang, Y.; Chen, J.; Yan, D. Evaluation of future energy consumption on PM2.5 emissions and public health economic loss in Beijing. J. Clean. Prod. 2018, 187, 1115–1128. [Google Scholar] [CrossRef]
  43. Jiang, Y.; Lan, T.; Wu, L. A Comparison Study of Missing Value Processing Methods in Time Series Data Mining. In Proceedings of the IEEE International Conference on Computational Intelligence & Software Engineering, Wuhan, China, 11–13 December 2009; p. 12. [Google Scholar] [CrossRef]
  44. Ren, F.; Yu, X. Coupling analysis of urbanization and ecological total factor energy efficiency—A case study from Hebei province in China. Sustain. Cities Soc. 2021, 74, 103183. [Google Scholar] [CrossRef]
  45. Yang, Y.; Wang, Y.; Zhang, Y.; Liu, C. Data-Driven Coupling Coordination Development of Regional Innovation EROB Composite System: An Integrated Model Perspective. Mathematics 2022, 10, 2246. [Google Scholar] [CrossRef]
Figure 1. Method flow chart.
Processes 10 02036 g001
Figure 2. Data application diagram.
Processes 10 02036 g002
Figure 3. The comprehensive development level of Anhui Province’s LI and DE.
Processes 10 02036 g003
Figure 4. C, T, and D values of Anhui Province’s LI and DE.
Processes 10 02036 g004
Figure 5. Coupling coordination type of the LI and DE in Anhui Province.
Processes 10 02036 g005
Figure 6. Results of obstacle degree of Anhui Province’s LI and DE.
Processes 10 02036 g006
Figure 7. Ranked obstacle factors of Anhui Province’s logistics industry and digital economy.
Processes 10 02036 g007
Table 1. Index system of the CCD of the LI and DE system.
SystemPrimary IndexSecondary IndexSymbolDirection
Logistics system
U1
Logistics
industry input
U11
Mileage of roads, railways, and waterways (km) x 1   1 +
Fixed asset investment in the LI (RMB 100 mm) x 1   2 +
Number of employees in the LI (10,000 people) x 1   3 +
Postal and rural delivery routes (10,000 km) x 1   4 +
Energy consumption of the LI (10,000 tons of standard coal) x 1   5
Power consumption of the LI (100 million kWh) x 1   6
Logistics
industry
output
U12
Cargo turnover (100 million tons/km) x 17 +
Freight volume (10,000 tons) x 1   8 +
Output value of the LI (RMB 100 mm) x 1   9 +
Total amount of post and telecommunications business (RMB 10,000) x 1   10 +
CO2 emission of the LI (10,000 tons) x 1   11
Exhaust gas emissions of the LI (10,000 tons) x 1   12
Digital economy system
U2
Digital
infrastructure
U21
Internet penetration rate (%) x 21 +
Total telecom business (RMB 100 mm) x 22 +
Mobile phone penetration rate (department/100 people) x 23 +
Number of domain names per capita (PCs) x 24 +
Number of pages per capita (PCs) x 25 +
Digital
industry
U22
Proportion of software business income to GDP (%) x 26 +
Proportion of income from software technology service industry in GDP (%) x 27 +
Proportion of operating income of computer electronic communication manufacturing industry in GDP (%) x 28 +
Fixed assets investment in the information service industry (RMB 100 mm) x 29 +
Number of employees in the software technology service industry (10,000 people) x 2   10 +
Total profit of computer electronic communication manufacturing industry (RMB 100 mm) x 2   11   +
Digital
innovation
U23
Employment in scientific research service industry (10,000 people) x 2   12 +
Research expenditure (RMB 100 mm) x 2   13 +
Total number of employees with bachelor’s degree or above (people) x 2   14 +
Number of patent applications per 10,000 people (PCS/10,000 people) x 2   15 +
Proportion of output value of scientific research service industry in GDP (%) x 2   16 +
Industrial digitization
U24
Number of computers used by enterprises per 100 people (sets) x 2   17 +
Number of websites per 100 enterprises (PCS) x 2   18 +
E-commerce sales (RMB 100 mm) x 2   19 +
Number of e-commerce enterprises x 2   20 +
E-commerce purchase amount (RMB 100 mm) x 2   21 +
Table 2. The classification of CD and CCD.
CCoupling StageCoupling DescriptionDCoordination LevelU1 > U2U1 < U2
(0.0, 0.3)Low-level couplingGradually formed coupling(0.0, 0.1)Extreme disorderDigital economy lagLogistics lag
(0.1, 0.2)Severe disorderDigital economy lagLogistics lag
(0.2, 0.3)Moderate disorderDigital economy lagLogistics lag
(0.3, 0.5)AntagonismDevelopment to a certain extent(0.3, 0.4)Mild disorderDigital economy lagLogistics lag
(0.4, 0.5)Near disorderDigital economy lagLogistics lag
(0.5, 0.6)Reluctantly coordinateDigital economy lagLogistics lag
(0.5, 0.8)Run inGood coupling development(0.6, 0.7)Primary coordinationDigital economy lagLogistics lag
(0.7, 0.8)Intermediate coordinationDigital economy lagLogistics lag
(0.8, 1.0)High-level couplingPromotes mutual development(0.8, 0.9)Good coordinationDigital economy lagLogistics lag
(0.9, 1.0)Highly coordinatedDigital economy lagLogistics lag
Publisher’s Note: MDPI stays neutral with regard to jurisdictional claims in published maps and institutional affiliations.

