Abstract
The catalyst’s photocatalytic activity under sunlight was tested using graphene oxide (GO) from plant cellulose waste and modified by ZnO nanomaterial. The absorbance of the dye’s solution (Rhodamine 6G) was recorded as λmax = 555 nm at regular time intervals. The degradation kinetics of rhodamine was evaluated by applying first-order integrated rate expression, kt = −ln (C/C0). The half-life (t1/2), the rate constant (k), and the time constant τ (Tau) have been obtained by the above rate expression. The rate constant of the reactions carried out with the different materials was calculated and the values obtained were: k_ZnO =1.574 × 10⁻², k_GO =1.01 × 10⁻² and k_C-GO-ZnO = 4.7 × 10⁻³ min−1. The degradation efficiency presented by GO, ZnO and GO-ZnO catalysts was 66.67, 70.84, and 70.07%, respectively. FTIR spectroscopy was used to investigate the interactions between the catalyst and the dye. To the best of our knowledge, waste-derived GO-ZnO has not been previously reported for the photocatalytic degradation of Rhodamine 6G.
1. Introduction
The production of dyes is a major contributor to the contamination of water streams that may be used to provide humans with potable water [1]. Some of the most common dyes used in industry are rhodamine 6G and rhodamine B, especially for paper, plastic printing and textile manufacturing [2,3,4]. Disposal of these organic dyes in the environment poses a serious threat to the biota; therefore, it is important to always consider the pretreatment of industrial wastewater streams prevenient from the dyes industry [5,6,7]. The development of advanced materials tends to unleash great opportunities for removing the organic and inorganic pollutants from wastewater and can be considered during the secondary and tertiary stages of water treatment plants designed to meet drinking water standards [8,9,10]. Due to some positive features, such as for example, high stability and strong oxidization tendency, modified graphene oxide (GO) with zinc oxide (ZnO) can be applied as a photocatalyst in the process of remediation of dyes [11,12]. ZnO itself acts as a very efficient catalyst under UV radiation for different dyes [12]. The electron mobility in ZnO is quite high and the bandgap is 3.37 eV [13]. The conduction band edge is identical to the TiO2 conduction band [14]. According to several evaluations, ZnO’s photocatalytic efficiency is adequate due to the rapid recombination of electron-hole pairs [15]. Recently, the well-known carbon-based material graphene has been recognized as a good alternative for improving photocatalytic efficiency [16,17]. Due to their excellent surface area, electrical, thermal, and mechanical strength, and lightweight, bioinspired materials (such as GO) have received a lot of attention [18]. The unique position of hydroxyl and carboxyl groups in the 2D molecular structure of GO presents a better choice for catalysis [19]. Peter et al. [20] used ZnO/GO as a photocatalyst to investigate the efficiency of photocatalysis of some organic dyes under visible light. Pd-immobilized polyurethane microspheres were used as a catalyst for dye degradation [21]. In the aforementioned studies, commercial graphite was used to prepare the composite of graphite-based ZnO nanocomposite. Graphene/metal oxide nanocomposites with improved photocatalytic performance for water purification have previously been discussed [22,23]. In this work, biomass-based GO synthesis was performed by applying the green approach to Hummer’s method. Local Malaysian palm oil tree cellulosic material was used to prepare the GO, whereas the ZnO nanoparticles (NPs) were synthesized. Natural orange peel extract was used as a reducing agent for the ZnO NPs synthesis. The extract of orange peel includes flavonoids and phenolic groups which act as reducing agents to reduce the metal ions [24]. Therefore, an environmentally benign approach was applied to prepare a heterogeneous catalyst to degrade the rhodamine 6G dye. To understand the photocatalytic efficiency, a comparative outlook has been presented from the kinetic study of the photocatalysts ZnO, GO and GO-ZnO.
2. Experimental
2.1. Materials
Orange (Citrus sinensis) was purchased from a residential supermarket (TESCO) Geulgor Penang, Malaysia. Sulfuric acid (85%), hydrochloric acid (HCl) (30%), hydrogen peroxide (H2O2) 35%, zinc sulfate (ZnSO4), sodium hydroxide (NaOH), sodium nitrate (NaNO3), potassium permanganate (KMnO4) and ethanol were purchased from Sigma-Aldrich company. The dye solutions were prepared in ultrapure distilled water.
2.2. Cellulose-Based Graphene Oxide (GO)
Cellulose-based GO was prepared by a modification of the Hummer method using crushed carbonized cellulose material as a precursor [25,26]. To obtain dried cellulose in a powder, it was pressed for 10 min with a pestle and mortar. Crushed cellulose was heated at 15 °C/min for 2.5 h until the temperature reached 800 °C under a nitrogen atmosphere to obtain a carbonized powder. Carbonized powder (6 g) was mixed with NaNO3 (6 g) and dissolved in H2SO4 (150 mL). The mixture was stirred continuously at 0–5 °C for 3 h. Further, at room temperature, the reaction was maintained for 48 h to allow completion. Then, 160 mL of water was poured slowly into the reaction product and the mixture was heated at 90 °C for 20 min. The reaction product was cooled and water (200 mL) and H2O2 (10 mL) were mixed properly for less than 1 h. The black thick suspension was processed using a centrifuge and then it was cleaned with HCl (30%) and ethanol to eliminate the scums. Finally, the GO was sonicated for 2 h with ultrapure water to achieve GO exfoliation. Black duff was dehydrated at 70 °C for 24 h in a hot chamber to obtain the dried powder and the as-prepared sample is denoted as GO.
2.3. ZnO Nanoparticles
Citrus sinensis were peeled off and the peels were washed properly using ultrapure water to remove the unwanted scums and later dehydrated to remove the residual moisture. The moisture-free peels were ground to a powder. The Citrus sinensis powder was heated in ultrapure water for 20 min at 80 °C. Filter paper was used to obtain the particle-free filtrate from the solution and was preserved at 25 °C. The filtrate was then used as an extract (Citrus sinensis). To prepare the ZnO nanoparticles, zinc sulfate (5 g) was added to 50 mL of Citrus sinensis extract. The zinc sulfate suspension was heated to 75 °C until it became a paste-like semi-solid. Further, to produce the nanopowder, the paste was heated at 300 °C for 3 h [27,28].
2.4. GO-ZnO Photocatalyst
In a typical synthesis of the composite of GO-ZnO, GO powder 0.5 g is mixed with distilled water; this mixture undergoes a sonication process to make a homogeneous suspension. Then, 0.5 g ZnO nanoparticles are added to the GO suspension. The GO-ZnO photocatalyst is properly mixed at 25 °C for 10 h on a magnetic stirrer. The GO-ZnO paste is filtered and rinsed using ethanol until the filtrate becomes colorless. To obtain the GO-ZnO composite, the GO-ZnO paste is dehydrated at 60 °C in an oven for 24 h.
3. Characterizations
Fourier transform infrared (FTIR) analysis was employed to study the molecular structure of the samples. The stretching vibrations present in ZnO, GO and GO-ZnO are studied by FTIR, and the absorbance of the dye’s solution is recorded using the UV-vis Spectrophotometer. A scanning electron microscope (SEM) is used to investigate the morphology of the photocatalyst (GO, ZnO and GO-ZnO). The dried sample was placed on copper tape and inserted into a vacuum chamber for analysis. The crystalline structures of the analysis of the catalysts GO, ZnO and GO-ZnO samples were examined with a transmission electron microscope (TEM).
3.1. FTIR Characterization
The IR stretching frequency of the composite catalysts viz; GO, ZnO and GO-ZnO has been studied by FTIR spectra as shown in Figure 1. The IR stretching (asymmetric) of O–H occurs at 3450 cm−1 for GO. The bending vibration of C=O is located at 1720 cm−1, the band stretching at 1590 cm−1 corresponds to C=C, the band stretching at 1255 cm−1 is related to the C–O bond and the C–O–C bond is represented at the band stretching of 1050 cm−1. The IR frequency analysis of the catalysts is shown in Table 1. In C–O–C, the molecular bending vibration occurs at 1450 cm−1. The unique peak that appears at 550 cm−1 relates to the band stretching of Zn-O. The small peaks at 900, 1100, 1330, and 1550 cm−1 are related to functional moieties responsible for the reduction of ZnO nanoparticles [29,30]. The peak at 3400 cm−1 is associated with O-H bending vibration. The vibrational frequency at 1552 cm−1 is related to the bond formation of GO-ZnO. The 1480 cm−1 peak confirms the C-Zn bond bending vibration that relates to GO-ZnO.
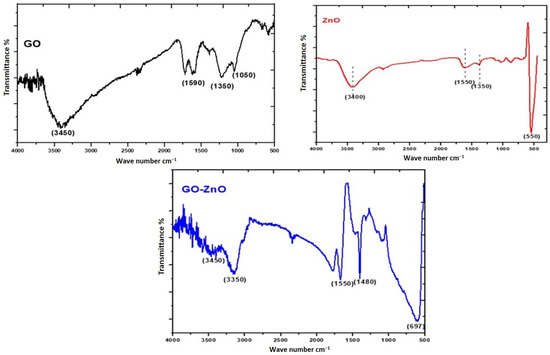
Figure 1.
FT-IR spectra of photocatalysts (GO, ZnO and GO-ZnO) derived from the biomass.

Table 1.
Analysis of the vibrational frequency of the catalysts.
3.2. Surface Morphology and Size Analysis of the Catalyst
The GO surface morphology was studied by SEM as shown in Figure 2a, in a 2D perspective, the micrograph is showing the surface morphology of the catalyst. The smooth flat corn-like two-dimensional structures are dominant. Overlapped flat corn-like structures of GO are congregated. The sheets are 66 to 88 nm in thickness [31]. In Figure 2b the SEM image depicts the morphology of ZnO nanoparticles which shows the sharp edges of regular shape nanoparticles. The particle size range is from 39.23 to 101.2 nm and is scattered in singles or clusters. In Figure 2c, the morphology of GO-ZnO NPs takes the form of spongy coral reef-like structure possessing a high coverage area.
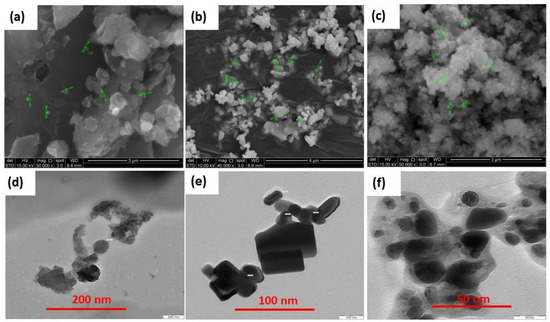
Figure 2.
SEM images of (a) GO at 5 × 10⁴ mag (b) ZnO at 4 × 10⁴ mag, (c) GO-ZnO at 5 × 10⁴ mag. TEM images of (d) GO (e) ZnO (f) GO-ZnO as-synthesized catalyst.
Figure 2d–f depicts the TEM images of as-synthesized GO, ZnO, and GO-ZnO. In Figure 2d, the TEM micrograph shows off an impression of a thin sheet of GO having an irregular structure. In Figure 2e, the TEM micrograph of ZnO is shown, nanoparticles are predominantly rectangular in shape having sharp edges that are gathered in groups. Figure 2f displays the TEM image of GO-ZnO; the ZnO nanoparticles are encapsulated by the GO layer.
Elemental analysis of the catalyst (GO) using energy-dispersive X-rays (EDX) is shown in Figure 3. GO contains around 74.52% carbon, 19.77% oxygen, 0.59% Cl, and a trace amount of Ti and K. In Figure 3 (GO-ZnO), the elemental analysis of GO-ZnO is shown by EDX; Zn is present at 39.94% by weight, O and C are available at 20.94% and 39.12% by weight, respectively.
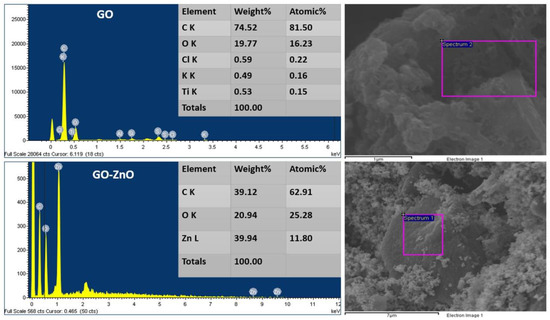
Figure 3.
EDX analysis of as-prepared cellulose catalysts GO and GO-ZnO.
3.3. XRD Analysis
The XRD analysis of GO, ZnO, GO-ZnO nanocomposite and GO sheets, are shown in Figure 4. In the pattern of GO sheets, a diffracted peak at around 2θ = 9° is related to the Miller indices (001) reflection; the two layers spacing (0.95 nm) is greater than the spacing of graphite layers (about 0.37 nm), which confirms the incorporation of functional group-containing oxygen on the graphite surfaces [32]. The ZnO NPs XRD diffraction peaks are in agreement with the hexagonal phase wurtzite ZnO. GO-ZnO nanocomposite peaks are overlapping with the hexagonal (wurtzite) ZnO. The intensity of the diffraction peak at 2θ = 9° of GO is slightly reduced as compared to pure GO, which indicates that the two-dimensional symmetry of GO layers has been disturbed and the exfoliation of GO sheets occurs due to the incorporation of rectangular-shaped ZnO nanocrystals [33,34]. From the XRD analysis of GO-ZnO nanocomposite, it can be seen that the crystallinity of the nanocomposite system is reduced.
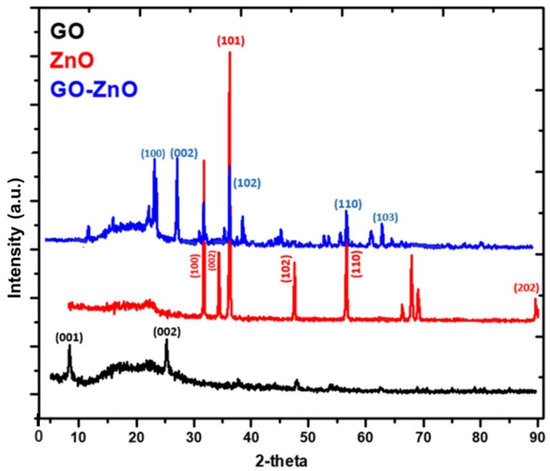
Figure 4.
XRD diffractogram of as-prepared GO, ZnO and GO-ZnO nanocomposite.
3.4. Raman Analysis
In Figure 5a, the Raman spectra of GO and GO-ZnO are depicted in which the occurrence of a very strong D band at ~1350 cm−1 and a very strong G band are seen at ~1590 cm−1. The structural disorder in GO is demonstrated by the height of the D band. In the Raman spectra of GO, a significant 2D band is always observed which is also considered the G band. The D band at 1350 cm−1 shows defects in the material. The first-order resonance resulted in a D peak. Therefore, the degree of disorder is measured by the intensity of the D-peak. In the Raman spectra of GO-ZnO, a defect-activated broad peak marked D + G is also evident at about 2900 cm−1 [35]. Figure 5b also shows UV–Vis spectra of pure GO, ZnO and GO-ZnO nanocomposite. The spectrum of GO depicts a characteristic absorption band at 275 nm. The distinctive visible absorption peak of ZnO appears at 400 nm, whereas the peak of composite GO-ZnO is seen in the visible region. GO, ZnO, and the GO-ZnO composite are in the same phase (solid), and the energy gap of GO-ZnO is reduced [36]. ZnO shows better absorption near 400 nm of radiation. In GO-ZnO, absorption occurs in a wide range of visible regions [37]. The photocatalytic activity of GO-ZnO nanocomposite is estimated by applying degradation kinetics models for Rhodamine 6G degradation in the presence of sunlight.
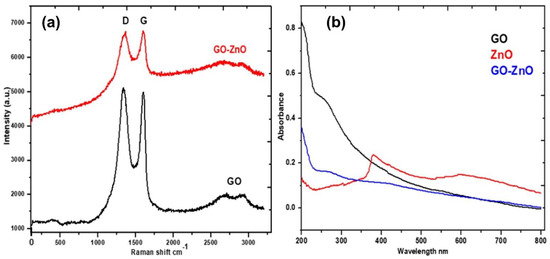
Figure 5.
(a) Raman spectra of GO and GO-ZnO, (b) UV-vis spectra of GO, ZnO and GO-ZnO as-prepared.
3.5. AFM Analysis
In Figure 6, the 2D and 3D AFM micrographs of GO and GO-ZnO are depicted. In the micrographs, highly non-smooth crest-trough-like surfaces of stacked layers of GO are seen. In the GO-ZnO AFM image, the crest-trough-like surface means the surface becomes smoother. At very low pressure, the sample shows no impurity when interacting with the AFM tip and it emphasized a fine impression of the top surface [38].
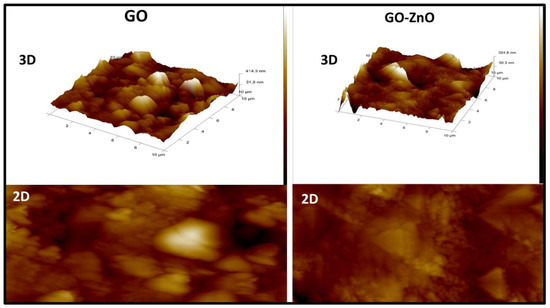
Figure 6.
Atomic force microscopy images of the as-prepared composite of GO and GO-ZnO in 3D and 2D format.
3.6. TGA Analysis
To evaluate the thermal behavior and stability of the natural waste-based GO and GO-ZnO materials, TGA was performed. The results of these analyses are shown in Figure 7. The GO curve showed a pronounced weight loss close to 100 °C, which may be due to water loss. This is consistent with previous evaluations of GO prepared with other natural waste, for example, lignin, in which case the weight loss occurs also close to 100 °C [35]. In the present work, stability of approximately 50% was attained for this GO material at high temperatures (800 °C) as shown in the curve, against the stability of approximately 60% attained at 800 °C with a GO prepared from lignin [36]. The TGA for the GO-ZnO shows a slight weight loss at approximately 170 °C along with 90% stability; moreover, 65% stability was observed at higher temperatures (over 800 °C). It is important to highlight that at temperatures in a range of 400–500 °C a stability of 85% is exhibited, which implies an acceptable range of temperature for the practical applications of the material. These results demonstrate that the natural waste-based GO and its composite GO-ZnO are a good alternative for catalytic applications and are comparable to other natural-based materials and can be considered for remediation purposes.
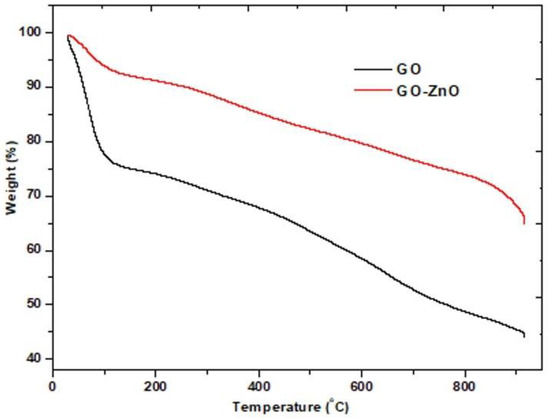
Figure 7.
TGA for the natural waste based GO and GO-ZnO.
4. Results and Discussion
4.1. UV-Visible Analysis
Photocatalytic degradation of rhodamine 6G has been conducted by using as-prepared catalysts viz; GO, ZnO and GO-ZnO. A concentration of 0.45 mg/mL of rhodamine 6G has been used. For the photocatalytic degradation of rhodamine 6G, 100 mL of the rhodamine 6G solution was transferred into three Erlenmeyer flasks. To each sample of the dye solution, 1 g of the photocatalyst was added. The experiments were essentially conducted in natural conditions under sunlight irradiation. Under the same physical conditions of temperature, for a comparative point of view, ZnO was taken as a reference catalyst. In the three parallel photoreactors, the dye solution was continually stirred until complete photodegradation was achieved. The optical density (absorbance) of the dye solution as a function of time was recorded at regular intervals, and aliquots (1 mL) were removed from the cuvette using a micropipette. The dye’s solution absorbance spectrum was noticed at λmax = 555 nm. After recording the solution absorbance, the aliquot (1 mL) was poured back into the photoreactor.
As the irradiation period increases, the dye concentration in the solution diminishes, as seen by the decreasing strength of absorbance peaks (Figure 8). Thus, a regular decolorization in the solution of dye is visible from the peak intensity. The chromophore is liable for imparting the dye color. During photocatalysis, the chromophore group is de-linked from the organic moiety [39]. Though, as calculated by the absorption bands in the electronic spectrum, the dye solution’s color fades slowly. Thus, the characteristic absorption peak disappears in the UV-vis spectra after 1 h. Initially, the λmax was shifted towards a higher wavelength in the presence of GO-ZnO, thus, showing that the GO-ZnO exciton energy bandgap had been decreased. A small redshift in the λmax value was also noticed after the complete dye degradation. The photocatalytic efficiency of the catalyst was determined by the interfacial electron transfer rate from the dye to the photocatalyst [40,41].
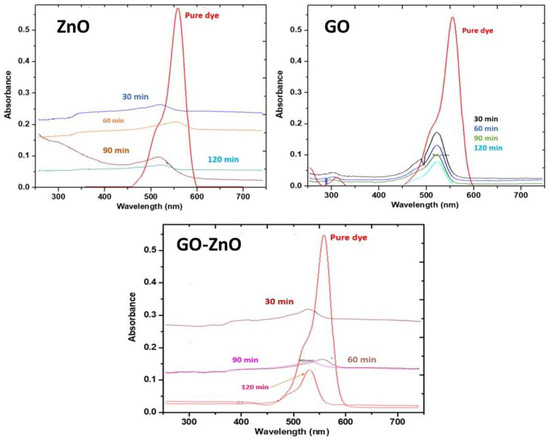
Figure 8.
UV-vis spectrum of rhodamine 6G at λmax = 555 nm, and photodegradation of rhodamine 6G using ZnO, GO and GO-ZnO at different time intervals.
Varshni’s empirical expression describes the relationship between band-gap energy and temperature. Eg(T) = Eg(0)-aT2/(T + b), where Eg(0), a and b are material constants. The band gap depends on the composition of the materials and temperature. As the temperature increases, the band gap energy of the catalyst tends to decrease [42,43].
4.2. Kinetics of Photodegradation
Chemical kinetics has been applied to investigate the photodegradation of dye. The reaction and constant rate were assessed from the change in concentration of the dye derived from the measurements made in the spectrophotometer. The photodegradation was evaluated in the presence of ZnO, GO and GO-ZnO composites as catalysts. The rhodamine 6G dye (100 ppm) absorption spectra are shown in Figure 9a,b. The sharp fall in the optical density of the solution after mixing the photocatalyst at the λmax = 555 nm was recorded at regular intervals. The variation in the concentration is calculated from the initial and final value of the absorbance of the solution. When the dye molecule is stimulated by sunlight, interfacial electrons are transferred from the excited molecules. The photocatalyst captures the interfacial electron. The real contact between dye molecules and the catalyst must be encountered for rapid electron transfer. To understand the rate of dye photocatalytic degradation, chemical kinetics theory was applied to calculate the rates of photodegradation using a first-order integrated rate equation [44]. The dye degradation over time is shown in Figure 9b. The graph of ln(C/Co) vs. irradiation time shows the exponential dye degradation that indicates the first-order kinetics of the reaction. Thus, the integrated-rate expression, k = 2.303/t * log(C/Co) can be used, where Co and C, stand for the initial and the final dye concentration, respectively. The plot of ln(C/Co) vs. time (min) gives a negative slope which is equal to the rate constant (k, min−1). The rate constants (k, min−1) were evaluated for the different catalysts (GO, ZnO and GO-ZnO) under similar experimental conditions; the values obtained for these constants were k_ZnO = 2.236 × 10⁻² min−1, k_GO = 1.74 × 10⁻² min−1 and k_GO-ZnO = 1.463 × 10⁻³ min−1, respectively. The higher degradation was possible due to the small energy band gap of ZnO. Thus, there is a high electron-accepting tendency in the ZnO catalyst. The degradation efficiency for the catalysts after 120 min is presented in Table 2. The GO-ZnO and ZnO photodegradation performance is almost the same.
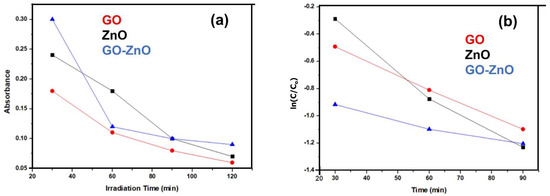
Figure 9.
Graph of (a) Absorbance vs. UV-irradiation time (min), (b) ln(C/Co) vs. UV irradiation Time (min).

Table 2.
The half-life, rate constant, degradation efficiency, and time constant of the catalyst were estimated experimentally.
For a chemical reaction (the photodegradation of the dye), the half-life, t1/2, is used to calculate the rate constant of a first-order reaction. This value is essentially evaluated from the integrated rate law expression [45]:
The calculation of t1/2 of the first-order reaction is independent of the initial concentration of the solution used. The half-life, t1/2 of photodegradation of the solution is shown in Table 2. The half-life period of photodegradation of these reactions using a different catalyst is not significantly large, this means that the photodegradation follows first-order kinetics.
An additional way to calculate the first-order reaction rate constant is to determine the time constant τ (Tau), which is the period of time it takes for a reactant’s concentration to reach 1/e of its original concentration [46]:
that is, the time constant, τ (Tau) is the reciprocal of the rate constant (first-order reaction) as stated below.
The photodegradation kinetics of the dye were calculated to be first-order from the value of half-life and time-constant. In Figure 9b, a negative slope with a straight line was obtained from the plot ln(C/Co) vs. time (t min). The negative slope for the straight line suggests the first order of kinetics. A summary of half-life t1/2 and the time constant of the degradation reaction of the rhodamine 6G is described in Table 2.
Recent reports on Rhodamine B photocatalytic degradation present the utilization of different catalysts and different concentrations of dye to assess the degradation; however, it is observed that the results depend greatly on the preparation method of the catalyst, the photoperiod, the concentration of the dye to be degraded and the concentration or amount of the catalyst that is utilized. Therefore, a comparison of the results obtained in the present work against results obtained with composites of ZnO or GO-ZnO prepared with various methods would need to be objective. For example, in the present work, the GO-ZnO was waste-based material, which offers the possibility of taking advantage of low-cost resources. On the other hand, other authors that have worked with rhodamine B and different catalysts have used a concentration of the dye as low as 5 mg/L if compared with the present work (and 100 mg Zeolite-ZnO catalyst obtaining 81% degradation of dye) [47]. Along the same lines, a concentration of 10 mg/L of the dye in the presence of a solution containing the catalyst, i.e., 0.1 mL/100 mL of ZnO nanoparticles/dye solution, (Dodoo-Arhinet et al. [48]) was degraded in approximately 95% in 160 min. In the present work, the assessment of the waste-based catalyst (GO-ZnO) was conducted in the presence of 450 mg/L of the dye (and 1g of catalyst), while obtaining 70% of degradation. The concentration used here may be considered high in comparison with the aforementioned concentrations and the percentage of degradation is acceptable. From a practical point of view, the waste-based catalyst (GO-ZnO) evaluated in these experiments is shown to be a good choice to start with regarding rhodamine B degradation in a range of concentrations, including the ones that have been considered previously [30,49].
4.3. Mechanism of Photocatalysis
Irradiation by sunlight promotes the photoelectron during photocatalytic degradation from the filled valence band to the empty conduction band of the catalyst (GO-ZnO). The energy (hυ) of the absorbed photon is equal to or greater than the bandgap of the semiconductor photocatalyst. The irradiation of sunlight (excitation) causes a hole in the valence band (hVB+). As a result, a pair of electrons and holes (e/h+) is created, as shown in the equations below [50].
GO-ZnO + hυ → GO-ZnO e−(CB) + h+(VB)
H2O + h+(VB) → H+ + OH
e−(CB) + O2 → O2− (anionic superoxide radical)
O2−∙ + H+ → HOO
2HOO → H2O2 + O2
H2O2 → 2OH
OH + Dye → CO2 + H2O
e−(CB) + dye → Reduction
h+(VB) + dye → oxidation
When water is ionized, the hole created in the valence band works as a strongly oxidizing agent, producing the OH∙radical. The anionic superoxide radical (O2−) is formed when oxygen accepts an electron from the conduction band. After superoxide radicals (O2─∙) are protonated, peroxide H2O2 is formed, which then breaks down into more reactive hydroxyl radicals (OH) [50,51]. Figure 10 depicts a mechanism for photocatalytic degradation. In the case of rhodamines, they are degraded to CO2, water and mineral acids, which may be the end products obtained after the oxidation of the dye into short-chain organic molecules [47,48].
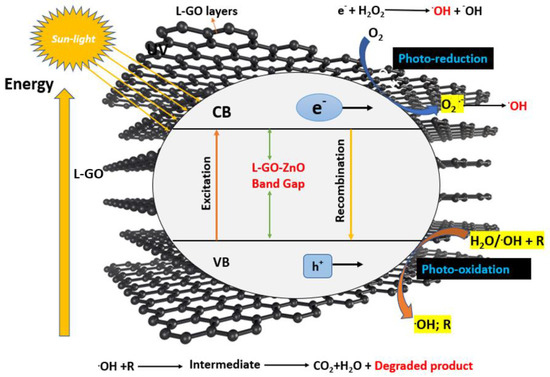
Figure 10.
Mechanism of Photocatalytic degradation of dye using GO-ZnO (Adapted from reference [3] with Springer permission).
5. Conclusions Remarks
In summary, the GO was synthesized from the biomass precursor (cellulose material). The photocatalytic effectiveness of the composite nanomaterial is increased by synthesizing the GO-ZnO composite as a photocatalyst. The degradation rates of the dye in the presence of ZnO and GO catalysts are nearly identical. Photodegradation efficiency is almost the same for both catalysts. In comparison with the other catalysts, the photocatalytic performance of GO-ZnO is rather good. The photodegradation half-life and time constant were calculated using the first-order integral expression for the degradation of dye. The plot of ln(C/Co) versus time (min) yields a straight line with a negative slope, indicating first-order degradation kinetics. The photodecomposition performance of GO-ZnO is comparable to that of the other catalysts studied. The photocatalyst GO-ZnO, which was employed in powder form, may be recyclable. The biomass-based GO-ZnO catalyst is environmentally benign, obtained at a low cost and recyclable in its current state. Furthermore, the GO-ZnO catalyst delivered high performance without special treatment, such as for annealing, which presents an advantage for this composite.
Author Contributions
M.R., M.N.M.I. and F.H.: Conceptualization. M.N.M.I. and M.R.: Methodology, writing—original draft preparation. F.H.: visualization. N.A.-Z. and C.G.-B.: Result interpretation, English editing of the manuscript. N.A.-Z.: Supervision, funding acquisition. All authors have read and agreed to the published version of the manuscript.
Funding
This research was funded by the Researchers Supporting Project (grant number: RSP2021/396), King Saud University, Riyadh, Saudi Arabia.
Institutional Review Board Statement
Not applicable.
Informed Consent Statement
Not applicable.
Data Availability Statement
The authors confirm that all data underlying the findings are fully available without restriction. Data can be obtained after submitting a request to the corresponding/first author.
Acknowledgments
The authors extend their appreciation to the Researchers Supporting Project number (RSP-2021/396), King Saud University, Riyadh, Saudi Arabia.
Conflicts of Interest
The authors declare no competing interest.
References
- Yaqoob, A.A.; Parveen, T.; Umar, K.; Mohamad Ibrahim, M.N. Role of nanomaterials in the treatment of wastewater: A review. Water 2020, 12, 495. [Google Scholar] [CrossRef]
- Selvakumar, A.; Rangabhashiyam, S. Biosorption of Rhodamine B onto novel biosorbents from Kappaphycus alvarezii, Gracilaria salicornia and Gracilaria edulis. Environ. Pollut. 2019, 255, 113291. [Google Scholar] [CrossRef] [PubMed]
- Yaqoob, A.A.; Umar, K.; Adnan, R. Graphene oxide—ZnO nanocomposite: An efficient visible light photocatalyst for degradation of rhodamine B. Appl. Nanosci. 2021, 11, 1291–1302. [Google Scholar] [CrossRef]
- Ahmad, A.; Mohd-Setapar, S.H.; Chuong, C.S.; Khatoon, A.; Wani, W.A.; Kumar, R.; Rafatullah, M. Recent advances in new generation dye removal technologies: Novel search for approaches to reprocess wastewater. RSC Adv. 2015, 5, 30801–30818. [Google Scholar] [CrossRef]
- Ahmad, A.; Setapar, S.H.M. Synthesis and characterization of GO-Ag nanocomposite for removal of malachite dye from aqueous solution. Mater. Today Proc. 2021, 47, 1359–1365. [Google Scholar] [CrossRef]
- Ahmad, H.; Parveen, T.; Ahmad, A.; Oves, M.; Ismail, I.M.; Qari, H.A. Recent advances in metal decorated nanomaterials and their various biological applications: A review. Front. Chem. 2020, 8, 341. [Google Scholar]
- Kanwal, A.; Siddique, A.; Ahmad, A. Polyethersulfone (PES) nanofiltration membrane for treatment of toxic metal contaminated water. In Emerging Techniques for Treatment of Toxic Metals from Wastewater; Elsevier: Amsterdam, The Netherlands, 2023; pp. 319–341. [Google Scholar]
- Yaqoob, A.A.; Ahmad, A. Application and fabrication of nanofiltration membrane for separation of metal ions from wastewater. In Emerging Techniques for Treatment of Toxic Metals from Wastewater; Elsevier: Amsterdam, The Netherlands, 2023; pp. 365–398. [Google Scholar]
- Siddique, A.; Mirza, M.A.; Kanwal, A.; Ahmad, A. Potential use of ultrafiltration (UF) membrane for remediation of metal contaminants. In Emerging Techniques for Treatment of Toxic Metals from Wastewater; Elsevier: Amsterdam, The Netherlands, 2023; pp. 341–364. [Google Scholar]
- Islam, A.; Ahmad, A.; Laskar, M.A. Characterization of a chelating resin functionalized via azo spacer and its analytical applicability for the determination of trace metal ions in real matrices. J. Appl. Poly Sci. 2012, 123, 3448–3458. [Google Scholar] [CrossRef]
- Oyekanmi, A.A.; Ahmad, A.; Hossain, K.; Rafatullah, M. Adsorption of Rhodamine B dye from aqueous solution onto acid treated banana peel: Response surface methodology, kinetics and isotherm studies. PLoS ONE 2019, 14, e0216878. [Google Scholar] [CrossRef]
- Umar, K.; Aris, A.; Parveen, T.; Jaafar, J.; Majid, Z.A.; Reddy, A.V.B.; Talib, J. Synthesis, characterization of Mo and Mn doped ZnO and their photocatalytic activity for the decolorization of two different chromophoric dyes. Appl. Catal. A Gen. 2015, 505, 507–514. [Google Scholar] [CrossRef]
- Maeda, K.; Sato, M.; Niikura, I.; Fukuda, T. Growth of 2 inch ZnO bulk single crystal by the hydrothermal method. Semicond. Sci. Technol. 2005, 20, S49. [Google Scholar] [CrossRef]
- Sun, W.; Meng, S.; Zhang, S.; Zheng, X.; Ye, X.; Fu, X.; Chen, S. Insight into the transfer mechanisms of photogenerated carriers for heterojunction photocatalysts with the analogous positions of valence band and conduction band: A case study of ZnO/TiO2. J. Phys. Chem. C 2018, 122, 15409–15420. [Google Scholar] [CrossRef]
- Raza, W.; Faisal, S.M.; Owais, M.; Bahnemann, D.; Muneer, M. Facile fabrication of highly efficient modified ZnO photocatalyst with enhanced photocatalytic, antibacterial and anticancer activity. RSC Adv. 2016, 6, 78335–78350. [Google Scholar] [CrossRef]
- Kanwal, A.; Yaqoob, A.A.; Siddique, A.; Bhawani, S.A.; Umar, K. Hybrid nanocomposites based on graphene and its derivatives: From preparation to applications. In Graphene and Nanoparticles Hybrid Nanocomposites; Springer: Berlin/Heidelberg, Germany, 2021; pp. 261–281. [Google Scholar]
- Abdulrahman Oyekanmi, A.; Abd Latiff, A.A.; Daud, Z.; Saphira Radin Mohamed, R.M.; Ismail, N.; Ab Aziz, A.; Rafatullah, M.; Hossain, K.; Ahmad, A.; Kamoldeen Abiodun, A. Adsorption of cadmium and lead from palm oil mill effluent using bone-composite: Optimisation and isotherm studies. Int. J. Environ. Anal. Chem. 2019, 99, 707–725. [Google Scholar] [CrossRef]
- Ahmad, A.; Vijaya Bhaskar Reddy, A. Toxicology and environmental application of carbon nanocomposite. In Environmental Remediation through Carbon Based Nano Composites; Springer: Berlin/Heidelberg, Germany, 2021; pp. 1–18. [Google Scholar]
- Xu, M.; Wei, M. Layered double hydroxide-based catalysts: Recent advances in preparation, structure, and applications. Adv. Funct. Mater. 2018, 28, 1802943. [Google Scholar] [CrossRef]
- Peter, C.; Anku, W.W.; Sharma, R.; Joshi, G.M.; Shukla, S.K.; Govender, P.P. N-doped ZnO/graphene oxide: A photostable photocatalyst for improved mineralization and photodegradation of organic dye under visible light. Ionics 2019, 25, 327–339. [Google Scholar] [CrossRef]
- Yang, X.; Jiang, X.; Bashir, M.S.; Kong, X.Z. Preparation of highly uniform polyurethane microspheres by precipitation polymerization and Pd immobilization on their surface and their catalytic activity in 4-nitrophenol reduction and dye degradation. Ind. Eng. Chem. Res. 2020, 59, 2998–3007. [Google Scholar] [CrossRef]
- Gu, Y.; Xing, M.; Zhang, J. Synthesis and photocatalytic activity of graphene based doped TiO2 nanocomposites. Appl. Surf. Sci. 2014, 319, 8–15. [Google Scholar] [CrossRef]
- Singh, P.; Shandilya, P.; Raizada, P.; Sudhaik, A.; Rahmani-Sani, A.; Hosseini-Bandegharaei, A. Review on various strategies for enhancing photocatalytic activity of graphene based nanocomposites for water purification. Arab. J. Chem. 2020, 13, 3498–3520. [Google Scholar] [CrossRef]
- Wicaksono, W.P.; Kadja, G.T.; Amalia, D.; Uyun, L.; Rini, W.P.; Hidayat, A.; Fahmi, R.L.; Nasriyanti, D.; Leun, S.G.; Ariyanta, H.A. A green synthesis of gold-palladium core-shell nanoparticles using orange peel extract through two-step reduction method and its formaldehyde colorimetric sensing performance. Nano-Struct. Nano-Objects 2020, 24, 100535. [Google Scholar] [CrossRef]
- Hummers, W.S., Jr.; Offeman, R.E. Preparation of graphitic oxide. J. Am. Chem. Soc. 1958, 80, 1339. [Google Scholar] [CrossRef]
- Umar, K.; Bhawani, S.A.; Khan, A.; Asiri, A.M.; Khan, M.R.; Azam, M.; AlAmmari, A.M. Cellulose derived graphene/polyaniline nanocomposite anode for energy generation and bioremediation of toxic metals via benthic microbial fuel cells. Polymers 2020, 13, 135. [Google Scholar]
- Viswanathan, B. Photocatalytic degradation of dyes: An overview. Curr. Catal. 2018, 7, 99–121. [Google Scholar] [CrossRef]
- Serrà, A.; Yaakop, A.S. Self-assembled oil palm biomass-derived modified graphene oxide anode: An efficient medium for energy transportation and bioremediating Cd (II) via microbial fuel cells. Arab. J. Chem. 2021, 14, 103121. [Google Scholar]
- Nava, O.; Soto-Robles, C.; Gómez-Gutiérrez, C.; Vilchis-Nestor, A.; Castro-Beltrán, A.; Olivas, A.; Luque, P. Fruit peel extract mediated green synthesis of zinc oxide nanoparticles. J. Mol. Struct. 2017, 1147, 1–6. [Google Scholar] [CrossRef]
- Raizada, P.; Sudhaik, A.; Singh, P. Photocatalytic water decontamination using graphene and ZnO coupled photocatalysts: A review. Mater. Sci. Energy Technol. 2019, 2, 509–525. [Google Scholar] [CrossRef]
- Bitounis, D.; Ali-Boucetta, H.; Hong, B.H.; Min, D.H.; Kostarelos, K. Prospects and challenges of graphene in biomedical applications. Adv. Mater. 2013, 25, 2258–2268. [Google Scholar] [CrossRef]
- Wen, Y.; He, K.; Zhu, Y.; Han, F.; Xu, Y.; Matsuda, I.; Ishii, Y.; Cumings, J.; Wang, C. Expanded graphite as superior anode for sodium-ion batteries. Nat. Commun. 2014, 5, 4033. [Google Scholar] [CrossRef]
- Alamdari, S.; Ghamsari, M.S.; Afarideh, H.; Mohammadi, A.; Geranmayeh, S.; Tafreshi, M.J.; Ehsani, M.H. Preparation and characterization of GO-ZnO nanocomposite for UV detection application. Opt. Mater. 2019, 92, 243–250. [Google Scholar] [CrossRef]
- Durmus, Z.; Kurt, B.Z.; Durmus, A. Synthesis and characterization of graphene oxide/zinc oxide (GO/ZnO) nanocomposite and its utilization for photocatalytic degradation of basic fuchsin dye. ChemistrySelect 2019, 4, 271–278. [Google Scholar] [CrossRef]
- Yaqoob, A.A.; Yaakop, A.S. Application of oil palm lignocellulosic derived material as an efficient anode to boost the toxic metal remediation trend and energy generation through microbial fuel cells. J. Clean. Prod. 2021, 314, 128062. [Google Scholar] [CrossRef]
- Mututu, V.; Sunitha, A.; Thomas, R.; Pandey, M.; Manoj, B. An investigation on structural, electrical and optical properties of GO/ZnO nanocomposite. Int. J. Electrochem. Sci. 2019, 14, 3752–3763. [Google Scholar] [CrossRef]
- Idris, M.O.; Ahmad, A.; Alshammari, M.B. Introduction of adsorption techniques for heavy metals remediation. In Emerging Techniques for Treatment of Toxic Metals from Wastewater; Elsevier: Amsterdam, The Netherlands, 2023; pp. 1–18. [Google Scholar]
- Yaakop, A.S.; Umar, K.; Ahmad, A. Modified graphene oxide anode: A bioinspired waste material for bioremediation of Pb2+ with energy generation through microbial fuel cells. Chem. Eng. J. 2021, 417, 128052. [Google Scholar]
- Hasija, V.; Raizada, P.; Sudhaik, A.; Singh, P.; Thakur, V.K.; Khan, A.A.P. Fabrication of Ag/AgI/WO3 heterojunction anchored P and S co-doped graphitic carbon nitride as a dual Z scheme photocatalyst for efficient dye degradation. Solid State Sci. 2020, 100, 106095. [Google Scholar] [CrossRef]
- Qamar, M.; Saquib, M.; Muneer, M. Photocatalytic degradation of two selected dye derivatives, chromotrope 2B and amido black 10B, in aqueous suspensions of titanium dioxide. Dye. Pigment. 2005, 65, 1–9. [Google Scholar] [CrossRef]
- Lachheb, H.; Puzenat, E.; Houas, A.; Ksibi, M.; Elaloui, E.; Guillard, C.; Herrmann, J.-M. Photocatalytic degradation of various types of dyes (Alizarin S, Crocein Orange G, Methyl Red, Congo Red, Methylene Blue) in water by UV-irradiated titania. Appl. Catal. B Environ. 2002, 39, 75–90. [Google Scholar] [CrossRef]
- Sotoodeh, M.; Khalid, A.; Rezazadeh, A. Empirical low-field mobility model for III-V compounds applicable in device simulation codes. J. Appl. Phys. 2000, 87, 2890–2900. [Google Scholar] [CrossRef]
- Varshni, Y.P. Temperature dependence of the energy gap in semiconductors. Physica 1967, 34, 149–154. [Google Scholar] [CrossRef]
- Li, B.; Liu, T.; Wang, Y.; Wang, Z. ZnO/graphene-oxide nanocomposite with remarkably enhanced visible-light-driven photocatalytic performance. J. Colloid Interface Sci. 2012, 377, 114–121. [Google Scholar] [CrossRef]
- Kumar, J.; Bansal, A. Photocatalytic degradation of amaranth dye in aqueous solution using sol-gel coated cotton fabric. In Proceedings of the World Congress on Engineering and Computer Science, San Francisco, CA, USA, 20–22 October 2010; pp. 20–22. [Google Scholar]
- Yu, H.; Zhang, B.; Bulin, C.; Li, R.; Xing, R. High-efficient synthesis of graphene oxide based on improved hummers method. Sci. Rep. 2016, 6, 36143. [Google Scholar] [CrossRef]
- Alakhras, F.; Alhajri, E.; Haounati, R.; Ouachtak, H.; Addi, A.A.; Saleh, T.A. A comparative study of photocatalytic degradation of Rhodamine B using natural-based zeolite composites. Surf. Interfaces 2020, 20, 100611. [Google Scholar] [CrossRef]
- Dodoo-Arhin, D.; Asiedu, T.; Agyei-Tuffour, B.; Nyankson, E.; Obada, D.; Mwabora, J. Photocatalytic degradation of Rhodamine dyes using zinc oxide nanoparticles. Mater. Today Proc. 2021, 38, 809–815. [Google Scholar] [CrossRef]
- Al Kausor, M.; Chakrabortty, D. Graphene oxide based semiconductor photocatalysts for degradation of organic dye in waste water: A review on fabrication, performance enhancement and challenges. Inorg. Chem. Commun. 2021, 129, 108630. [Google Scholar] [CrossRef]
- Ansari, S.A.; Ansari, S.; Foaud, H.; Cho, M.H. Facile and sustainable synthesis of carbon-doped ZnO nanostructures towards the superior visible light photocatalytic performance. New J. Chem. 2017, 41, 9314–9320. [Google Scholar] [CrossRef]
- Yaqoob, A.A.; Mohd Noor, N.H.; Serrà, A.; Ibrahim, M.N.M. Advances and Challenges in Developing Efficient Graphene Oxide-Based ZnO Photocatalysts for Dye Photo-Oxidation. Nanomaterials 2020, 10, 932. [Google Scholar] [CrossRef] [PubMed]
Publisher’s Note: MDPI stays neutral with regard to jurisdictional claims in published maps and institutional affiliations. |
© 2022 by the authors. Licensee MDPI, Basel, Switzerland. This article is an open access article distributed under the terms and conditions of the Creative Commons Attribution (CC BY) license (https://creativecommons.org/licenses/by/4.0/).