Article

Data-Driven Evaluation of the Synergetic Development of Regional Carbon Emissions in the Yangtze River Delta

1
Business School, Suzhou University, Suzhou 234000, China
2
School of Mechanical and Electrical Engineering, Suzhou University, Suzhou 234000, China
*
Author to whom correspondence should be addressed.
Processes 2022, 10(11), 2236; https://doi.org/10.3390/pr10112236
Submission received: 15 August 2022 / Revised: 15 October 2022 / Accepted: 26 October 2022 / Published: 31 October 2022
(This article belongs to the Special Issue Green Manufacturing and Sustainable Supply Chain Management)

Abstract

:
Evaluating the degree of coordination among regional carbon emission systems is key to achieving an earlier carbon peak and carbon neutrality. However, quantifying the co-evolution of carbon emissions among regions is challenging. Therefore, we propose a data-driven method for evaluating the synergetic development of the regional carbon emission composite system. First, the proposed method employs relevant data to calculate the carbon emissions and carbon emission intensity of each subsystem within the region to describe the temporal trends. The inverse entropy weight method is then used to assign weight to each order parameter of the subsystem for data processing. Then, we perform synergetic development assessment of the composite system to measure the order degree of each subsystem, the degree of synergy among subsystems, and the overall synergetic degree of the temporal evolution of carbon emissions between regions. Finally, the evaluation results can be used to suggest measures for the regional coordinated reduction of carbon emissions. In this study, we used data from the Yangtze River Delta (YRD) region from 2010 to 2019 to demonstrate the feasibility and effectiveness of the method. The results show that there is still a long way to go to reduce carbon emissions in the Yangtze River Delta region. Economic development still relies heavily on fossil energy consumption, and the regional carbon emission reduction synergy is not high. This study provides theoretical and methodological support for regional carbon emission reduction. Moreover, the proposed method can be applied to other regions to explore low-carbon and sustainable development options.

1. Introduction

Rapid economic development has generated many serious environmental problems worldwide, with associated climate changes leading to rising sea levels and more extreme weather. Excessive carbon dioxide emissions play a key role in many of these problems [1,2], with long-term increases in carbon emissions predicted to hinder future economic development [3]. As a major carbon emitter, China has committed to reducing their carbon emissions by proposing carbon peak and carbon neutrality targets [4], which demonstrates a responsible attitude toward global sustainable development. Reducing carbon emissions and promoting high-quality economic development are the focus of current economic development models. The regional economy is an important factor influencing sustainable development [5]; therefore, regional carbon emission reduction is key to achieving sustainable economic development [6,7]. Only low-carbon development of the regional economy can lead to low-carbon and sustainable development of the global economy.
Previous research on regional carbon emissions typically focuses on accounting methods, spatial distribution, and influencing factors [8]. Carbon emission is a general term for greenhouse gas emissions. As the most important greenhouse gas is carbon dioxide, “carbon emissions” can be understood as “carbon dioxide emissions” [2,6]. Jotzo et al. pointed out that carbon emission intensity, which refers to the carbon emissions per unit of economic output, can effectively reflect the level of economic development, technological progress, and energy use efficiency of a country or region [4,9]. Calculating the carbon emission intensity is also important for economic growth and emission reduction and can be used as an indicator of carbon emission reduction in developing countries [9,10]. For example, L. A. et al. evaluated the carbon emission intensity of different sectors in OECD countries using the Adaptive-Weighted Divesian method [11]. Chen et al. constructed the meta-frontier Malmquist–Luenberger productivity index to dynamically analyze changes in the carbon emission efficiency growth rate, as well as regional differences among energy-intensive industries [12]. Moreover, Sun applied stochastic frontier analysis to screen the factors affecting carbon intensity and constructed a carbon-emission intensity prediction model based on factor analysis and an extreme learning machine [13]. Zhang et al. calculated the carbon emissions for different carbon emission sources, such as transportation and heating [14]. Furthermore, Deng et al. measured the total carbon emissions and per capita carbon emissions of eight regions in China from 1995 to 2010 and explored the characteristics and evolution of carbon emissions in each region [15]. Xia et al. analyzed regional differences and spatial–temporal pattern characteristics of agricultural carbon emission intensity in China from 1997 to 2016 using the Theil index and a spatial analysis correlation method, then predicted its evolutionary trend using rescaled range analysis [16]. Dong et al. used the Logarithmic Mean Divisia Index to decompose the driving factors of carbon emissions, as well as a Tapio decoupling model to analyze the decoupling relationship between carbon emissions and economic development [17]. Based on the Theil index and Tapio model, Han et al. measured the total carbon emission and carbon emission intensity of each province in China from 2005 to 2017, and then analyzed regional differences and the evolution of the decoupling trend [18].
The input–output method is also widely used to calculate carbon emissions. This method estimates the carbon emissions of urban energy consumption in households using monetary data obtained by multiplying the carbon emission intensity and household final demand [19]. In addition, life-cycle assessments and carbon footprint calculations can be used to estimate the carbon emissions of micro-individuals based on survey data [20]. For example, Liu et al. used the surface energy consumption estimation method to measure the total amount and intensity of carbon emissions in China, as well as the factors influencing carbon emissions [21].
Current research on carbon emission intensity in China predominantly focuses on factor decomposition. There are three main methods of factor decomposition: exponential decomposition, input–output structure decomposition, and non-parametric distance decomposition [22]. Zhang applied the input–output structure decomposition method to analyze the influence of China’s economic development mode on carbon emission intensity and believed that the energy intensity of the production sector was an important factor in reducing the carbon emission intensity [23]. According to the non-parametric distance function and environmental production technology, Sun et al. decomposed the variation of carbon emissions into several contributing factors and used them to analyze the driving factors of carbon emissions in 36 industrial sectors in China [24]. Moreover, Lin and Mao divided the evolution of China’s carbon emission intensity into stages, and then analyzed the change characteristics of carbon emission intensity in each stage [25]. Wang et al. simulated the dynamic carbon emissions of the Pearl River Delta urban agglomeration from 2021 to 2035 based on the Monte Carlo method combined with multi-scenario analysis, the Mann–Kendall trend test, Theil–Sen’s trend slope estimation, and other methods [26].
Regional carbon emissions can be regarded as a complex system [27]; therefore, the synergistic relationship between carbon emission systems in different regions is an important area of research. The key concept of synergy is 1 + 1 > 2. It was first proposed in 1965 by Ansoff [28]. Synergetic Theory was proposed by the German physicist Hermann Haken in 1971. Synergy theory can explain the degree of coordinated development between internal subsystems and elements. In synergetics, the overall coordinated operation performance of a system is closely related to the elements within each subsystem and has a crucial impact on the evolution of the system [29]. Thus, the synergetic degree of a complex system is commonly modeled to help relevant decision-makers make better development decisions. Meng and Han constructed a widely used model for determining the synergetic degree of complex systems [30], which is based on the principle of order parameters and the slaving principle in system theory. This model can be applied on three levels: macro, medium, and micro. At the macro level, the model is mainly used in cross-regional collaborative research. For example, Li et al. analyzed the coordinated development of the regional economy using a multiple index synthesis method [31], Balazs et al. studied the synergistic effect of a regional innovation system [32], and Chen analyzed inter-regional industrial cluster coordination in the Beijing–Tianjin–Hebei region, dividing the overall collaborative innovation complex system into four subsystems: environment, subject, demand, and diffusion [33]. Taking Brazil, Japan, and the United States as research objects, Tian et al. constructed a coordination degree model of the composite system of innovation and entrepreneurship and analyzed the development model of innovation and entrepreneurship in typical countries [34]. At the medium level, Yang et al. constructed a composite system of scientific research personnel input and scientific output [35], Wu et al. constructed a collaborative innovation composite system [36], and Feng et al. evaluated a synergy model of the information ecosystem [37]. At the micro level, Koberg et al. measured the synergistic effect between departments within an enterprise [38], Bi and Sun established a collaborative development model of product innovation and process innovation [39], and Zhang et al. empirically studied the complex relationship between independent innovation and cooperative innovation [40].
Research on the synergistic relationships of carbon emissions provides an important reference for the collaborative reduction of carbon emissions. However, the following problems are currently limiting this research.
(1)
Although previous studies have measured and analyzed carbon emissions and carbon emission intensity [2,3,4,6,7,8], further research is required into the spatial and temporal evolution of these parameters.
(2)
Compared with Deng, Xia, Han et al. [15,16,17,18,21,22,23,24,25], there is a lack of accurate research on the synergistic relationship among different carbon emission subsystems within a region, which is an important basis for formulating regional collaborative carbon emission reduction policies.
(3)
The key to achieving carbon neutrality is ensuring regional coordinated carbon emission reductions. Therefore, considering the different resource endowments and development degrees in different regions, carbon emission reduction policies must be formulated according to the local conditions.
To address the above research challenges, we propose a data-driven method for measuring and evaluating the synergy of the regional carbon-emission composite system based on the research of Liu et al. [40,41,42,43]. This method can effectively characterize the order degree of each subsystem of regional carbon emissions, the coordination degree among different subsystems, and the overall synergy of the regional carbon emission system. The evaluation results can be used to propose measures toward carbon emission reduction according to the local conditions. The YRD is the most densely populated region in China and one of the largest carbon emitters. Total energy consumption for the eight selected fossil fuel types in the region increased from 661.594 million tons in 2010 to 773.404 million tons in 2019, constituting an increase of 111.809 million tons. Thus, evaluating the synergetic evolution of carbon emissions in the YRD region is significant for low-carbon, high-quality development in other regions, and can provide an important reference for the coordinated reduction of global carbon emissions. This research has both theoretical and practical significance. Specifically, the findings of this study can improve theoretical data-driven research on carbon emissions and enhance models of regional carbon emission synergy. From a practical perspective, the proposed method can help governments form a clear understanding of current carbon emission trends and make appropriate decisions regarding carbon emission reduction measures.
The paper is organized as follows. Section 2 presents the methods used to determine regional carbon emissions, regional carbon emission intensity, and the synergetic degree of the composite system. In Section 3, we use the Yangtze River Delta (YRD) as a case study to verify the applicability of the method and make recommendations for the regional coordinated reduction of carbon emissions according to the analysis results. Section 4 presents the conclusions of this study.

2. Data and Methods

This part mainly introduces the measurement and evaluation methods of coordination degree of regional carbon emission composite system comprehensively, including research process, data acquisition, data processing, data modeling and data application.

2.1. Research Process

Regional carbon emissions represent a complex system. The key to achieving an early carbon peak and carbon neutralization is carbon emission reduction in all regions. However, different regions have different resource endowments and economic development degrees, as well as different pressures and potentials for carbon emission reduction. Thus, it is important to accurately measure and characterize the current trends and coordination degree of regional carbon emissions. This can also lead to more targeted coordinated carbon emission reduction strategies.
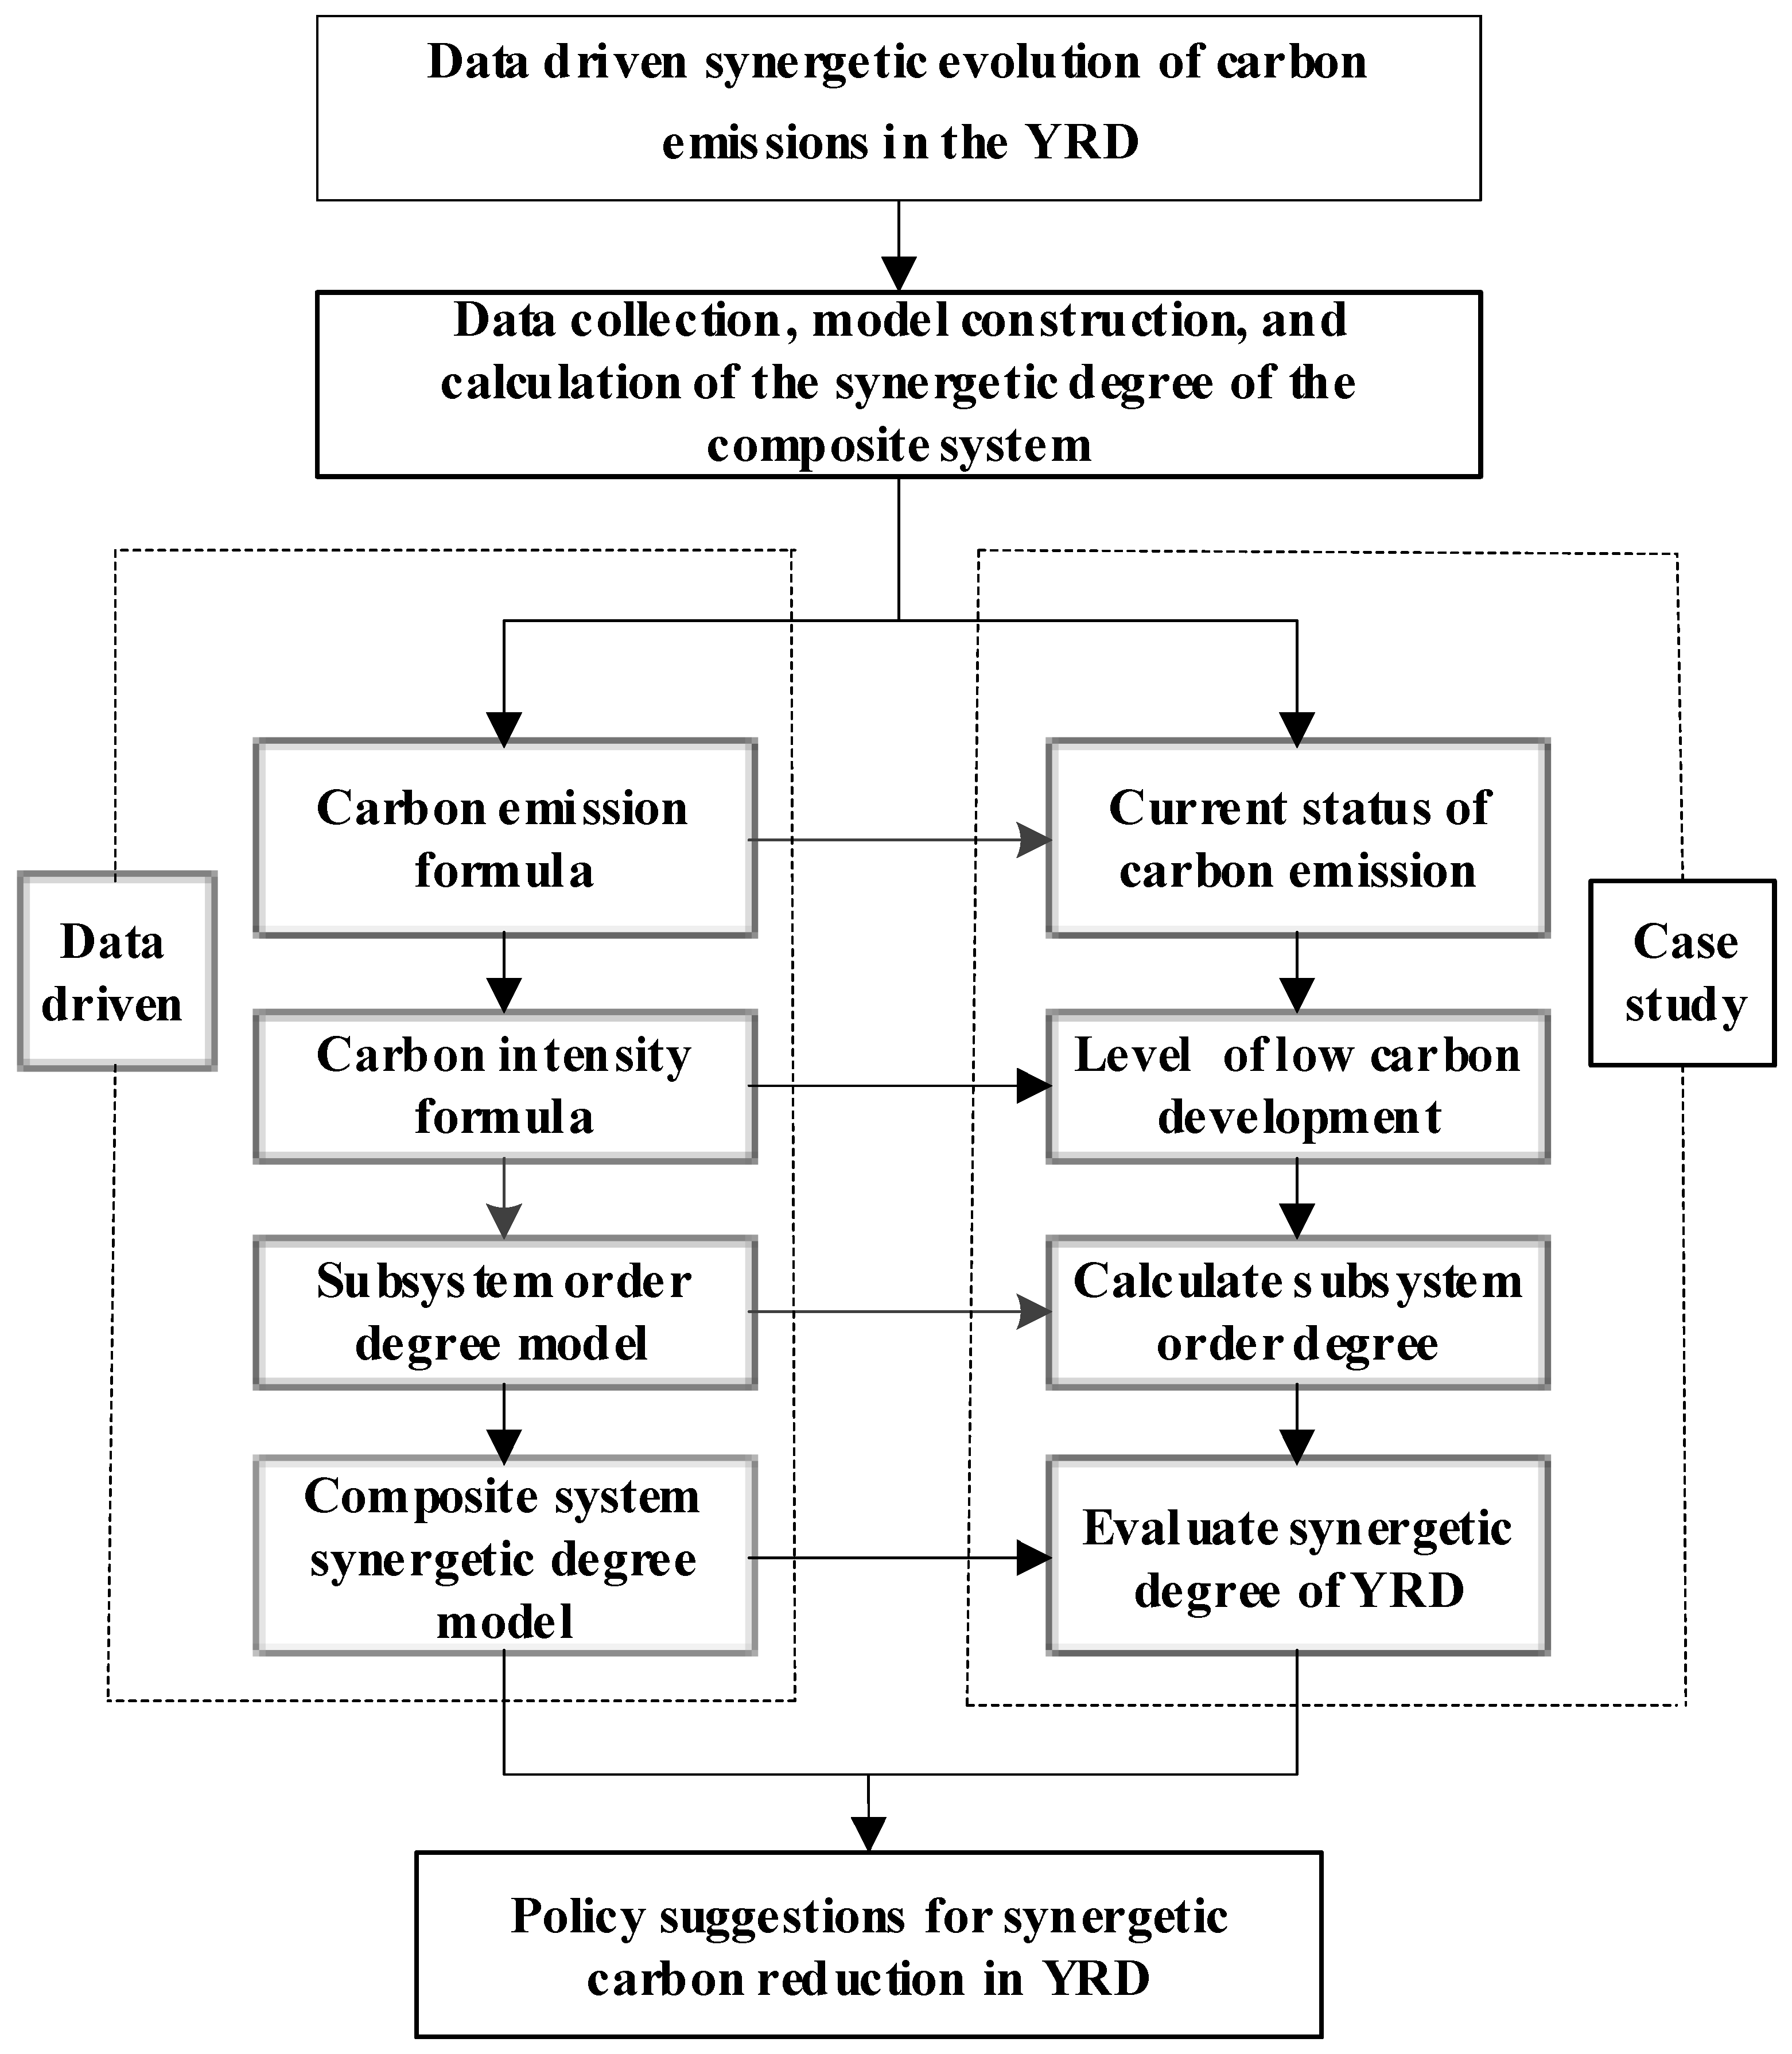
In this study, we constructed a data-driven method for measuring the synergetic development of regional carbon emission systems. For data collection, we obtained fossil energy consumption and gross domestic product (GDP) data. For data processing, we employed the carbon emission calculation methods and parameters provided by the IPCC to calculate carbon emissions and carbon emission intensity. The anti-entropy weight method was used to calculate the index weight. For data modeling, we constructed a subsystem order degree model and a compound system synergetic degree model. We then applied the method to a study area and proposed policy suggestions for collaborative carbon emission reduction based on the data results. A flowchart of the complete methodology is shown in Figure 1.

2.2. Data Collection and Processing

To ensure the accuracy of data sources, we collected regional energy statistical yearbook data and regional GDP data. During the ten years from 2010 to 2019, China’s economy gradually recovered from the global economic recession caused by the US subprime crisis and changed from pursuing rapid economic development to high-quality economic development. At the same time, this decade also witnessed the continuous improvement of the Yangtze River Delta region and rapid progress in its integrated development. The carbon emission data of this year in the Yangtze River Delta region are important for carbon emission research. We also collected panel data from 2010 to 2019 to measure the dynamic evolution of carbon emissions and carbon emission intensity. The standard coal and carbon emission coefficients of fossil energy were obtained from IPCC national greenhouse gas emission inventory guidelines.

2.2.1. Calculation of Carbon Emissions

In most countries, 70% of carbon emissions come from conventional energy consumption, with increased greenhouse gas emissions predominantly attributed to the burning of fossil fuels. In this study, eight major types of fossil fuel consumption were selected: coal, coke, crude oil, fuel oil, gasoline, kerosene, diesel, and natural gas [44]. We referred to the calculation methods and parameters of carbon emissions published by IPCC in 2006 and calculated the carbon emissions from energy consumption as follows:
C i = j = 1 8 E j × S C C   j × C E F j
where Ci is the carbon emission of energy consumption in province i (city), in 10,000 tons; j = 1,2,……8, which refers to the type of fossil fuel; SCCj and CEFj are the standard coal coefficient and carbon emission coefficient of fossil fuel j. The specific values are shown in Table 1.

2.2.2. Calculation of the Carbon Emission Intensity

Carbon emission intensity refers to the carbon dioxide emissions per unit of GDP and is mainly used to measure the relationship between economic development and carbon emissions. It is also an important indicator of low-carbon economic development. The calculation formula is as follows:
I C i = C i G D P i
where ICi is the carbon emission intensity for province i; Ci is the amount of carbon emissions from energy consumption for province i; and GDPi is the gross domestic product of province i. Low carbon emission intensity correlates to low-carbon economic development.

2.2.3. Anti-Entropy Weight Method

To avoid index failure in extreme cases, more accurately reflect the difference between different indexes, and reduce the interference caused by human factors, the anti-entropy weight method is adopted in index weight assignment:
p j = i = 1 n h i j ln ( 1 h i j )
h i j = s i j / i 1 n s i j
W j = P j / j = 1 n P j
Here, Pj is the anti-entropy value of index j; and Wj is the weight of index j determined by the anti-entropy weight method.

2.3. Data Modeling

Regional carbon emissions in the YRD form a composite system. Specifically, the carbon emissions for the three provinces (Jiangsu, Anhui, and Zhejiang) and one city (Shanghai) can be regarded as individual subsystems, each of which affects the others. Whether there is a significant synergistic effect of carbon emissions among these subsystems is highly significant for theoretical research into achieving the carbon peak and carbon neutralization and policy making. The degree of synergy represents the degree of consistency among all elements in the system, as well as the quality of synergistic development [45].

2.3.1. Subsystem Order Degree Model

Let eij = (ei1, ei2, ei3,......, ein) be the order parameter, with αijeijβij, αij, βij representing the minimum and maximum values of the order parameter. If the variable has a positive effect on the development of the subsystem, the order degree of the factor variable is
U i ( e i j ) = ( e i j α i j ) / ( β i j α i j ) j [ 1 , m ]
Conversely, if the variable has a negative effect on the development of the subsystem, the order degree of the factor variable is
U i ( e i j ) = ( β i j e i j ) / ( β i j α i j ) j [ m + 1 , n ]
where Ui(eij) ϵ [0,1]. The closer Ui(eij) is to one, the greater its contribution to the order degree of the order parameter of the subsystem:
U i ( e i ) = j = 1 8 W i j U i ( e i j ) W j 0 ,     W j = 1 ;   i = 1 , 2 , 3 , 4 ;   j = 1 , 2 , , 8 .
Here, Ui ϵ [0,1] is the order degree of the carbon emission subsystem Ui. The closer Ui is to one, the greater its contribution to the order degree of the regional carbon emission system.

2.3.2. Synergy Model of the Composite System

The regional carbon emission composite system is divided into i subsystems:
U = {   U 1 ,     U 2 ,     U 3 U i }
U i = {   U i 1 ,     U i 2 ,     U i 3 ,     ,     U i n }
If i = 8, each subsystem has eight order parameters. In this study, eight types of fossil fuel were selected as order parameters, and the anti-entropy weight method was used to assign weights to each index. In the i subsystem models, the subsystem order degrees are U1, U2, U3,……Ui, where the order degree changes dynamically with time. Assuming that the initial time of subsystem development is zero, the order degree of the subsystem at that moment is U i 0 ( e i ) , and the order degree of the subsystem at moment t is U i t ( e i ) , then the synergy degree U of the composite system during the process of dynamic change over time is
U = θ i = 1 4 μ i [ | U i t ( e i ) U i 0 ( e i ) | ]
θ = min i [ U i t ( e i ) U i 0 ( e i ) 0 ] | min i [ U i t ( e i ) U i 0 ( e i ) 0 ] |
where µi is the proportion of province i in the total GDP of the regional system.
μ i 0 ,   i = 1 4 μ i     = 1
The overall coordination degree of regional carbon emissions is U ϵ [−1,1]. A larger value indicates a greater overall coordination degree of the regional carbon emission system, and vice versa.

2.4. Data Application

The proposed data-driven method was then applied to explore the synergetic evolution of carbon emissions among different regions of the YRD (Figure 2). The specific process is as follows. First, we analyzed the current status and change trends of carbon emissions in the YRD by applying the carbon-emission calculation formula to each subsystem in the region. Second, we calculated the regional carbon emission intensity, which is predominantly used to measure the relationship between economic development and carbon emissions. The results were used to analyze the dependence of regional economic development on carbon fuel, as well as the quality of economic development. Third, we explored the synergetic evolution of regional carbon emissions. That is, the synergy degree of the complex system was used to measure the synergetic relationship between different subsystems and the complex system. Finally, we proposed countermeasures for the collaborative reduction of regional carbon emissions, which requires concerted efforts from all subsystems. Achieving coordinated economic development and carbon emission reductions in each subsystem and across the YRD is important for achieving China’s carbon peak and carbon neutralization goals.

3. Case Study

To verify the effectiveness of the model, we selected the YRD as a case study. Energy consumption data for eight types of fossil fuel were collected from 2010 to 2019. These data were then input into the model to explore the synergetic evolution of carbon emissions in this region.

3.1. Introduction of the Research Case

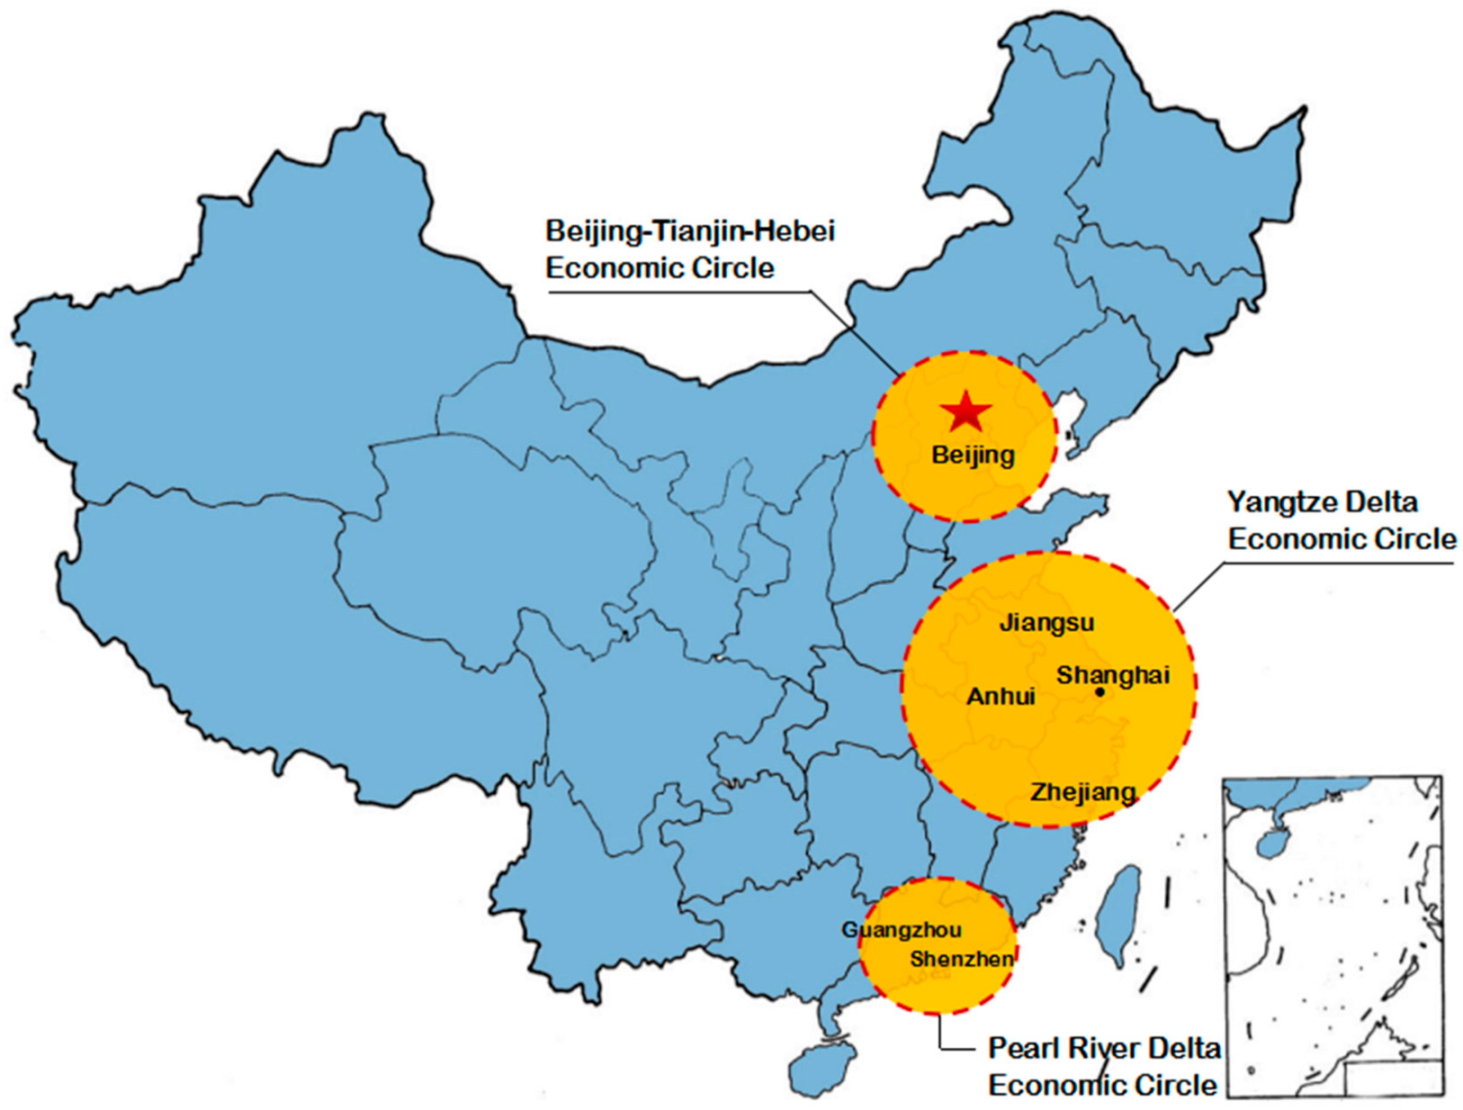
The YRD region has among the most dynamic economic development, the highest degree of openness, and the strongest innovation capacity in China and even the world (Figure 3). The YRD includes Jiangsu, Anhui, Zhejiang, and Shanghai, covering an area of 358,000 km2 and bordering the Yangtze river along the coast, with a permanent population of 235 million as of the end of 2020. In 2020, the total GDP of the YRD region was 24.471318 trillion yuan, accounting for 24% of the total GDP of China (101.59862 trillion yuan). The YRD is the most densely populated region in China and one of the largest carbon emitters. Total energy consumption for the eight selected fossil fuel types in the region increased from 661.5942 million tons in 2010 to 773.4036 million tons in 2019, constituting an increase of 111.8094 million tons. Thus, evaluating the synergetic evolution of carbon emissions in the YRD region is significant for low-carbon, high-quality development in other regions, and can provide an important reference for the coordinated reduction of global carbon emissions.

3.2. Calculation Results and Analysis

Current Status of Carbon Emissions in the YRD

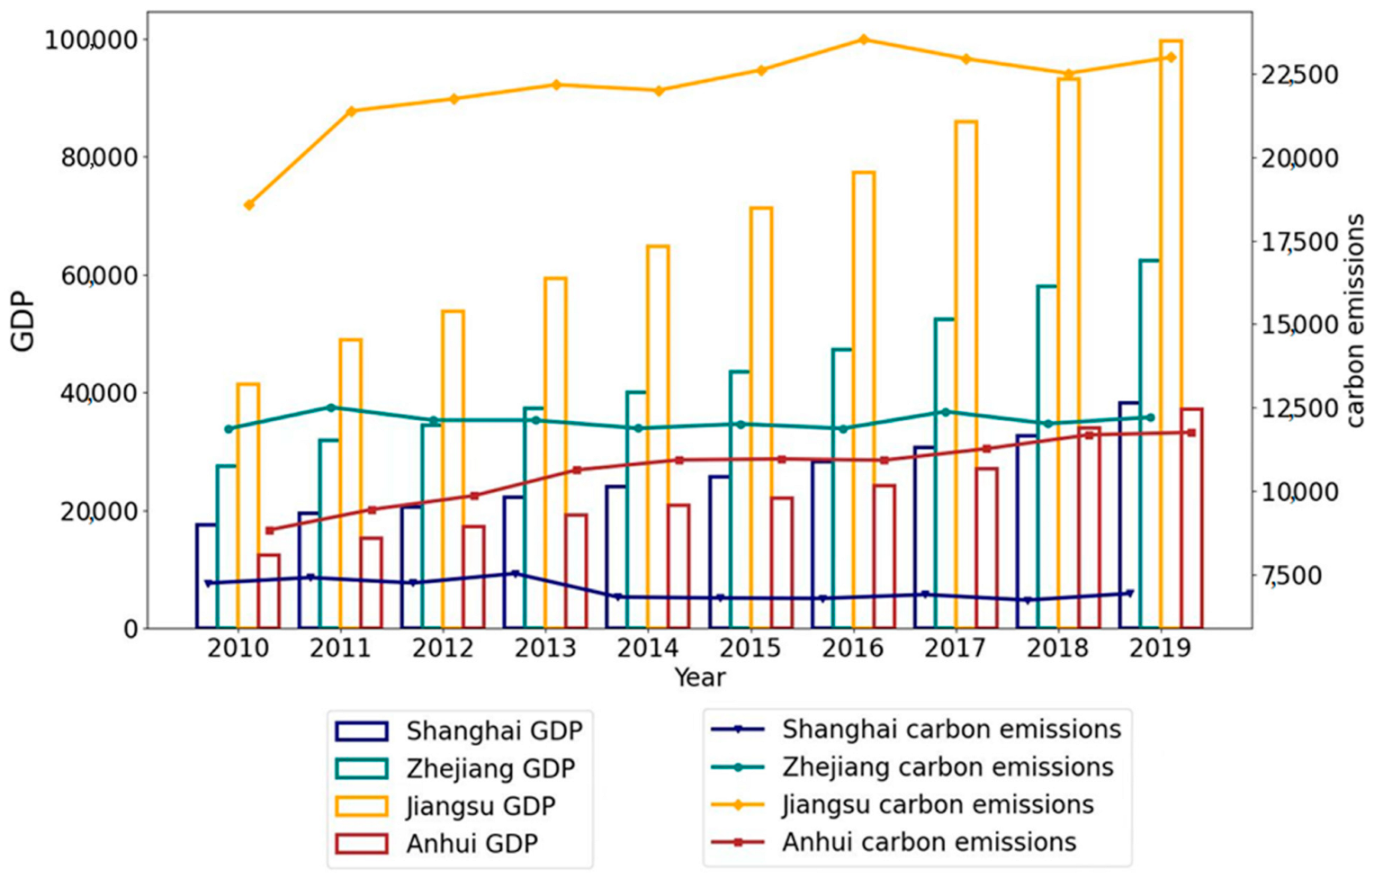
Fossil energy consumption data and GDP data of the three provinces and one city in the YRD were collected and substituted into Formula (1) to calculate the carbon emissions (Table 2 and Figure 4). During the study period (2010–2019), the GDP of the three provinces and one city increased significantly, whereas the carbon emissions remained stable or even decreased. Among the three provinces and one city, Jiangsu province maintained the highest GDP and carbon emissions. Jiangsu province has developed industry and the second highest GDP in China; however, the results show that economic development is still occurring at the cost of higher carbon emissions. Zhejiang province had the second highest carbon emissions, followed by Anhui then Shanghai. As the national economic and financial center, Shanghai’s service industry is highly developed. Compared with the manufacturing industry, the service industry has relatively low carbon emissions [45]. Moreover, Shanghai accounts for the smallest area of the YRD. Together, these factors may account for Shanghai exhibiting the lowest carbon emissions in this study. Along with growth of the GDP, the carbon emissions in Jiangsu and Anhui provinces exhibited a slow growth trend, whereas those of Zhejiang province remained stable, and those of Shanghai first declined slowly before becoming gradually stable. Since the implementation of a new environmental protection law, local governments have made substantial efforts to eliminate outdated production capacity, iterate production technology, and use clean energy. Overall, China’s carbon emission reduction efforts have achieved remarkable results; however, carbon emissions are still increasing in some areas, and low-carbon development can still be substantially improved.

3.3. Carbon Emission Intensity in the YRD

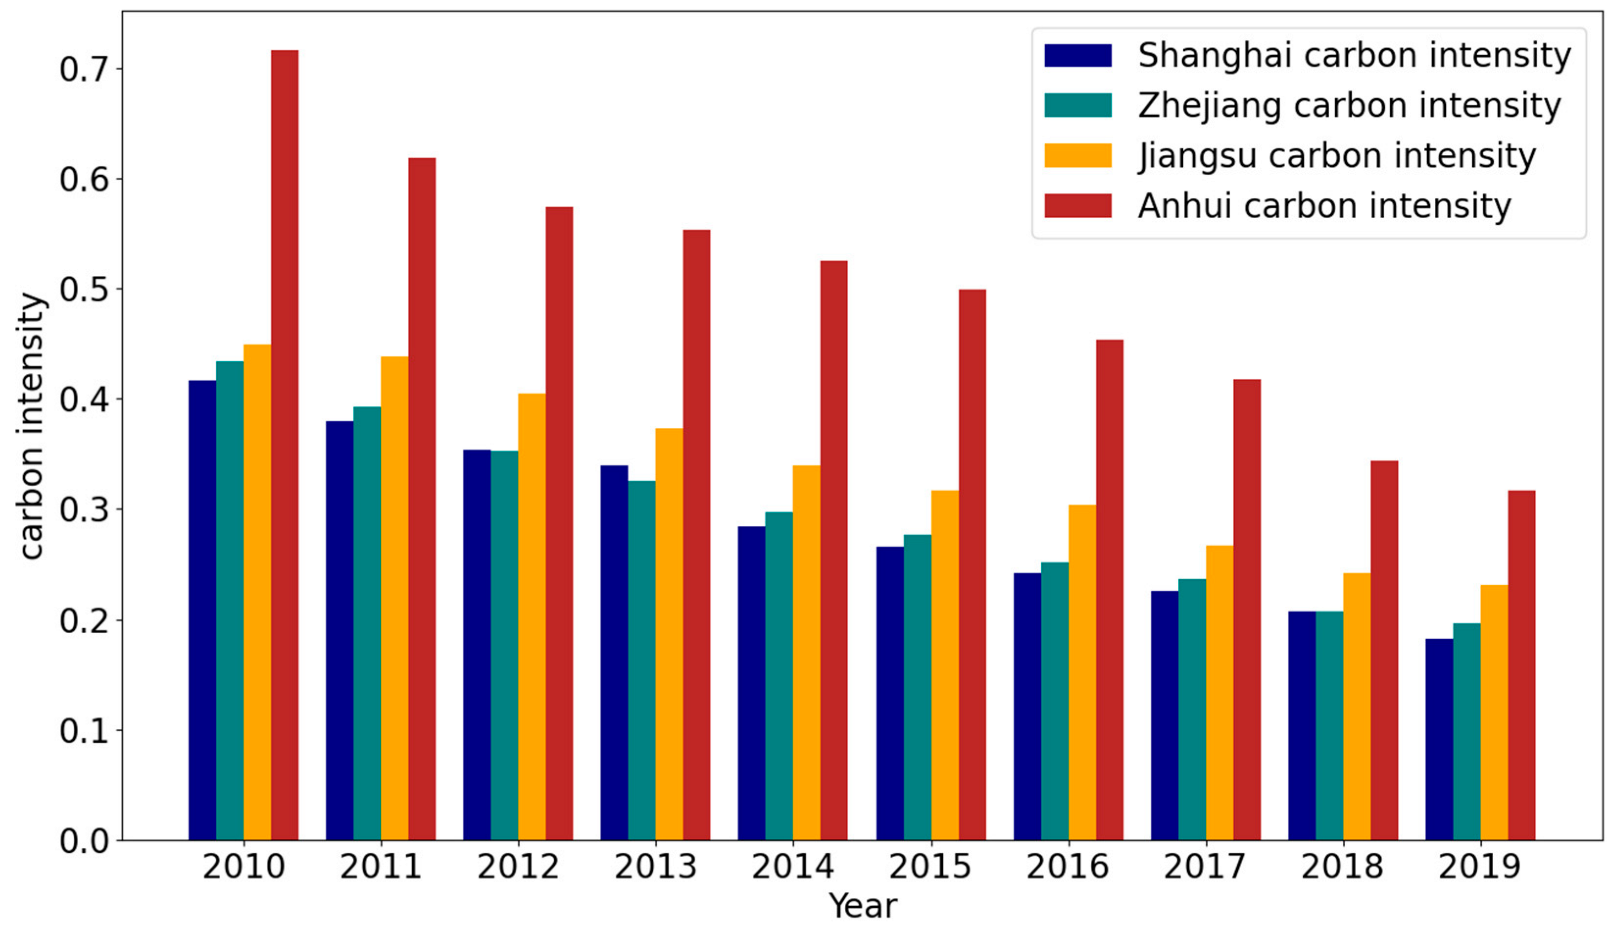
The relevant data were substituted into Formula (2) to calculate the carbon emission intensity for the three provinces and one city in the YRD (Table 3 and Figure 5). Generally, the carbon emission intensity showed a significant downward trend during the study period, indicating that the YRD has achieved remarkable low-carbon and high-quality economic development, with a continued reduction in the dependence of economic development on fossil energy. Moreover, continuous improvements in production technology have led to improved production efficiency, and the widespread application of clean energy and clean production technology has led to a continuous reduction of fossil energy consumption. From 2010 to 2019, Anhui province had the highest carbon emission intensity, followed by Jiangsu province, then Zhejiang and Shanghai. This shows that economic development in Shanghai exhibited significant low-carbon characteristics, whereas economic development in Anhui province had the highest dependence on fossil energy. As the last province to fully integrate into the YRD, Anhui shows substantial room for improvement in its low-carbon development.

3.4. Order Parameters of Carbon Emission Subsystems in the YRD

According to the subsystem order degree model, the subsystem order degree of carbon emissions was calculated for the three provinces and one city in the YRD (Table 4 and Figure 6). The ordering degree of the carbon emission subsystem in Anhui and Jiangsu showed a similar significant upward trend. Anhui and Jiangsu are big manufacturing provinces that share many borders and substantial industrial ties. Therefore, the two provinces experienced similar changes in the synergetic degree of their carbon emission systems over time. Zhejiang and Shanghai also exhibited a similar fluctuating trend. In these areas, industrial development is relatively mature, and they share strong industrial ties; thus, their carbon emission systems also exhibited similar trends. Since 2014, the order degree of the carbon emission system in Anhui province has been higher that of the other two provinces and city. As a rising star in the YRD region, Anhui province has achieved remarkable development in intelligent manufacturing, new energy vehicles, industrial transformation, and upgrading in recent years. This provides a guarantee for continuous improvement of the order degree of the carbon emission subsystem in Anhui. Although the carbon emission subsystem of Jiangsu province showed a similar trend to that of Anhui province, the order degree has decreased since 2018. In 2018, which was a key year for implementing the 13th Five-Year Plan, Jiangsu province adopted several measures in order to achieve carbon emission reduction targets, such as industrial upgrading, vigorous development of the service industry, and the elimination of backward production capacity. These measures may explain the fluctuations in the order degree of its carbon emission system. The Zhejiang subsystem trend also fluctuated, with two peaks in 2011 and 2017. In 2011, the Zhejiang provincial government issued the “991 Action Plan of Circular Economy OF Zhejiang (2011–2015)”, which identified nine fields of circular economy development, nine carriers of circular economy, and ten projects of circular economy implementation. Furthermore, 2017 was a key node year for Zhejiang province to establish the National Clean Energy Demonstration Provincial Action plan. This involved the government formulating a series of carbon emission reduction measures, which may explain the peak of carbon emission synergy in this year. The order degree of Shanghai subsystem also fluctuated, with two peaks in 2013 and 2019.

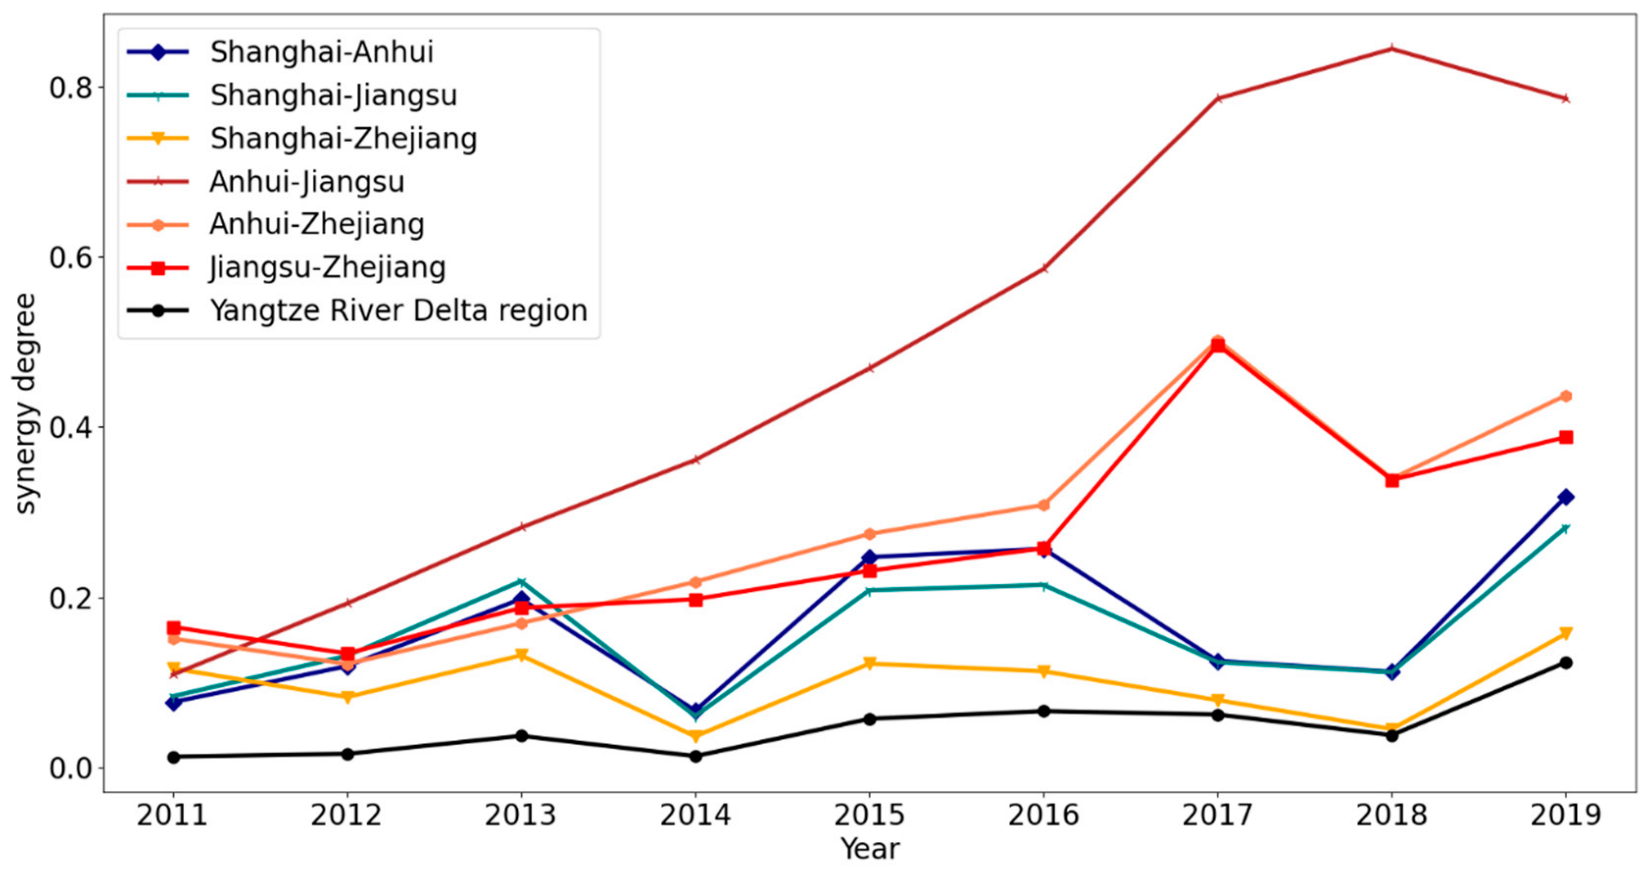
3.5. Synergetic Degree of Carbon Emission Systems in the YRD

The model for evaluating the degree of synergy of composite systems was used to calculate the synergy among pairs of carbon emission subsystems in the YRD and as a whole. The results are shown in Table 5 and Figure 7. The synergy between carbon emission system pairs can be divided into three types: high synergy between Anhui and Jiangsu; medium synergy between Anhui and Zhejiang and between Jiangsu and Zhejiang; and low synergy between Shanghai and Anhui, Shanghai and Jiangsu, Shanghai, and Zhejiang, and for the entire YRD. Generally, the carbon emission subsystems of Anhui and Jiangsu provinces showed increasing synergy over time, reaching a maximum value in 2018 then declining slightly. Anhui and Jiangsu Province are spatially closer and have more industry similarities than other province pairs. Moreover, their industrial chains are more closely related, and there is greater coordinated development of industrial transfer; thus, these provinces experienced greater synergy in their carbon emissions. The synergetic trend of Anhui and Zhejiang was highly consistent with that of Jiangsu and Zhejiang, rising continuously before 2017 and fluctuating thereafter. The synergetic trend between Shanghai and Anhui was similar to that between Shanghai and Jiangsu; however, the degree of synergy between Shanghai and Anhui was consistently higher than that between Shanghai and Jiangsu. Generally, the degree of synergy between Shanghai and the other three provinces was not high. As a key link in the global supply chain, Shanghai benefits from mature industrial development; however, the results indicate a smaller than expected role in the development of the YRD. The overall synergetic degree of the carbon emission system of the YRD was stable or slowly increasing prior to 2018, before improving significantly from 2018 to 2019. In November 2018, the YRD region was expanded to include Anhui province. This national strategy has enhanced the confidence of rapid and coordinated development among provinces and cities in the YRD region, with significant synergistic effects emerging from the regional carbon emission reduction system.

3.6. Recommendations for Carbon Emission Reduction

According to the calculated carbon emissions, carbon emission intensity, order degree of carbon emission subsystems, and synergetic degree of the regional composite system in the YRD region from 2010 to 2019, carbon emission reduction in the YRD still has a long way to go, economic development is still strongly dependent on fossil energy consumption, and the synergetic degree of regional carbon emission reduction is not high. Therefore, we propose the following suggestions for the coordinated development of carbon emission reduction in the YRD region.

3.6.1. Vigorously Develop Nuclear Power, Solar Energy, Wind Energy, and New Energy Vehicles to Reduce Carbon Emissions and Economic Dependence on Fossil Fuels

According to Figure 4 and Figure 5, carbon emissions and emission intensity in the YRD are still high. As a non-renewable resource, fossil energy itself generates high carbon emissions and is not a sustainable source of energy. Furthermore, except for Anhui province, the other three locations in the YRD have a short supply of fossil energy. To combat these issues, more efforts should be made to develop nuclear energy, which is a clean energy source. In the YRD region, Zhejiang and Jiangsu provinces rank second and fourth, respectively, in terms of nuclear power generation, and have a good foundation for the development of nuclear power. China has more than 30 years of experience in the safe development of nuclear power. Since 2019, a total of 11 nuclear power plant projects have been approved; however, nuclear power generation currently accounts for only approximately 5% of China’s cumulative electricity generation, which is still far behind the proportion of nuclear power generation in Europe and the United States (20–30%). Thus, there is still substantial room for nuclear power development. Moreover, as the province with the most developed solar energy industry in China, Jiangsu boasts a strong technological advantage and early industrial foundations. Furthermore, the YRD region includes many mountainous areas and a long coastline, which is suitable for wind power development. The promotion of new energy vehicles should also be intensified. The top three new energy vehicle brands in China (Tesla in Shanghai, Geely in Zhejiang, and NIO in Shanghai) are all located in the YRD region. Vehicle exhaust emissions account for 70% of air pollutants in China. Considering its high population density, greater efforts to promote new energy vehicles in the YRD will greatly reduce carbon emissions. Furthermore, the YRD boasts the strongest economic foundation and most active economic development in China; therefore, new energy strategies in this region will have better economic and technological support and feasibility and will promote the leading role of the YRD in sustainable economic development.

3.6.2. Innovate Production Technology and Reduce Carbon Emissions in Production Links

In many cases, carbon emissions are related to production technology. According to our results, GDP continued to increase over the past ten years, while carbon emissions remained relatively stable and carbon emission intensity continued to decrease (Figure 4 and Figure 5). The innovative application of production technology can improve the energy efficiency and carbon conversion rate of production processes. Specifically, circular-economy-related production technologies can greatly reduce carbon emissions. The YRD region represents the pinnacle of scientific and technological innovation in China. Thus, the government should further encourage scientific research institutions and relevant enterprises to increase investment in clean production technology research and development, strengthen the construction of circular economy industrial parks, improve carbon recycling during the production process, and increase carbon sequestration capacity of all industrial links in order to reduce production-related emissions.

3.6.3. Strengthen Industrial Transfer and Agglomeration, and Further Strengthen Synergy among Carbon Emissions in the YRD

As shown in Figure 6 and Figure 7, the order degree of carbon emission subsystems in the YRD and the degree of synergy among different regions should be further improved, and a stable synergetic relationship should be maintained. This should achieve the systematic and comprehensive integration of regional economic and social development. As an economic and financial center, Shanghai should further strengthen its advantageous industries. In addition to traditional but strong industries such as steel and automobile manufacturing, other industries with high pollution and high energy consumption should be vigorously relocated to the other three provinces. Jiangsu province should further strengthen its advantages of mechanical processing and manufacturing industry, and Zhejiang province should strengthen its advantages of small commodity production and circulation trade. Moreover, non-competitive industries should be transferred to other regions with comparative advantages. Anhui province should more actively take part in the industries of other provinces and cities in the YRD region, plan industrial agglomeration areas in advance, upgrade and optimize manufacturing technology manufacturing processes, improve production efficiency, and reduce carbon emissions in the process of undertaking industrial transfer. At present, except for Anhui and Jiangsu provinces, the degree of synergy between carbon emissions in other regions and the YRD as a whole should be further improved.

3.6.4. Build an Integrated Fiscal and Financial Support System in the YRD to Balance Regional Carbon Emissions

According to Figure 7, the synergetic degree of the YRD carbon emission system is not high. Industrial transfer will inevitably lead to the transfer of carbon emissions, and overall coordination should not only involve carbon emission changes in isolated regions. Therefore, the YRD region can provide subsidies to regions with increased carbon emissions caused by undertaking industrial transfer through transfer payment and other fiscal policies, thereby promoting research and development into cleaner production technologies. Additionally, establishing a bank of the YRD would enable overall planning and coordination and provide targeted support for the integrated development of the YRD.

3.7. Discussion and Implications

Compared with previous research [46,47,48], this study has the following advantages. First, we employed a data-driven method to conduct an objective and comprehensive evaluation of carbon emissions and carbon intensity data in the YRD region over a ten-year period. The synergy degree of the carbon emission system of three provinces and one city in the YRD was modeled using these data, which clearly revealed the current status and temporal evolution of carbon emissions in the YRD region, providing an important basis for researching low-carbon development in the YRD. Second, we evaluated the synergetic evolution trend of the carbon emission system in the YRD region over time using the synergetic degree model for composite systems. We then evaluated the reasons behind these trends, which provided a reference for regional collaborative carbon emission reduction. Finally, the results allowed us to propose more targeted countermeasures that can provide decision-making support for coordinated low-carbon development in the YRD region, as well as other important economic regions worldwide.
Furthermore, this study has the following implications for managing carbon emissions to meet the goals of sustainable economic development. First, carbon emission reduction is not a regional affair; therefore, a reduction in carbon emissions in only one region will have little impact on achieving carbon peak and carbon neutrality. As such, coordinated emission reduction should be achieved from a systematic perspective. Second, different regions have different industrial bases and resource endowments. Therefore, to ensure integrated, low-carbon, and high-quality development, regions should foster their strengths and avoid their weaknesses through industrial transfer. Finally, the contributions of different regions to industrial transfer among regions should be fully considered. Thus, reasonable compensation should be given to regions participating in industries with high energy consumption and carbon emissions in order to improve their investment capacity in low-carbon technology research and development and environmental protection.

4. Conclusions

In the context of economic globalization and regional integration, regional collaborative carbon emission reduction is considered key to achieving an early carbon peak and carbon neutrality. In this study, we constructed a novel data-driven method to objectively and dynamically evaluate the synergetic development of carbon emissions in the YRD region. This study makes several novel contributions: First, we present a data-driven method for evaluating the synergetic degree of the regional carbon emission composite system. This method can dynamically represent the order degree of each subsystem of regional carbon emissions, the degree of coordination among different subsystems, and the temporal evolution of the overall degree of synergy for the regional carbon emissions system. Second, the evaluation results can be used to propose targeted measures for regional coordinated carbon emission reduction.
Although it is significant to evaluate the synergetic evolution of carbon emissions in the YRD region, more extensive efforts are required in order to achieve the goal of peak carbon and carbon neutrality. Therefore, future research will evaluate the synergetic evolution of carbon emissions on a larger regional scale.

Author Contributions

Conceptualization, Y.G. and F.H.; methodology, Y.G. and Y.Y.; validation, J.X., C.L., Y.Y. and H.D.; investigation, X.W. and H.D.; resources, X.W.; data curation, F.H.; writing—original draft preparation, Y.G.; writing—review and editing, F.H.; supervision, C.L. and J.X.; funding acquisition, F.H. All authors have read and agreed to the published version of the manuscript.

Funding

This research was supported by Excellent Young Talents Fund project of Anhui Universities (No. gxyqZD2020108), Scientific Research development Fund project of Suzhou University (No. 2021fzjj39), Humanities and Social Science Project of Education Department of Anhui Province (No. SK2016A1007).

Data Availability Statement

Not applicable.

Conflicts of Interest

The authors declare no conflict of interest.

References

  1. Ang, B.W. Decomposition analysis for policymaking in energy. Energy Policy 2004, 32, 1131–1139. [Google Scholar] [CrossRef]
  2. An, Y.; Zhou, D.; Yu, J.; Shi, X.; Wang, Q. Carbon emission reduction characteristics for China’s manufacturing firms: Implications for formulating carbon policies. J. Environ. Manag. 2021, 284, 112055. [Google Scholar] [CrossRef] [PubMed]
  3. Arshad, A.; Magdalena, R.; Balsalobre, L.D.; Vincent, H.V.N. An analysis of the impact of clean and non-clean energy consumption on economic growth and carbon emission: Evidence from PIMC countries. Environ. Sci. Pollut. Res. 2022, 29, 51442–51455. [Google Scholar]
  4. Hu, J.B.; Luo, Z.P.; Li, F. Prediction of China’s carbon emission intensity under the “carbon peak” target: Based on LSTM and Arima BP model. Sci. Financ. Econ. 2022, 2, 89–101. [Google Scholar]
  5. Du, Q.; Wang, X.; Li, Y.; Zou, P.X.; Han, X.; Meng, M. An analysis of coupling coordination relationship between regional economy and transportation: Empirical evidence from China. Environ. Sci. Pollut. Res. 2022, 29, 34360–34378. [Google Scholar] [CrossRef]
  6. Wang, J.; Yang, F.; Chen, K. Regional carbon emission evolution mechanism and its prediction approach: A case study of Hebei, China. Environ. Sci. Pollut. Res. 2019, 26, 28884–28897. [Google Scholar] [CrossRef]
  7. Tian, K.; Dietzenbacher, E.; Yan, B.; Duan, Y. Upgrading or downgrading: China’s regional carbon emission intensity evolution and its determinants. Energy Econ. 2020, 91, 104891. [Google Scholar] [CrossRef]
  8. Liang, Y.; Niu, D.; Zhou, W.; Fan, Y. Decomposition analysis of carbon emissions from energy consumption in Beijing-Tianjin-Hebei, China: A Weighted-Combination model based on logarithmic mean divisia index and shapely value. Sustainability 2018, 10, 2535. [Google Scholar] [CrossRef] [Green Version]
  9. Jotzo, F. Quantifying uncertainties for emission targets economics and environment. Aust. Natl. Univ. Work. Pap. 2006. Available online: https://EconPapers.repec.org/RePEc:anu:eenwps:0603 (accessed on 14 August 2022).
  10. Jotzo, F.; Pezzey, J.C. Optimal intensity targets for greenhouse gas emissions trading under uncertainty. Environ. Resour. Econ. 2007, 38, 259–284. [Google Scholar] [CrossRef]
  11. Greening, L.A.; Ting, M.K.; Davis, W.B. Decomposition of aggregate carbon intensity for freight: Trends from 10 OECD countries for the period 1971–1993. Energy Econ. 1999, 21, 331–361. [Google Scholar] [CrossRef]
  12. Chen, Y.; Wu, J. Changes in carbon emission performance of energy-intensive industries in China. Environ. Environ. Sci. Pollut. Res. 2022, 29, 43913–43927. [Google Scholar] [CrossRef] [PubMed]
  13. Sun, W.; Huang, C. Predictions of carbon emission intensity based on factor analysis and an improved extreme learning machine from the perspective of carbon emission efficiency. J. Clean. Prod. 2022, 338, 130414. [Google Scholar] [CrossRef]
  14. Zhang, Y.; Qin, Y.; Yan, W.; Zhang, J.P.; Zhang, L.J.; Lu, F.X.; Wang, X. Urban types and impact factors on carbon emissions from direct energy consumption of residents in China. Geogr. Res. 2012, 31, 345–356. [Google Scholar]
  15. Deng, J.; Liu, X.; Wang, Z. Characteristics analysis and factor decomposition based on the regional difference changes in China’s CO2 emission. J. Nat. Resour. 2014, 29, 189–200. [Google Scholar]
  16. Xia, S.; Zhao, Y.; Xu, X.; Wen, Q.; Cui, P.P.; Tang, W.M. Regional Inequality, Spatial-Temporal Pattern and Dynamic Evolution of Carbon Emission Intensity from Agriculture in China in the Period of 1997–2016. Resour. Environ. Yangtze Basin 2020, 29, 596–608. [Google Scholar]
  17. Jia, D.; Li, C.; Wang, Q. Decomposition of carbon emission and its decoupling analysis and prediction with economic development: A case study of industrial sectors in Henan Province. J. Clean. Prod. 2021, 321, 129019. [Google Scholar]
  18. Han, M.; Liu, W.; Xie, Y.; Jiang, W. Regional Disparity and Decoupling Evolution of China’s Carbon Emissions by Province. Resour. Sci. 2021, 43, 710–721. [Google Scholar]
  19. Kok, R.; Benders, R.M.; Moll, H.C. Measuring the environmental load of household consumption using some methods based on input-output energy analysis: A comparison of methods and a discussion of results. Energy Policy 2006, 34, 2744–2761. [Google Scholar] [CrossRef]
  20. Zeng, J.J.; Zhang, Z.Q.; Qu, J.S.; Li, Y.; Liu, L.; Dong, L. Analysis and Evaluation of Methods for Household Carbon Emissions Calculation. Prog. Geogr. 2012, 31, 1341–1352. [Google Scholar]
  21. Liu, Y.; Yang, C.; Cai, H. Provincial differences and factor decomposition of Total carbon emission and intensity in China. J. Hunan Univ. Technol. 2022, 36, 1–9. [Google Scholar]
  22. Chen, S. The pattern and economic explanation of China’s carbon emission intensity fluctuation decline. World Econ. 2011, 34, 124–143. [Google Scholar]
  23. Zhang, Y. The Impact of the change of economic development mode on China’s carbon emission intensity. Econ. Res. 2010, 45, 120–133. [Google Scholar]
  24. Sun, Z.; Zhou, D.; Zhou, P. Research on driving factors of industrial carbon emissions: A new production decomposition analysis method. Quant. Tech. Econ. Res. 2012, 29, 63–74. [Google Scholar]
  25. Lin, B.; Mao, D. Research on the Phased Characteristics of China’s carbon emission intensity decline. Financ. Res. 2014, 8, 101–117. [Google Scholar]
  26. Wang, S.; Mo, H.; Fang, C. Dynamic simulation and carbon peak of urban carbon emissions in the Pearl River Delta Urban agglomeration. Chin. Sci. Bull. 2022, 67, 670–684. [Google Scholar] [CrossRef]
  27. Tong, H.; Qu, W. Assessing China 2030 carbon emissions from fossil fuels: Based on system dynamics model. High Technol. Lett. Engl. Ed. 2015, 2, 178–184. [Google Scholar]
  28. Ansoff, H.I. Corporate Strategy: An Analytic Approach to Business Policy for Growth and Expansion; McGraw Hill: New York, NY, USA, 1965. [Google Scholar]
  29. Haken, H. An Introduction to Synergetics; Atomic Energy Press: Beijing, China, 1984. [Google Scholar]
  30. Meng, Q.; Han, W. Study on Coordination Degree Model of Composite System. J. Tianjin Univ. 2000, 4, 444–446. [Google Scholar]
  31. Guorong, L.I.; Minna, M.A.; Ding, Y. Analysis of Evaluation and Comparison about the Regional Economic Development in China. In Proceedings of the International Institute of Statistics & Management Engineering Symposium, IISMES, Dalian, China, 20–25 July 2010. [Google Scholar]
  32. Balazs, L.; Loef, L. Regional innovation systems in Hungary: The failing synergy at the national level. Reg. Stud. 2011, 45, 677–693. [Google Scholar]
  33. Chen, Z.; Zhang, W. Research on collaborative innovation of inter-regional industrial clusters: An empirical analysis based on Beijing–Tianjin–Hebei regional collaboration. Seeker 2017, 7, 80–85. [Google Scholar]
  34. Tian, M.; Zhang, Y.; Tang, Z. Research and enlightenment of typical National innovation and entrepreneurship development model. Sci. Sci. Manag. Sci. Technol. 2016, 37, 3–16. [Google Scholar]
  35. Yang, X.; Luo, W.; Tang, Z. An empirical study on the coordination degree of R&D personnel input-output complex system from a Three-Dimensional perspective. Sci. Technol. Prog. Policy 2018, 35, 9–14. [Google Scholar]
  36. Wu, X.; Wei, Q.; Gu, X. Research on synergy Degree measurement of collaborative Innovation. Soft Sci. 2015, 29, 45–50. [Google Scholar]
  37. Feng, Y.; Xu, J. Research on the coordination degree measurement of information ecosystem in social media environment. Library 2018, 6, 73–78. [Google Scholar]
  38. Koberg, C.S.; Detienne, D.R.; Heppard, K.A. An Empirical Test of Environmental, Organizational, and Process Factors Affecting Incremental and Radical Innovation. J. Inf. Technol. Manag. 2003, 14, 21–45. [Google Scholar] [CrossRef]
  39. Bi, K.; Sun, D. An empirical study on the synergistic development of product innovation and process innovation in manufacturing enterprises based on composite System Coordination Degree Model. Chin. Soft Sci. 2010, 30, 156–162,192. [Google Scholar]
  40. Zhang, Y.; Liang, Y.; Wu, J.; Sheng, Y.Y. A Measure Model for Synergy Degree Between Enterprise Internal Innovation and Industry-University-Research Cooperation Innovation and Its Application. J. Intell. 2018, 37, 193, 201–207. [Google Scholar]
  41. Liu, C.; Gao, M.; Zhu, G.; Zhang, C.; Zhang, P.; Chen, J.; Cai, W. Data driven eco-efficiency evaluation and optimization in industrial production. Energy 2021, 224, 120170. [Google Scholar] [CrossRef]
  42. Ding, H.; Liu, Y.; Zhang, Y.; Wang, S.; Guo, Y.; Zhou, S.; Liu, C. Data-driven evaluation and optimization of the sustainable development of the logistics industry: Case study of the Yangtze River Delta in China. Environ. Sci. Pollut. Res. 2022, 29, 68815–68829. [Google Scholar] [CrossRef]
  43. Liu, F.; Wang, C.; Zhang, Y.; Zhou, S.; Yang, Y.; Wu, X.; Hu, F.; Liu, C. Data-driven analysis and evaluation of regional agriculture for high-quality development of Anhui Province in the Yangtze River Delta. Environ. Sci. Pollut. Res. 2021, 29, 22490–22503. [Google Scholar] [CrossRef]
  44. Zhang, C.; Zhang, Z. Agglomeration effect and radiation effect of Carbon emission intensity at Provincial level in China. J. Environ. Sci. 2017, 37, 1178–1184. [Google Scholar]
  45. Sun, Y.; Qian, L.; Liu, Z. The carbon emissions level of China’s service industry: An analysis of characteristics and influencing factors. Environ. Dev. Sustain. 2021, 12. [Google Scholar] [CrossRef]
  46. Zhan, D. Allocation of carbon emission quotas among provinces in China: Efficiency, fairness and balanced allocation. Environ. Sci. Pollut. Res. 2022, 29, 21692–21704. [Google Scholar] [CrossRef] [PubMed]
  47. Kong, Y.; He, W. The path analysis of carbon emission reduction: A case study of the Silk Road Economic Belt. Environ. Eng. Res. 2020, 25, 71–79. [Google Scholar] [CrossRef] [Green Version]
  48. Tong, X.; Salman, T. The Spatiotemporal Evolution Pattern and Influential Factor of Regional Carbon Emission Convergence in China. Adv. Meterol. 2020, 2020, 4361570. [Google Scholar] [CrossRef]
Figure 1. Method flow.
Processes 10 02236 g001
Figure 2. Schematic showing application of the proposed method to real data.
Processes 10 02236 g002
Figure 3. Location map of the Yangtze River Delta region, China.
Processes 10 02236 g003
Figure 4. Carbon emissions and GDP for three provinces and one city in the YRD Region from 2010 to 2019.
Processes 10 02236 g004
Figure 5. Carbon emission intensity of three provinces and one city in the YRD Region from 2010 to 2019.
Processes 10 02236 g005
Figure 6. Order degree of the carbon emission subsystems of three provinces and one city in the YRD Region from 2010 to 2019.
Processes 10 02236 g006
Figure 7. Synergetic degree of carbon emission subsystems in the Yangtze River Delta region from 2010 to 2019.
Processes 10 02236 g007
Table 1. Standard coal coefficient (SCC) and carbon emission coefficient (CEF) of eight fossil energy sources.
Fossil Fuel SCCCEF
Coal0.71430.7559
Coke0.97140.855
Crude oil1.42860.5538
Fuel oil1.42860.5857
Gasoline1.47140.5921
Kerosene1.47140.5714
Diesel1.45710.6185
Natural gas1.330.4483
Data derived from the China Energy Statistical Yearbook and IPCC Guidelines for National Greenhouse Gas Emission Inventory.
Table 2. Carbon emissions in the YRD Region from 2010 to 2019 (unit: 10,000 tons).
YearAnhuiJiangsuZhejiangShanghai
20108846.95018,571.62811,873.3267256.185
20119459.24121,375.96612,521.2667425.207
20129872.95821,738.42512,130.3047263.402
201310,641.62622,160.28212,128.9567546.453
201410,943.85821,995.72311,888.5706845.567
201510,969.50922,599.57912,018.6696814.508
201610,934.19723,512.39711,882.8516802.738
201711,277.66822,938.50712,388.8636917.151
201811,693.71222,498.58612,026.4306752.619
201911,762.77122,982.03412,218.8046949.425
Table 3. Carbon emission intensity of three provinces and one city in the YRD Region from 2010 to 2019.
Fossil Energy Emission Intensity in AnhuiFossil Energy Emission Intensity in JiangsuFossil Energy Emission Intensity in ZhejiangFossil Energy Emission Intensity in Shanghai
0.7160.4490.4330.416
0.6180.4380.3930.380
0.5740.4050.3530.353
0.5530.3730.3250.339
0.5250.3390.2970.284
0.4980.3170.2760.266
0.4530.3040.2510.241
0.4170.2670.2360.226
0.3440.2410.2070.207
Table 4. Order degree of the carbon emission subsystems of three provinces and one city in the YRD Region.
YearShanghaiAnhuiJiangsuZhejiang
20100.4250.0550.0420.291
20110.4840.1550.1600.498
20120.5060.2300.2540.362
20130.5780.3100.3530.401
20140.4360.4540.3690.421
20150.3150.6120.4360.438
20160.3310.7570.5310.433
20170.4050.8500.8190.610
20180.4100.9030.8830.424
20190.5390.9400.7390.528
Table 5. Synergetic degree of different subsystems in the YRD region.
Shanghai–AnhuiShanghai–JiangsuShanghai–ZhejiangAnhui–JiangsuAnhui–ZhejiangJiangsu–ZhejiangYangtze River Delta
0.0770.0840.1160.1090.1520.1650.013
0.1190.1310.0830.1930.1220.1340.016
0.1980.2190.1320.2820.1690.1870.037
0.0670.0600.0360.3610.2180.1980.013
0.2470.2080.1220.4690.2740.2310.057
0.2570.2150.1130.5860.3090.2580.066
0.1250.1240.0790.7860.5020.4960.062
0.1120.1120.0450.8440.3390.3380.038
0.3180.2820.1570.7860.4370.3880.123
Publisher’s Note: MDPI stays neutral with regard to jurisdictional claims in published maps and institutional affiliations.