Article

Numerical Analysis of the Vertical Crown Displacements in Triple Adjacent Tunnels with Rock Bolts and Pipe Roofings

1
Department of Civil Engineering, National Taipei University of Technology, No. 1, Sec. 3, Zhongxiao E. Rd., Taipei 10608, Taiwan
2
The Key Laboratory of Urban Security and Disaster Engineering of Ministry of Education, Beijing University of Technology, No. 100, Pingleyuan, Chaoyang District, Beijing 100124, China
3
Department of Civil Engineering and Geomatics, Cheng Shiu University, No. 840, Chengching Rd., Niaosong District, Kaohsiung 83347, Taiwan
4
Center for Environmental Toxin and Emerging-Contaminant Research, Cheng Shiu University, No. 840, Chengching Rd., Niaosong District, Kaohsiung 83347, Taiwan
5
Super Micro Mass Research and Technology Center, Cheng Shiu University, No. 840, Chengching Rd., Niaosong District, Kaohsiung 83347, Taiwan
*
Author to whom correspondence should be addressed.
Processes 2022, 10(10), 2062; https://doi.org/10.3390/pr10102062
Submission received: 29 July 2022 / Revised: 6 October 2022 / Accepted: 10 October 2022 / Published: 12 October 2022
(This article belongs to the Section Process Control and Monitoring)

Abstract

:
This study aimed to investigate the effects of installing pipe roofings and rock bolts before bench cuts during the excavation of a tunnel. The limited space available during excavation resulted in the formation of triple adjacent tunnels. To solve the issue of narrow spacing between the tunnels, middle posts were added for greater stiffness, and pipe roofings were installed to prevent collapse in tunnel sections with shallow overburden where the rock weathering was significant. PLAXIS 3D 2018, a finite element analysis program, was used to simulate the wall rock displacement during the bench cuts with pipe roofings and rock bolts installed. In addition, the difference between the presence and absence of bias pressure was studied. It was found that, in the absence of bias pressure, the tensile and compressive forces were symmetric from side to side. However, under bias pressure, the tensile force remained unchanged. Moreover, the compressive force under bias pressure was three times greater than without bias pressure and was concentrated at the sidewall of the eastbound tunnel and the crown of the mass rapid transit (MRT) tunnel. The results may be helpful for the design and construction of multiple adjacent tunnels in the future.

1. Introduction

Taiwan is located in the inter-extrusion zone of the Eurasian Plate and the Philippine Sea Plate, resulting in the development of orogeny and the formation of large mountainous areas. Due to the mountainous terrain and the lack of transportation land in the metropolitan area, tunnels of various lengths and sizes are found all over Taiwan. However, the geological age of Taiwan is relatively young, and the geological structures within its territory are quite different. Therefore, when selecting a site for the portal of a tunnel through a mountain, it is necessary to consider factors such as the connection of traffic routes, the ecological environment, and urban development. It is worth noting that these factors sometimes prevent ideal site selection for portals. Oftentimes, there are issues around the portal site, such as a location at a weak rock formation with shallow overburden and poor geological conditions [1]. Portal excavation often destroys the original balance of a mountain, resulting in bedding slip, collapse, etc. [2]. In such a case, many transportation projects adopt different methods such as setting rock bolts and pipe roofings to prevent collapsing due to violent deformation [3,4,5].
Tunnel construction inevitably changes the original equilibrium state of a rock mass, and the disturbed rock mass deforms into the excavated free surface until equilibrium is established [6,7]. If the rock mass cannot balance itself, tunnel support is required. Therefore, during tunnel construction, to ensure the safety of workers and the quality of the project, the displacement of each excavation stage must be monitored [8,9]. In view of this, the deformation behavior induced by tunnel excavation has been the focus of researchers [6,10]. Tunnel deformation usually includes deformation before, during, and after excavation. The longitudinal deformation profile (LDP) of a tunnel refers to its wall deformation along the tunnel axis before and after the excavation face [11,12]. Once the excavation face reaches a certain point, a portion of the maximum deformation of the tunnel wall, known as pre-deformation, has occurred. At the same time, the tunnel walls continue to move inward along the tunnel face to further extend beyond the point of interest. Therefore, the LDP can be used to determine the appropriate location for installing tunnel supports [13,14].
In the literature, many researchers have proposed a series of functions to describe the LDP. Some researchers have proposed an LDP function behind the circular tunnel face for elastic conditions [15,16]. Fang et al. [17] proposed an analytical model to study the longitudinal deformation profile (LDP) of deep tunnels under non-hydrostatic conditions. The proposed solution was verified by numerical simulations and LDP functions recommended by other researchers. Brady and Brown [18] assumed that the medium around a circular cross-section tunnel was a homogeneous, isotropic, continuous material, and used plane strain linear elasticity theory to derive the displacement of the surrounding rock or soil. Unlu and Gercek [19] used the finite difference method software FLAC3D to analyze the deformation behavior of circular-section tunnels in their elastic ranges and proposed a general form of normalized elastic radial displacement that occurs before and after excavation. Prassetyo and Gutierrez [20] compiled many well-known LDP equations and normalized the distance from the excavation face and the tunnel diameter for application and correction. Carranza-Torres and Fairhurst [12] derived a relationship between the displacement ratio and the excavation face distance that is suitable for estimating the displacement behind and in front of the excavation face. Song et al. [21] proposed a general numerical method for predicting longitudinal deformation profiles using a coupled viscoelastic–viscoplastic strain-softening model. Their method can account for the coupling between post-fault behavior and time-dependent behavior, thereby providing a new alternative for preliminary tunnel design.
Rock bolts and pipe roofing are widely used as supports for tunnel excavation. As far as the rock bolt is concerned, it penetrates deep into the surrounding rock and can constrain the development of the deformation of the deep internal surrounding rock. Furthermore, it can strengthen the shallow surrounding rock and control its expansion. In fact, the failure of rock bolts in rock and soil is not a single tensile failure but the result of the combined action of tension, shear, and bending [22]. Song et al. [23] proposed a double shear model and numerically simulated the shear performance of bolted rock joints. Their study revealed that the entire rock bolt deformed into the letter “U” under the shear loading between the two joints. Near the bolt–joint intersection, the rock bolt was partially deformed into the letter “Z”. In addition, the rock bolt had two critical points: one at the bolt–joint intersection, where the bending moment was zero, and the other at the maximum bending moment (plastic hinge), where the shear stress was zero. Ghadimi et al. [24] proposed an analytical solution to predict the displacement of a fully grouted rock bolt intersecting a single rock joint. The main features of the analytical model were taken into account for the bolt profile and joint motion under pull test conditions. The performance of the proposed analytical model was verified experimentally and compared with numerical modeling. The results showed good agreement between the analytical and numerical methods. In addition, the displacement rate between the rock bolt and the rock decreased exponentially. Xie et al. [25] proposed a model to analyze the face stability of rectangular excavations supported by roof-box jacking. Based on the limit equilibrium method, the model took into account the variation in the overburdened earth pressure acting on the slider due to the presence of the pipe roof. The proposed model was then used, together with the finite element software ABAQUS, to analyze the roof-box jacking excavation on Tianlin Road in Shanghai. The analysis showed that the results of the model were similar to those of the finite element analysis. Yokota et al. [26] proposed an energy-absorbing rock bolt, referred to as a deformation-controlled rock bolt (DC-bolt). The performance of the proposed DC-bolt was verified by numerical simulations and prototype laboratory tests using a discontinuous deformation analysis. Their research showed that the DC-bolt had a high load-bearing capacity and high deformability. In addition, the DC-bolt could limit the movement of the rock surface when it reached a certain level of displacement. Chen and Li [27] modified the original structural elements of the pile in FLAC3D to analyze the performances of rock bolts. For the interface between the bar and the binding grout, the bonding behavior was modeled using a trilinear constitutive relation. Then, the effectiveness of the modified pile elements was demonstrated by pull tests. Satisfactory correlations were obtained between the modeling and the physical results.
This study concerns the “Tunnel Section of the Second Phase of Ankeng No. 1 Road,” which has a total length of 174 m. The tunnel portal was located in a weak rock formation with shallow overburden due to major topographic fluctuations, and there was the issue of bias pressure, making the construction work even more difficult. A new tunnel was later added between the two planned tunnels due to the light rail route planning, and the result was a rare case of “triple adjacent tunnels,” as shown in Figure 1. For multiple tunnels, interactions cannot be avoided during construction [28,29,30]. For this, middle posts, bench cuts, and rock bolts were introduced to minimize the interactions due to the small spacing after excavation. In addition, due to the weak cementation of the rock mass, pipe roofings were installed at the crown of the tunnel before excavation.
As mentioned above, in studies on rock bolts and pipe roofings as tunnel supports, numerical simulations, including finite element, discrete element, and finite difference methods, are often used because their mathematical models are too complex to provide analytical solutions [23,24,25,26,27,28,29,30,31,32]. Therefore, a finite element analysis program was used to simulate the wall rock displacement during the bench cuts with pipe roofings and rock bolts installed.

2. Project Overview of the Case Study

2.1. Project Location and Scope

The “Tunnel Section of the Second Phase of Ankeng No. 1 Road” was selected as the subject of this study. It starts at Ankang Road, extends to the north, and connects with the “Ankeng No. 1 Road Phase I Tunnel Extension (Anxiang Road and Meikui Road).” Along the route, the tunnel passes under Shuanchen Road and Meikui Road. The route is 1.23 km long, and the tunnel stretches from Meikui Road to Antai Road between mileages 0 k + 126 and 0 k + 300, i.e., 174 m in total, as shown in Figure 2.

2.2. Tunnel Excavation

The new Austrian tunneling method was adopted for this tunnel, with the idea of deformation control. It is a bracing method that stabilizes the perimeter of the tunnel with the help of shotcrete, bolts, and other supports and uses regular monitoring to control the stability of the tunnel [33]. Its working principle is based on the arcing effect generated by the self-sustaining force of the rock mass. The deformation was kept within the allowable range using supports consisting of lightweight I-beams, shotcrete, and rock bolts, and the stresses in the rock mass reached equilibrium as the tunneling advanced. In the process of excavation, bench cuts were combined with the use of large machines, such as excavators and boring machines. On the whole, the construction speed was fast, the tunnel section was completed, and the stress conditions of the surrounding rock were good. These provided effective support for the project while minimizing the impact of tunnel excavation.
For the support system, the vertical stress was low since the overburden was shallow over the tunnel. However, the low rock strength and poor cementing could have led to excessive ground settlement and tunnel deformation. Therefore, a rigid supporting system was introduced to support the rock burden above. The supporting system consisted of rock bolts, steel supports, pipe roofings, and shotcrete.
There were three tunnels in this project: an eastbound tunnel, a westbound tunnel, and a light rail MRT tunnel. The three tunnels were next to one another due to the limited available space. Previous experience and literature indicated that interactions may result from close tunnels. Therefore, the excavation started with the two pilot tunnels with a small cross section, and middle posts were built as the foundation for the steel supports during the excavation of the main tunnels while reducing the cross section of the excavation.

3. Numerical Simulation Model

PLAXIS is a finite element software for analyzing structures interacting with soil or rock mass in geotechnical engineering. The software’s material parameters and boundary conditions are entered using a user-friendly interface. In particular, it effectively simulates the effects of rock bolts and pipe roofings on tunnels. Therefore, the PLAXIS 3D program was used as the numerical analysis tool to simulate the deformation caused by the excavation of the tunnel configured with rock bolts and pipe roofings. This case study involved the excavation of triple adjacent tunnels, which are rare in actual engineering. In order to reduce the mutual interference of the tunnels, intermediate walls were built between the tunnels to improve the stability of the tunnels. During the simulation process, based on the on-site construction flow chart, the excavation of the double-pilot tunnel and the construction of the intermediate wall were carried out first. Then, the excavation of the three main tunnels was simulated by means of stepped excavation. In this study, the simulated excavation length was 36 m, the round length was 1.2 m, and rock bolts and pipe roofings were set up. A summary of the entire numerical simulation is given below.

3.1. Material Model

Soil and rock often exhibit highly nonlinear behavior under loads. This nonlinear stress–strain behavior can be analyzed by numerical modeling. PLAXIS supports various models to simulate the behavior of soils and other continuums. In this study, the Mohr–Coulomb model and the Hoek–Brown model were used to simulate the geotechnical materials.
The Mohr–Coulomb model is the most common model for geological materials. This linear, elastic, perfectly plastic model is often used to simulate the behavior of soils [34]. The specification of this model and its yield criterion usually involve the Coulomb hypothesis, which assumes a linear relationship between shear strength on a plane and normal stress acting on it. The plastic flow rule built into PLAXIS is the non-associated flow rule. In other words, plastic strain occurs when the stress state reaches yielding, and the direction of the plastic strain increment is normal to the yield surface; the strain is perfectly elastic before the soil starts to yield.
Rocks and soil have different material properties, as rocks are usually harder, i.e., their rigidity is greater than that of soil. As a result, the behaviors observed in rock masses are different from those observed in soil materials. Furthermore, rock has the tensile property that soil does not have, and it is also nonlinear [35,36]. That is why it is common to use the Hoek–Brown criterion of failure to describe rock mass behavior. This criterion was developed by E. Hoek and E.T. Brown in 1980 [37] after hundreds of triaxial rock tests and field tests, and the shear strength and tensile strength of rock were considered the basis for the rock strength parameters. In PLAXIS, the theories proposed by a number of experts are referenced and used for a numerical analysis of the selected models.

3.2. Material Parameters

Before developing a mesh for a model to be used for calculations, the relevant soil and material parameters must be defined when building the model in PLAXIS. The simplified ground formation and material parameters for this study were collected from the design report/construction plan and boring report of “The second phase of Ankeng No. 1 Road, Xindian District, New Taipei City”. The parameters were converted for the Mohr–Coulomb and Hoek–Brown models. The rock mass parameters included: the general properties, deformation modulus, uniaxial compressive strength of rock, and geological strength index. Table 1 and Table 2 provide the parameters for the Mohr–Coulomb and Hoek–Brown models, respectively.
For the three main tunnels of this study (the eastbound tunnel, westbound tunnel, and MRT tunnel), the simulation was performed with shotcrete at 0.3 m thickness, whereas the shotcrete was 0.25 m thick for the two pilot tunnels. In addition, it was assumed that the tunneling advanced at the round length of 1.2 m. Furthermore, the unit weight, γ, and Poisson’s ratio, ν, were assumed to be the same for the main tunnels and the two pilot tunnels. The Young’s modulus of concrete, E, was converted according to the compressive strength of concrete (i.e., 27.5 MPa). Therefore, the Young’s modulus of concrete was determined to be 2.5 × 10⁷ kN/m2. However, based on previous construction experience, the Young’s modulus usually decreased. As a result, the Young’s modulus was 1/5 E. The unit weight of shotcrete, γ, was assumed to be 25 kN/m3, and Poisson’s ratio, ν, was assumed to be 0.17. On the other hand, the pipe roofings and rock bolts were simulated as embedded beams. The pipe roofings were spaced at 0.5 m, and the rock bolts were spaced at 2 m. Considering the thickness of steel pipes, the diameters were reduced a little for both the pipe roofings and rock bolts. The diameter of the pipe roofings was assumed to be 70 mm, and that of the rock bolts was assumed to be 23 mm. The parameters of the pipe roofings and the rock bolts are provided in Table 3.

3.3. Model Building Phase

The model used 10-node tetrahedral elements for the soil elements, and its units were selected as length: m; force: kN; time: day. The outer geometry dimensions of the model were 𝑋𝑚𝑎𝑥 = 80 m, 𝑋𝑚𝑖𝑛 = −80 m, 𝑌𝑚𝑎𝑥 = 84 m, 𝑌𝑚𝑖𝑛 = 0 m, Z𝑚𝑎𝑥 = 0 m, and Z𝑚𝑖𝑛 = −60 m. Two modes of Hoek–Brown and Mohr–Coulomb were used for the rock mass, and corresponding parameters were input for the different modes according to the field sampling. The lining was modeled using plate elements, as shown in Figure 3. The intermediate wall was simulated using a concrete model, as shown in Figure 4. The rock bolts and pipe roofings were simulated using embedded beams, as shown in Figure 5 and Figure 6, respectively. In addition, Figure 7 shows a cross sections of the pilot tunnel and eastbound tunnel with rock bolts and pipe roofings.
In the tunnel designer of the PLAXIS 3D program, the cross section of the middle double pilot tunnel was built first, and rock bolts and pipe roofings were added in the material settings. Then, the excavation trajectory was simulated. The last step was the excavation process. In addition, for the construction of the three main tunnels, additional dividing lines for stepped excavation were added to the part of the drawn line segment, and the rest were consistent with the pilot tunnel. After the settings were completed, the entire tunnel prototype could be generated, as shown in Figure 8. The next step was to divide the model’s soil and structures to form a grid, as shown in Figure 9. There are five types of mesh density, such as coarse, medium, and fine. Its roughness can be adjusted to differentiate the rock mass and structure, and it can be adjusted freely according to the required precision. To improve the precision of the structure, mesh refinement can be performed.

3.4. Numerical Calculation Phase

For multiple tunnels, it is evident that disturbances associated with tunnel construction alter the properties of the surrounding geotechnical area, thereby affecting the effectiveness of subsequent tunneling operations through that geotechnical area [30]. In the numerical calculation phase, the finite element calculation was divided into several successive calculation phases. Each calculation phase corresponded to a specific loading or construction stage, and the steps were as follows:
(a)
Initial state: all initial states are defaulted, including the generation of geotechnical elements.
(b)
Construction of the two pilot tunnels’ pipe roofings: pipe roofings (12 m) are arranged above the top arch of the two pilot tunnels, as shown in Figure 10.
(c)
Excavation of the two pilot tunnels: excavate the soil ([email protected] m, which means that each round length is 1.2 m, with a total of 21 round lengths) on the excavation surface and apply the lining of the plate elements, as shown in Figure 11.
(d)
Construction of the intermediate wall of two pilot tunnels: pour the concrete intermediate walls from the 1st to the 21st round and replace the soil with concrete elements.
(e)
Construction of the pipe roofings of the main tunnel: consistent with the construction of the two pilot tunnels, the pipe roofings (12@12 m) were simulated with embedded beams above the top arch.
(f)
MRT tunnel excavation: Excavate the soil body ([email protected] m) on the excavation surface according to the sequence of the stepped excavation, apply the lining to the slab elements, and activate the rock bolts of the embedded beams. At the same time, remove half of the shotcrete, rock bolts, and pipe roofings in each of the east and west pilot tunnels, as shown in Figure 12.
(g)
Eastbound tunnel excavation: Excavate the soil body ([email protected] m) on the excavation surface according to the sequence of the stepped excavation and apply the lining of the plate element. At the same time, remove the other half of the shotcrete, rock bolts, and pipe roofings in the east pilot tunnel.
(h)
Westbound tunnel excavation: Excavate the soil body ([email protected] m) on the excavation surface according to the sequence of the stepped excavation and apply the lining of the slab elements. At the same time, remove the other half of the shotcrete, rock bolts, and pipe roofings in the west pilot tunnel.
Figure 13 shows the various excavation stages, where the Roman numerals indicate the excavation stages. Stage I is the completion of the two pilot tunnels. Stage II represents the excavation of the main 12 m tunnel. Stage III means that all main tunnels are excavated in three rounds, and so on. There was a total of 10 stages, and the total simulated excavation length was 36 m.

4. Triple Adjacent Tunnel Excavation Analysis

4.1. Comparison of Analysis Results of the Mohr–Coulomb Model and Hoek–Brown Model

The tunnel studied in this paper is located in Xindian District, New Taipei City. The rock formation is mainly composed of sandstone and shale. Its rock cover depth is between 3 and 36 m, and the water depth is about −25 m. The tunnel entrance has the characteristics of shallow cover and bias pressure. Therefore, in the simulation, the analysis was carried out according to the parameters provided in the drilling report, planning and design documents, and construction configuration drawings.
The tunnel excavation led to the release of the internal stress of the rock mass, resulting in the subsidence of the rock mass of the tunnel roof. Simulations were carried out with the input material parameters, and the vertical displacement (uz) during excavation was calculated. The simulation results were compared with the field monitoring data, as shown in Figure 14. It is shown in these figures that the displacements obtained by the Mohr–Coulomb and Hoek–Brown models were not significantly different under bias pressure. In addition, it is clear in the figures that the radial displacement increased significantly at 30–35 m along the westbound tunnel. This could have been the sudden increase in overburden depth due to the obvious variation in terrain.
Figure 15 provides a comparison of the total displacement of the tunnels in the Mohr–Coulomb model and the Hoek–Brown model with the excavation stage under biased pressure. It can be seen in the figure that the displacement increased significantly from stage I to stage II, and the rate of increase gradually decreased during the following excavation stages. The displacement in the Hoek–Brown model was less than that in the Mohr–Coulomb model, but the difference was not significant. According to the in situ monitoring data, the displacement was 71 mm, whereas the displacements in the Hoek–Brown and Mohr–Coulomb models were 71.05 and 71.5 mm, respectively. Therefore, the subsequent analysis in the following subsections is based on the simulation results of the Hoek–Brown model.

4.2. Comparison of Analytical Results between Tunnels with and without Bias Pressure

When a tunnel is in a biased environment due to topographic and geological factors, its lining is subjected to uneven loads, resulting in the shear failure of the lining structure. The stresses in the surrounding rock of a tunnel are released considerably under biased pressure and tunnel excavation. The rock mass may slide to the shallow overburden side if it is weak and water content increases after a shower, which may lead to lateral displacement or deformation by crushing at the portal area. Therefore, the biased and unbiased situations generated by the terrain are discussed. Schematic diagrams of the simulation under biased and unbiased conditions are shown in Figure 16 and Figure 17, respectively. The coverage height of the rock mass was mainly determined based on the drilling data. In PLAXIS, the soil cover height was simulated according to the drilling data.
Figure 18 shows the shading distribution diagram of the total displacement in the surrounding rocks with and without biased pressure. Figure 18a shows that the displacement distribution of the entire analysis area presented a symmetrical distribution pattern about the centerline of the MRT tunnel in the unbiased case. In addition, Figure 18b shows that the displacement was concentrated along the eastbound tunnel for the simulation in the biased case.
For the three main tunnels with pipe roofings, the displacement of the pipe roofings at different positions with and without biased pressure was investigated. The locations of the analyzed pipe roofings with lengths of 12 m from the start point to the end point are shown in Figure 19. These pipe roofings were set between mileages 0 k + 21 and 0 k + 33. In the case of unbiased pressure, the displacements for selected pipe roofings at the tops of the three main tunnels are shown in Figure 20. The displacement of the pipe roofings refers to the displacement towards the radial direction of the tunnel. In the case of biased pressure, the displacements for selected pipe roofings at the tops of the three main tunnels are shown in Figure 21. It is clear from Figure 20 that, in the absence of bias pressure, the pipe roofings experienced the largest displacement at the crown, which probably came from the vertical stresses. The displacements of the “a and i pipe roofings on both sides were similar to that of the crown. However, the displacement was smaller where the pilot tunnel met the main tunnel. This could have been because the pipe roofings above had been subject to part of the vertical stresses. It is also shown in Figure 20 that the displacement decreased gradually as the longitudinal distance increased for the pipe roofings. This could have been because the displacement of the excavation face was smaller than that behind the excavation face or because the overlapping of the pipe roofings caused the displacement to reduce. It can be observed in Figure 21 that the displacement of pipe roofings located at the crown was greatest under bias pressure. However, the displacement did not decrease as the longitudinal distance of pipe roofings increased because of the changes in terrain. Therefore, it was found that the overburden depth, water table depth, and geological structure are factors of influence.
For the three main tunnels with rock bolts, the displacements of the rock bolts at different positions without and with biased pressure were investigated. The locations of the analyzed rock bolts with lengths of 6 m from the start point to the end point are shown in Figure 22. These rock bolts were set at mileage 0 k + 21. In the case of no bias pressure, the displacements for selected rock bolts at the tops of the three main tunnels are shown in Figure 23. In the case of bias pressure, the displacements for selected rock bolts at the tops of the three main tunnels are shown in Figure 24. The displacement of rock bolts refers to the displacement towards the radial direction of the tunnel. It is clear in Figure 23 that the rock bolt displacement was the highest with unbiased crown pressure, which was probably due to the vertical stresses. On both sides, the displacements of the “a and i rock bolts were subjected to the largest influence of horizontal stresses. In addition, it is shown in the figures that the displacement was small at the rock bolt end of the unbiased crown pressure, and the closer to the tunnel lining (0 m), the greater the displacement. It is shown in Figure 24 that the rock bolt deformation was also the largest at the crown with bias pressure. Unlike under unbiased pressure, the displacement was provided by horizontal stresses.

5. Discussion of Results

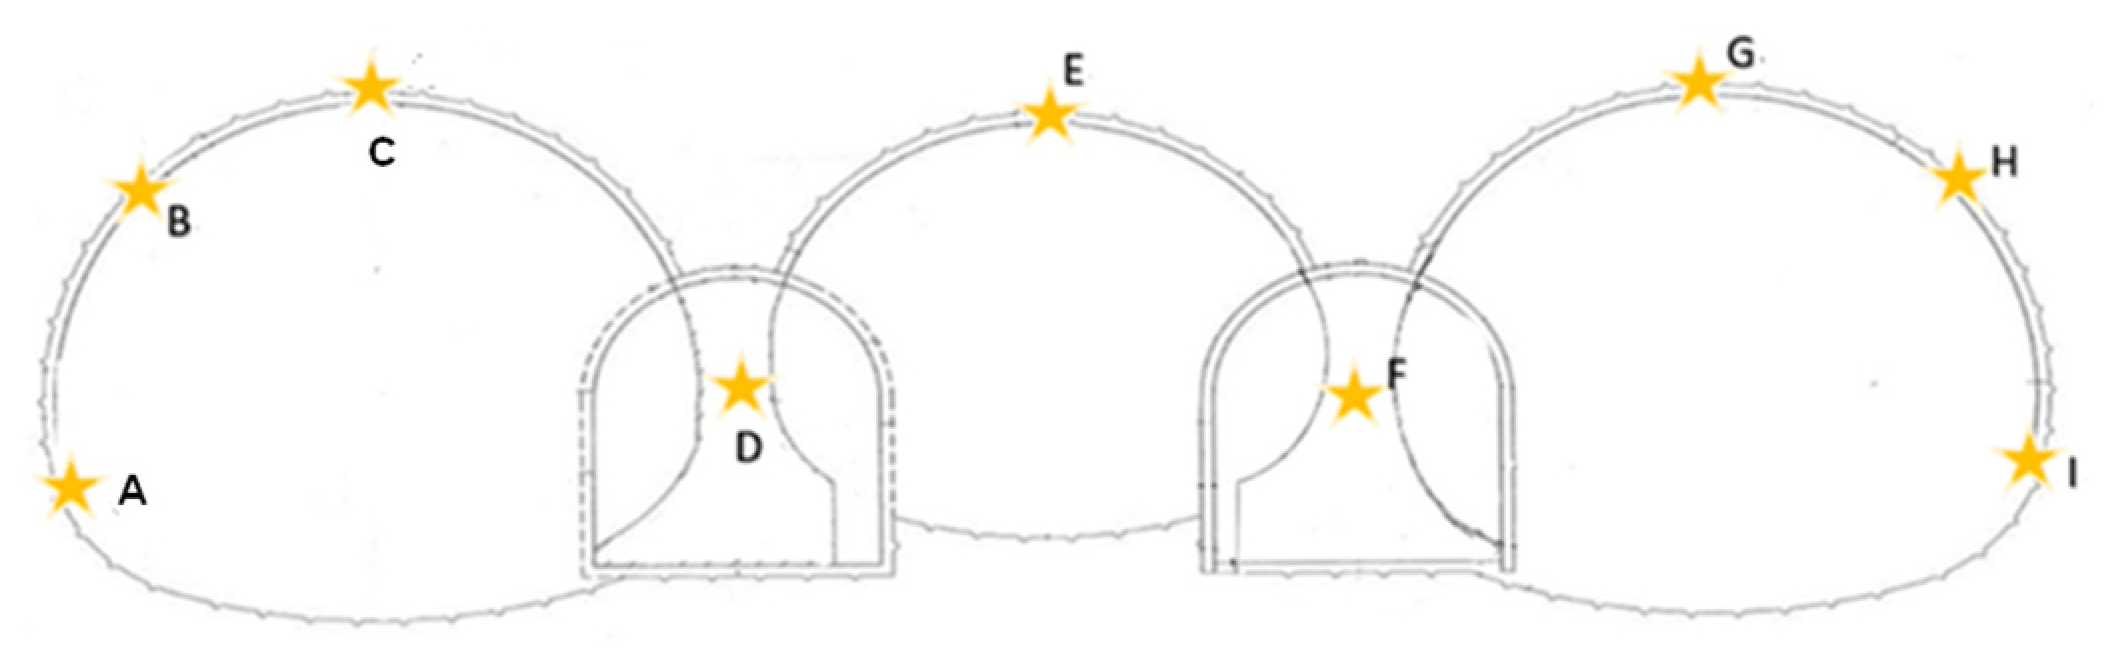
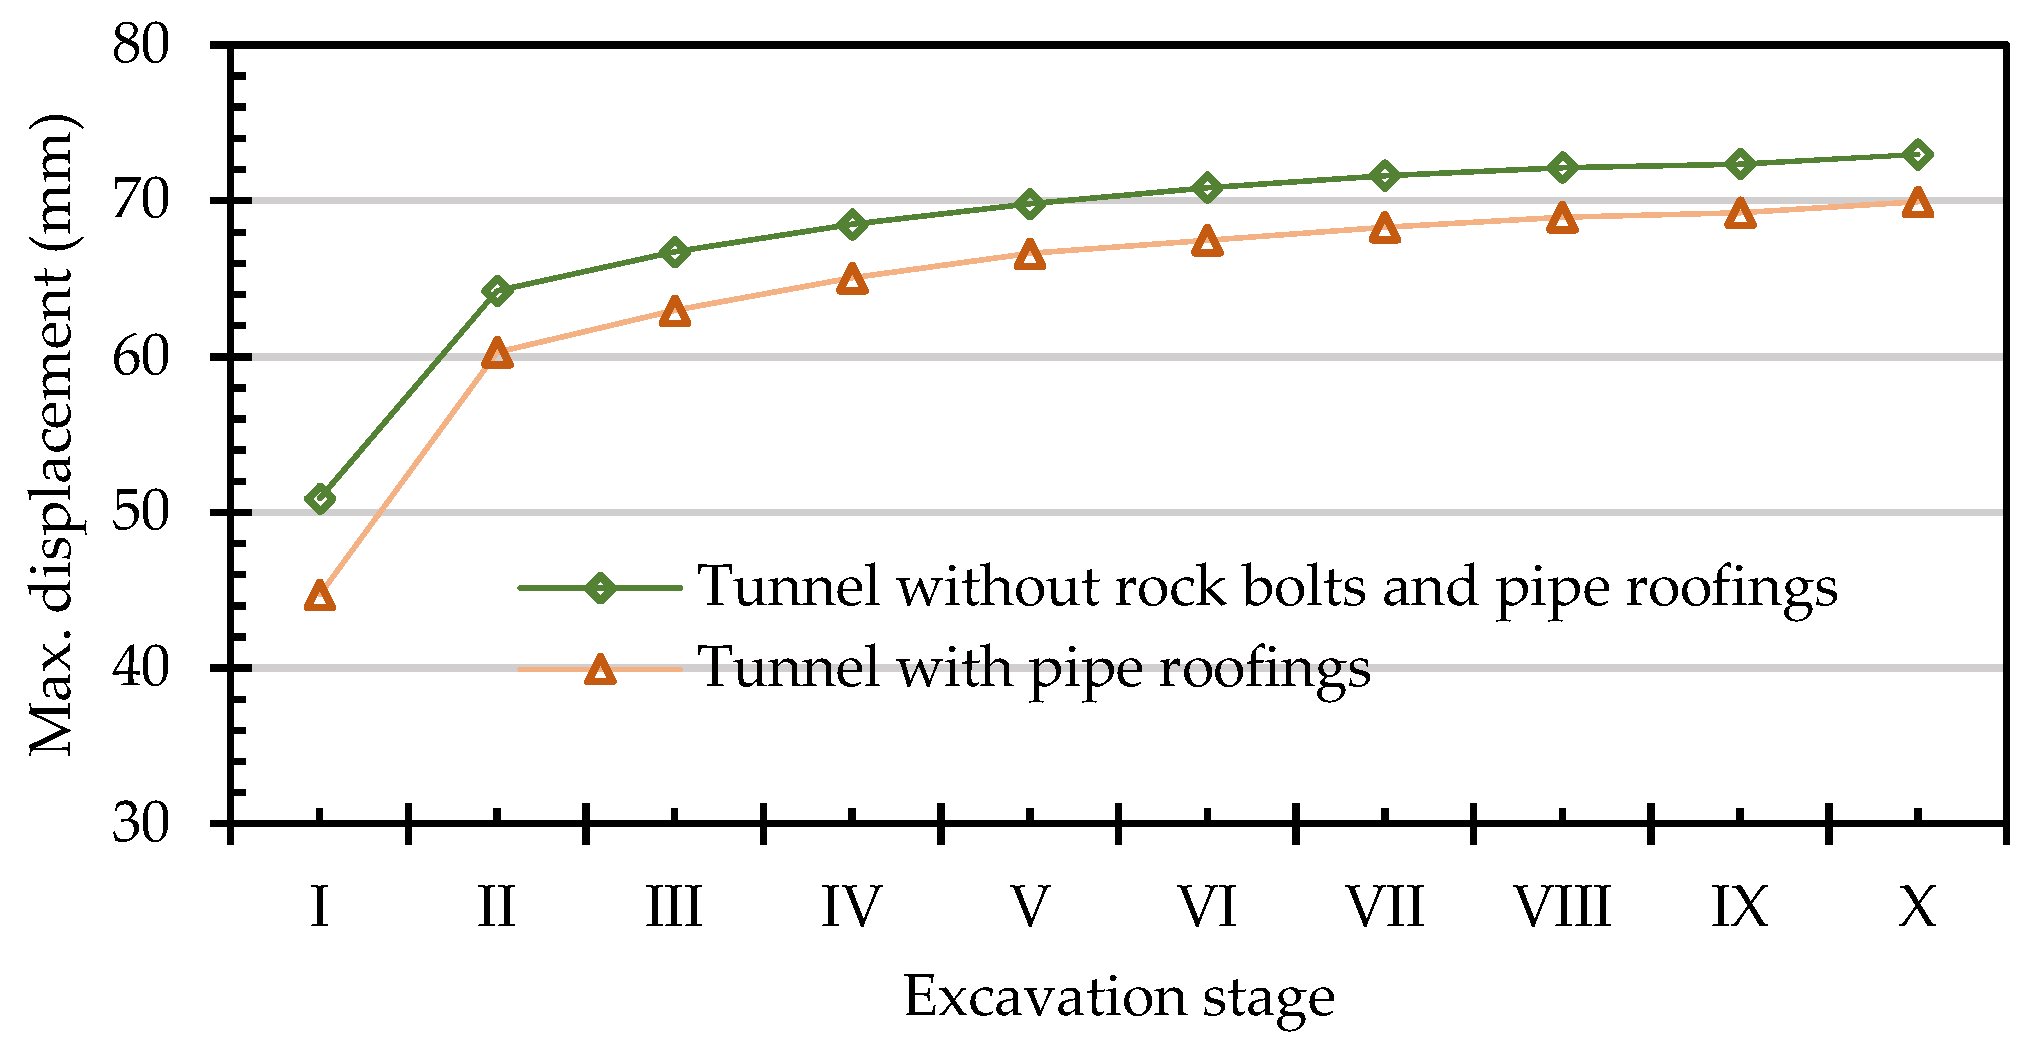
5.1. Pipe Roofing Installation Benefit Analysis

Pipe roofings were introduced in this case to prevent crown collapse since the geology was loose and the cementing was poor. This section breaks down the benefits of installing pipe roofings under biased pressure. A comparison was performed between cases with and without pipe roofings. The displacement and displacement reduction ratio (DRR) at various locations were analyzed for both, as shown below.
DRR = | displacement   without   supports | | displacement   with   supports | | displacement   without   supports | × 100 %
Figure 25 shows the locations of the pipe roofings for analysis. Figure 26 provides the largest total displacement at locations A–I, as presented in Figure 25. In Figure 26, the blue squares indicate areas without pipe roofings and the orange triangles indicate areas with pipe roofings only. Figure 26 suggests that the crown displacement was the largest in the MRT tunnel. With the installation of the pipe roofings, the DRR at locations A–I was between 5.9% and 17.5%, as shown in Figure 27. This indicated that the pipe roofings could effectively reduce the displacement of the tunnel roof and side arches. Figure 28 shows the largest displacements with and without pipe roofings at various excavation stages. It is shown in the figure that the total wall rock displacement accounted for 50–70% of the total displacement of the excavation as the pilot tunnel was completed and the excavation of the main tunnels started. The reason why the analysis curves of the two are relatively flat is that the simulation process was conducted using back-and-forth excavation.
Figure 29 shows the wall rock displacement with and without pipe roofings in shading distribution diagrams. It can be seen in Figure 29 that, with or without the pipe roofings, the more significant surrounding rock displacements were concentrated in the eastbound tunnel. This result was caused by bias pressure. Furthermore, the total displacement of the surrounding rock was significantly lower in the tunnels with pipe roofings than in the tunnels without pipe roofings.

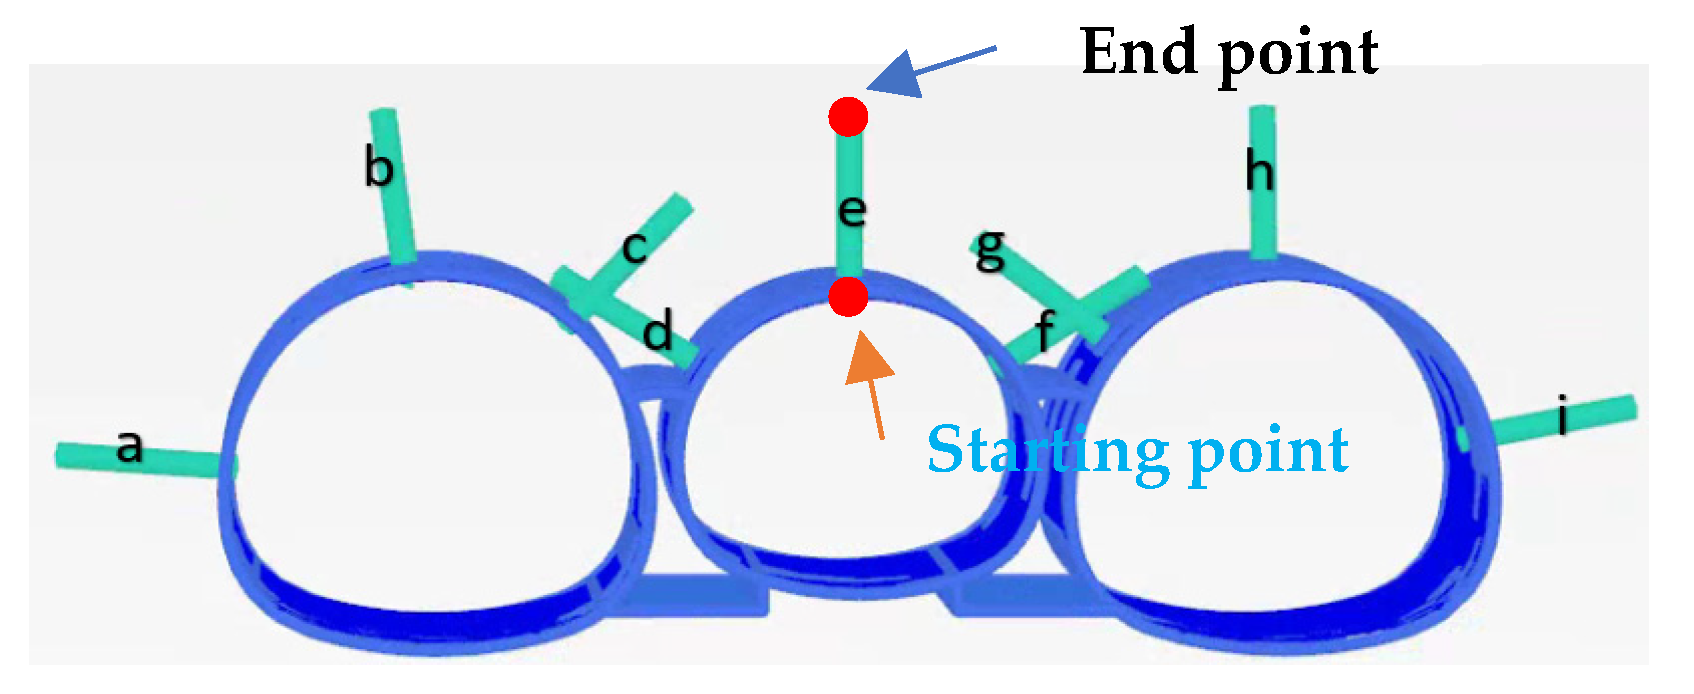
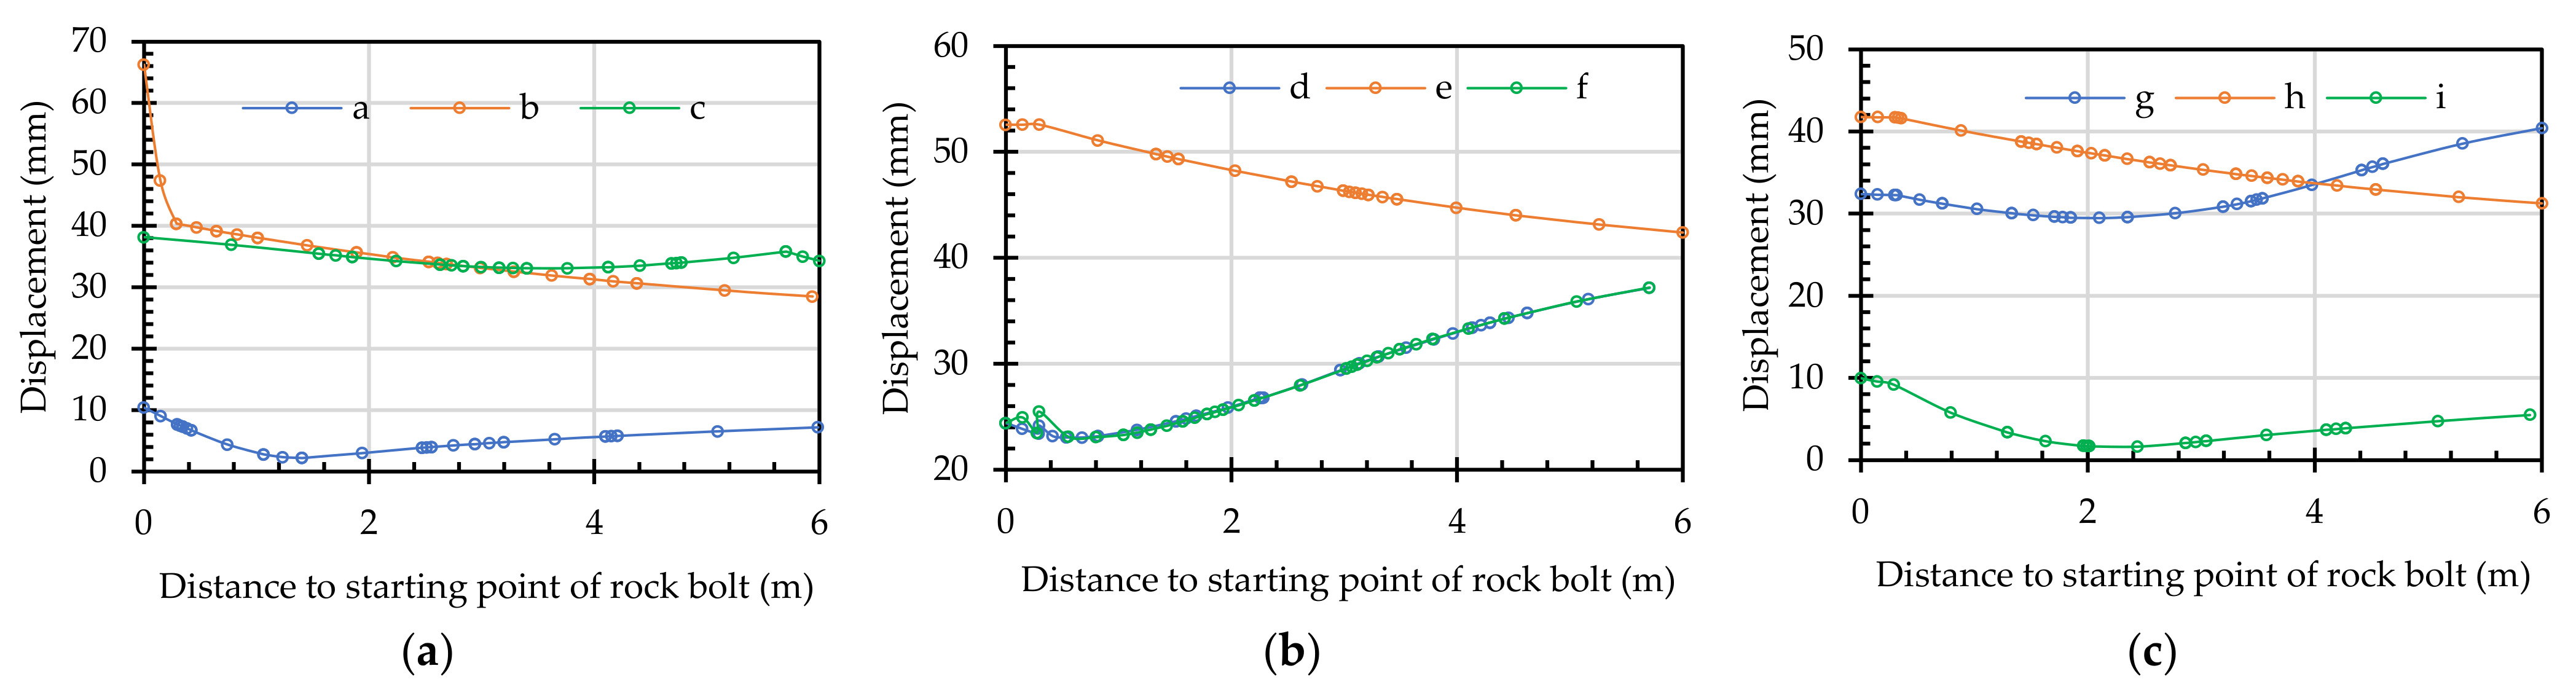
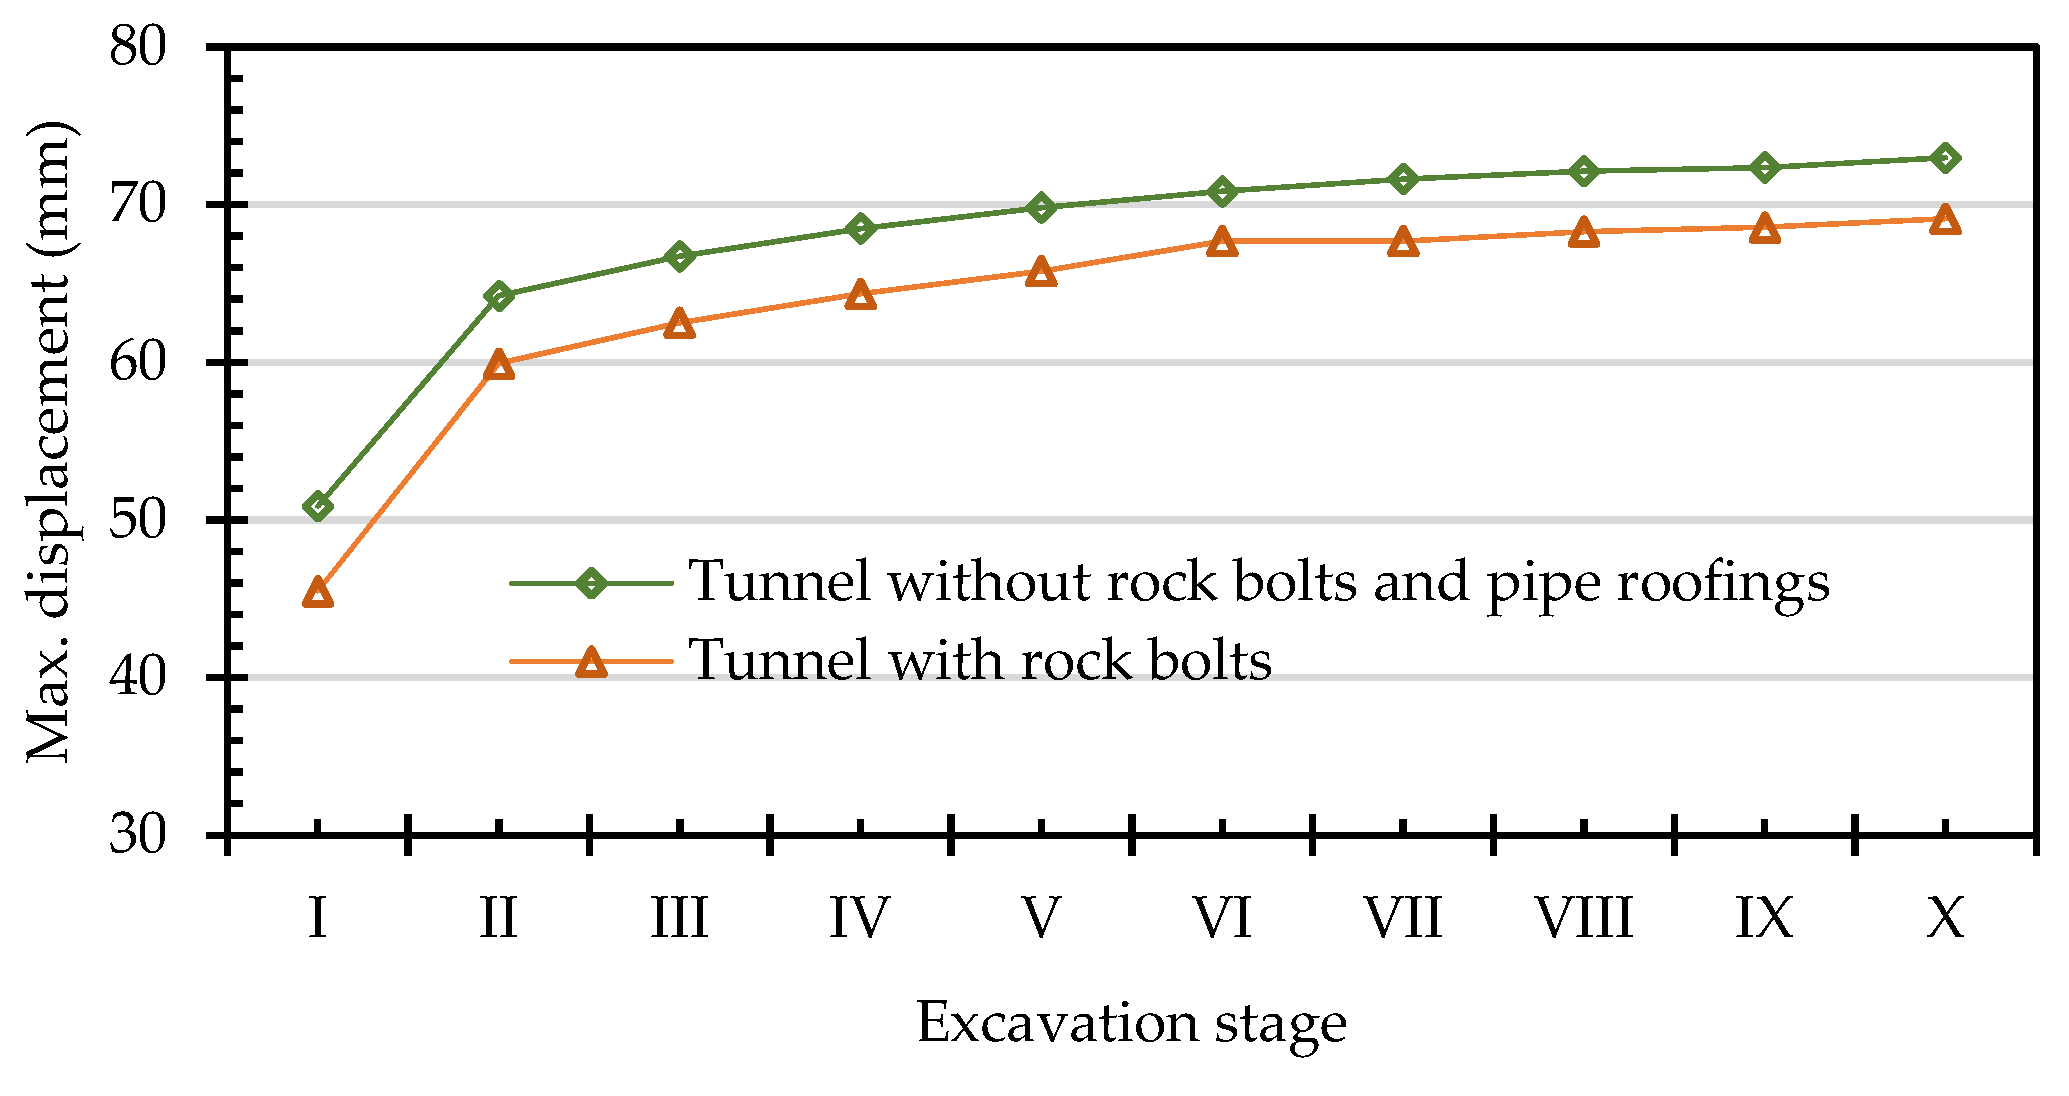
5.2. Rock Bolt Installation Benefit Analysis

The terrain factor in this case required rock bolts for the improvement of the stability of the entire rock mass and tunnel. Therefore, this section investigates the influence of rock bolts. For the actual tunnel case with rock bolts and the simulated tunnel case without rock bolts, the displacement and the displacement reduction ratio (DRR) at different points are compared. Figure 25 shows the locations of the rock bolts for analysis. Figure 30 provides the total displacements without rock bolts and with rock bolts alone. It was learned from the figures that the displacement was relatively large at the crown with or without rock bolts. The displacement in the sidewalls in both the eastbound and westbound tunnels was relatively small without rock bolts. However, the DRR was significant for the sidewalls and was inverted in the eastbound and westbound tunnels with rock bolts installed. The DRR in Figure 31 suggests that the reduction percentage was the largest on the bias pressure side. Clearly, the installation of rock bolts helped between the crowns and sidewalls of the tunnels.
Figure 32 provides the maximum displacement at various excavation stages with and without rock bolts. It was learned from the figure that the displacement increased with the advancement of excavation. After the pilot tunnel was constructed and the 12 m main tunnel was excavated, the displacement increase rate of the tunnel gradually became flat. The wall rock displacement curves for the scenarios with and without rock bolts suggest that the installation of rock bolts had a certain influence on the interactions of tunnel displacement. Figure 33 shows the total wall rock displacement, |u|, with and without rock bolts. Clearly, the installation of rock bolts allowed less wall rock displacement compared to the situation without rock bolts.

6. Conclusions

In this paper, the PLAXIS 3D program was used to simulate the wall rock displacement in triple adjacent tunnels, and the simulation results were compared with the actual monitoring values in the field. The effects of the rock bolts and pipe roofings on the tunnel were also investigated. Based on the analysis results, the following conclusions are drawn:
(1)
The analysis performed for this study indicated that both constitutive models produced extremely similar results. From this point of view, both models could be applied to the rock formation in similar studies, provided that the analysis method, parameter conversion, and selection are appropriate.
(2)
The loading and deformation at various locations with and without bias pressure suggested that the maximum pipe roofing displacement occurred at the crown, and the closer to where the main tunnels and pilot tunnel met, the smaller the displacement, which could have been because the pipe roofings above took a certain portion of the vertical stresses. In the case of unbiased pressure, the displacement was clearly greater at the starting point (0 m) of the pipe roofings than that at the end (12 m). This could have been due to the distance from the excavation face and the excavation duration.
(3)
The comparison between cases with and without pipe roofings at various locations revealed that the pipe roofings could effectively reduce the displacement of the tunnel roof and side arches.
(4)
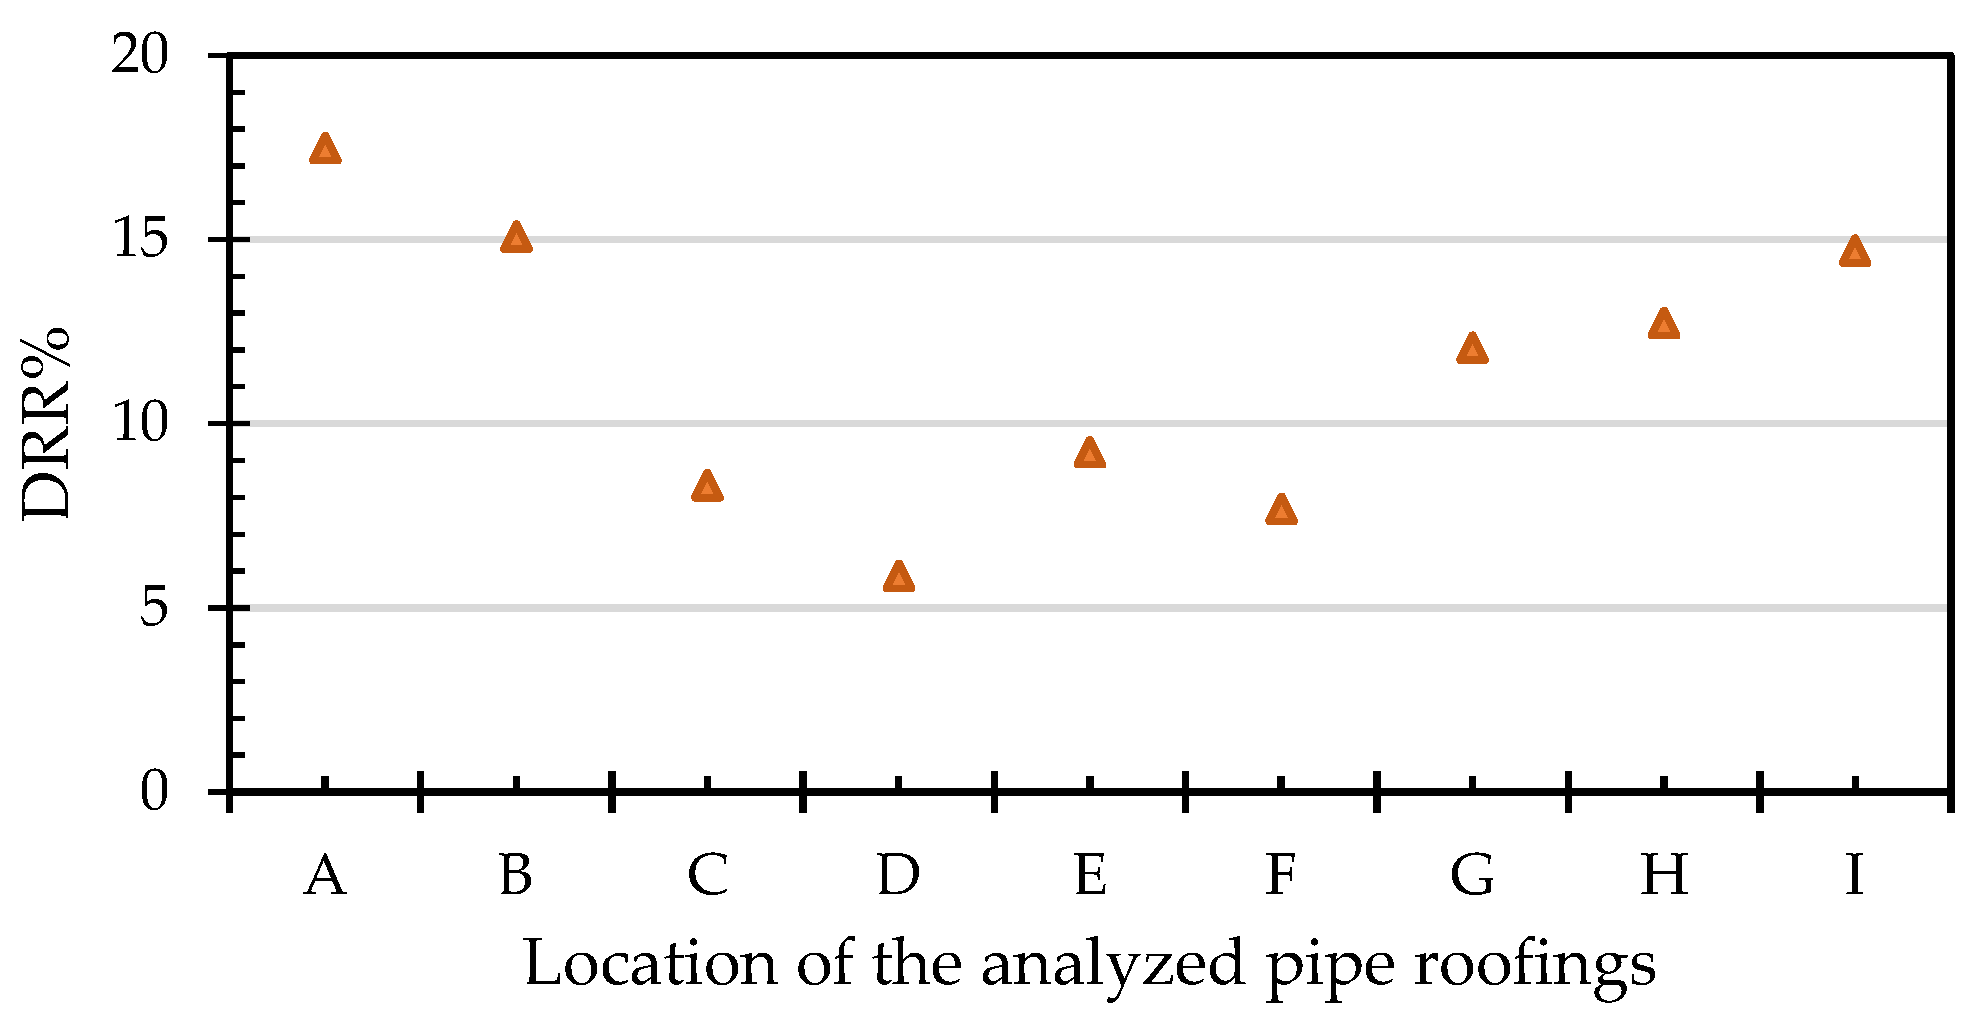
The comparison between cases with and without rock bolts at various locations revealed that the DRR was between 5.9% and 17.5%. This indicated that the installation of rock bolts could suppress the deformation around the sidewalls of the tunnels. Moreover, the installation of rock bolts also improved the overall stiffness of the rock mass.
(5)
For the crown of the westbound tunnel, the DRR for the pipe roofings was 8.3% and the DRR for the rock bolts was 11.7%. For the crown of the eastbound tunnel, the DRR for the pipe roofings was 12.1% and the DRR for the rock bolts was 13.8%. The results show that the effect of applying rock bolts was better than that of applying pipe roofings.
The research results show that the installation of pipe roofings and rock bolts could reduce the tunnel displacement. However, it is worth mentioning that the stability of the tunnel must also be considered when selecting a specific excavation support technique. This topic remains to be further explored.

Author Contributions

Conceptualization, S.-L.C.; methodology, C.-W.T.; software, Y.-H.T. and X.-L.Z.; validation, Y.-Y.H. and Y.-H.T.; formal analysis, C.-W.T. and Y.-Y.H.; investigation, S.-L.C. and Y.-H.T.; resources, S.-L.C. and X.-L.Z.; data curation, C.-W.T. and Y.-H.T.; writing—original draft preparation, C.-W.T.; writing—review and editing, C.-W.T.; visualization, S.-L.C.; supervision, C.-W.T. and Y.-Y.H.; project administration, S.-L.C.; funding acquisition, S.-L.C. All authors have read and agreed to the published version of the manuscript.

Funding

This research was supported by the Ministry of Science and Technology of Taiwan, grant number MOST 110-2221-E-027-025-MY2.

Institutional Review Board Statement

Not applicable.

Informed Consent Statement

Not applicable.

Data Availability Statement

The data presented in this study are available upon request from the corresponding author.

Acknowledgments

The authors sincerely thank the Ministry of Science and Technology of Taiwan for funding this research work.

Conflicts of Interest

The authors declare no conflict of interest.

References

  1. Luo, Y.; Chen, J.; Liu, B.; Chen, L.; Xie, J. Analysis of Pipe-Roof in Tunnel Exiting Portal by the Foundation Elastic Model. Math. Probl. Eng. 2017, 2017, 9387628. [Google Scholar] [CrossRef] [Green Version]
  2. Li, L.P.; Lei, T.; Li, S.C.; Xu, Z.H.; Xue, Y.G.; Shi, S.S. Dynamic risk assessment of water inrush in tunnelling and software development. Geomech. Eng. 2015, 9, 57–81. [Google Scholar] [CrossRef]
  3. Sun, B.J.; Liu, Q.W.; Li, W.T.; Yang, X.Z.; Yang, B.; Li, T.C. Numerical implementation of rock bolts with yield and fracture behaviour under tensile-shear load. Eng. Fail. Anal. 2022, 139, 10646. [Google Scholar] [CrossRef]
  4. Li, J.; Tan, Z.; Yu, Y.; Ni, L. Analysis of deformation monitoring and mechanical behaviors of big pipe-roof for shallow buried large-span tunnel to underpass highway. J. Rock Mech. Eng. 2011, 30, 3002–3008. [Google Scholar]
  5. Hisatake, M.; Ohno, S. Effects of pipe roof supports and the excavation method on the displacements above a tunnel face. Tunn. Undergr. Space Technol. 2008, 23, 120–127. [Google Scholar] [CrossRef]
  6. Cheng, X.; Hong, T.; Lu, Z.; Cheng, X. Characterization of Underlying Twin Shield Tunnels Due to Foundation-Excavation Unloading in Soft Soils: An Experimental and Numerical Study. Appl. Sci. 2021, 11, 10938. [Google Scholar] [CrossRef]
  7. Huang, X.; Schweiger, H.F.; Huang, H.W. Influence of deep excavations on nearby existing tunnels. Int. J. Geomech. 2013, 13, 170–180. [Google Scholar] [CrossRef]
  8. Zhang, J.F.; Chen, J.J.; Wang, J.H.; Zhu, Y.F. Prediction of tunnel displacement induced by adjacent excavation in soft soil. Tunn. Undergr. Space Technol. 2013, 36, 24–33. [Google Scholar] [CrossRef]
  9. Zhang, X.H.; Wei, G.; Jiang, C.W. The study for longitudinal deformation of adjacent shield tunnel due to foundation pit excavation with consideration of the retaining structure deformation. Symmetry 2020, 12, 2103. [Google Scholar] [CrossRef]
  10. Han, K.; Wang, X.; Hou, B.; Lin, X.; Cao, C. Analysis of Instability Mode and Limit Support Pressure of Shallow Tunnel Face in Sands. Symmetry 2020, 12, 2067. [Google Scholar] [CrossRef]
  11. Carranza-Torres, C.; Fairhurst, C. Application of the convergence-confinement method of tunnel design to rock masses that satisfy the Hoek-Brown failure criterion. Tunn. Space Technol. 2000, 15, 187–213. [Google Scholar] [CrossRef]
  12. Luo, Y.B.; Chen, J.X.; Chen, Y.; Diao, P.S.; Qiao, X. Longitudinal deformation profile of a tunnel in weak rock mass by using the back analysis method. Tunn. Undergr. Space Technol. 2018, 71, 478–493. [Google Scholar] [CrossRef]
  13. Vlachopoulos, N.; Diederichs, M.S. Improved longitudinal displacement profiles for convergence confinement analysis of deep tunnels. Rock Mech. Rock Eng. 2009, 42, 131–146. [Google Scholar] [CrossRef]
  14. Song, S.G.; Li, S.C.; Li, L.P.; Zhang, Q.Q.; Wang, K.; Zhou, Y.; Liu, H.L. Study on longitudinal deformation profile of rock mass in a subsea tunnel. Mar. Georesour. Geotechnol. 2016, 34, 376–383. [Google Scholar] [CrossRef]
  15. Corbetta, F.; Bernaud, D.; Nguyen Minh, D.N. Contribution à la méthode convergence-confinement par le principe de la similitude. Rev. Franc. Geotech. 1991, 54, 5–11. (In French) [Google Scholar] [CrossRef] [Green Version]
  16. Panet, M. Understanding deformations in tunnels. Compr. Rock Eng. 1993, 1, 663–690. [Google Scholar]
  17. Fang, Q.; Wang, G.; Yu, F.; Du, J. Analytical algorithm for longitudinal deformation profile of a deep tunnel. J. Rock Mech. Geotech. Eng. 2021, 13, 845–854. [Google Scholar] [CrossRef]
  18. Brady, B.H.G.; Brown, E.T. Rock Mechanics for Underground Mining, 2nd ed.; Chapman and Hall: London, UK, 1993. [Google Scholar]
  19. Unlu, T.; Gercek, H. Effect of Poisson’s ratio on the normalized radial displacements occurring around the face of a circular tunnel. Tunn. Space Technol. 2003, 18, 547–553. [Google Scholar] [CrossRef]
  20. Prassetyo, S.H.; Gutierrez, M. Axisymmetric alternating direction explicit scheme for efficient coupled simulation of hydro-mechanical interaction in geotechnical engineering—Application to circular footing and deep tunnel in saturated ground. J. Rock Mech. Geotech. Eng. 2018, 10, 259–279. [Google Scholar] [CrossRef]
  21. Song, F.; Rodriguez-Dono, A.; Olivella, S.; Zhong, Z. Analysis and modelling of longitudinal deformation profiles of tunnels excavated in strain-softening time-dependent rock masses. Comput. Geotech. 2020, 125, 103643. [Google Scholar] [CrossRef]
  22. Chen, Y.; Li, C.C. Performance of fully encapsulated rebar bolts and D-Bolts under combined pull-and-shear loading. Tunn. Undergr. Space Technol. 2015, 45, 99–106. [Google Scholar] [CrossRef]
  23. Song, H.; Duan, Y.; Yang, J. Numerical simulation on bolted rock joints shearing performance. Min. Sci. Technol. 2010, 20, 460–465. [Google Scholar] [CrossRef]
  24. Ghadimi, M.; Shahriar, K.; Jalalifar, H. A new analytical solution for the displacement of fully grouted rock bolt in rock joints and experimental and numerical verifications. Tunn. Undergr. Space Technol. 2015, 50, 143–151. [Google Scholar] [CrossRef]
  25. Xie, X.; Zhao, M.; Shahrour, I. Face stability model for rectangular large excavations reinforced by pipe roofing. Tunn. Undergr. Space Technol. 2019, 94, 103132. [Google Scholar] [CrossRef]
  26. Yokota, Y.; Zhao, Z.; Nie, W.; Date, K.; Iwano, K.; Koizumi, Y.; Okada, Y. Development of a new deformation-controlled rock bolt: Numerical modelling and laboratory verification. Tunn. Undergr. Space Technol. 2020, 98, 103305. [Google Scholar] [CrossRef]
  27. Chen, J.; Li, D. Numerical simulation of fully encapsulated rock bolts with a tri-linear constitutive relation. Tunn. Undergr. Space Technol. 2022, 120, 104265. [Google Scholar] [CrossRef]
  28. Mahdi, M.; Shariatmadari, N. Construction Procedures Evaluation of Three Adjacent Tunnels and Excavation Step Effects. Int. J. Civ. Environ. Eng. 2014, 8, 86–90. [Google Scholar]
  29. Pande, G.N.; William, J.R. Numerical Methods in Rocks Mechanics; John Wiley and Sons Ltd.: Hoboken, NJ, USA, 1990. [Google Scholar]
  30. Chang, C.T.; Lee, M.C.; Hou, P.C. Design of twin-tube tunnel through soft rock. In Geotechnical Aspects of Underground Construction in Soft Ground; Mair, R.J., Taylor, R.N., Eds.; Balkema: Rotterdam, The Netherlands, 1996; pp. 251–255. [Google Scholar]
  31. Grasselli, G. 3D Behaviour of bolted rock joints:experimental and numerical study. Int. J. Rock Mech. Min. Sci. 2005, 42, 13–24. [Google Scholar] [CrossRef]
  32. Jalalifar, H.; Aziz, N. Analytical behaviour of bolt-joint intersection under lateral loading conditions. Rock Mech. Rock Eng. 2010, 43, 89–94. [Google Scholar] [CrossRef]
  33. Ahmad, A.; Ahirwar, N.; Sinha, M. New Austrian Tunneling Method (NATM) in Himalayan Geology: Emphasis on Execution Cycle Methodology. Int. J. Eng. Res. Technol. 2019, 8, 39–52. [Google Scholar]
  34. Robert, D.J. A Modified Mohr-Coulomb Model to Simulate the Behavior of Pipelines in Unsaturated Soils. Comput. Geotech. 2017, 91, 146–160. [Google Scholar] [CrossRef]
  35. Brinkgreve, R.B.J.; Kumarswamy, S.; Swolfs, W.M. Plaxis Material Models Manual; Plaxis B.V.: Delft, The Netherlands, 2017; pp. 35–53. [Google Scholar]
  36. Erik, E. The Hoek-Brown failure criterion. Rock Mech. Rock Eng. 2012, 45, 981–988. [Google Scholar]
  37. Hoek, E.; Brown, E.T. Empirical strength criterion for rock masses. J. Geotech. Eng. Div. 1980, 106, 1013–1035. [Google Scholar] [CrossRef]
Figure 1. Standard cross section of Ankeng Tunnel.
Processes 10 02062 g001
Figure 2. Schematic diagram of the project’s location and scope.
Processes 10 02062 g002
Figure 3. Simulation of the lining using plate elements.
Processes 10 02062 g003
Figure 4. Simulation of the intermediate wall using a concrete model.
Processes 10 02062 g004
Figure 5. Simulation of the rock bolts using embedded beams.
Processes 10 02062 g005
Figure 6. Simulation of the pipe roofings using embedded beams.
Processes 10 02062 g006
Figure 7. A cross section of a tunnel with rock bolts and pipe roofings: (a) the pilot tunnel and (b) the eastbound tunnel.
Processes 10 02062 g007
Figure 8. The prototype of the guide pit and the triple adjacent tunnels.
Processes 10 02062 g008
Figure 9. Model grids for the triple adjacent tunnels.
Processes 10 02062 g009
Figure 10. Construction of the pipe roofings.
Processes 10 02062 g010
Figure 11. Excavation of the two pilot tunnels and construction of an intermediate wall.
Processes 10 02062 g011
Figure 12. Excavation of the eastbound and westbound tunnels and the knocking out of rock bolts and shotcrete in the pilot tunnels.
Processes 10 02062 g012
Figure 13. Tunnel excavation at different stages.
Processes 10 02062 g013
Figure 14. Comparison of the Mohr–Coulomb model and Hoek–Brown model for the vertical crown displacement under biased pressure in: (a) the MRT tunnel, (b) the eastbound tunnel, and (c) the westbound tunnel.
Processes 10 02062 g014
Figure 15. The total displacement of the tunnels in the Mohr–Coulomb model and the Hoek–Brown model with the excavation stage under biased pressure.
Processes 10 02062 g015
Figure 16. Schematic diagram of the analysis mode under unbiased pressure.
Processes 10 02062 g016
Figure 17. Schematic diagram of the analysis mode under biased pressure.
Processes 10 02062 g017
Figure 18. Shading distribution diagram of the total displacement of tunnels: (a) unbiased case and (b) biased case.
Processes 10 02062 g018
Figure 19. Schematic diagram of the locations of pipe roofings.
Processes 10 02062 g019
Figure 20. Displacement vs. location under unbiased pressure: (a) for pipe roofings a, b, and c in the westbound tunnel; (b) for pipe roofings d, e, and f in the MRT tunnel; and (c) for pipe roofings g, h, and i in the eastbound tunnel.
Processes 10 02062 g020
Figure 21. Displacement vs. location under biased pressure: (a) for pipe roofings a, b, and c in the westbound tunnel; (b) for pipe roofings d, e, and f in the MRT tunnel; and (c) for pipe roofings g, h, and i in the eastbound tunnel.
Processes 10 02062 g021
Figure 22. Schematic diagram of the locations of rock bolts.
Processes 10 02062 g022
Figure 23. Displacement vs. location under unbiased pressure: (a) for rock bolts a, b, and c in the westbound tunnel; (b) for rock bolts d, e, and f in the MRT tunnel; and (c) for rock bolts g, h, and i in the eastbound tunnel.
Processes 10 02062 g023
Figure 24. Displacement vs. location under biased pressure: (a) for rock bolts a, b, and c in the westbound tunnel; (b) for rock bolts d, e, and f in the MRT tunnel; and (c) for rock bolts g, h, and i in the eastbound tunnel.
Processes 10 02062 g024
Figure 25. Schematic diagram of the locations of the analyzed pipe roofings and rock bolts.
Processes 10 02062 g025
Figure 26. Comparison of the total displacements of the tunnels with and without pipe roofings.
Processes 10 02062 g026
Figure 27. DRR values of various locations with pipe roofings installed.
Processes 10 02062 g027
Figure 28. Maximum displacement at various excavation stages.
Processes 10 02062 g028
Figure 29. Shading distribution diagrams of the total displacement of the surrounding rock in the final excavation stage: (a) without pipe roofings and (b) with pipe roofings.
Processes 10 02062 g029
Figure 30. Total displacement without rock bolts and with rock bolts alone.
Processes 10 02062 g030
Figure 31. DRRs at various locations with rock bolts.
Processes 10 02062 g031
Figure 32. Maximum displacement at various excavation stages with and without rock bolts.
Processes 10 02062 g032
Figure 33. Shading distribution diagram of total displacement of the surrounding rock in the final excavation stage: (a) without rock bolts and (b) with rock bolts.
Processes 10 02062 g033
Table 1. Parameters for the Mohr–Coulomb model (with rock bolts and pipe roofings installed).
Rock ParametersRock Layer
Unsaturated unit weight, γunsat (kN/m3)21
Saturated unit weight, γsat (kN/m3)23
Poisson’s ratio, ν0.25
Young’s modulus, E (kN/m2)1.2 × 105 (1.0 × 10⁵)
Cohesion strength, c (kN/m2)50
Angle of friction, ϕ (°)32
Dilatancy angle, Ψ (°)2
Lateral stress coefficient, Ϋ00.5
Note: When no rock bolts or pipe roofings are configured, the elastic modulus adopts the values in the parentheses and the values of the other rock parameters remain unchanged.
Table 2. Parameters for the Hoek–Brown model (with rock bolts and pipe roofings installed).
Rock ParametersRock Layer
Unsaturated unit weight, 𝛾unsat (kN/m3)21
Saturated unit weight, 𝛾sat (kN/m3)23
Poisson’s ratio, ν0.25
Rock mass’s Young’s modulus, 𝐸rm (kN/m2)1.2 × 105 (1.0 × 10⁵)
Uniaxial compressive strength of the intact rock, σc𝑖 (kN/m2)8000
Intact rock mass parameter, 𝑚𝑖13
Geological Strength Index, GSI45
Disturbance factor, D0.2
Rock mass material constant, s0.00143
Rock mass material constant, a0.508
Lateral stress coefficient, 𝐾00.5
Note: When no rock bolts and pipe roofings are configured, the elastic modulus adopts the values in the parentheses and the values of the other rock parameters remain unchanged.
Table 3. Parameters of the pipe roofings and rock bolts.
Material PropertyPipe RoofingRock Bolt
Diameter (mm)7023
γ (kN/m3)76.9376.93
Spacing (m)0.52
E (kN/m2)2.1 × 1082.1 × 108
Publisher’s Note: MDPI stays neutral with regard to jurisdictional claims in published maps and institutional affiliations.

