Article

Antibacterial, Antifungal, and Antibiotic Adsorption Properties of Graphene-Modified Nonwoven Materials for Application in Wastewater Treatment Plants

1
Hohenstein Institut für Textilinnovation gGmbH, Schlosssteige 1, 74357 Bönnigheim, Germany
2
Department of Chemical and Process Engineering, Warsaw University of Technology, Warynskiego 1, 00-645 Warsaw, Poland
3
ATEC Automatisierungstechnik GmbH, Emmi-Noether-Straße 6, 89321 Neu-Ulm, Germany
4
Norafin Industries (Germany) GmbH, Gewerbegebiet Nord 3, 09456 Mildenau, Germany
*
Author to whom correspondence should be addressed.
Processes 2022, 10(10), 2051; https://doi.org/10.3390/pr10102051
Submission received: 13 September 2022 / Revised: 4 October 2022 / Accepted: 9 October 2022 / Published: 11 October 2022
(This article belongs to the Special Issue Advanced Liquid Waste and Gas Waste Treatment Processes)

Abstract

:
The utilization of adsorptive nonwovens as a pretreatment unit may lead to novel, cost-efficient wastewater treatment technologies with remarkable properties for environmental protection, such as efficient adsorption of antibiotics. This paper uses graphene-modified nonwoven (GMN) to examine (i) how the adsorption of tetracycline (TCY)—especially since this antibiotic is frequently detected in the environment—takes place on an environmentally relevant concentration scale, and (ii) what factors influence the antibacterial and antifungal properties profile of this material class. This study demonstrates that combining graphene particles with commercial textile auxiliaries clearly enhances the antibacterial and antifungal properties of the modified nonwoven materials. The enzyme-linked immunosorbent assay (ELISA) was used to detect the TCY residues at ng/mL scale. The adsorption results follow Henry and Redlich–Peterson isotherms and emphasize the adsorption process at low concentration levels of TCY. Therefore, the appropriately designed GMNs have a great potential application for wastewater treatment in sewage plants. Statistical analysis (skewness and kurtosis) of nonwovens and modified nonwovens morphology allowed us to determine the parameters influencing the growth of fungi in such structures. GMN structures are capable of adsorbing antibiotics; a two-fold reduction of TCY was obtained in the studies.

1. Introduction

The abuse of antibiotics is a major environmental and public health problem leading to an accumulation of antibiotics in the environment and an increasing number of antibiotic-resistant infections during the last decades. Our study focuses on TCY (tetracycline), which represents a class of antibiotics that is widely used but survives the wastewater treatment processes and accumulates persistently in the hydrological cycle. As a broadband-spectrum antibiotic, TCY is widely used in medicine and livestock farming, but 75% of TCY is released into the environment through the feces and urine of humans and animals [1]. The adsorption mechanisms are highly dependent on, among others, the concentration level of the antibiotics in the wastewater streams. For fundamental understanding, the analytical detection of TCY via UV-Vis [2,3] and ELISA [4] methods, i.e., monitoring from mg/L to ng/mL scales, are useful, respectively. The environmentally relevant concentrations of TCY vary from 23.2–158.0 µg/L in hospital effluents to 0.05–85 µg/L in sewage plants and 0.34–8 µg/L in surface and river waters [5]. Several studies have been published that emphasize the toxicity of TCY to the aquatic system, i.e., fishes and Daphnia [6,7].
Tertiary wastewater treatment is the final and most cost-intensive stage in a sewage plant, which focuses on ensuring optimal effluent quality, e.g., by removing specific environmentally persistent trace organic pollutants (POPs), such as antibiotics, that are described in this study. To efficiently remove antibiotics from the environment during wastewater treatment, different techniques were proposed in the literature, which encompasses innovative adsorption processes with different adsorbent classes (activated carbon, graphene, biochar, etc. [8,9,10,11,12,13,14,15,16,17]) and further alternative techniques like advanced oxidation process (AOP) or such processes as cold plasma [18,19,20]. The utilization of nonwoven materials at this final step is a strategy that is frequently discussed in the literature, as well [21,22]. In general, the adsorption of persistent organic pollutants was studied on nonwoven materials [23,24], but there is still a lack of data regarding the adsorption mechanisms of modified nonwoven materials. For example, in the MBR process step, nonwovens can be used (i) as submerged MBR construction [13] and/or (ii) as a pre-/post-filtration step in the side streams of MBR. In both cases, to be compliant with the requirements, not only adsorption and filtration properties are important, but also the reduction of the biofouling to a minimum; thus, such data lead to the characterization of the biocide properties of the materials already in the material design stage. However, Luo et al. [25] investigated biofilm formation in MBR applications and found that both bacteria and fungi are important actors in this process. Bacteria were the dominant taxa in the formation of biofouling. The biofilms investigated by Luo et al. consist of bacteria, fungi, and archaea with percentage distributions of 92.9–98.4%, 1.5–6.9%, and 0.03–0.07%, respectively [25].
Some of these studies especially focus on the adsorption mechanisms of TCY on graphene and graphene oxide powders. In this study, the primary focus also lies in investigating this novel adsorbent class, which is typically applied to the nonwoven surface in combination with further surface modification agents (e.g., hydrophilic agents that change the wettability properties of the material). The incorporation of graphene into polymeric materials and even on their surface to achieve improved mechanical and electrical properties has been widely studied [26,27,28] but experienced a resurgence in interest, as strong π–π interactions of graphene to aromatic compounds (i.e., often persistent and toxic nature) can be used to detect and to eliminate these compounds in the environment [29,30]. However, most of these studies were conducted at a lab scale and focused on providing fundamental insights into the adsorption of antibiotics under different conditions (pH [31], temperature [32], ion concentration [33], concentration of TCY [34], experimental/analytical workflow [35], etc.). As mentioned already, several adsorption studies were conducted at acidic pH, at which TCY is almost stable, but it changes the chemical structure of TCY and influences the adsorption mechanisms. Only a few studies investigate the adsorption processes of TCY at low mg/L concentrations, e.g., by combining UV-Vis with further techniques like fluorescence spectroscopy [26]. To our knowledge, adsorption studies at the low ng/mL scale (i.e., 0.01–10 ng/mL) were not carried out due to analytical challenges of detecting TCY in this concentration range. In addition, only a few analytical methods are proposed in the literature to investigate TCY residues at such a low concentration level. Different chromatographic techniques [36,37] or enzyme-linked immunosorption assays (ELISA) [38] may be used to detect TCY traces in wastewater streams. But both techniques are prone to errors during the analytical workflow (e.g., cross contaminations, fitting of standard curves, the temperature of solvents, etc.). As a result, advanced data analysis and visualization techniques may provide a more statistically robust fitting of standard curves or evaluation of adsorption isotherms. For this reason, the R programming environment was utilized. In detail, two R packages for the core of the data analysis procedure were applied, namely the “drc” package [39] for the analysis of dose-response curves and the “PUPAIM” package [40], which is based on a compilation of almost all known adsorption isotherms (see the review articles of Dąbrowski et al. [41] and Ayawei et al. [42]).
Our motivation in this study was to compile data regarding the biocide and adsorption properties of graphene-modified materials under environmentally/industrially relevant conditions for utilization in wastewater treatment plants. These data are especially able to be acquired at the lab scale, in the initial stage of the material’s design, in which not only the functional particles are chosen but also the textile auxiliaries. We assume that such data may be interesting both for nonwoven manufacturers and for designers of wastewater treatment plants. In accordance with our strategical assumptions, we chose a functional (i.e., statistical) programming framework to evaluate and visualize data, which is based on already published and well-documented programming packages, and can be used by the scientific community for “hands-on” development projects of nonwoven-based wastewater treatment technologies in the near future.
We found that even if graphene particles bonded to the nonwoven surface do not exhibit antibacterial properties but act more as antifungal agents, it is easy to achieve both antibacterial and antifungal properties by combining functional particles with commercial surface modification agents (e.g., hydrophilic agents). For an extensive discussion of adsorption isotherms on the ng/mL concentration range acquired with ELISA, advanced data evaluation analytics in the R environment was applied. At this environmentally relevant scale, Henry and Redlich–Peterson isotherms were found to be most suitable to describe the adsorption processes at very low concentrations (i.e., nearly infinite dilution of antibiotics in aquatic media).
The novelty of our research is manifested in the presentation of the relationship between easy-to-analyze parameters describing the morphology of nonwoven textiles with antibacterial and antifungal properties. In addition, we have presented an effective method of obtaining filter materials enriched with graphene having antibacterial and antifungal properties, as well as adsorption properties against antibiotics.

2. Experimental

2.1. Fabrication of the Graphene-Modified Nonwoven Materials and Materials Used

The hydro-entangled polyethylene terephthalate (PET) nonwovens were obtained from NORAFIN GmbH (Mildenau, Germany). The utilized PET samples contain 50 wt.% of bicomponent polyester fibers. Graphene powder was delivered by the company IOLITEC GmbH (Heilbronn, Germany). In accordance with the material data sheet, the graphene particles exhibit a thickness of 2 nm, a lateral size of approx. 1–2 µm, and a specific surface area of 750 m2/g. The hydrophilic agent (ARRISTAN AIR) and permanent functional (i.e., conductive) coating (TUBICOAT ELH) were obtained from the company CHT Germany GmbH (Tübingen, Germany). ARRISTAN AIR was utilized as a 5 wt.% dispersion in water; the pH of this dispersion was adjusted with a 5 wt.% solution of acetic acid to a value between 5.0–6.0. The hydrophilic agent, ARRISTAN AIR, is a nonionic polyester copolymer with a semi-permanent character, and it is suitable for hydrophilizing PET nonwoven materials. TUBICOAT ELH is a typical functional coating with a permanent character. It is an anionic polyurethane polymer that contains carbon structures with conductive properties. We utilize this functional coating because the high content of carbon structures in the coating may increase the surface roughness of nonwovens on µm–nm scales. Accordingly, these morphological features may influence the biocide properties of the samples.
The modification of nonwoven samples was carried out in a two-step process. In the first step, the hydrophilic modification was carried out in an automated impregnation/dyeing device (LABOMAT, Werner Mathis AG, Oberhasli, Switzerland) at 60–70 °C for 30 min. The coating was applied on the nonwoven surface with an automated coating device (Erichsen, Hemer, Germany) at a coating velocity of 50 mm/s. The gap between the textile and the squeegee was 60 µm. To modify nonwoven surfaces with a hydrophilic agent or with functional coating, subsequent drying procedures were applied at 130 °C and 95–140 °C for 15–20 min and 8 min, respectively. In the second step, 5 wt.% of graphene dispersion was prepared via dispersing device (Dissolver Dispermat® LC30, VMA-Getzmann GmbH; Reichhof, Germany) at 500 rpm for 5 min and applied on the non-modified PET nonwoven, as well as on the samples that were treated with hydrophilic and functional agents. For this purpose, the samples were immersed in the graphene dispersion for approx. 5 min. In contrast to the first step, a different drying procedure at 120 °C for 10–15 min was carried out.
Flow chart of material fabrication is presented in Figure 1.

2.2. Characterization of Nonwoven Morphology

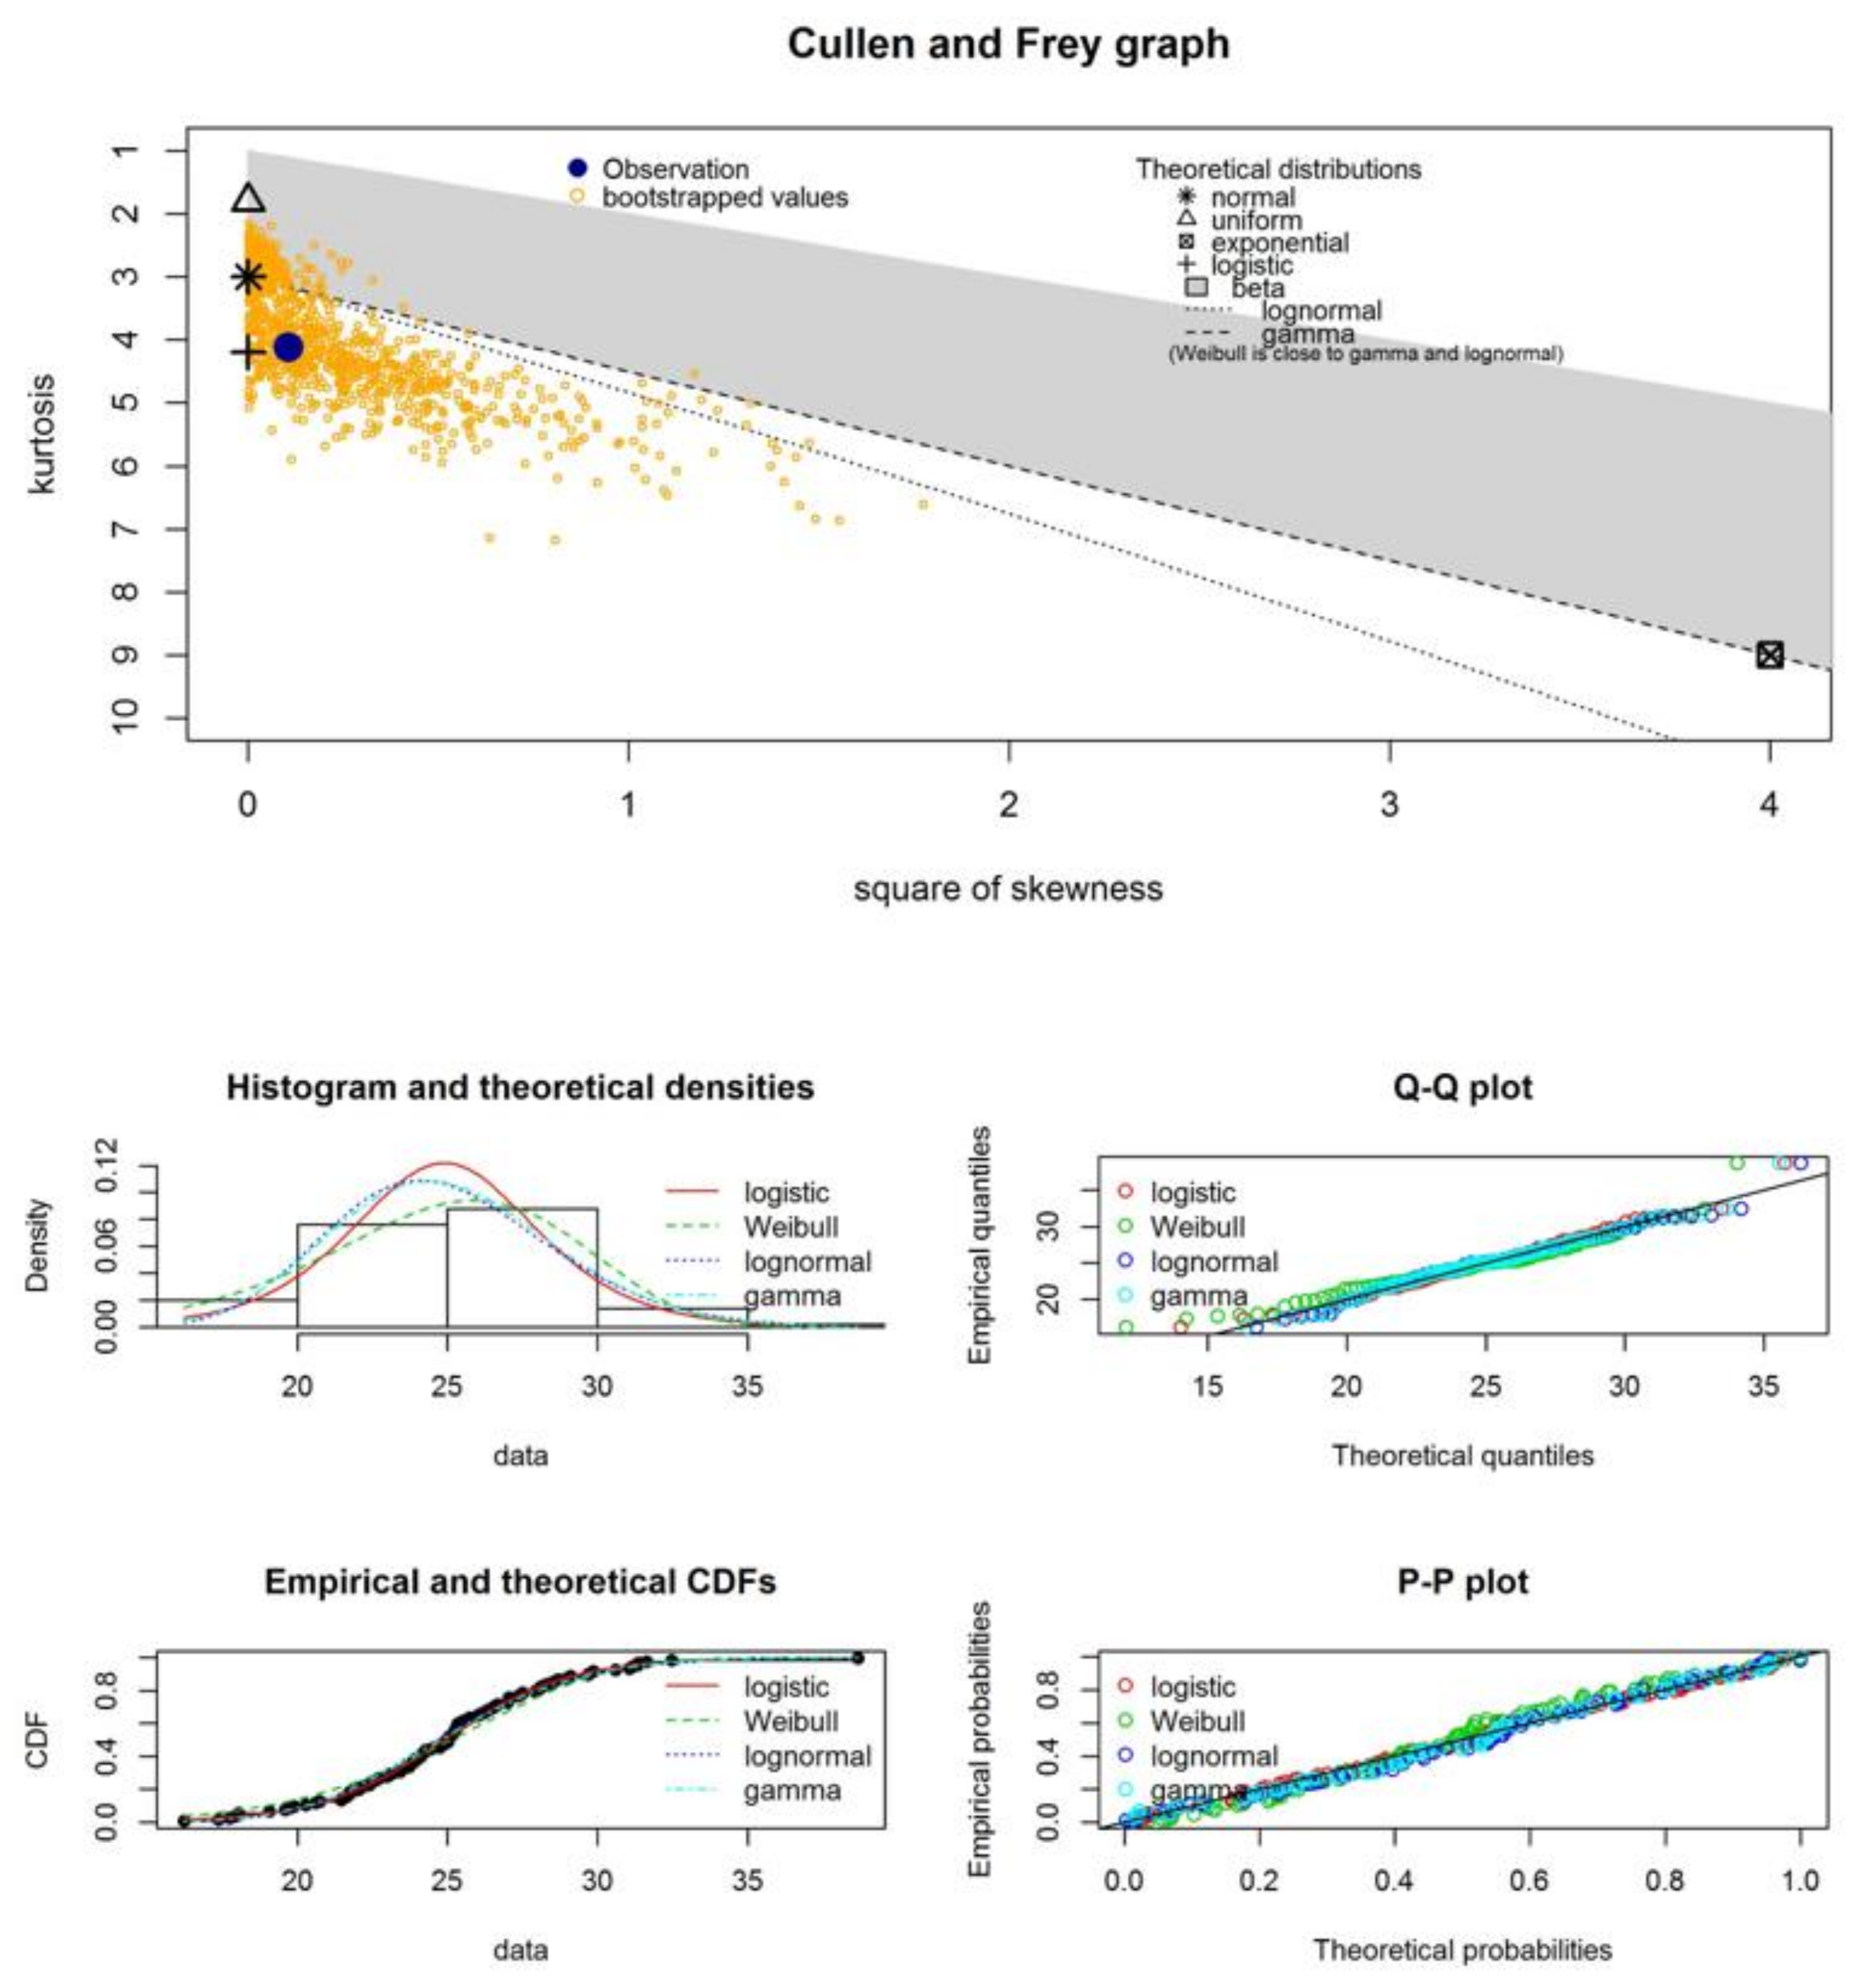
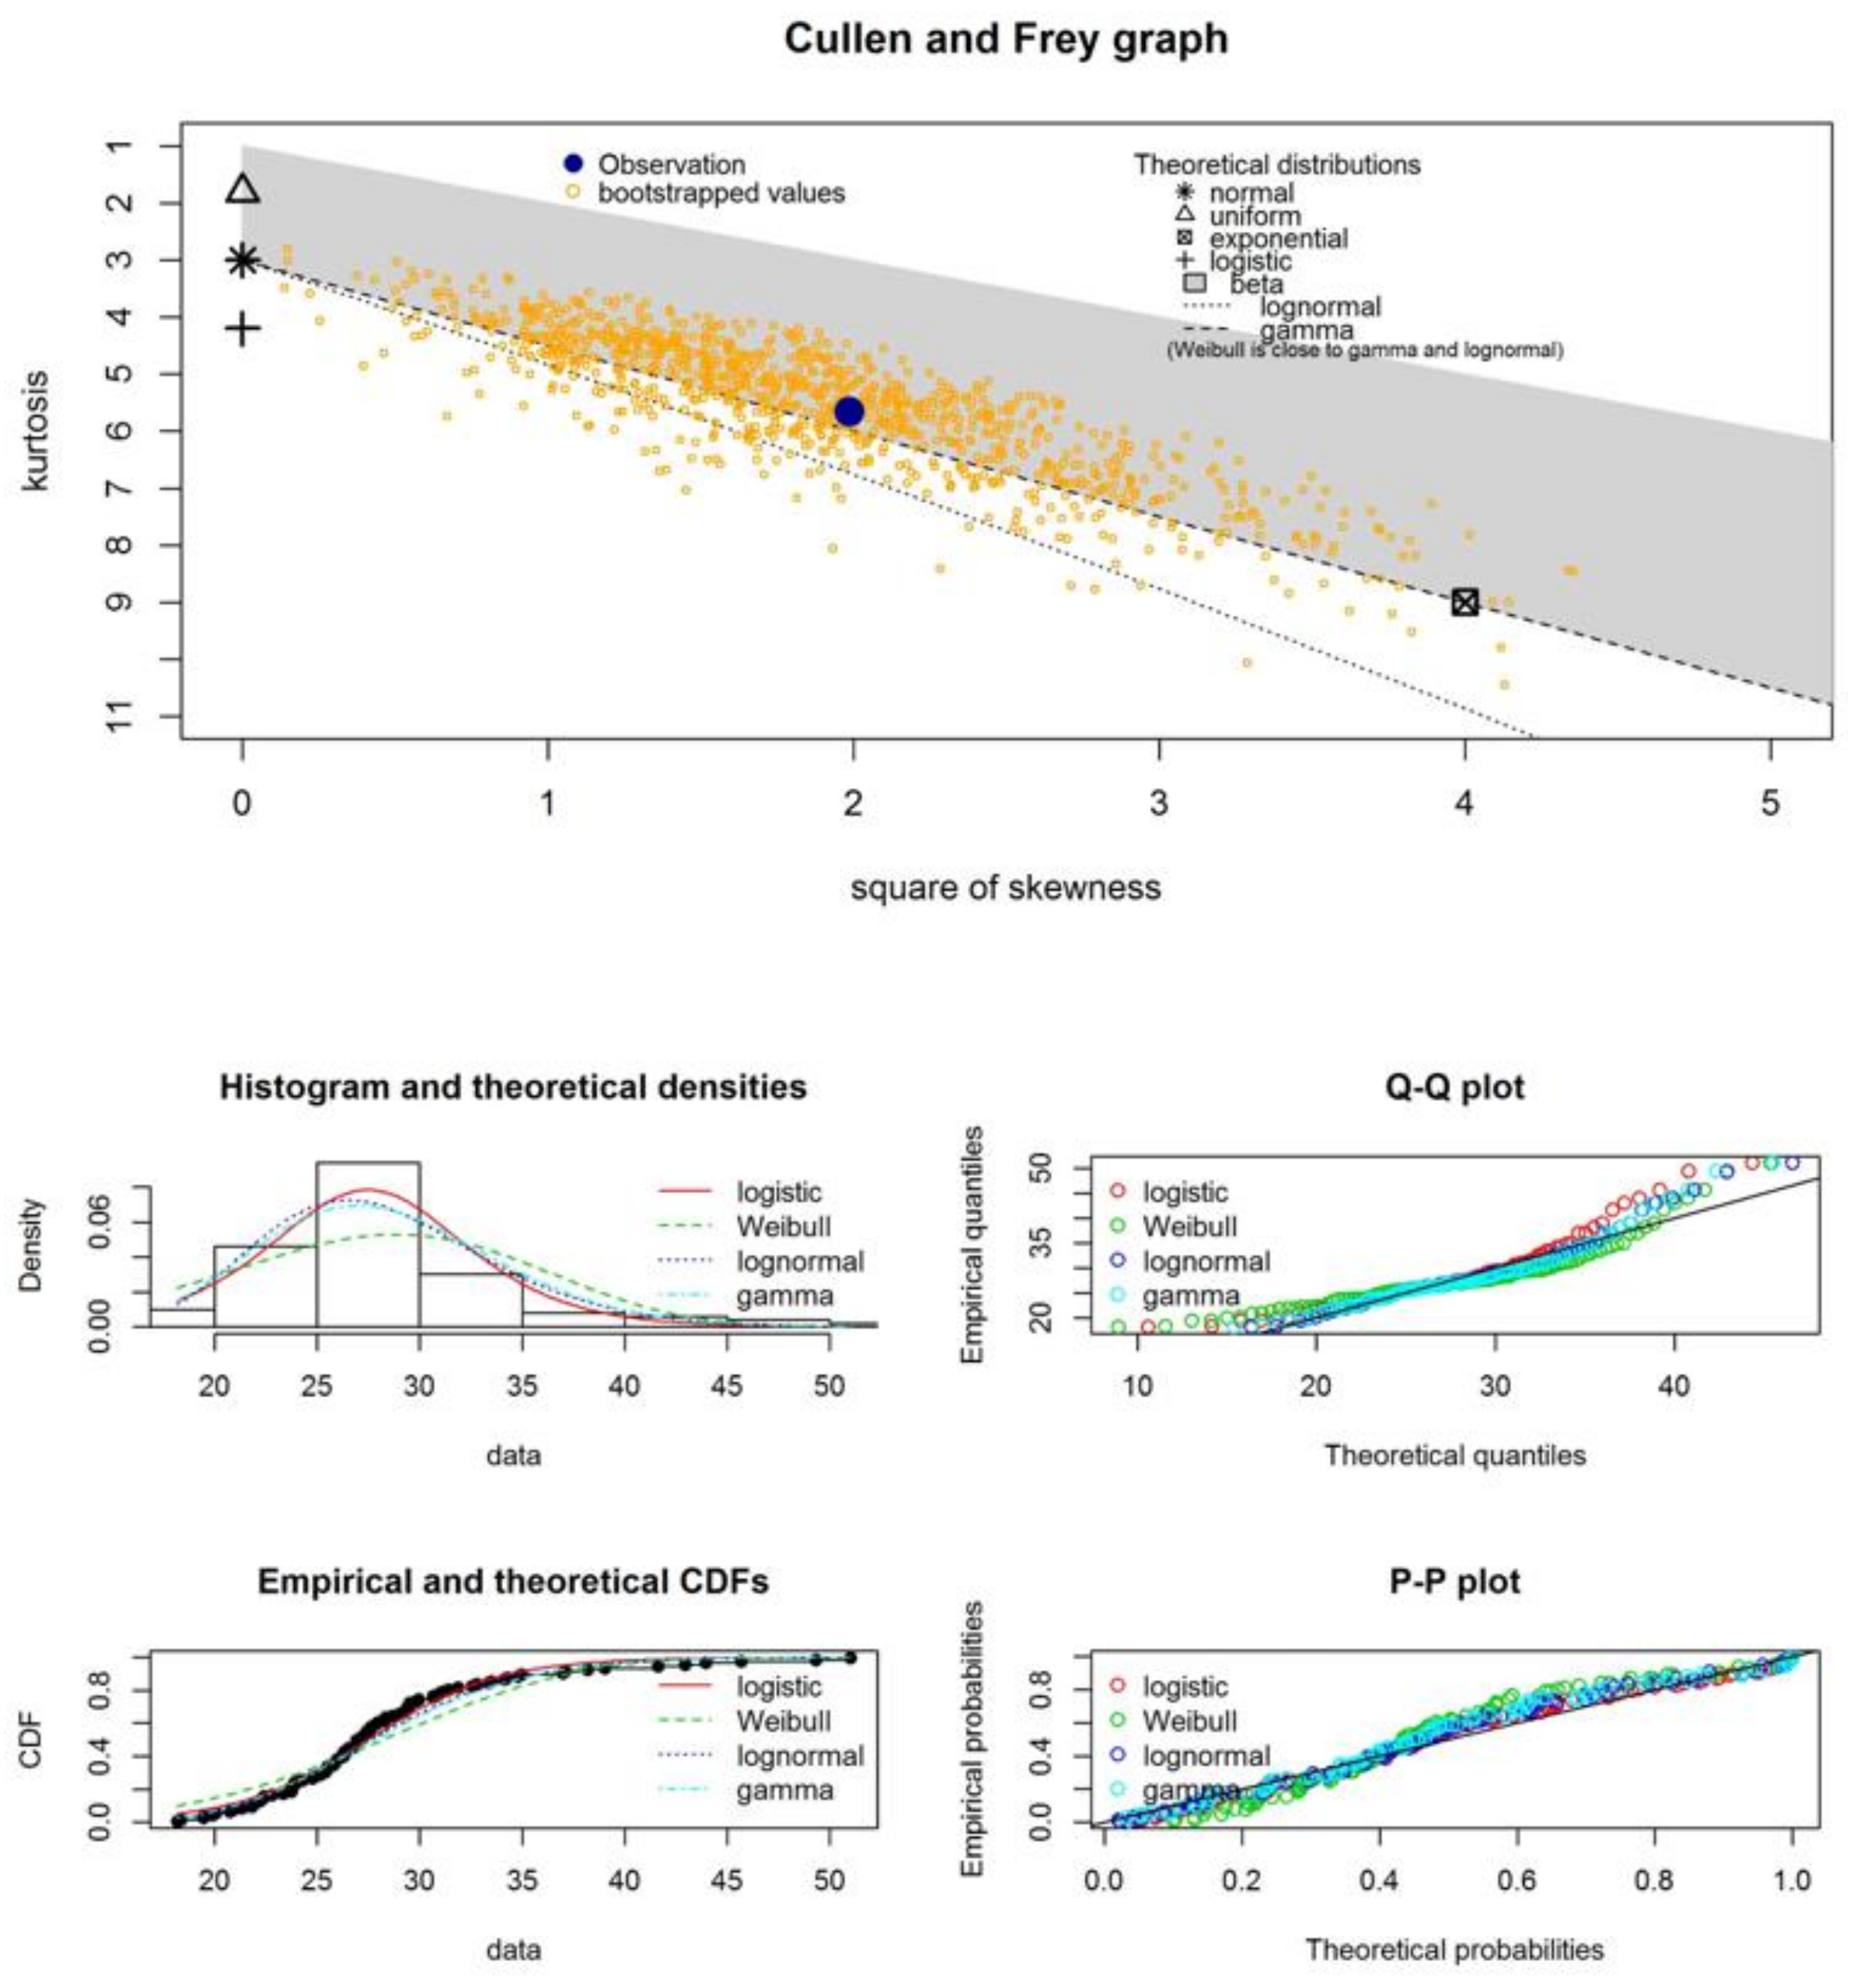
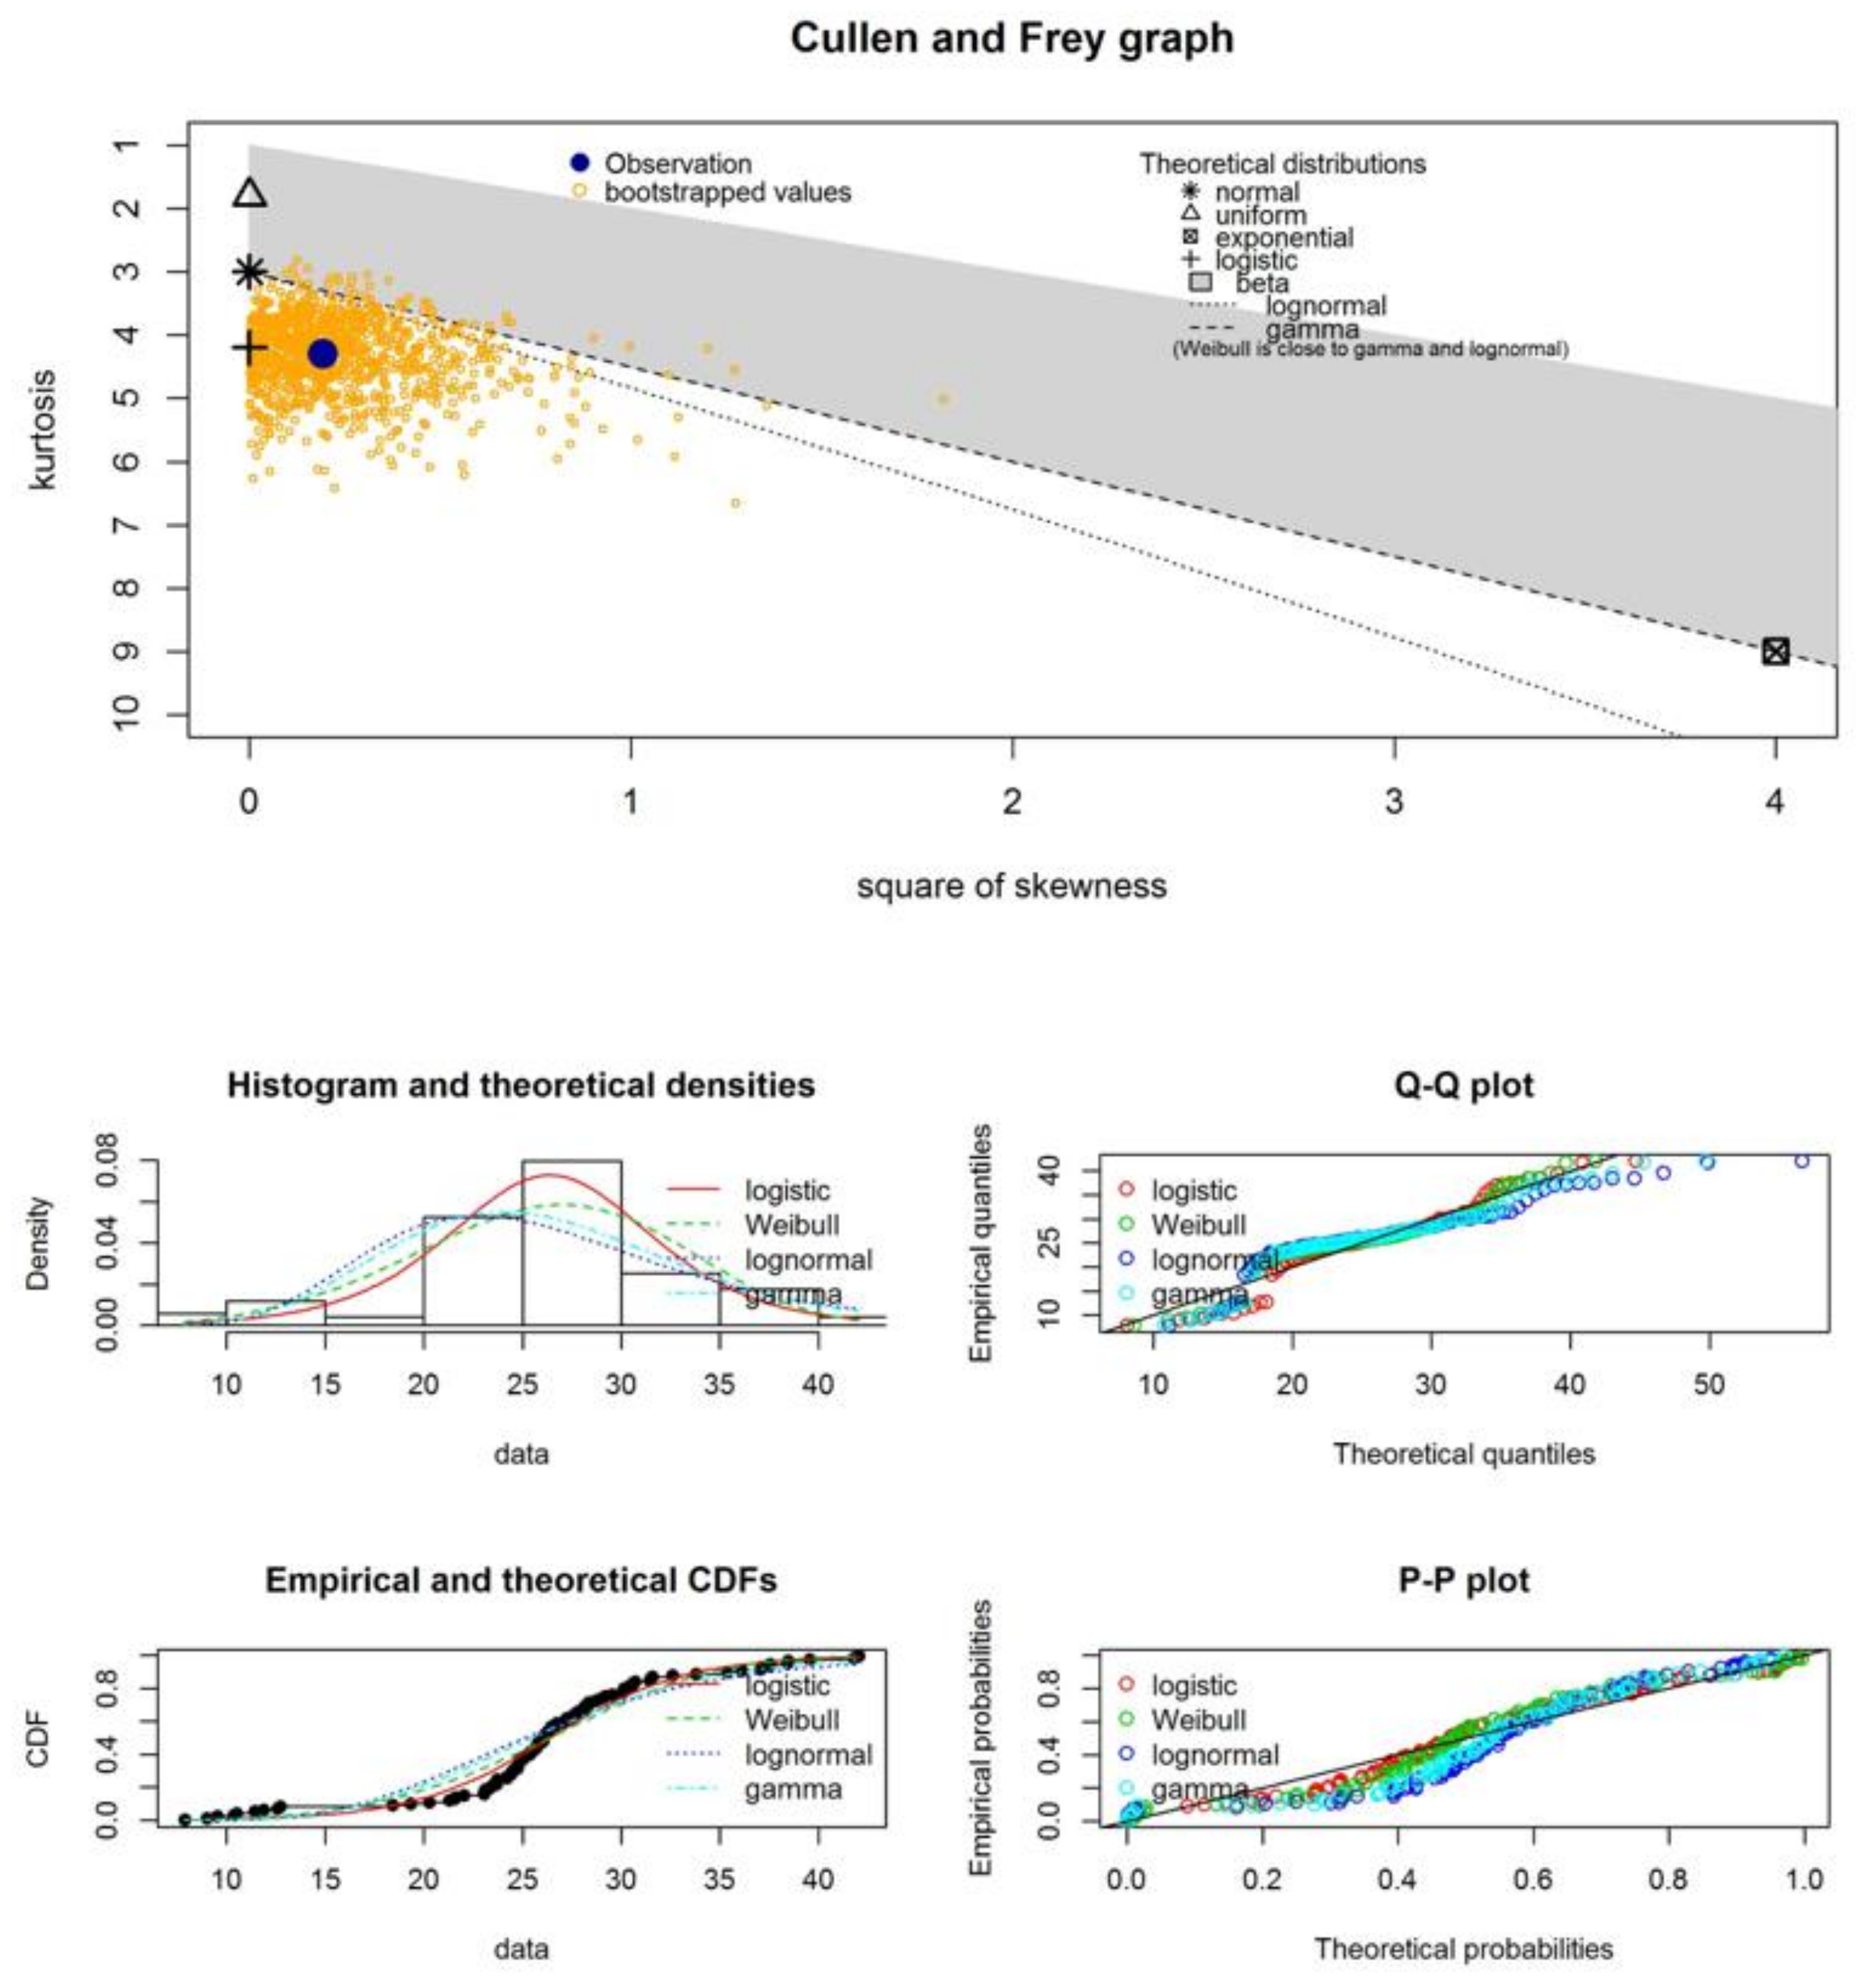
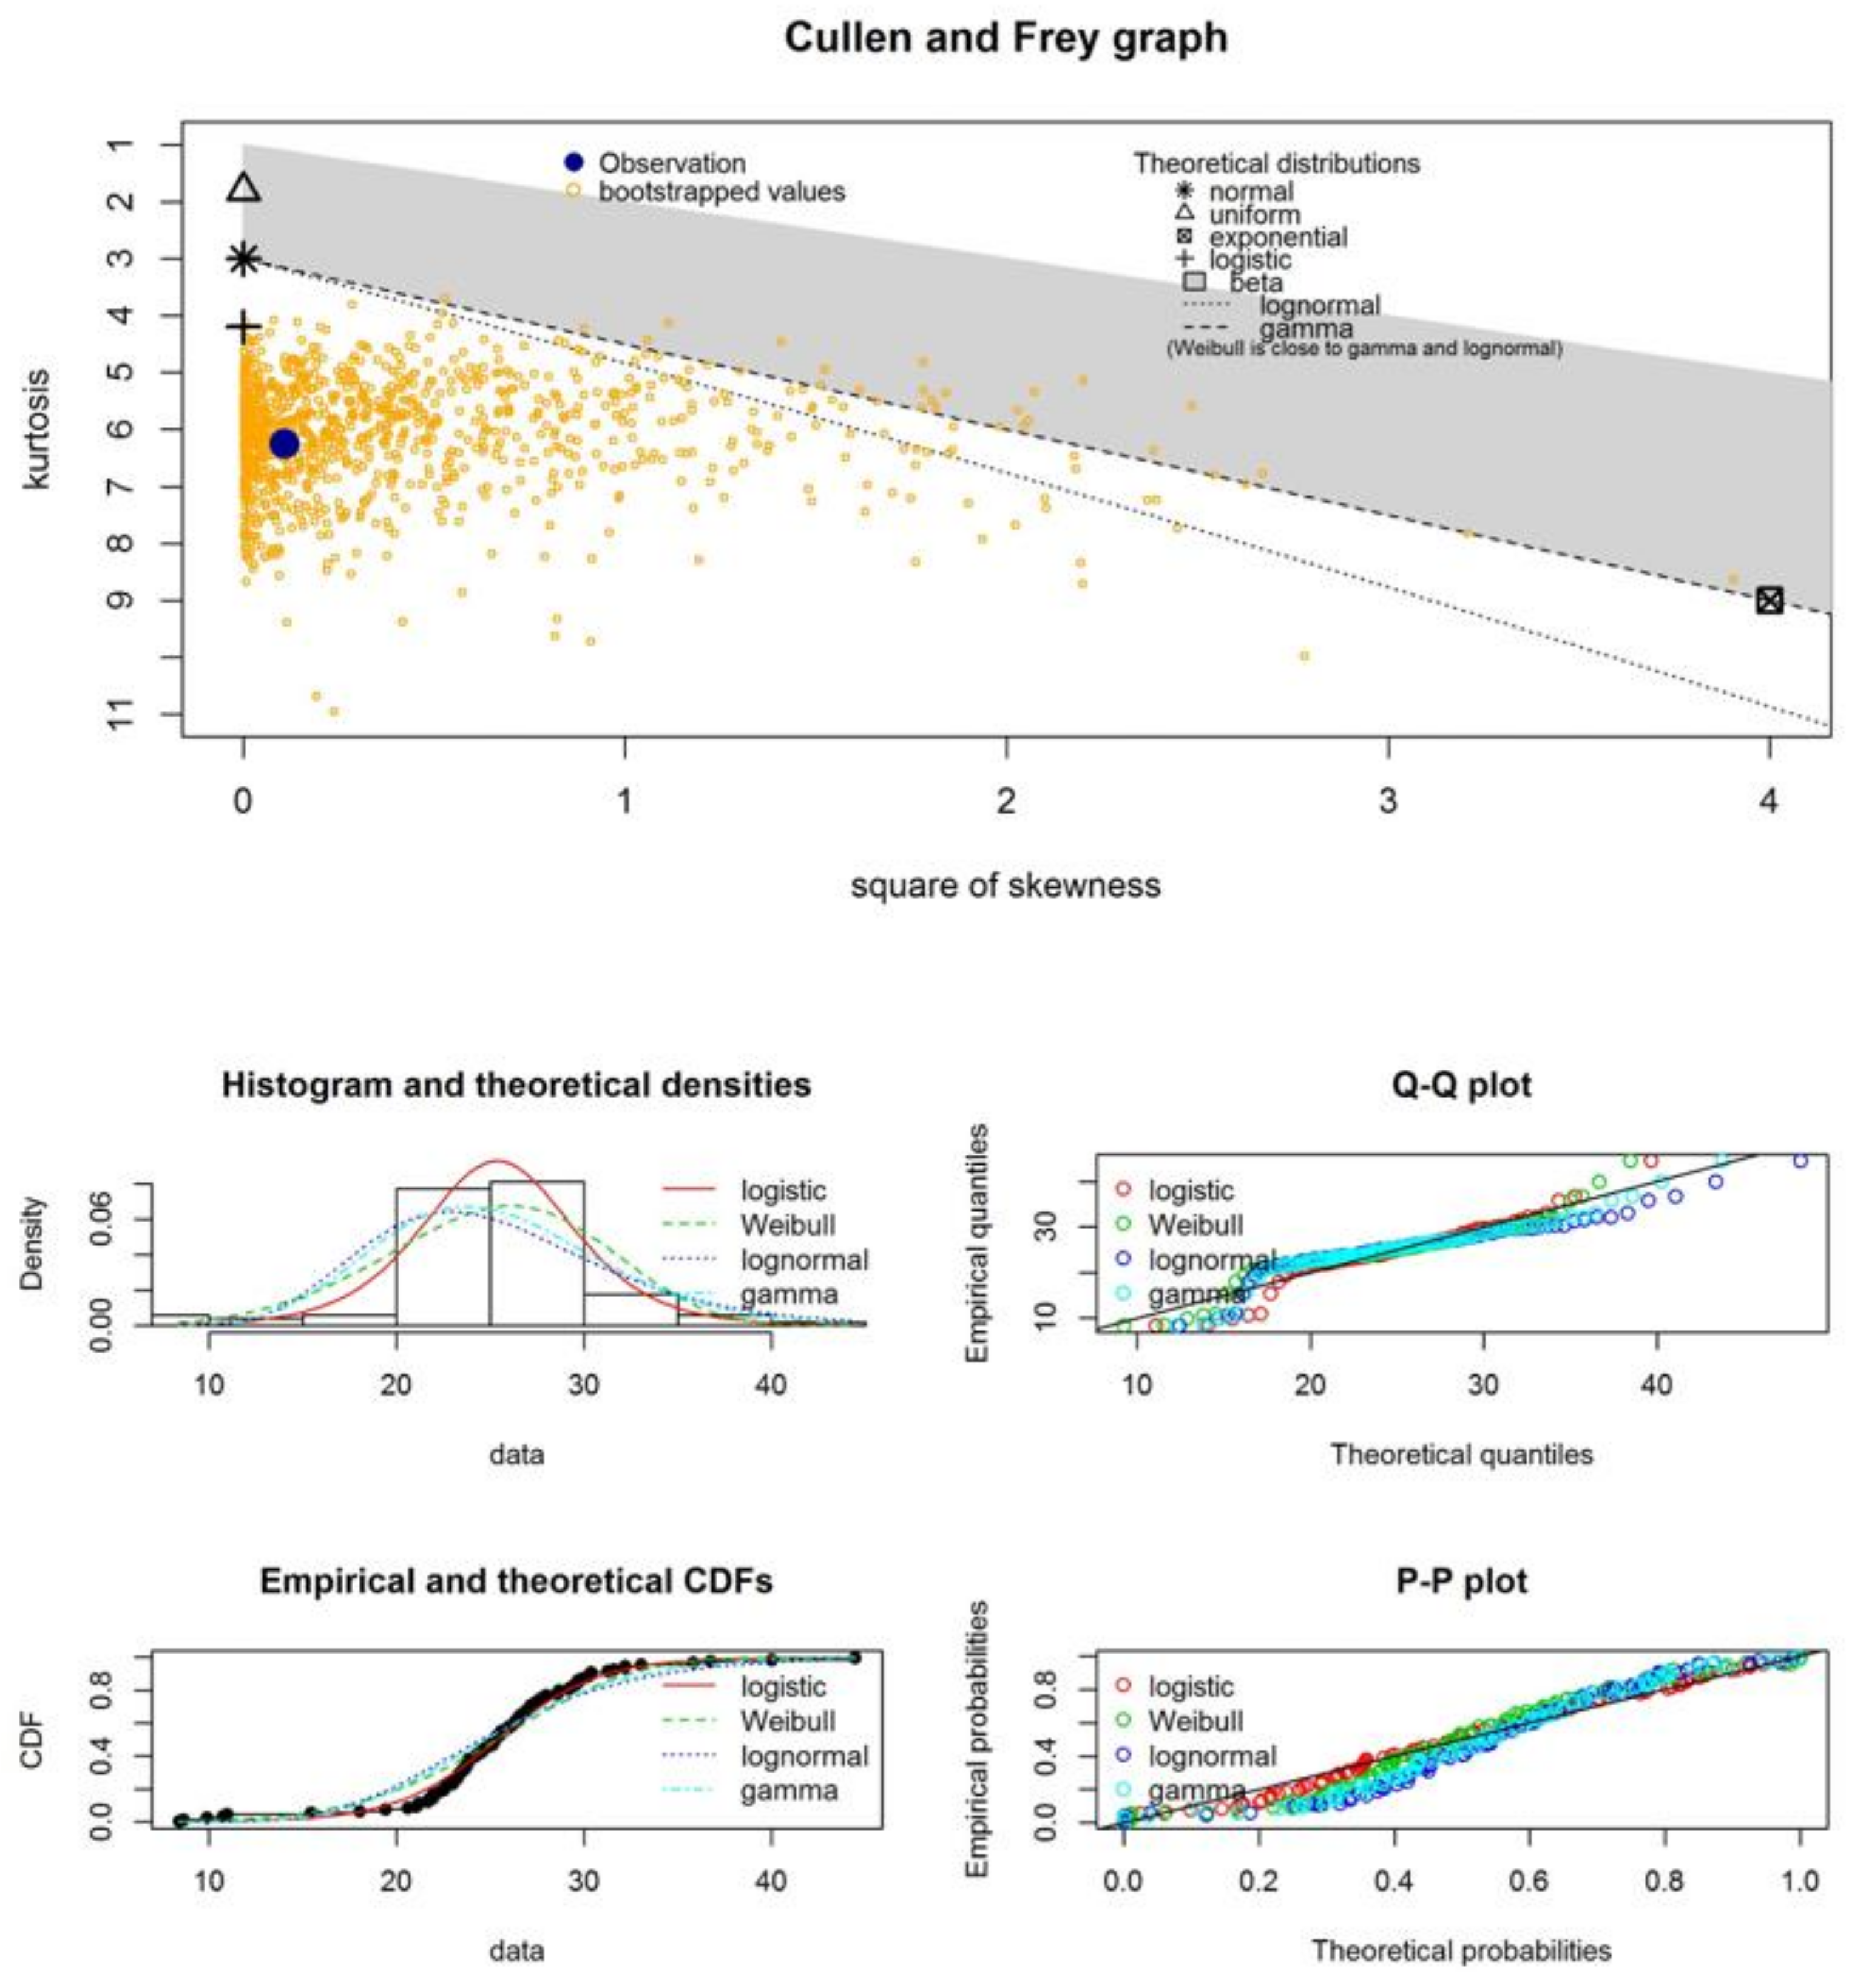
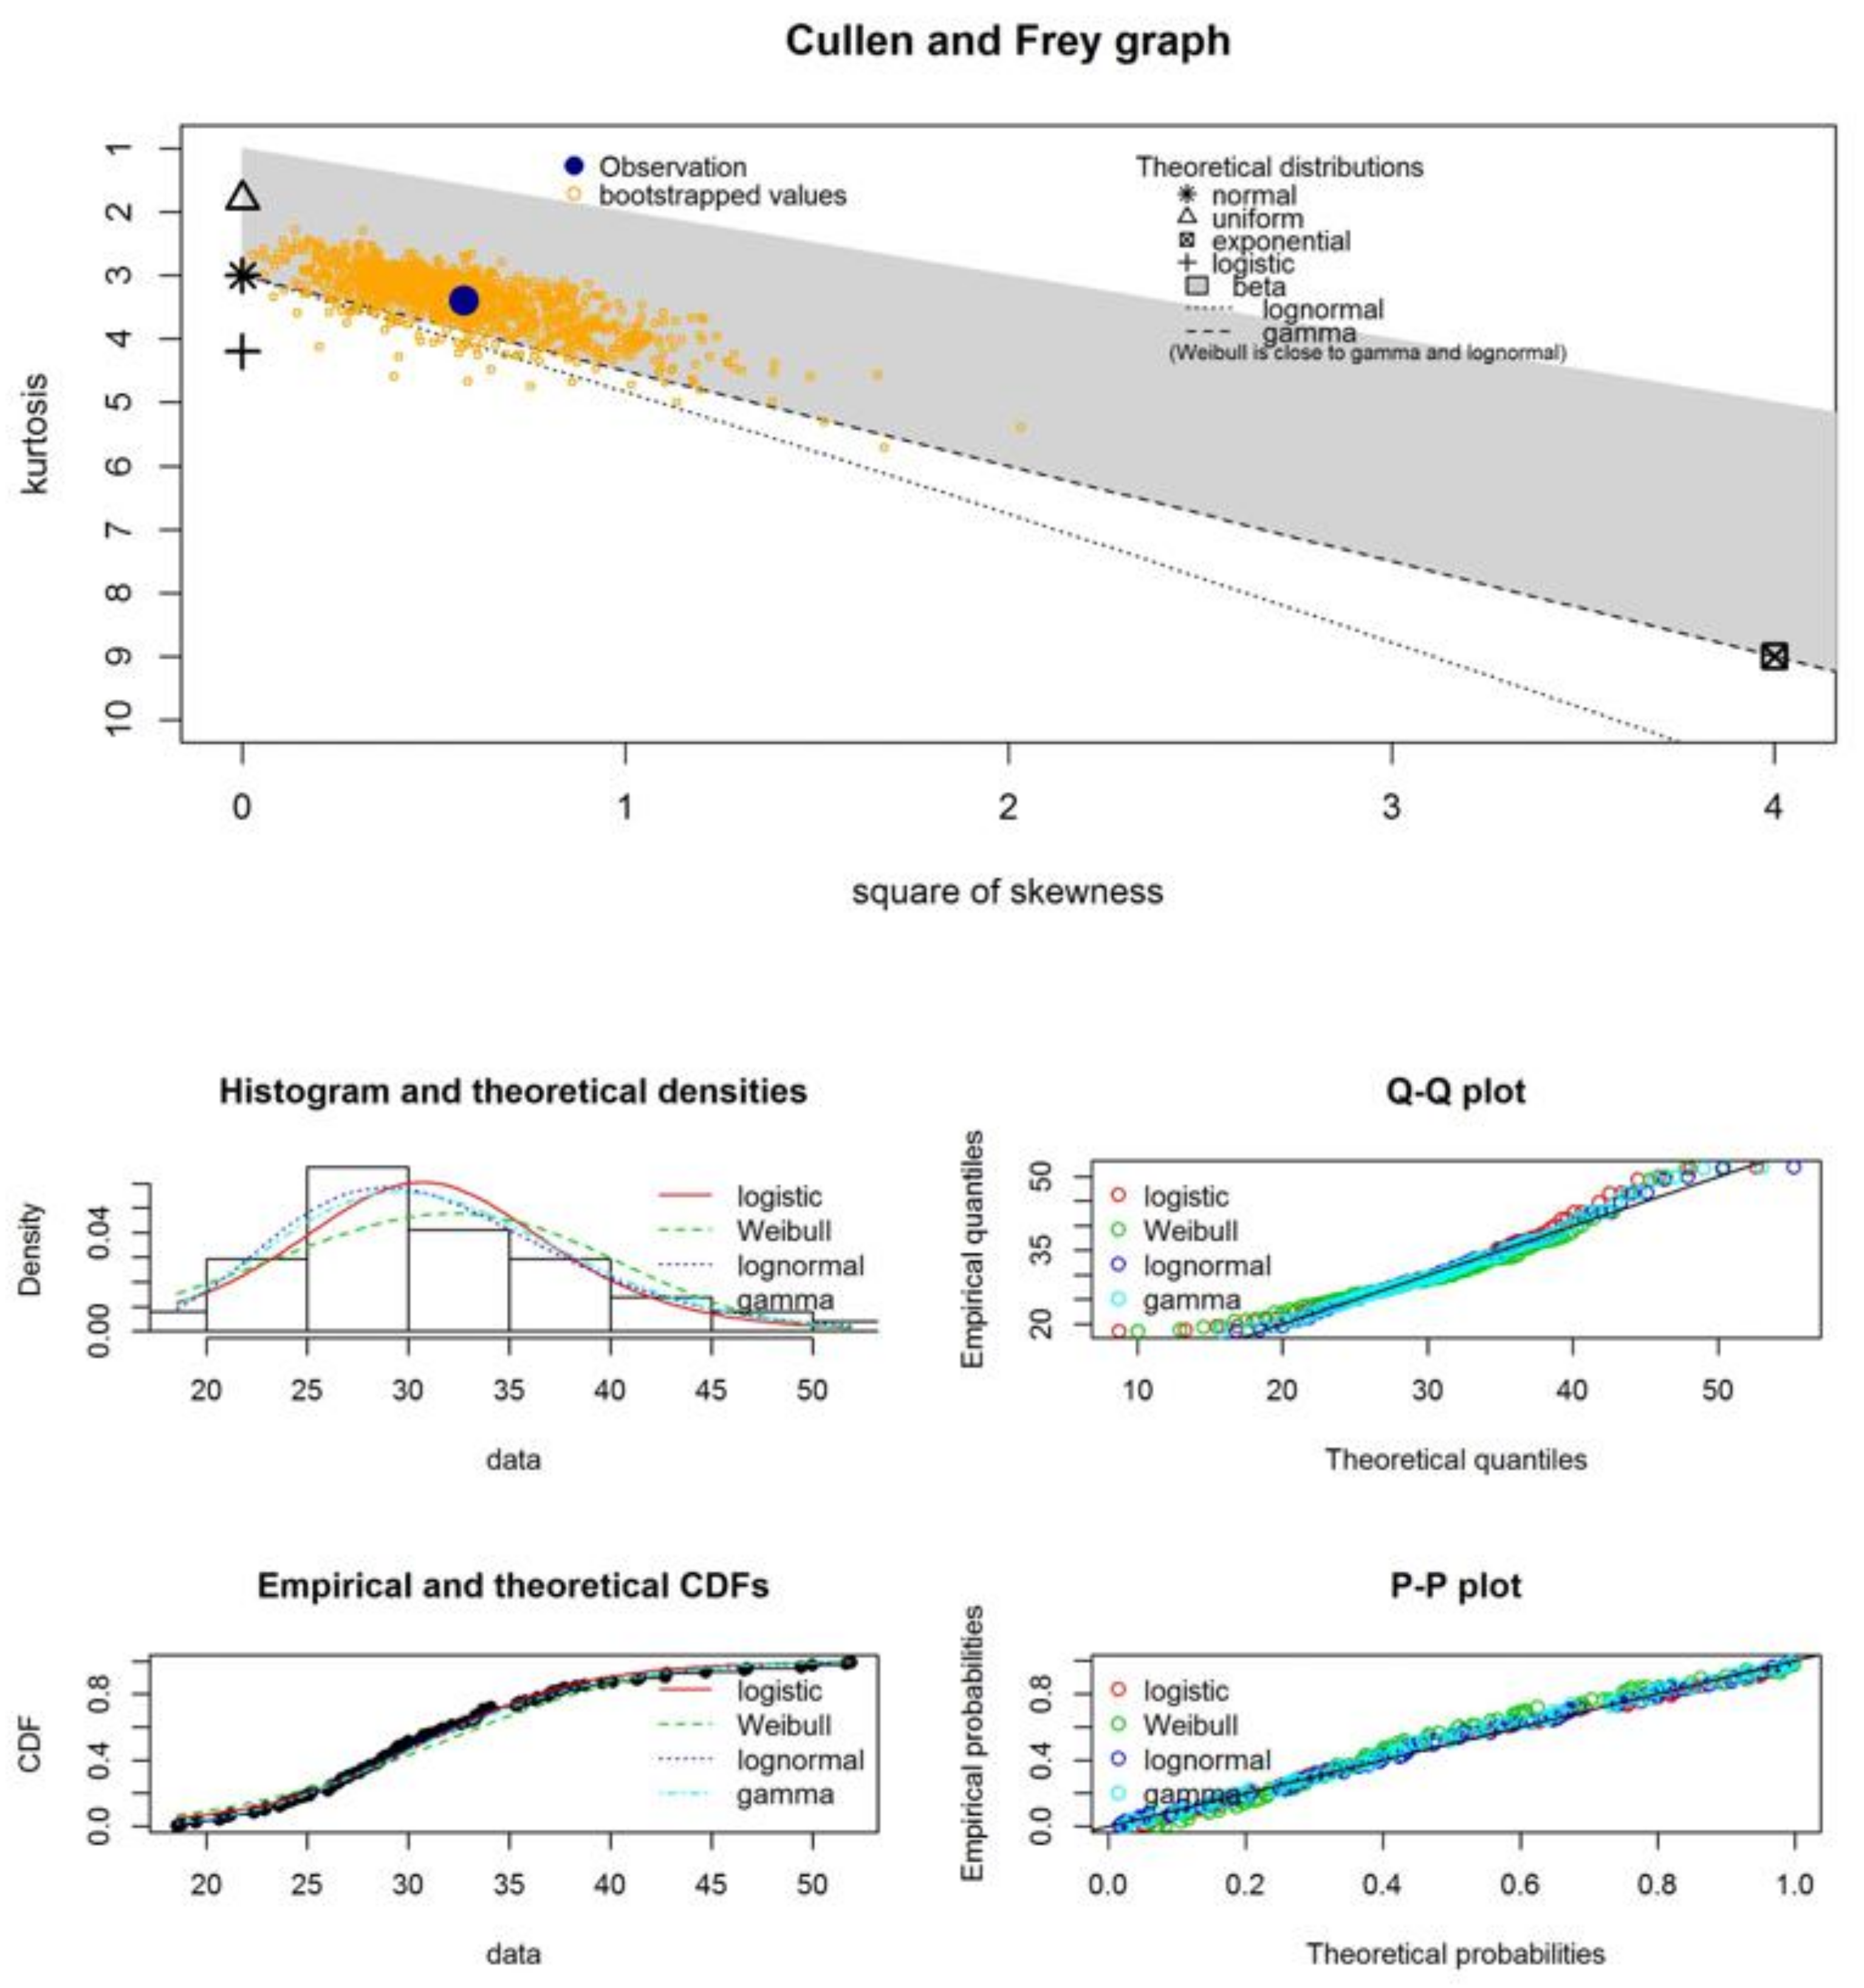
Scanning electron microscopy (SEM) and optical microscopy images of the investigated nonwoven samples were acquired via JSM-IT500LA (JEOL, Freising, Germany), which operates in secondary electron mode, and digital microscope VHX 600D (KEYENCE, Neu-Isenburg, Germany), respectively. The measurements were carried out at an appropriate accelerating voltage of 5 kV or 10 kV. The SEM images were evaluated via the Fiji distribution of the ImageJ package. The univariate fittings of the histograms were applied via the “fitdistrplus” package [43] in the R environment. Each histogram is based on at least 100 measurements of fiber diameter, which was evaluated with respect to the orientation of the fibers. Additional statistical information regarding selecting appropriate fitting procedures is given in the Appendix A.
PMI Capillary Flow Porometer iPore—1200A (Porous Material Inc., Ithaca, NY, USA) was used to obtain the distribution of pseudo-pores in the non-modified and modified nonwovens. For this purpose, to obtain a wet curve, Salwick liquid (PMI Porous Materials Inc.; surface tension 20.1 mN/m) has been used. As a result, histograms and statistical analysis are presented in this paper.

2.3. Determination of Antibacterial and Antifungal Properties

The antibacterial properties of the modified nonwoven materials were determined following DIN EN ISO 20743:2013-12, Method 8.1. Absorption method: plate count method. As test strains, Staphylococcus aureus ATCC 6538 and Klebsiella pneumoniae ATCC 4352 were utilized during the experiments. Bacteria strains were purchased from the German Collection of Microorganisms and Cell Cultures GmbH (DSMZ) (Brunswick, Germany). A standardized polyester fabric was used as a control material.
Antifungal properties were determined via DIN EN 14119:2003-12 Method A1: Resistance against fungi. A mixture of the following test strains was included in our study: Chaetomium globosum Kunze-Fries ATCC 6205, Aspergillus niger van Tieghem ATCC 6275, Penicillium pinophilum Thom ATCC 36839, Trichoderma virens Miller et al. ATCC 9645 and Paecilomyces variotii Bainier ATCC 18502. The assessment of fungal growth is based on the visual assessment procedure that follows DIN EN 14119: 2003-12.

2.4. Evaluation of Adsorption Properties

The tetracycline (TCY) antibiotics investigated in this study were purchased from Sigma Aldrich (St. Louis, MO, USA) and exhibited a purity of 98.0–102% (HLPC). Water purified with reverse osmosis was used, with almost reproducible characteristics of 1.2 µS/cm and 6.4 pH.
For the adsorption experiments, an ELISA test kit (Romerlabs, Butzbach, Germany) was used. This method allows the detection of TCY on the ng/mL scale. The measurements were carried out at the measuring wavelength of 450 nm, and a reference wavelength of 620 nm via a microplate reader (TECAN Spark, Männedorf, Switzerland) linked to the Magellan Software that automates the measurement procedure. For the precise detection of TCY, the standard curves were validated. Slight fluctuations in the standard curves and subsequently applied four-parameter logistic regression fits may significantly influence the measurement results. For the adsorption experiments, a statistically robust fitting procedure via the “drc” package in the R environment was applied.

3. Results and Discussion

3.1. Quantification of Fiber Morphology via SEM and Digital Optical Microscopy

The morphology of the non-modified nonwovens significantly influences both the biocide and the adsorption properties. The antibacterial and antifungal broad-spectrum activity of graphene and graphene derivates (i.e., reduced graphene, graphene oxide, etc.) is part of the ongoing debate on the multifunctional nature of graphene-family particles. On the one hand, the nonwoven structure may chemically affect the microorganism cells through strong electrostatic interactions. On the other hand, there is a physical action pathway by which the sharp edges of graphene-family particles may cut and damage the cells of microorganisms. It is worth mentioning that, especially in terms of the adhesion of bacteria and fungi to graphene surfaces, a pronounced roughness may enhance the growth of microorganisms [44].
Figure 2A–L compiles a visual assessment of fiber morphologies of six modified and non-modified nonwoven samples. In Table 1, statistical information, a result of fitting the fiber diameter distributions, is given. Furthermore, in Appendix A, histograms of fiber diameter distributions are given, with appropriate fits and statistical information (Figure A1, Figure A2, Figure A3, Figure A4, Figure A5 and Figure A6 and Table A1).
The images based on digital microscopy show clearly that the treatment with graphene and carbon-based functional coatings leads to a black homogenous coating of the fibers. Especially, the nonwoven that was modified with carbon-based functional coating or the same sample with the addition of a graphene layer possesses a specific structure in which the fibers are embedded in a graphene/carbon–polymer matrix. The functional coating also partly fills the pores of the material. The SEM images acquired at a magnification of ×300 give a more detailed picture of the morphological structure of the investigated nonwoven surfaces. In the unmodified state, two sorts of fibers with different diameters were detected, which agrees well with the heterogenic nature of the nonwoven materials (see Experimental). A hydrophilic modification only slightly changes (as determined by a visual assessment) the optical appearance of nonwoven surfaces. Furthermore, the nonwoven structure becomes less dense through the applied chemical treatment. Adding graphene particles to the nonwoven samples results in similar surfaces, i.e., a few graphene agglomerates homogeneously decorate the modified nonwoven surfaces.
Thus, for the previously discussed nonwovens, the probability distribution statistics fitted to the histograms obey the same statistical patterns (Table 1).
The first group consists of the non-modified samples (I) and samples treated by hydrophilic agents (Hy and Hy + G). One of those samples was treated with a hydrophilic agent and graphene dispersion (Hy + G) in a subsequent step, but the graphene particles were homogeneously distributed along the fiber network. We expected such behavior as the energetic surface profile changes and favors better wettability of the nonwoven samples with hydrophobic graphene dispersion. Such behavior has been observed in the recent literature [45]. Generally, this group (i.e., low skewness and almost high kurtosis) obeys the logistic distribution, which is also verified by the goodness-of-fit statistics (see Table A1 in Appendix A).
The second group consists of the nonwoven samples on which graphene was applied without adding any textile auxiliaries (I + G), and the two nonwoven samples were both modified by functional carbon-based coating (FC). To one of them (FC + G), graphene particles were added. All samples exhibit a characteristic statistical pattern in comparison to the first group. Here, the skewness is higher, and kurtosis is in the same range or slightly lower because of non-well-distributed large graphene agglomerates and the thick coating layer, in which the nonwoven’s surface is embedded, strongly influence the appearance of the histograms (Table 1 and Appendix A). However, the second group can be better described by the lognormal distribution. The phenomena of the second group, such as large graphene agglomerates, may be interpreted as the formation of additional roughness on fiber surfaces. These results agree with the observation made in the study of Harruddin et al. [46].

3.2. Pore Distributions of Nonwoven Materials

Porosity influences flow resistance—when the pores are small, the flow resistance becomes larger. From the point of view of the filtration processes, it is better to use filters with low resistance because of lower energy consumption. In addition, the important parameter of each filter system is its selectivity, which depends on the pore size (or pseudo-pores size in nonwovens). In a specific case, it is better to use filters with high porosity but a smaller pore size. Figure 3 presents the obtained results for pore size distributions in the examined nonwovens, while Table 2 presents statistical data concerning pore size distributions.
As it can be observed, there is no significant change in the pore size ranges and in the median values for samples I, I + G, Hy, and Hy + G. Only negligible differences in distributions exist. Sample I (initial state) exhibits smaller pores (on average about 99.64 µm). That means that adding graphene or modifying nonwovens with a hydrophilic agent causes some smaller pores to be blocked by graphene agglomerates, so the percentage of the small pores is lower. But in general, the first, second, third, and fourth statistical moments (i.e., mean value, standard deviation, skewness, and kurtosis) do not indicate special changes between these four samples. The most significant changes are observed for samples modified by functional coating without and adding graphene. Two differences can be postulated: (I) the median and mean pore sizes are much smaller—larger pores were “glued” by coating (this phenomenon can also be observed in microscopic photos in Figure 1); (II) the distribution is bimodal—though the percentage of the large pores is higher (see also the negative value of skewness, Table 2). Such “gluing” of the surface has also been noted for other filtration materials [47].
For the application of nonwovens in wastewater treatment plants (e.g., as an accompanying apparatus to MBR), pore size distributions in all samples are acceptable.

3.3. Antibacterial and Antifungal Properties

The antibacterial properties are discussed in terms of reduction values of a certain amount of the two bacteria strains, namely Staphylococcus aureus and Klebsiella pneumoniae, which were applied to the nonwoven samples (Figure 3). Regarding the assessment criteria (viz. industrial standard “DIN EN ISO 20743:2013-12”), all values lower than 2 (i.e., 2 log steps of colony forming units, 2 lg CFU) are defined as not having any antibacterial properties, values that are between 2 and 3 can be linked to significant antibacterial activity, and reduction values that are higher than 3 indicate a strong inactivation of bacteria. In Figure 4, the reduction values are shown, as well as the threshold values for assessing antibacterial activity. The given data demonstrate clearly that the nonwoven samples have no antibacterial activity in the initial state. By adding graphene to the nonwoven surface, we could not observe any increase in the reduction values, which is consistent with the literature observations that present a lower antibacterial activity of graphene in comparison to graphene oxide, which can better penetrate the cell walls of bacteria and inactivate them in a subsequent step [44]. However, in this study, we focus especially on graphene because of further beneficial properties like the adsorption of environmentally toxic aromatic compounds. For the industrial application of nonwovens, in most cases, the graphene particles are applied by adding some additives to homogenously distribute or fix them on the nonwoven surface. Accordingly, the synergetic effects of graphene particles with textile auxiliaries need to be considered to interpret the biocide profile of the modified nonwoven materials. In this study, the nonwoven samples modified with hydrophilic agents possess strong antibacterial properties. Furthermore, the functional coating based on carbon structures embedded in a polyurethane matrix exhibits strong antibacterial properties when testing with Klebsiella pneumoniae. These effects demonstrate that different polymeric coatings change the energetic surface profile of the nonwoven surfaces and thus affect the interaction of the surfaces with both investigated bacteria strains. After adding graphene, the antibacterial activity drops for both strains; this emphasizes the mixed interactions of graphene and the textile auxiliaries with microorganisms. However, in the case of Klebsiella pneumoniae, the mixture of graphene and the hydrophilic agent shows a significant antibacterial mode of action. In the literature, graphene-family particles and their antibacterial properties are controversially discussed [44]. The biocide properties of graphene-family particles are highly dependent on different parameters like shape, size, energetic surface profile (i.e., hydrophobic or hydrophilic surfaces), surface morphology (i.e., roughness), and functionality. As pinpointed by Kumar et al., the agglomeration behavior is one of the key aspects of the interaction mechanisms of graphene with microorganisms [48]. The aggregation of graphene was also observed in our study, especially when graphene was added to the nonwoven without further modification. We assume that in the aggregated form, graphene does not contribute to antibacterial action (compare [44,49]) but rather inhibits it as an optimal contact between the antibacterial coatings (i.e., hydrophilic agent) is prevented. However, several studies have been recently published that emphasize the necessity of a synergetic view on the properties of graphene-family particles with other additives, e.g., different research groups demonstrate an increase in the antibacterial action by combining graphene with silver-based additives [50] or fixing it on a specific metallic surface, like titanium [51].
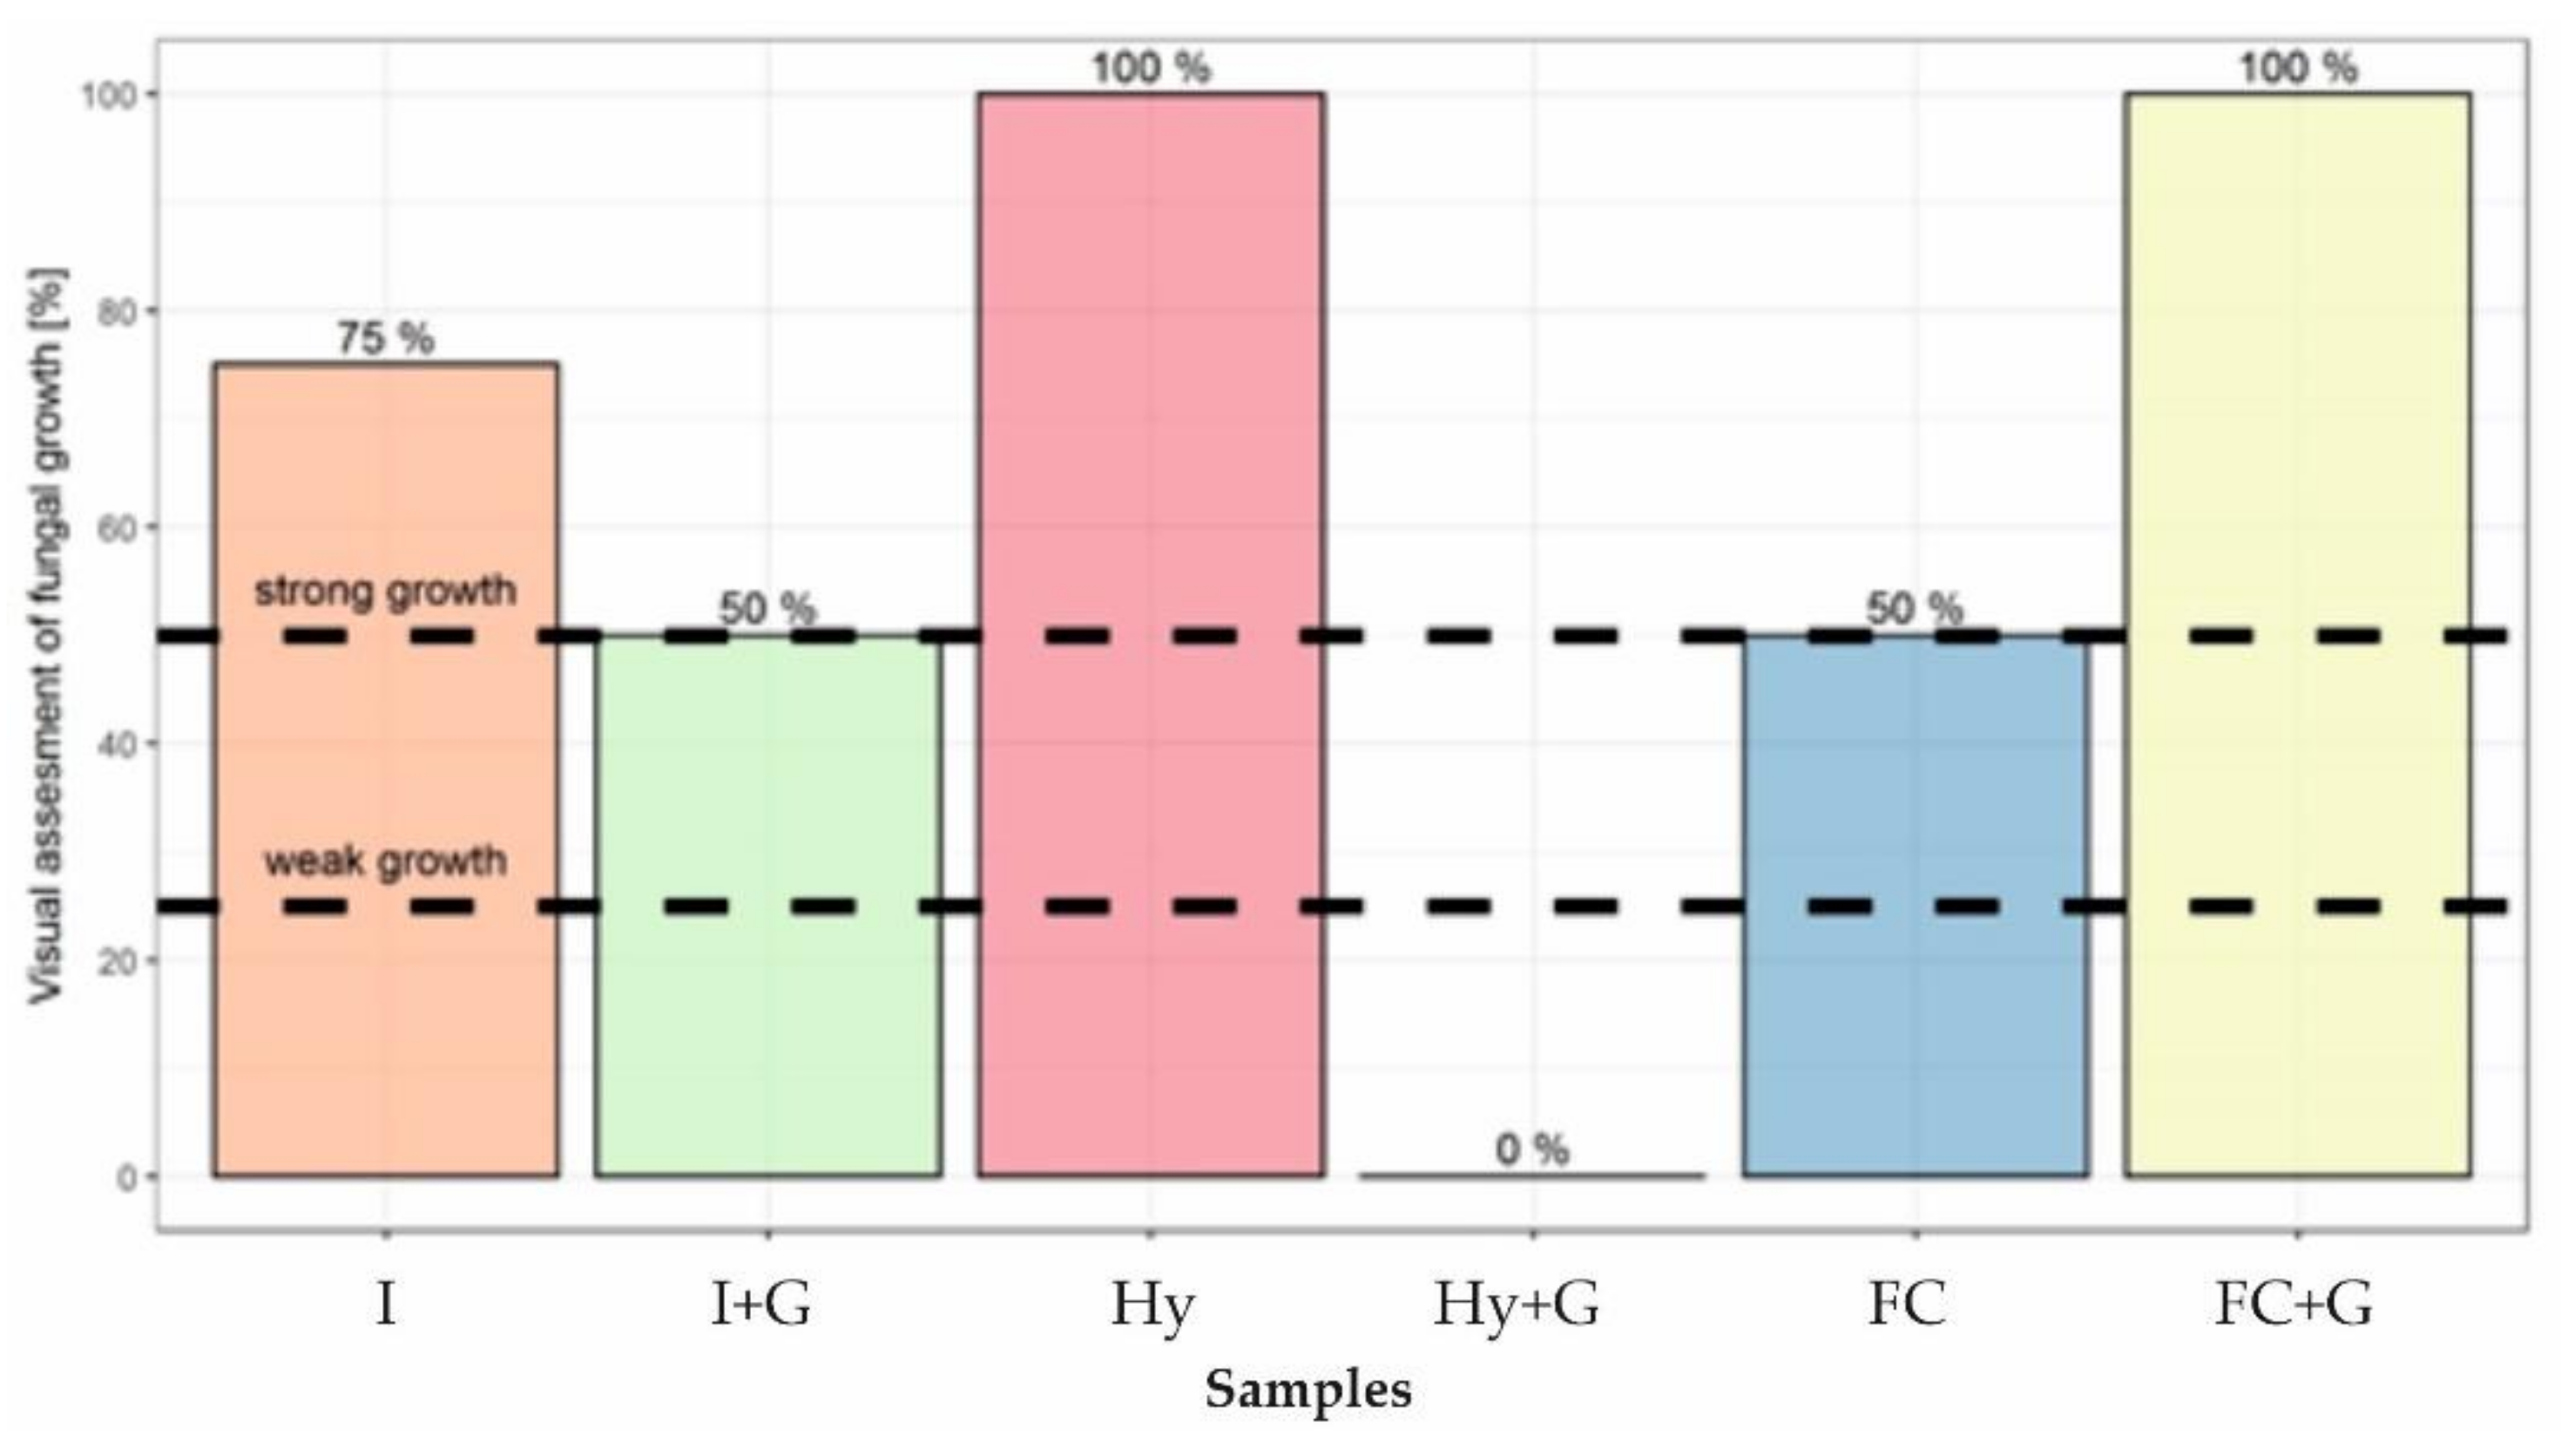
As already mentioned, the biofouling in MBR is driven mainly by bacteria but consists, to a significant extent, of fungi. The monitoring of fungi growth is typically done by both visual assessment and microscope visualization. Nevertheless, it is difficult to provide fine granular assessment criteria, as the surfaces vary in different ways, e.g., black surfaces modified with graphene are difficult to evaluate. Thus, the assessment criteria according to DIN EN 14119 are broad (fungi growth covers 0%, ≤25%, ≤50%, and >50% of the sample surface as compared to a control sample). We modified the assessment level > 50% to 75% and 100%, which better describes the coverage of the samples with fungi and can be better utilized for the statistical correlation studies (Figure 5).
We assume that in our study a similar mechanism may be responsible for inhibiting the fungal growth—namely, the homogenous distribution of smaller graphene agglomerates inhibits the fungi growth, and large agglomerates located only on one sample side have no considerable antifungal activity. In contrast to the study of Agarwalla et al., the quantification of surface free energy on modified porous materials is a challenging task as the goniometric measurements are falsified by the fast soaking of drops into the fibrous structure [52]. Other methods, such as capillary rise techniques, are more suitable to characterize the surface free energy of packed fibrous materials or powders. Often this method is either limited in the case of hydrophobic materials or if the pores are strongly clogged, e.g., by functional coating, as in this case, the capillary flow is inhibited, and the assumptions of Lucas, Washburn, and Rideal cannot be applied in an appropriate way [53]. However, as already mentioned in the case of antibacterial activity, the best antifungal results on textile materials are reported as a synergetic effect between graphene and further additives like titanium dioxide [48].
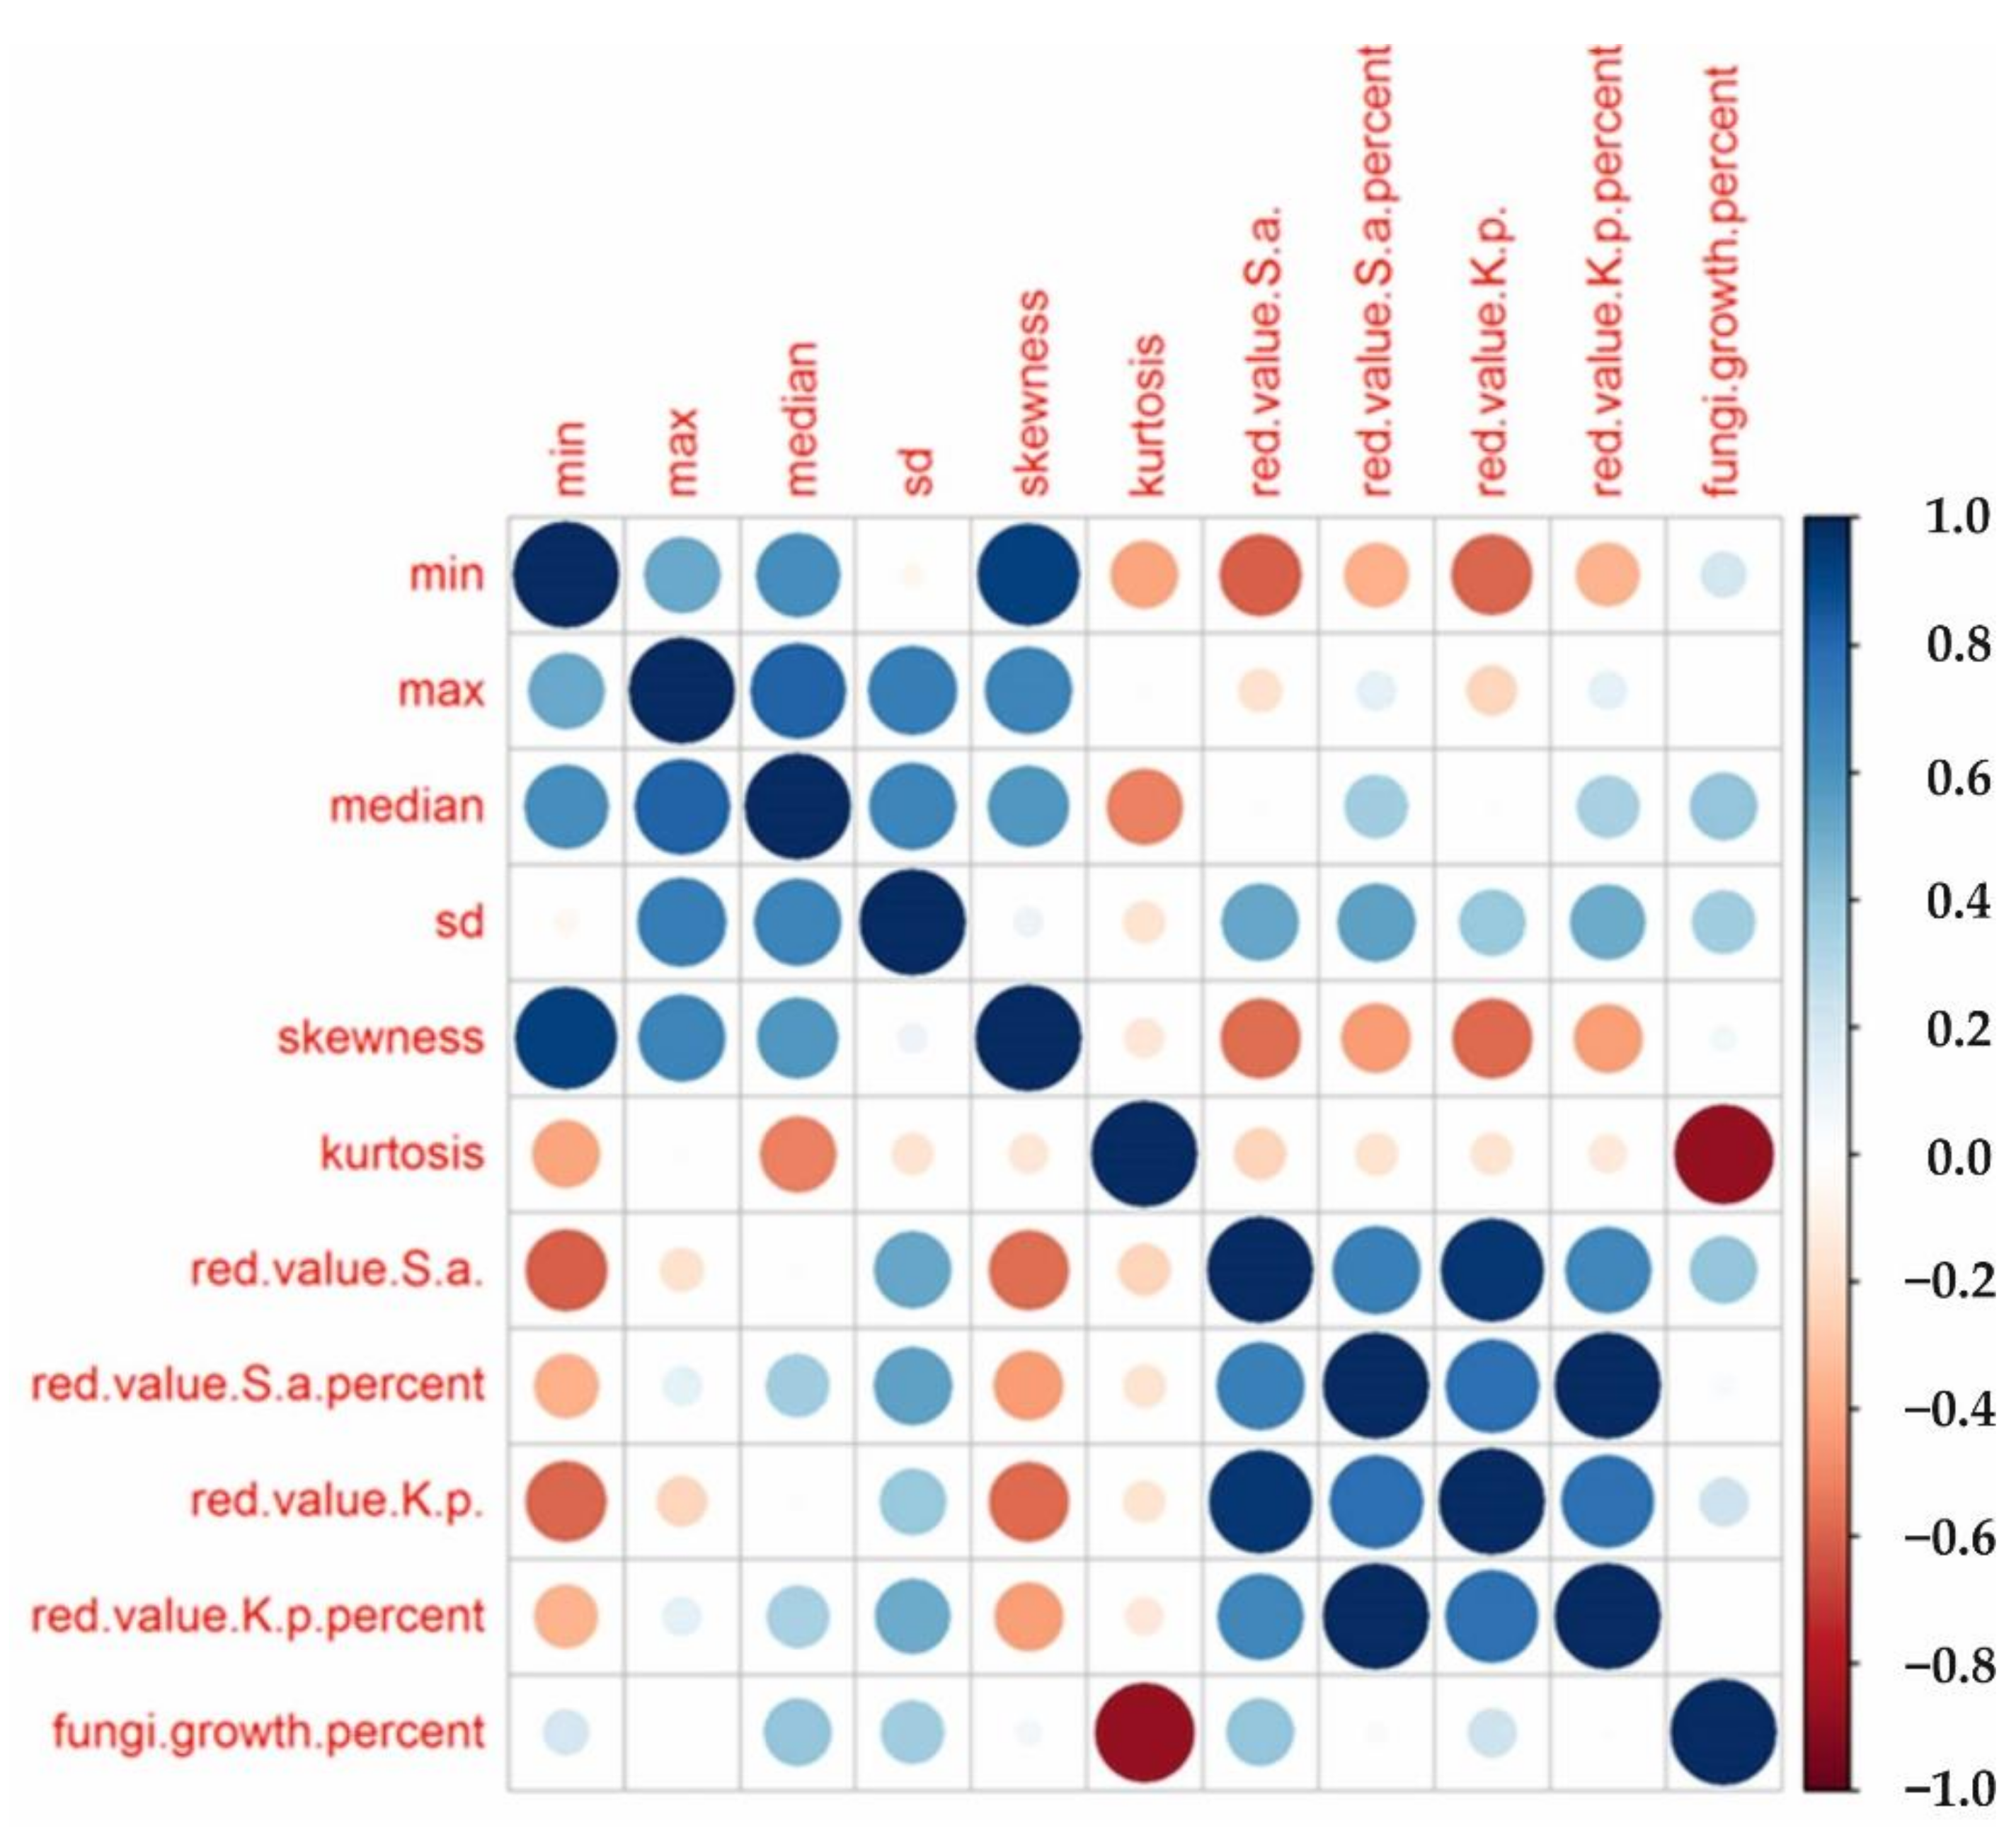
In our study, we compile the morphological/structural data and biocide properties into a statistical correlation plot to better understand which underlying mechanisms are responsible for the antibacterial and antifungal activities of GMN structures (Figure 6). We only consider strong correlations for the discussion. The skewness of the probability distribution is strongly driven by the minimum values. This positive correlation occurs as the samples treated with a hydrophilic agent are less dense and covered only by small graphene agglomerates; as a result, thin fiber structures can be evaluated. By bringing fundamental changes into the nonwoven (i.e., graphene agglomerates, functional coating), the measured fiber diameters are increased, and at the same time, the skewness is a statistical parameter. Additionally, for the same reasons, the median of the distribution is driven by maximum values of measured fiber diameters, i.e., they show a positive correlation to each other. However, as previously described, the skewness is influenced by fundamental changes, while the kurtosis reflects a significant number of phenomena at the distribution tails. As a result, we see a strong correlation between kurtosis and fungal growth. In this case, kurtosis reflects the pronounced role of graphene agglomerates that can be well measured at the surfaces of the nonwovens. As the functional coating embeds fibers randomly, this leads to a smearing of the fiber shape and affects the measurements, which lowers the kurtosis. At the same time, the fungal growth is increased due to the morphological features of graphene agglomerates and functional coating that change the energetic surface profile of the nonwoven fundamentally. For the antibacterial activity, a lack of correlation to morphological parameters was found; thus, we assume the chemical mechanistic pathways of the antibacterial activity of graphene are more pronounced.

3.4. Adsorption Properties of Graphene-Modified Nonwovens

In this study, the TCY adsorption was measured at an environmentally relevant concentration range (i.e., ng/mL). Some experimental simplification and a pre-evaluation of experimental conditions were necessary. In contrast to several recent studies that investigate adsorption mechanisms at acidic pH (i.e., TCY is almost stable), the focus of this study was to emphasize the adsorption mechanism at neutral pH of 7, even if the decomposition kinetics has to be taken into account. However, the composition of wastewater is complex; e.g., it contains several chemical forms of salts that strongly impact the conductivity. Wastewater compositions with a high concentration of salts, like calcium hydrogen carbonate (CaHCO3), tend to influence the adsorption mechanism by favoring electrostatic interactions, which can be well described, e.g., by the Temkin model [42]. To the best of our knowledge, the high salinity does not significantly influence the decomposition of TCY. In this study, the TCY is studied at infinite dilution, and thus the adsorption mechanism does not obey the adsorption models, like Temkin, which are only applicable to the intermediate ion concentration range [42]. Based on these assumptions, the TCY was dissolved in water purified by reverse osmosis, and that had reproducible physico-chemical parameters.
In general, ELISA is sensitive to contaminations that may impact the activity of enzymes—thus, the solutions, like analytical standards, of the ELISA test kit are based on purified water. If samples with complex composition (e.g., TCY detection in milk) should be measured, specific correction factors need to be considered for calculating the TCY values. Thus, especially for the detection of TCY at the ng/mL scale, we avoided any complexity of the composition, and the study aimed to understand the interaction of adsorptive graphene layers that were fixed on nonwovens and TCY at an infinite dilution level. In future studies, we want to investigate the interaction of graphene and common textile additives with TCY; but, as already mentioned, as traces of TCY need to be detected, each disturbance (e.g., additives with cytotoxic abilities) may falsify the results and several sophisticated analytical methods, as well as data evaluation techniques, need to be involved in such studies.
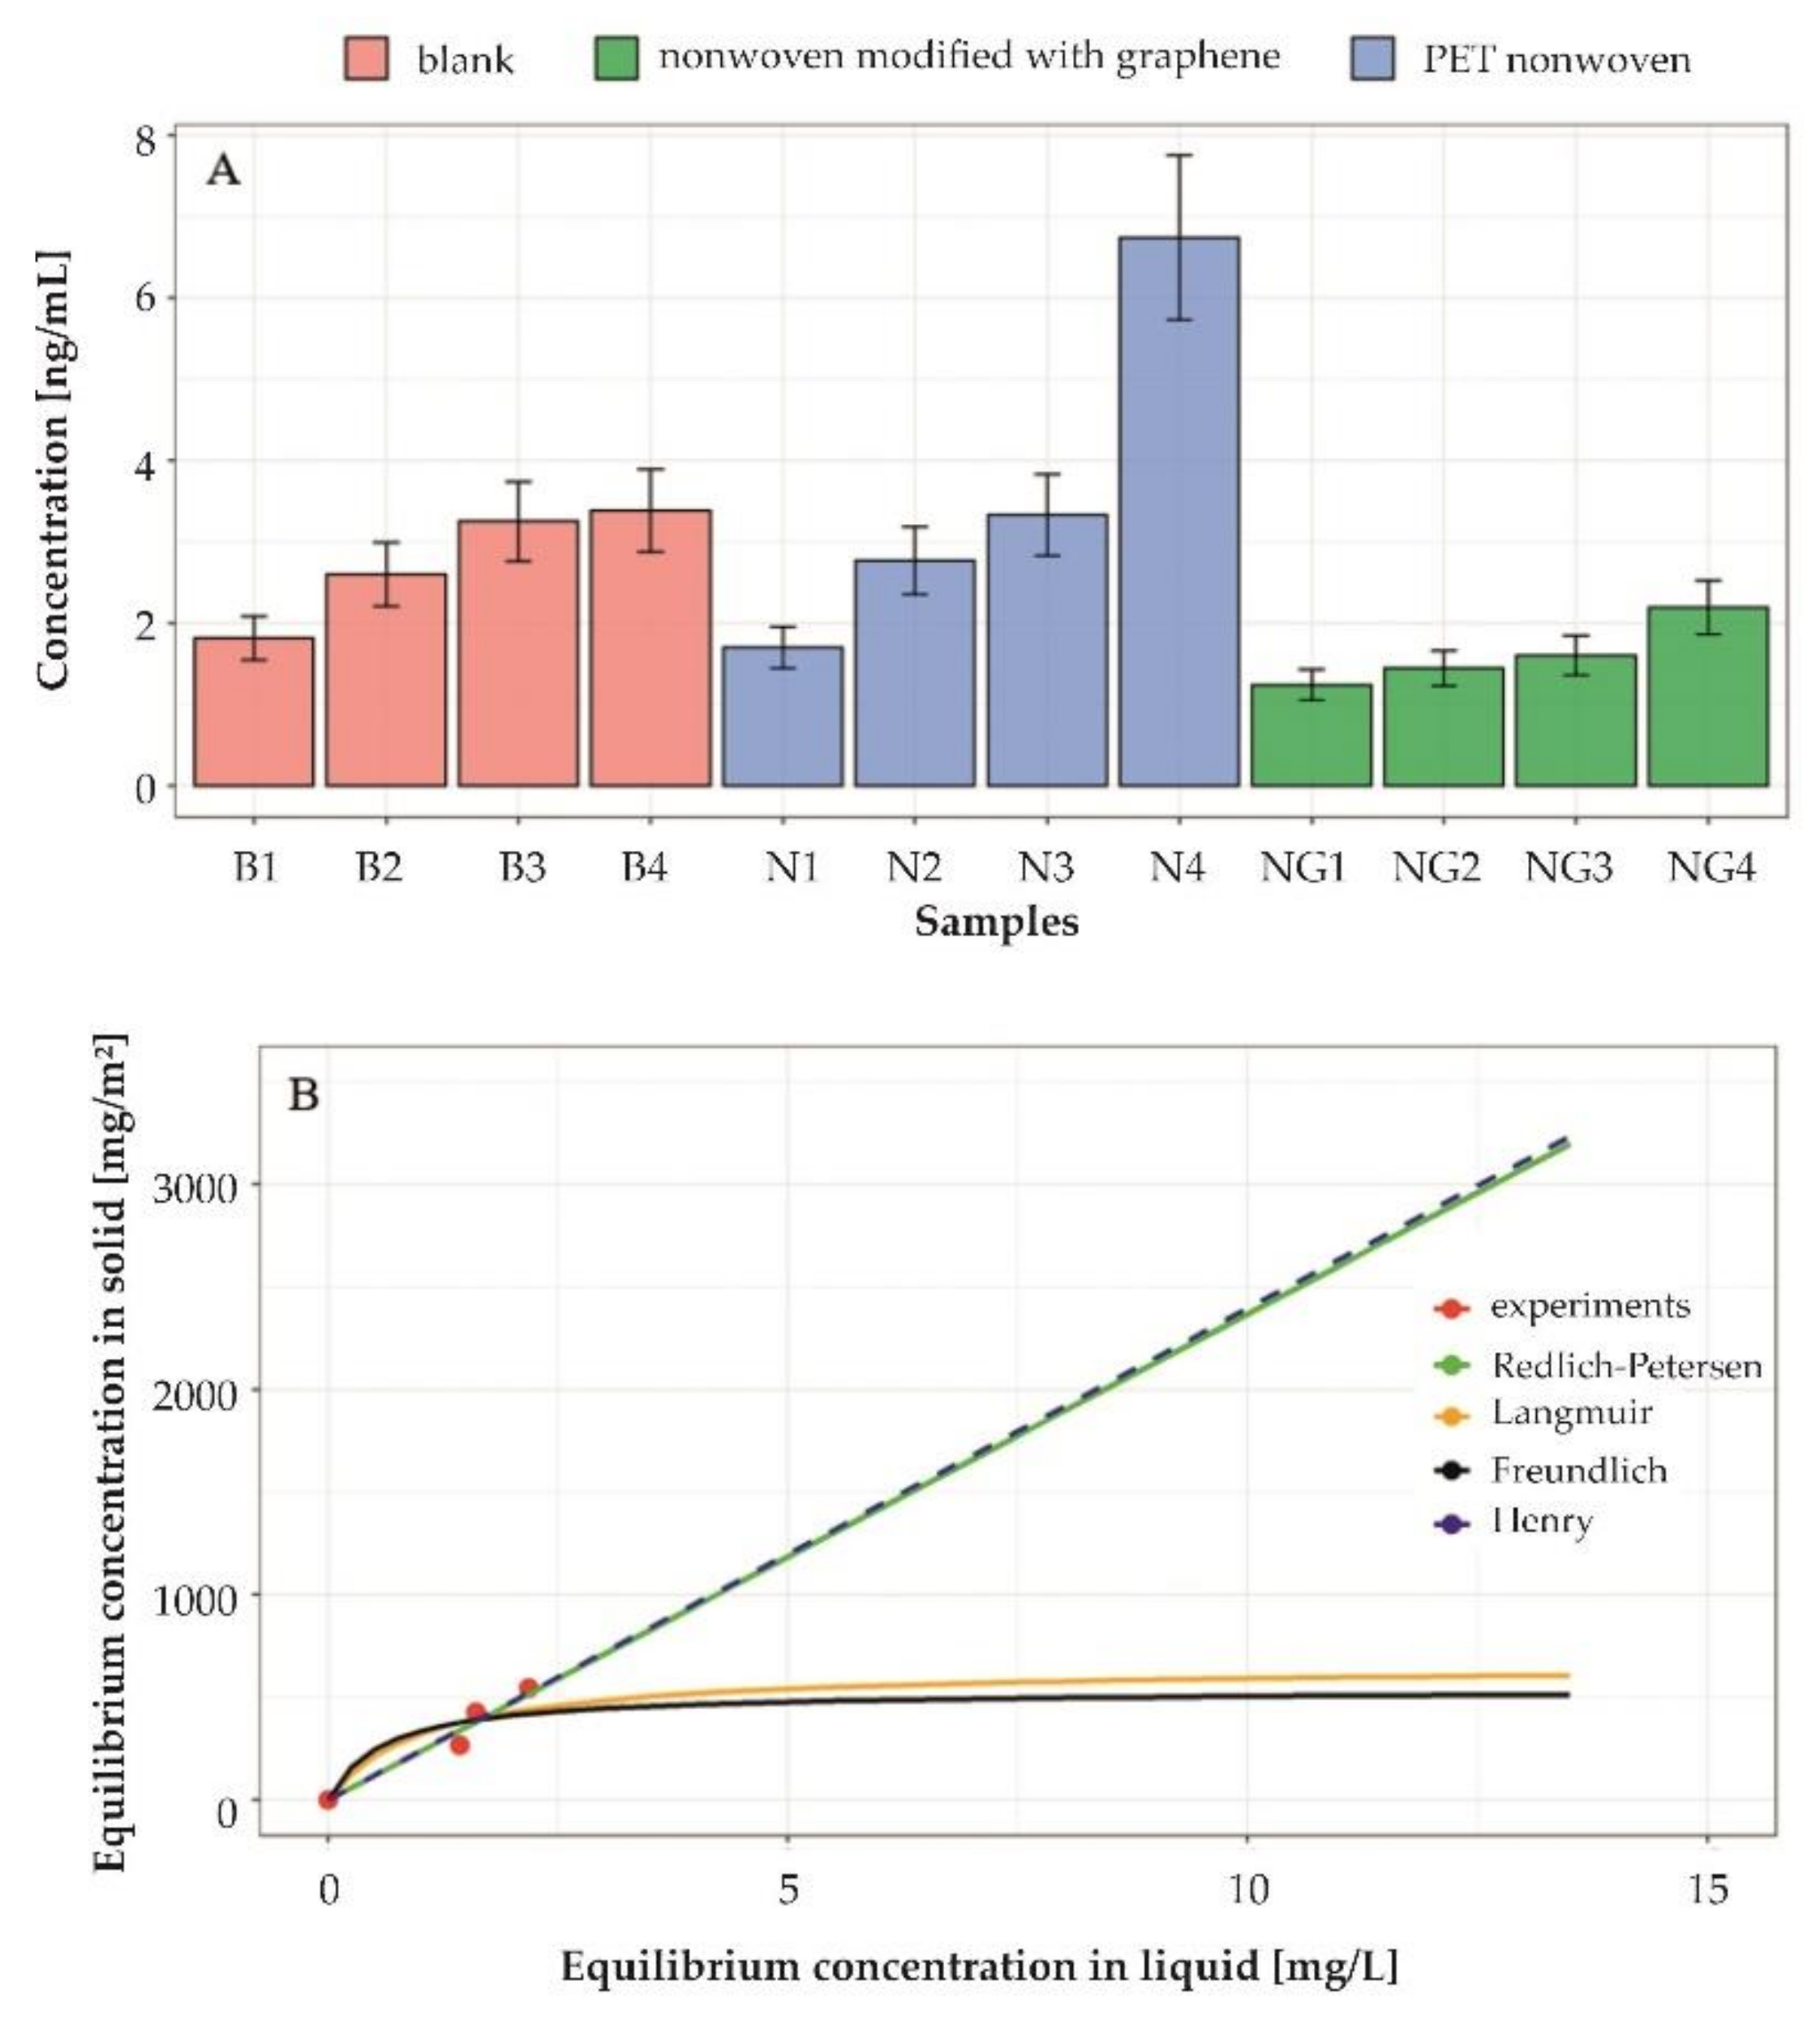
The main aim of this research work was to provide data on the adsorption of graphene at an environmentally relevant concentration of 0.01–10 ng/mL. To the best of our knowledge, there is a lack of a fundamental understanding of adsorption processes in this concentration range. The initial concentration was precisely adjusted to 4 ng/mL, 3 ng/mL, 2 ng/mL and 1 ng/mL. To ensure that traces of TCY are not adsorbed by the environment, like polymeric walls of the vessel, the ELISA experiment was carried out at blank conditions, including a pristine PET nonwoven and GMN. The results are shown in Figure 6. Both blank experiments and experiments that include PET nonwoven show a slight deviation from the theoretical values. These deviations can occur due to a minimal decomposition of TCY after 120 min of the adsorption experiment and/or some systematic errors during the preparation of the ELISA samples. At this low concentration scale, even some small experimental fluctuations (e.g., small changes in temperature or dilution errors) may influence the results. However, based on the related scientific literature, it can be concluded that these deviations are small, and the data are valid [38]. The optical density values for the GMN were clearly decreased compared to experiments at the blank conditions or by including the pristine PET nonwoven. This trend was true for all of the applied concentrations, which verifies even more strongly the validity of the given experiments. The statistical errors based on five measurements were low compared to typical standard deviations of 20%, e.g., in the detection of TCY in chicken tissues or other aromatic toxic compounds, like Bisphenol A that was measured in milk at ng/mL scale via chromatographic methods [54,55]. For the detection of TCY in wastewater and surface water via chromatographic methods, the accuracy and precision vary strongly in the ranges of 73–98% and 1–23%, respectively [56]. Those data underline that at this concentration range, the measurements are prone to systematic and statistical errors. Nevertheless, the results in our study exhibit very low statistical errors (through the application of a combined analytical workflow and sophisticated data analysis in an R environment). At the same time, the overall results emphasize the robustness of the ELISA method for detecting TCY, which is in good agreement with the study of Aga et al. [38].
For plotting the adsorption isotherms, four TCY concentration levels, namely 0 ng/mL, 2 ng/mL, 3 ng/mL, and 4 ng/mL, were chosen. The adsorption analysis based on only four data points is not common, as any deviation results in significant fitting errors, making applying adsorption isotherms difficult. However, recent studies successfully apply nonlinear regression techniques to fit adsorption isotherms with only five measurement points, e.g., in the study of Jasper et al. [57]. The PUPAIM package, as a collection of physical and chemical adsorption isotherm models, was utilized for a fast screening of the suitable models in our experiments, taking into account the fact that on the ng/mL scale a limited number of data points could be obtained [40]. This package also includes nonlinear regression algorithms, as in the case of the Redlich–Peterson isotherm, but the different isotherm equations were plotted separately using the “ggplot2” package.
The adsorption isotherms and related coefficients were determined in agreement with the review articles of Dabrowski et al. [41] and Ayawei et al. [42]. The Henry and Redlich–Peterson isotherms are more suitable to fit the adsorption process at a very low concentration of TCY (i.e., nearly infinite dilution, as it can be assumed that the molecules are secluded from each other and separately adsorb to the graphene layer). The fits of Henry and Redlich–Peterson isotherms are shown in Figure 7. Table 3 compiles the coefficients for different applied adsorption isotherms, highlighting that Henry and Redlich–Peterson fit the best for explaining the presented results in comparison to the Langmuir and Freundlich isotherms. However, in several cases in the recent literature, especially when the adsorption of low concentrations of environmentally toxic compounds was investigated, the Redlich–Peterson isotherm has been successfully applied to explain the experimental data [58,59,60].
Nevertheless, the low number of data points and presented systematic and statistical errors make it difficult to describe the adsorption mechanism quantitatively. In future research, more data with higher accuracy must be collected at the ng/mL scale to unambiguously interpret the adsorption characteristics for various adsorption substrates.

4. Conclusions

Based on the research carried out and presented above, the following formulations are valid:
  • The experimental GMN systems, which we present in this study, behave in agreement with statistical patterns—namely, logistic and lognormal fittings to describe the histograms of fiber diameter distributions;
  • For the industrial design of graphene-modified nonwovens, several strategies and textile auxiliaries may be considered, which allows us to state that the statistical classification strategy is a fast and feasible strategy for an initial screening of the prioritized structure–properties relationships;
  • The basic statistical classification of nonwoven morphology in two separate groups (i.e., different skewness and kurtosis parameters) allows us to reveal some correlations between kurtosis and fungi growth, indicating that physical mechanistic pathways exhibit a dominant role in fungi growth;
  • The morphological analysis did not allow us to correlate bacterial growth with the structural features of the two nonwoven classes. As a result, we conclude that chemical mechanisms may be more pronounced in inactivating bacteria;
  • Both different bacteria and fungi are important for fouling processes in MBR. Further research on optimizing the statistical analysis (e.g., machine learning algorithms) of morphology-related data and the correlation of those data to a broad range of microorganisms should be done for a fundamental and all-embracing understanding of biological fouling processes;
  • It was concluded that Henry and Redlich–Petersen isotherms describe the tetracycline adsorption process by graphene-modified nonwovens in a suitable way. The obtained results are of significant practical importance for wastewater treatment engineering combined with the adsorption process;
  • Data provided in this study will help in the effective initial tailoring of adsorptive nonwovens for applications in sewage plants.

Author Contributions

Conceptualization, I.K., F.A., D.P., S.K., S.H., T.T., A.G. and M.S.; methodology, I.K., M.S.; investigation, I.K., F.A., D.P., S.K., S.H., T.T., A.G. and M.S.; resources, I.K.; writing—original draft preparation, I.K.; writing—review and editing, M.S.; project administration, I.K. and M.S.; funding acquisition, I.K. and M.S. All authors have read and agreed to the published version of the manuscript.

Funding

The authors gratefully acknowledge the EU-funded network M-era.Net, as well as involved funding agencies BMBF (Germany) and NCBR (Poland), for the financial support of the “HyprSTEP” project (Reference Number: project6083).

Data Availability Statement

Not applicable.

Conflicts of Interest

The authors declare no conflict of interest.

Appendix A

Figure A1. Statistical evaluation of nonwoven samples at the initial state: (Top) Cullen and Frey graph, and (Bottom) Probability density plot, cumulative distribution function, Q–Q plot, and P–P plot.
Processes 10 02051 g0a1
Figure A2. Statistical evaluation of nonwoven samples modified with graphene: (Top) Cullen and Frey graph, and (Bottom) Probability density plot, cumulative distribution function, Q–Q plot, and P–P plot.
Processes 10 02051 g0a2
Figure A3. Statistical evaluation of nonwoven samples modified with hydrophilic agent: (Top) Cullen and Frey graph, and (Bottom) Probability density plot, cumulative distribution function, Q–Q plot, and P–P plot.
Processes 10 02051 g0a3
Figure A4. Statistical evaluation of nonwoven samples modified with a hydrophilic agent and graphene: (Top) Cullen and Frey graph, and (Bottom) Probability density plot, cumulative distribution function, Q–Q plot, and P–P plot.
Processes 10 02051 g0a4
Figure A5. Statistical evaluation of nonwoven samples modified with carbon-based functional coating: (Top) Cullen and Frey graph, and (Bottom) Probability density plot, cumulative distribution function, Q–Q plot, and P–P plot.
Processes 10 02051 g0a5
Figure A6. Statistical evaluation of nonwoven samples modified with carbon-based functional coating and graphene: (Top) Cullen and Frey graph, and (Bottom) Probability density plot, cumulative distribution function, Q–Q plot, and P–P plot.
Processes 10 02051 g0a6
Table A1. Goodness-of-fit statistics are illustrated for (I) initial state, (I + G) initial state and graphene, (Hy) hydrophilic agent, (Hy + G) hydrophilic agent and graphene, (FC) functional coating, and (FC + G) functional coating and graphene. Kolmogorov–Smirnov (KS), Cramer–von Mises (CVM), Andersen–Darling (AD) statistics and Akaikes’s (AIC) and Bayesian’s (BIC) Information Criterions were applied.
SamplesStatistical TestNormal DistributionLogistic DistributionWeibull DistributionLognormal DistributionGamma Distribution
IKS0.05910.04640.08510.0580
CVM0.05290.02150.20780.0598
AD0.32880.16341.31470.3957
AIC549.9551547.6779562.8373548.9707
BIC555.1654552.8882568.0477554.1810
I + GKS0.07360.16040.09890.1142
CVM0.13630.75700.17980.2592
AD1.34444.47281.05421.5239
AIC641.4852668.6332632.6182637.9469
BIC646.6956673.8435637.8285643.1572
HyKS0.12300.16540.16640.2153
CVM0.28370.56570.53410.8937
AD1.97303.20623.09755.0934
AIC660.6151669.6108669.4142687.5085
BIC665.8254674.6246674.6246692.7189
Hy + GKS0.08610.16070.20570.1824
CVM0.12700.59421.04620.7776
AD1.16563.56526.36504.8938
AIC610.3368632.5411661.0108645.9053
BIC615.5471637.7514666.2211651.1157
FCKS0.08490.15000.09670.1095
CVM0.15440.55490.14560.2030
AD1.32503.32170.82191.1429
AIC622.3762642.8090612.2101615.9995
BIC627.5865648.0194617.4204621.2099
FC + GKS0.05700.10860.04590.0589
CVM0.06260.27370.02310.0513
AD0.66941.82140.18090.3605
AIC686.1610695.2037676.5396678.5678
BIC691.3713700.4141681.7499683.7781

References

  1. Chee-Sanford, J.C.; Mackie, R.I.; Koike, S.; Krapac, I.G.; Lin, Y.-F.; Yannarell, A.C.; Maxwell, S.; Aminov, R.I. Fate and transport of antibiotic residues and antibiotic resistance genes following land application of manure waste. J. Environ. Qual. 2009, 38, 1086–1108. [Google Scholar] [CrossRef] [PubMed] [Green Version]
  2. Ocampo-Pérez, R.; Rivera-Utrilla, J.; Gómez-Pacheco, C.; Sánchez-Polo, M.; López-Peñalver, J.J. Kinetic study of tetracycline adsorption on sludge-derived adsorbents in aqueous phase. Chem. Eng. J. 2012, 213, 88–96. [Google Scholar] [CrossRef]
  3. Karthick, S.P.; Radha, K.V. Brief review of spectrophotometric methods for the detection of tetracycline antibiotics. Int. J. Pharm. Pharm. 2014, 6, 48–51. [Google Scholar]
  4. Aga, D.S.; O’Connor, S.; Ensley, S.; Payero, J.O.; Snow, D.; Tarkalson, D. Determination of the persistence of tetracycline antibiotics and their degradates in manure-amended soil using enzyme-linked immunosorbent assay and liquid chromatography−mass spectrometry. J. Agric. Food Chem. 2005, 53, 7165–7171. [Google Scholar] [CrossRef] [PubMed]
  5. Pena, A.; Paulo, M.; Silva, L.; Seifrtová, M.; Lino, C.; Solich, P. Tetracycline antibiotics in hospital and municipal wastewaters: A pilot study in Portugal. Anal. Bioanal. Chem. 2010, 396, 2929–2936. [Google Scholar] [CrossRef] [PubMed]
  6. Kim, H.-Y.; Asselman, J.; Jeong, T.-Y.; Yu, S.; De Schamphelaere, K.A.C.; Kim, S.D. Multigenerational effects of the antibiotic tetracycline on transcriptional responses of daphnia magna and its relationship to higher levels of biological organizations. Environ. Sci. Technol. 2017, 51, 12898–12907. [Google Scholar] [CrossRef] [PubMed]
  7. Nunes, B.; Antunes, S.C.; Gomes, R.; Campos, J.C.; Braga, M.R.; Ramos, A.S.; Correia, A.T. Acute effects of tetracycline exposure in the freshwater fish Gambusia holbrooki: Antioxidant effects, neurotoxicity and histological alterations. Arch. Environ. Contam. Toxicol. 2014, 68, 371–381. [Google Scholar] [CrossRef]
  8. Lesage, N.; Spérandio, M.; Cabassud, C. Study of a hybrid process: Adsorption on activated carbon/membrane bioreactor for the treatment of an industrial wastewater. Chem. Eng. Process. Process Intensif. 2008, 47, 303–307. [Google Scholar] [CrossRef]
  9. Lee, J.; Chae, H.-R.; Won, Y.-J.; Lee, K.; Lee, J.; Lee, H.; Kim, I.-C.; Lee, J.-M. Graphene oxide nanoplatelets composite membrane with hydrophilic and antifouling properties for wastewater treatment. J. Membr. Sci. 2013, 448, 223–230. [Google Scholar] [CrossRef]
  10. Cheng, D.; Ngo, H.-H.; Guo, W.; Chang, S.W.; Nguyen, D.D.; Zhang, X.; Varjani, S.; Liu, Y. Feasibility study on a new pomelo peel derived biochar for tetracycline antibiotics removal in swine wastewater. Sci. Total Environ. 2020, 720, 137662. [Google Scholar] [CrossRef] [PubMed]
  11. Khadem, M.; Husni Ibrahim, A.; Mokashi, I.; Hasan Fahmi, A.; Noeman Taqui, S.; Mohanavel, V.; Hossain, N.; Baba Koki, I.B.; Elfasakhany, A.; Dhaif-Allah, M.A.H.; et al. Removal of heavy metals from wastewater using low-cost biochar prepared from jackfruit seed waste. Biomass Conv. Bioref. 2022, 1–10. [Google Scholar] [CrossRef]
  12. Taqui, S.N.; Mohan, C.S.; Khatoon, B.A.; Soudagar, M.E.M.; Khan, T.M.; Mujtaba, M.A.; Ahmed, W.; Elfasakhany, A.; Kumar, R.; Pruncu, C.I. Sustainable adsorption method for the remediation of malachite green dye using nutraceutical industrial fenugreek seed spent. Biomass Conv. Bioref. 2021, 1–12. [Google Scholar] [CrossRef]
  13. Taqui, S.N.; Cs, M.; Goodarzi, M.S.; Elkotb, M.A.; Khatoon, B.A.; Soudagar, M.E.M.; Baba Koki, I.; Elfasakhany, A.; Salah Khalifa, A.; Ashraf Ali, M.; et al. Sustainable adsorption method for the remediation of crystal violet dye using nutraceutical industrial fenugreek seed spent. Appl. Sci. 2021, 11, 7635. [Google Scholar] [CrossRef]
  14. Joshi, N.C. Synthesis of r-GO/PANI/ZnO based material and its application in the treatment of wastewater containing Cd2+ and Cr6+ ions. Sep. Sci. Technol. 2022, 57, 1–12. [Google Scholar] [CrossRef]
  15. Kumar, N.; Joshi, N.C. Potential of PTH-Fe3O4 Based Nanomaterial for the Removal of Pb (II), Cd (II), and Cr (VI) Ions. J. Inorg. Organomet. Polym. Mater. 2022, 32, 1234–1245. [Google Scholar] [CrossRef]
  16. Joshi, N.C.; Gururani, P. Advances of graphene oxide based nanocomposite materials in the treatment of wastewater containing heavy metal ions and dyes. Curr. Res. Green Sustain. Chem. 2022, 5, 100306. [Google Scholar] [CrossRef]
  17. Kumar, N.; Joshi, N.C. Adsorption applications of synthetically prepared PANI-CuO based nanocomposite material. J. Indian Chem. Soc. 2022, 99, 100551. [Google Scholar] [CrossRef]
  18. Hou, J.; Chen, Z.; Gao, J.; Xie, Y.; Li, L.; Qin, S.; Wang, Q.; Mao, D.; Luo, Y. Simultaneous removal of antibiotics and antibiotic resistance genes from pharmaceutical wastewater using the combinations of up-flow anaerobic sludge bed, anoxic-oxic tank, and advanced oxidation technologies. Water Res. 2019, 159, 511–520. [Google Scholar] [CrossRef]
  19. Wang, J.; Zhuan, R. Degradation of antibiotics by advanced oxidation processes: An overview. Sci. Total Environ. 2019, 701, 135023. [Google Scholar] [CrossRef]
  20. Gururani, P.; Bhatnagar, P.; Bisht, B.; Kumar, V.; Joshi, N.C.; Tomar, M.S.; Pathak, B. Cold plasma technology: Advanced and sustainable approach for wastewater treatment. Environ. Sci. Pollut. Res. 2021, 28, 65062–65082. [Google Scholar] [CrossRef]
  21. Horng, R.-Y.; Shao, H.; Chang, W.-K.; Chang, M.-C. The feasibility study of using non-woven MBR for reduction of hydrolysed biosolids. Water Sci. Technol. 2006, 54, 85–90. [Google Scholar] [CrossRef] [PubMed]
  22. Chang, W.-K.; Hu, A.Y.-J.; Horng, R.-Y.; Tzou, W.-Y. Membrane bioreactor with nonwoven fabrics as solid–liquid separation media for wastewater treatment. Desalination 2006, 202, 122–128. [Google Scholar] [CrossRef]
  23. Khajavi, R.; Bahadoran, M.; Bahador, A.; Khosravi, A. Removal of microbes and air pollutants passing through nonwoven polypropylene filters by activated carbon and nanosilver colloidal layers. J. Ind. Text. 2013, 42, 219–230. [Google Scholar] [CrossRef]
  24. Bouazizi, N.; Mohammad, N.M.; El Achari, A.; Behary, N.; Campagne, C.; Vieillard, J.; Thoumire, O.; Azzouz, A. Development of new multifunctional filter based nonwovens for organics pollutants reduction and detoxification: High catalytic and antibacterial activities. Chem. Eng. J. 2019, 356, 702–716. [Google Scholar]
  25. Luo, J.; Lv, P.; Zhang, J.; Fane, A.G.; McDougald, D.; Rice, S.A. Succession of biofilm communities responsible for biofouling of membrane bio-reactors (MBRs). PLoS ONE 2017, 12, e0179855. [Google Scholar] [CrossRef] [PubMed] [Green Version]
  26. Peng, B.; Chen, L.; Que, C. Adsorption of antibiotics on graphene and biochar in aqueous solutions induced by π–π interactions. Sci. Rep. 2016, 6, 31920. [Google Scholar] [CrossRef] [PubMed] [Green Version]
  27. Al-Khateeb, L.A.; Almotiry, S.; Salam, M.A. Adsorption of pharmaceutical pollutants onto graphene nanoplatelets. Chem. Eng. J. 2014, 248, 191–199. [Google Scholar] [CrossRef]
  28. Zhao, J.; Ren, W.; Chenga, H.-M. Graphene sponge for efficient and repeatable adsorption and desorption of water contaminations. J. Mater. Chem. 2012, 22, 20197–20202. [Google Scholar] [CrossRef]
  29. Kang, X.; Wang, J.; Wu, H.; Liu, J.; Aksay, I.A.; Lin, Y. A graphene-based electrochemical sensor for sensitive detection of paracetamol. Talanta 2010, 81, 754–759. [Google Scholar] [CrossRef]
  30. Wang, J.; Chen, Z.; Chen, B. Adsorption of polycyclic aromatic hydrocarbons by graphene and graphene oxide nanosheets. Environ. Sci. Technol. 2014, 48, 4817–4825. [Google Scholar] [CrossRef]
  31. Yu, F.; Ma, J.; Bi, D. Enhanced adsorptive removal of selected pharmaceutical antibiotics from aqueous solution by activated graphene. Environ. Sci. Pollut. Res. 2015, 22, 4715–4724. [Google Scholar] [CrossRef] [PubMed]
  32. Wan, Z.; Hu, J.; Wang, J. Removal of sulfamethazine antibiotics using CeFe-graphene nanocomposite as catalyst by Fenton-like process. J. Environ. Manag. 2016, 182, 284–291. [Google Scholar] [CrossRef] [PubMed]
  33. Huang, D.; Wang, X.; Zhang, C.; Zeng, G.; Peng, Z.; Zhou, J.; Cheng, M.; Wang, R.; Hu, Z.; Qin, X. Sorptive removal of ionizable antibiotic sulfamethazine from aqueous solution by graphene oxide-coated biochar nanocomposites: Influencing factors and mechanism. Chemosphere 2017, 186, 414–421. [Google Scholar] [CrossRef] [PubMed]
  34. Bytesnikova, Z.; Richtera, L.; Smerkova, K.; Vojtech, A. Graphene oxide as a tool for antibiotic-resistant gene removal: A review. Environ. Sci. Pollut. Res. 2019, 26, 20148–20163. [Google Scholar] [CrossRef]
  35. Wang, X.; Yin, R.; Zeng, L.; Zhu, M. A review of graphene-based nanomaterials for removal of antibiotics from aqueous environments. Environ. Pollut. 2019, 253, 100–110. [Google Scholar] [CrossRef]
  36. Nakata, H.; Kannan, K.; Jones, P.D.; Giesy, J.P. Determination of fluoroquinolone antibiotics in wastewater effluents by liquid chromatography-mass spectrometry and fluorescence detection. Chemosphere 2005, 58, 759–766. [Google Scholar] [CrossRef]
  37. Dixon-Holland, D.E. ELISA and its application for residue analysis of antibiotics and drugs in products of animal origin. In Analysis of Antibiotic/Drug Residues in Food Products of Animal Origin; Agarwal, V.K., Ed.; Springer: Boston, MA, USA, 1992. [Google Scholar]
  38. Aga, D.S.; Lenczewski, M.; Snow, D.; Muurinen, J.; Sallach, J.B.; Wallace, J.S. Challenges in the measurement of antibiotics and in evaluating their impacts in agroecosystems: A critical review. J. Environ. Qual. 2016, 45, 407–419. [Google Scholar] [CrossRef] [Green Version]
  39. Ritz, C.; Baty, F.; Streibig, J.C.; Gerhard, D. Dose-response analysis using R. PLoS ONE 2015, 10, e0146021. [Google Scholar] [CrossRef] [Green Version]
  40. Saroyda, J.R.V.; Cruz, R.Y.S.; Antonio, R.J.C.; Flestado, C.L.P.; Magalong, J.R.S.; Zagala, K.Z.P.; Barbacena, C.L.; Bumatay, J.M.; Bautista, L.F.; Deocaris, C.C. PUPAIM: A Collection of Physical and Chemical Adsorption Isotherm Models. Version 3.6.0. 2020. Available online: https://cran.r-project.org/web/packages/PUPAIM/index.html (accessed on 12 September 2022).
  41. Dąbrowski, A.; Goworek, J.; Podkościelny, P.; Garbacz, J.K. Application of adsorption from solutions for characterizing inorganic sorbents. In Fundamentals of Adsorption; LeVan, M.D., Ed.; The Kluwer International Series in Engineering and Computer Science, 356; Springer: Boston, MA, USA, 1996. [Google Scholar]
  42. Ayawei, N.; Ebelegi, A.N.; Wankasi, D. Modelling and interpretation of adsorption isotherms. J. Chem. 2017, 2017, 1–11. [Google Scholar] [CrossRef] [Green Version]
  43. Delignette-Muller, M.L.; Dutang, C. fitdistrplus: An R package for fitting distributions. J. Stat. Softw. 2015, 64, 1–34. [Google Scholar] [CrossRef] [Green Version]
  44. Hegab, H.M.; ElMekawy, A.; Zou, L.; Mulcahy, D.; Saint, C.P.; Ginic-Markovic, M. The controversial antibacterial activity of graphene-based materials. Carbon 2016, 105, 362–376. [Google Scholar] [CrossRef]
  45. Pan, Q.; Shim, E.; Pourdeyhimi, B.; Gao, W. Highly conductive polypropylene–graphene nonwoven composite via interface engineering. Langmuir 2017, 33, 7452–7458. [Google Scholar] [CrossRef] [PubMed]
  46. Harruddin, N.; Saufi, S.M.; Faizal, C.K.M.; Mohammad, A.W. Effect of VIPS fabrication parameters on the removal of acetic acid by supported liquid membrane using a PES–graphene membrane support. RSC Adv. 2018, 8, 25396–25408. [Google Scholar] [CrossRef] [PubMed] [Green Version]
  47. Polak, D.; Zielińska, I.; Szwast, M.; Kogut, I.; Małolepszy, A. Modification of Ceramic Membranes with Carbon Compounds for Pharmaceutical Substances Removal from Water in a Filtration—Adsorption System. Membranes 2021, 11, 481. [Google Scholar] [CrossRef]
  48. Kumar, P.; Huo, P.; Zhang, R.; Liu, B. Antibacterial Properties of Graphene-Based Nanomaterials. Nanomaterials 2019, 9, 737. [Google Scholar] [CrossRef] [Green Version]
  49. Qiu, J.; Liu, L.; Zhu, H.; Liu, X. Combination types between graphene oxide and substrate affect the antibacterial activity. Bioact. Mater. 2018, 3, 341–346. [Google Scholar] [CrossRef]
  50. de Moraes, A.C.; Lima, B.A.; de Faria, A.F.; Brocchi, M.; Alves, O.L. Graphene oxide-silver nanocomposite as a promising biocidal agent against methicillin-resistant Staphylococcus aureus. Int. J. Nanomed. 2015, 10, 6847–6861. [Google Scholar] [CrossRef] [Green Version]
  51. Pranno, N.; La Monaca, G.; Polimeni, A.; Sarto, M.S.; Uccelletti, D.; Bruni, E.; Cristalli, M.P.; Cavallini, D.; Vozza, I. Antibacterial activity against Staphylococcus aureus of titanium surfaces coated with graphene nanoplatelets to prevent peri-implant diseases. An in-vitro pilot study. Int. J. Environ. Res. Public Health 2020, 17, 1568. [Google Scholar] [CrossRef] [Green Version]
  52. Agarwalla, S.V.; Ellepola, K.; de Costa, M.; Fechine, G.J.M.; Morin, J.; Castro Neto, A.H.; Seneviratne, C.J.; Vinicius, R. Hydrophobicity of graphene as a driving force for inhibiting biofilm formation of pathogenic bacteria and fungi. Dent. Mater. J. 2019, 35, 403–413. [Google Scholar] [CrossRef]
  53. Zhu, L.; Perwuelz, A.; Lewandowski, M.; Campagne, C. Static and dynamic aspects of liquid capillary flow in thermally bonded polyester nonwoven fabrics. J. Adhes. Sci. Technol. 2008, 22, 745–760. [Google Scholar]
  54. Shahbazi, Y.; Ahmadi, F.; Karami, N. Screening, determination and confirmation of tetracycline residues in chicken tissues using four-plate test, ELISA and HPLC-UV methods: Comparison between correlation results. Food Agric. Immunol. 2015, 26, 821–834. [Google Scholar] [CrossRef]
  55. Liu, X.; Ji, Y.; Zhang, H.; Liu, M. Elimination of matrix effects in the determination of bisphenol A in milk by solid-phase microextraction-high-performance liquid chromatography. Food Addit. Contam. Part A Chem. Anal. Control Expo. Risk. Assess. 2008, 25, 772–778. [Google Scholar] [CrossRef] [PubMed]
  56. Pailler, J.Y.; Krein, A.; Pfister, L.; Hoffmann, L.; Guignard, C. Solid phase extraction coupled to liquid chromatography-tandem mass spectrometry analysis of sulfonamides, tetracyclines, analgesics and hormones in surface water and wastewater in Luxembourg. Sci. Total Environ. 2009, 407, 4736–4743. [Google Scholar] [CrossRef] [PubMed]
  57. Jasper, E.; Ajibola, V.O.; Onwuka, J. Nonlinear regression analysis of the sorption of crystal violet and methylene blue from aqueous solutions onto an agro-waste derived activated carbon. Appl. Water Sci. 2020, 10, 1–11. [Google Scholar] [CrossRef]
  58. Bridelli, M.; Crippa, P. Theoretical analysis of the adsorption of metal ions to the surface of melanin particles. Adsorption 2008, 14, 101–109. [Google Scholar] [CrossRef]
  59. Abdullah, M.A.; Chiang, L.; Nadeem, M. Comparative evaluation of adsorption kinetics and isotherms of a natural product removal by Amberlite polymeric adsorbents. Chem. Eng. J. 2009, 146, 370–376. [Google Scholar]
  60. Zielińska, I.; Polak, D.; Szwast, M. Analysis of the adsorption of selected pharmaceuticals on a composite material PEBAX/GO. J. Water Process Eng. 2021, 44, 102272. [Google Scholar] [CrossRef]
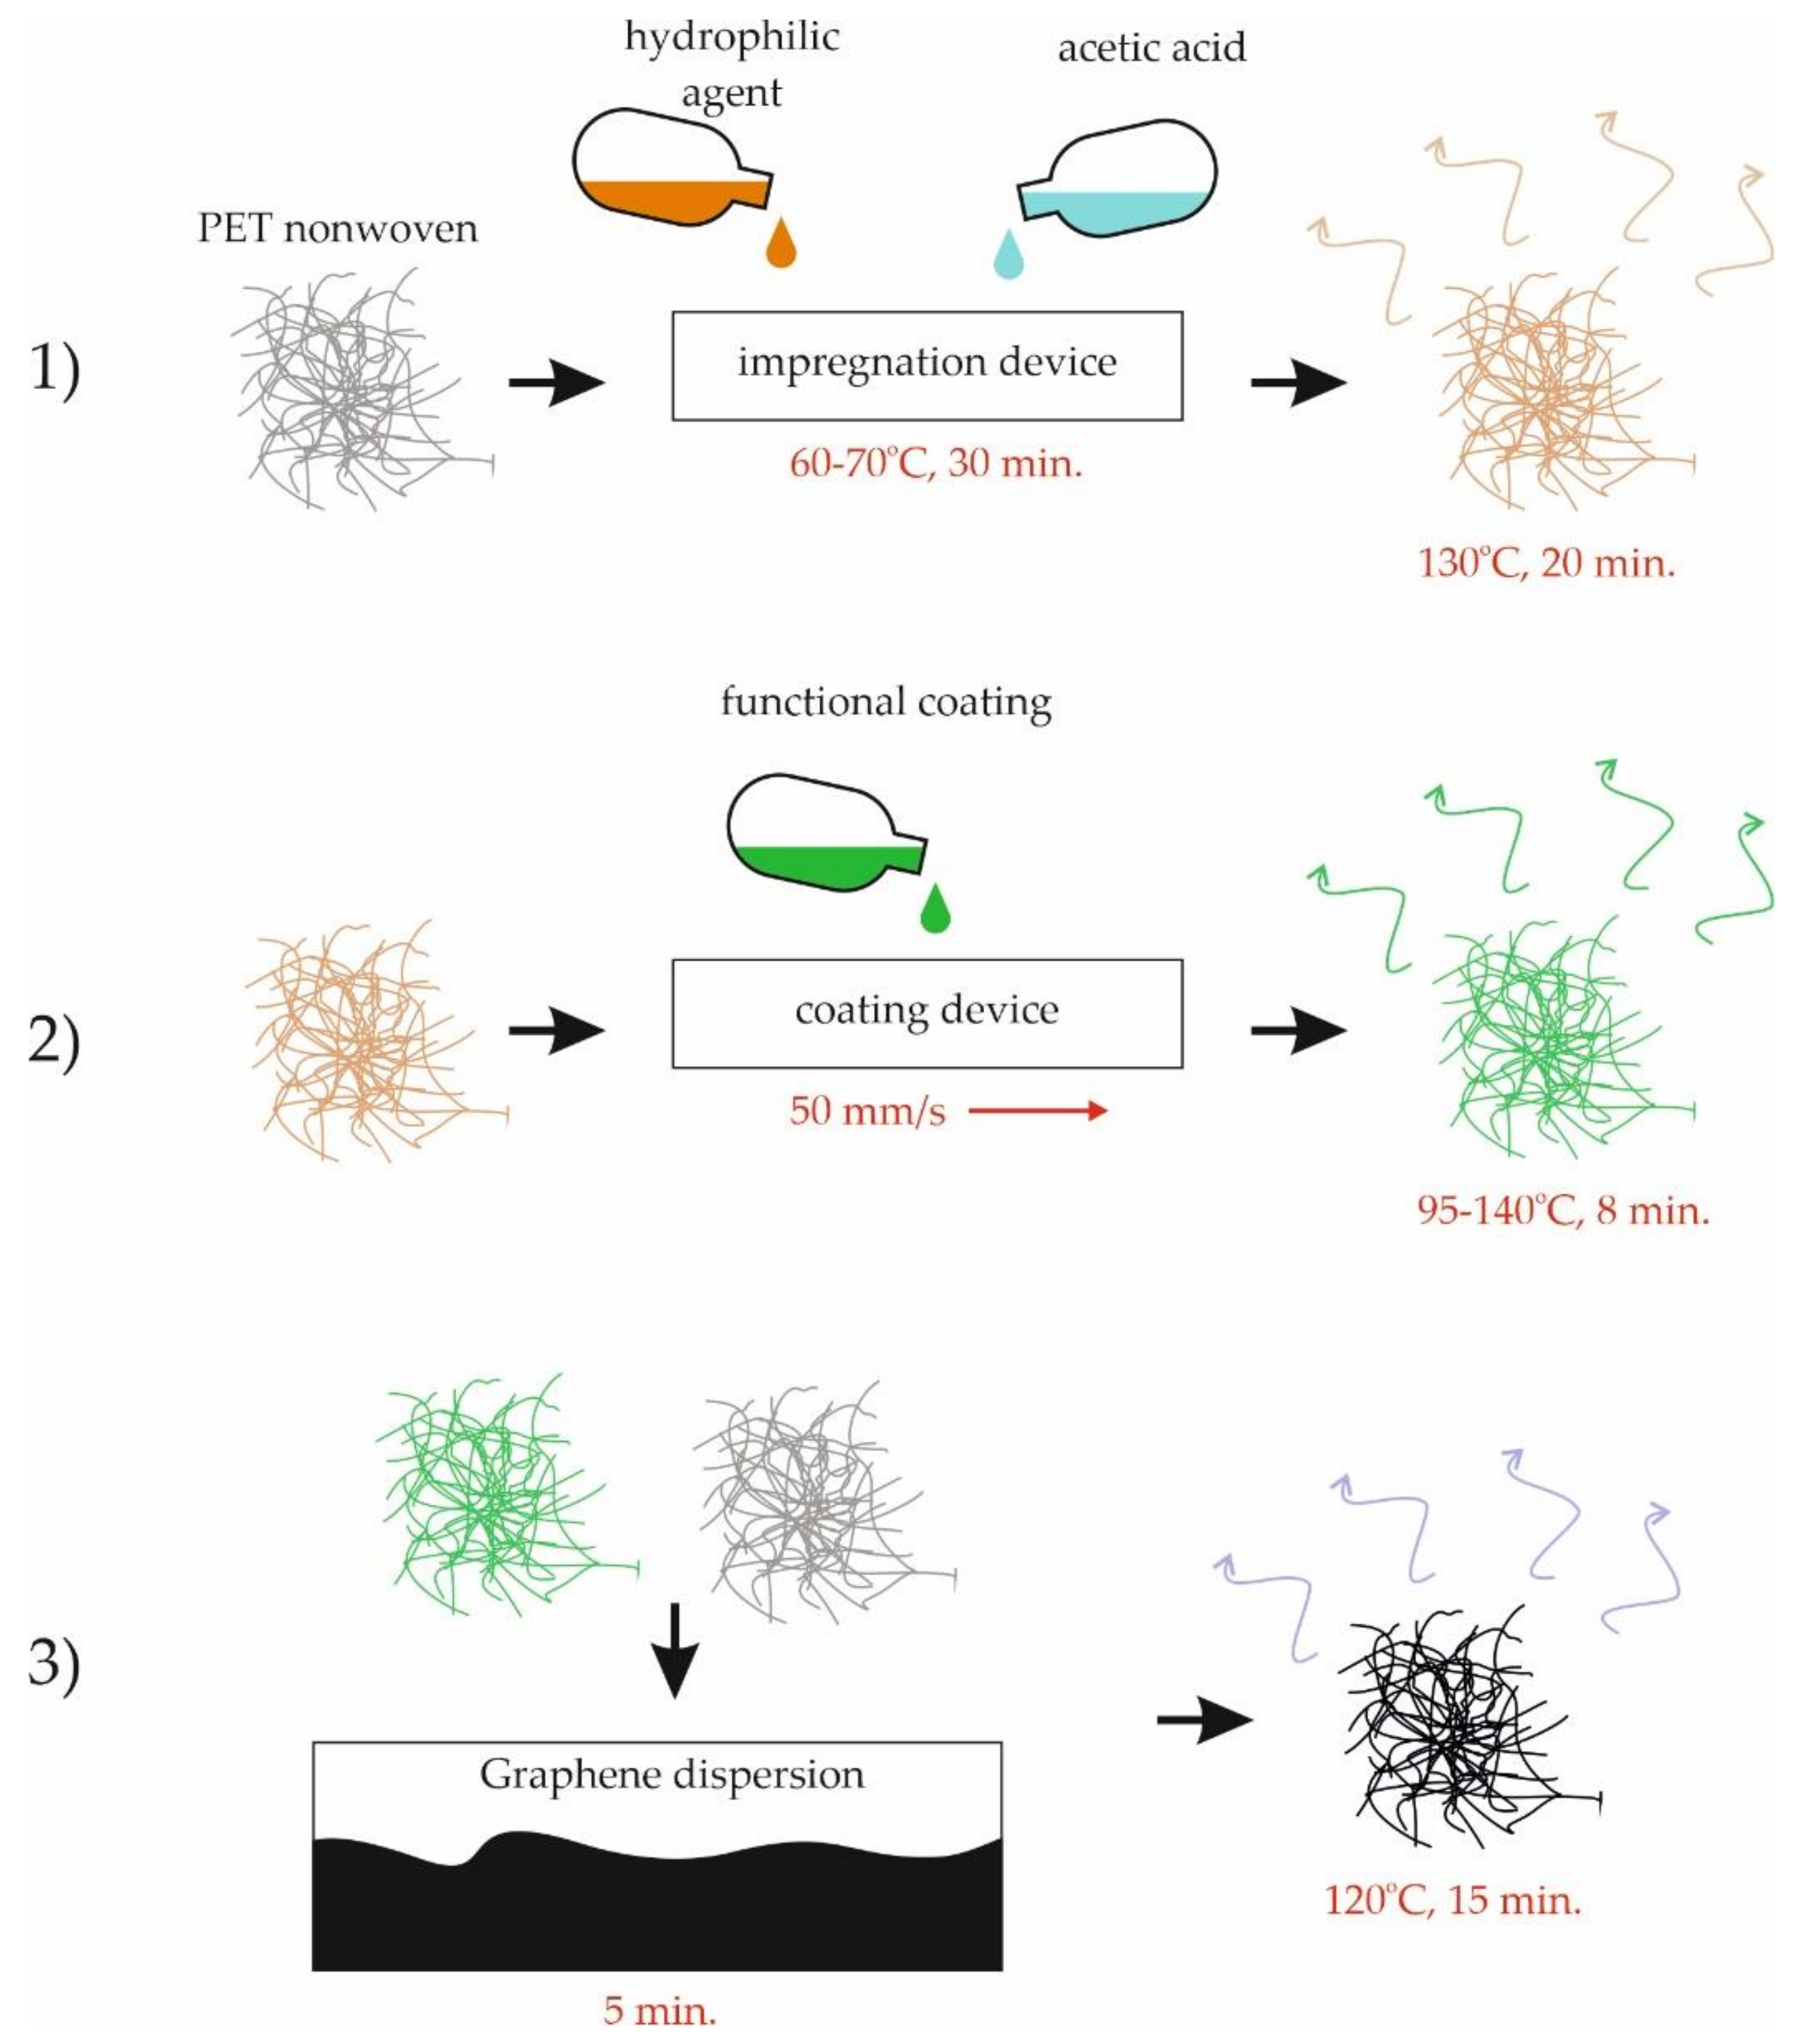
Figure 1. Flow chart of material’s fabrication in 3 steps: (1) treatment by hydrophilic agent and acetic acid, (2) treatment by functional coating, (3) treatment by graphene dispersion.
Processes 10 02051 g001
Figure 2. Microscopy images are shown of (A) initial state, (B) initial state and graphene, (C) hydrophilic agent, (D) hydrophilic agent and graphene, (E) functional coating, and (F) functional coating and graphene. SEM images at the magnification of 300 for the same morphological structures (GL) are demonstrated.
Processes 10 02051 g002
Figure 3. Histograms of pore size distributions for the different non-modified and modified nonwovens are shown, namely for (A) initial state (I), (B) initial state and graphene (I + G), (C) hydrophilic agent (Hy), (D) hydrophilic agent and graphene (Hy + G), (E) functional coating (FC), and (F) functional coating and graphene (FC + G).
Processes 10 02051 g003
Figure 4. The assessment of antibacterial activity for the different non-modified and modified nonwovens is shown, namely for (I) initial state, (I + G) initial state and graphene, (Hy) hydrophilic agent, (Hy + G) hydrophilic agent and graphene, (FC) functional coating and (FC + G) functional coating and graphene. (A) The antibacterial assessment by applying the Staphylococcus aureus bacteria strain, and (B) applying the Klebsiella pneumoniae bacteria strain on the nonwoven surfaces.
Processes 10 02051 g004
Figure 5. The assessment of antifungal activity for the different non-modified and modified nonwovens is shown, namely for (I) initial state, (I + G) initial state and graphene, (Hy) hydrophilic agent, (Hy + G) hydrophilic agent and graphene, (FC) functional coating and (FC + G) functional coating and graphene.
Processes 10 02051 g005
Figure 6. Correlation matrix between morphological features and biocide properties of the investigated nonwoven samples. (min = minimum, max = maximum, sd = standard deviation, red. value = reduction values of Staphylococcus aureus (S.a.) and Klebsiella pneumoniae [K.p.].)
Processes 10 02051 g006
Figure 7. (A) Adsorption experiments for blank, nonwoven, and GMN samples for ng/mL scale, as measured via ELISA, and (B) the different adsorption isotherms as fits for experimental data.
Processes 10 02051 g007
Table 1. Overview of statistical data for the different non-modified and modified nonwovens is shown, namely for (I) initial state, (I + G) initial state and graphene, (Hy) hydrophilic agent, (Hy + G) hydrophilic agent and graphene, (FC) functional coating and (FC + G) functional coating and graphene.
Statistical ParametersII + GHyHy + GFCFC + G
minimum1618882019
maximum395142454752
median25.0126.9826.0525.2828.1029.87
estimated standard deviation3.736.256.775.505.477.41
estimated skewness0.331.41−0.41−0.351.070.78
estimated kurtosis4.125.664.236.344.263.49
Table 2. Overview of statistical data of pore size distributions for the different non-modified and modified nonwovens is shown, namely for (I) initial state, (I + G) initial state and graphene, (Hy) hydrophilic agent, (Hy + G) hydrophilic agent and graphene, (FC) functional coating and (FC + G) functional coating and graphene.
Statistical ParametersII + GHyHy + GFCFC + G
minimum757070752030
maximum15516017517010085
median115.00115.00122.50122.5060.0057.50
mean99.64105.71108.66106.9732.2959.71
estimated standard deviation17.8721.5823.2321.3816.9817.18
estimated skewness0.890.420.620.70−0.75−0.90
estimated kurtosis−0.15−0.81−0.29−0.08−0.01−0.71
Table 3. Isotherm coefficients and fit statistics for Langmuir, Freundlich, Henry and Redlich–Peterson isotherms. (α = isotherm constant, β = exponent that lies between 0 and 1, K = constants for different isotherms, R2 = coefficient of determination).
Statistical ParametersLangmuirFreundlichHenryRedlich–Peterson
α [L/mg]6555350.0001
β [–]0.5
KHE, KL, KF, KRP [L/m2]0.951.7239.5237
R2 [–]0.860.830.950.95
Publisher’s Note: MDPI stays neutral with regard to jurisdictional claims in published maps and institutional affiliations.