Article

New Model for Non-Spherical Particles Drag Coefficients in Non-Newtonian Fluid

1
State Key Laboratory of Shale Oil and Gas Enrichment Mechanisms and Effective Development, Beijing 102206, China
2
Sinopec Research Institute of Petroleum Engineering Co., Ltd., Beijing 102206, China
3
College of Petroleum Engineering, Northeast Petroleum University, Daqing 163318, China
*
Author to whom correspondence should be addressed.
Processes 2022, 10(10), 1990; https://doi.org/10.3390/pr10101990
Submission received: 8 September 2022 / Revised: 25 September 2022 / Accepted: 28 September 2022 / Published: 2 October 2022
(This article belongs to the Section Particle Processes)

Abstract

:
The settlement drag coefficient of non-spherical particles (SDCNPs) is a crucial parameter in the field of petroleum engineering. Accurately predicting the SDCNPs in the fluid is essential to the selection and design of proppant and hydraulic design in the fracturing scheme. Although many models for anticipating the SDCNPs have been proposed, none of them can be adopted for non-Newtonian fluid (NNF) and Newtonian fluid (NF). In the investigation, the SDCNPs in NF and NNF are studied experimentally, and the anticipation mode of the settlement drag coefficient of spherical particles (SDCSPs) in different fluids (including Newton, Herschel-Bulkley and power law) is proposed. On this basis, the shape depiction parameter circularity is introduced to develop the SDCNPs. The results exhibit that the predicted values of the SDCNPs model perfectly align with the experimental values, and the average relative errors are 5.70%, 6.24% and 6.72%, respectively. The mode can accurately describe the settlement behavior of non-spherical particles (NSPs) and provide a basis for the application of NSPs in petroleum engineering.

1. Introduction

The particle sedimentation phenomenon widely exists in nature and is widely used in industry [1,2]. The study of particle settling velocity (PSV) is a classical problem in petroleum engineering. PSV is a key parameter in petroleum engineering applications. For example, proppant placement efficiency in fracturing and prediction of solid concentration distribution in mud pipelines are related to particle settling velocity [3]. The accurate calculation of particle settlement velocity depends on its settlement drag coefficient (CD). Therefore, accurate prediction of particle settlement drag coefficient is of great significance for construction parameter optimization and equipment design, and has attracted a large number of researchers to study it.
In the early research, scholars mainly studied the settlement drag coefficient of spherical particles (SDCSPs) in Newtonian fluid (NF). As early as 1851, Stokes [4] established an anticipation formula for the drag coefficient (DC) of spherical particles (SPs) in NF. However, this formula is only applicable to cases with a low Reynolds number. For the higher Reynolds number of particles, the result obtained by using Stokes drag formula has a large error. Subsequently, Abraham [5], Clift [6], Brown [7] and Terfous [8], respectively, established CD-ReN correlations under different Reynolds numbers (ReN). Agwu [9], Goossens [10] and Shanshan Yao [11], respectively, summarized the CD-ReN correlation of spherical particles in NF.
Compared with the research work of SPs in Newtonian fluid (NF), less attention is paid to the settling behaviour of SPs in non-Newtonian fluid (NNF). In the early stage, Chhabra [12], Lali [13], kelesidis [14] and others believed that the SDCSPs were independent of the fluid rheology, so the calculation formula of the settlement drag coefficient of particles (SDCPs) in NF can be directly applied to non-Newtonian fluid. With the deepening of research, Subhash [15] and James [16] believe that the particle settling drag coefficient (SDC) constitutes a role of Reynolds number (RN) and a function of flow pattern index n. Kelesidis [17], Turton [18], Haider [19], Cheng [20], Song [21], okesanya [22] and Khan [23] proposed different CD-ReN correlations based on the fluidity index of non-Newtonian fluids. In addition, for viscoelastic fluids, they have both shear thinning and considerable elasticity. Zhang [24] and padhy [25] proposed CD-ReN correlation for viscoelastic fluids by comprehensively considering the shear thinning and elasticity of polymer solutions.
The SDCPs is impacted not only by the rheological property of the fluid, but also by its shape. For irregular particles, scholars have proposed some concepts to characterize the particle shape features, like roughness [26], sphericity [27], circularity [28], Corey shape factor [29] and combined shape factor [30]. On this basis, Hölzer [31], Yin Wang [32], Chien [33], Fabio [34], Xu and others [35], respectively, put forward CD-ReN relations, which is applicable to irregular-shaped sand particles. In addition, other methods have also been used to calculate the SDCNPs. The artificial intelligence-based machine learning algorithm is used by Rushd [36] and Barati [37] to predict the SDCNPs in different fluids. Akanni [38] and Gavrilov [39] used numerical simulation methods to calculated the SDCNPs. Zhou [40] and Okesanya [41] used imaging measurements to measure the SDCNPs and established the SDCNPs model.
At present, most liquids employed in petroleum engineering are NNFs (mainly power-law fluids and Herschel-Bulkley fluids). Although many calculation models of particle settling drag coefficient have been proposed, there is no one that can be adopted to NF and NNF. In addition, common proppant and rock debris are irregular shapes, so it is necessary to use the shape factor to correct CD-ReN. Sphericity is the most widely used geometrical parameter. However, the sphericity constitutes a function of the particle surface area while it’s hard to determine the sphericity of the particles with highly irregular shapes such as rock debris, which leads to a large error in calculating the settlement velocity using the sphericity. Therefore, how to accurately depict non-spherical particle irregularity and establish the corresponding CD-ReN correlation is an urgent problem to solve in the fluid field.
In this study, the SDCs of SPs and irregular sand particles in NF and NNF are comprehensively analyzed and experimentally studied. Based on the classical empirical model, a general mathematical formula is established for anticipating the SDC of non-spherical particles (SDCNPs) in NNF through introduction of the 2D shape description parameter circularity (c), sensitive to particle profile irregularity and easy to determine. The established model may better depict the settling behaviour of non-spherical particles (NSPs) in NNF. The investigation is crucial to anticipating the SDC of irregular shaped particles in NNFs in petroleum engineering, enriching the research content of solid-liquid two-phase flow and perfecting the multiphase flow theory.

2. Research Methods

2.1. Testing Materials and Fluid Rheology

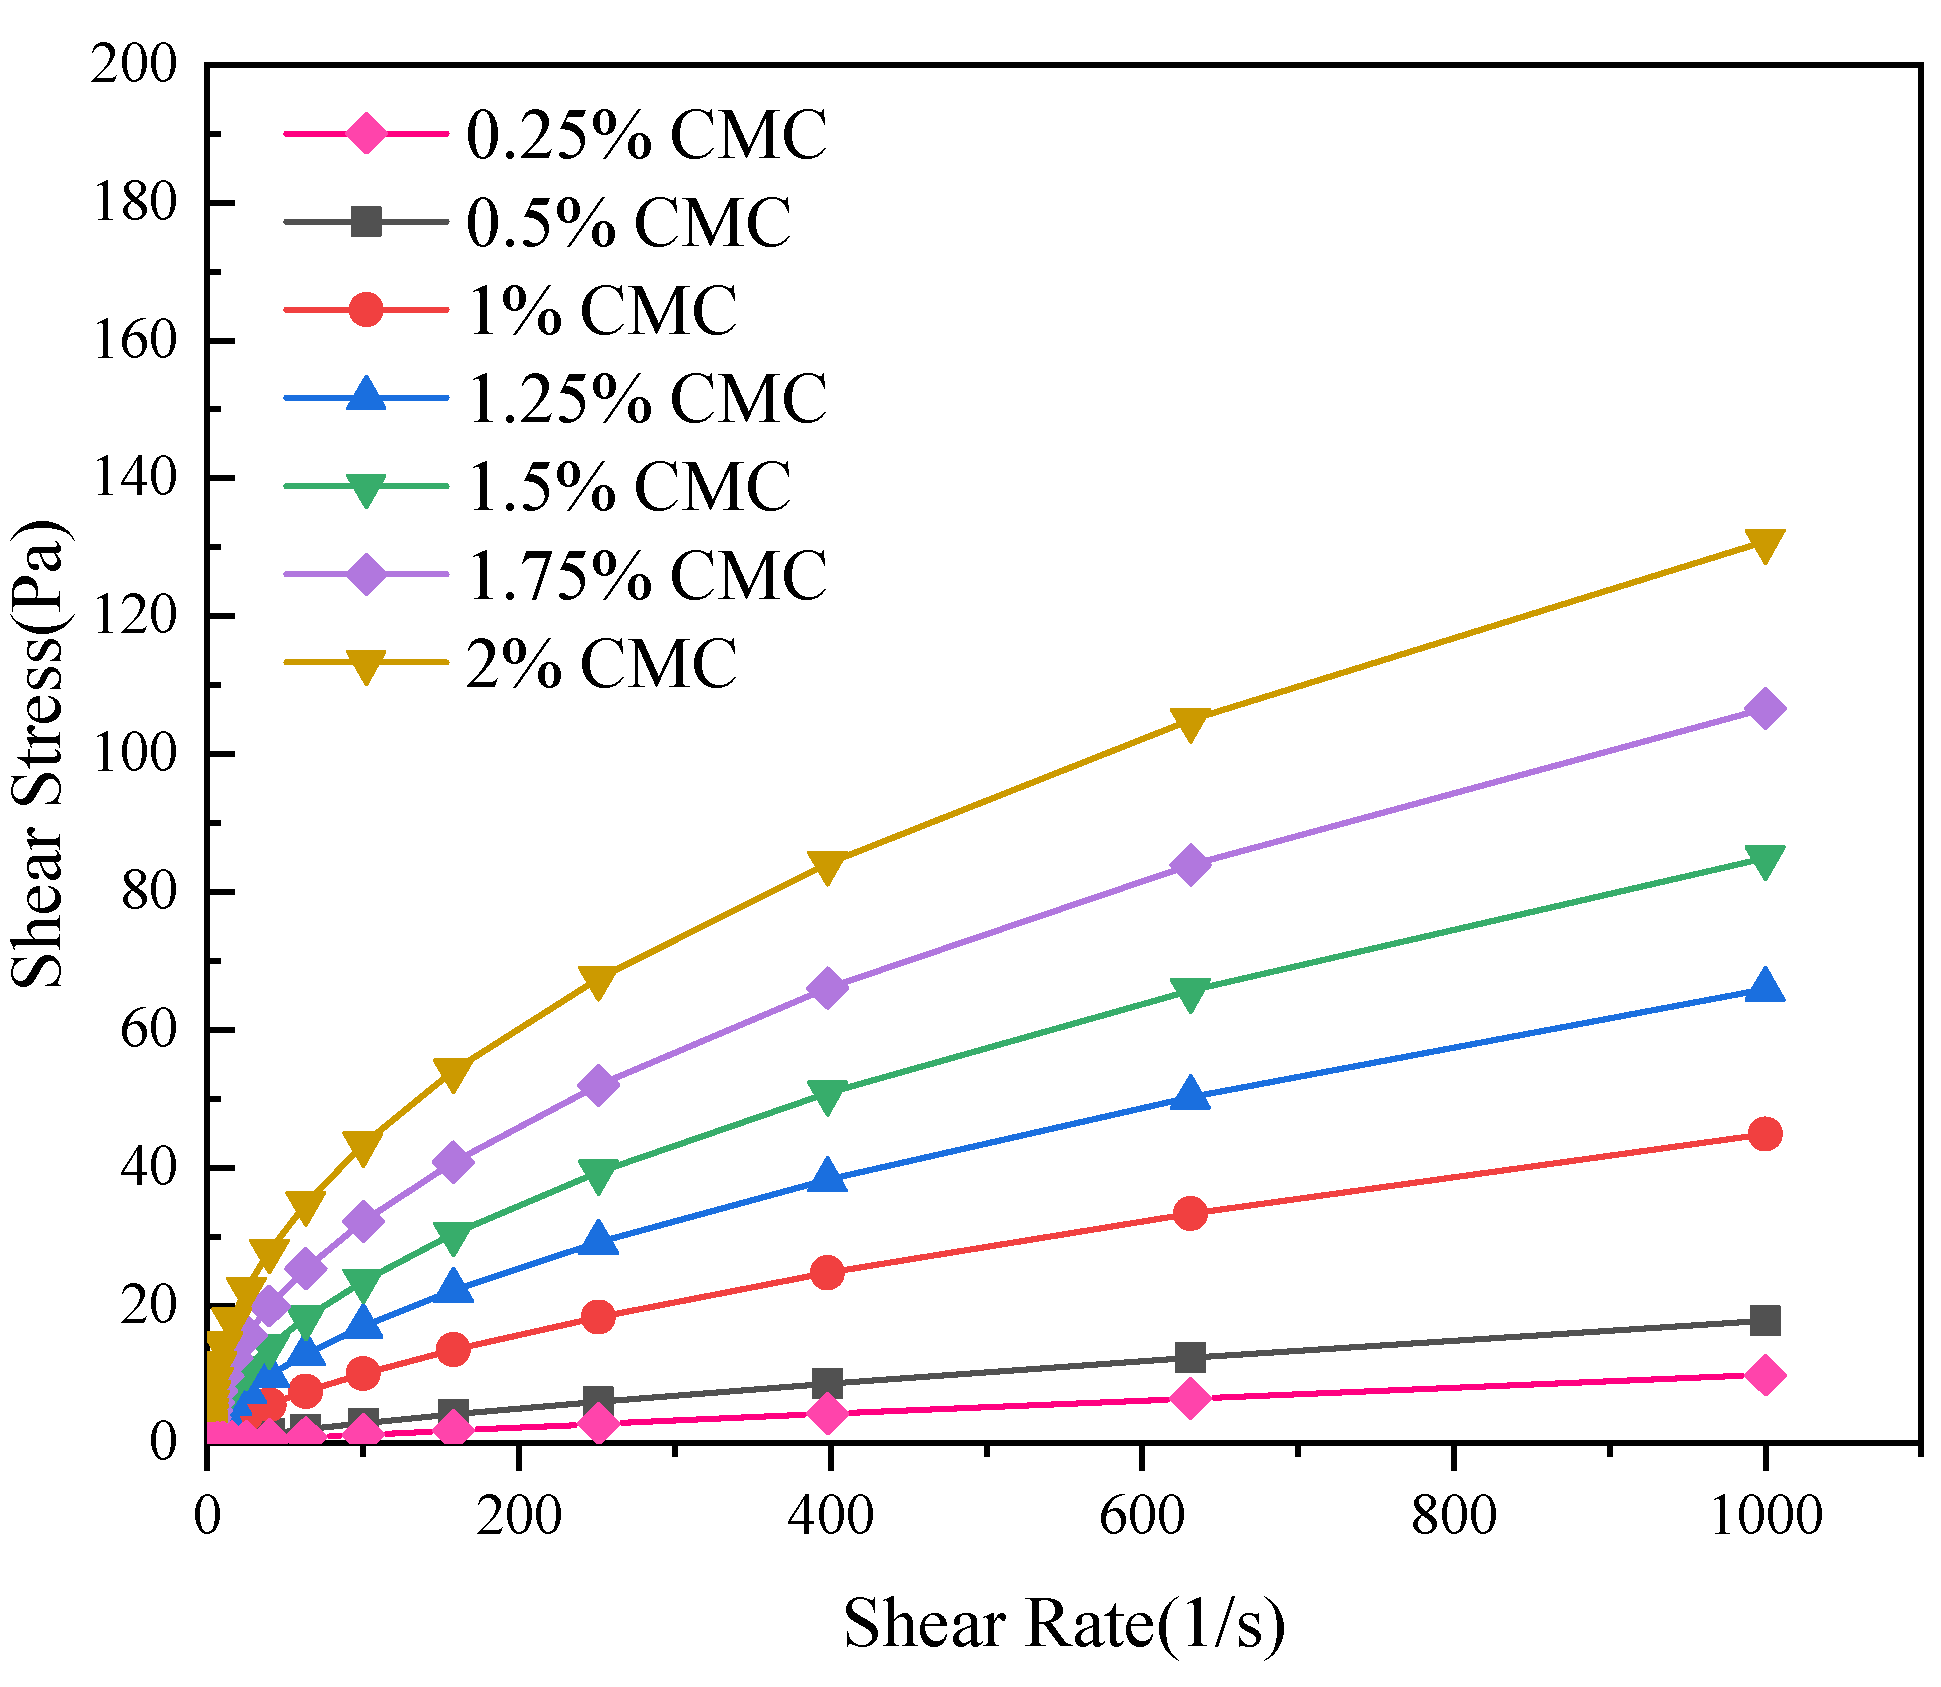
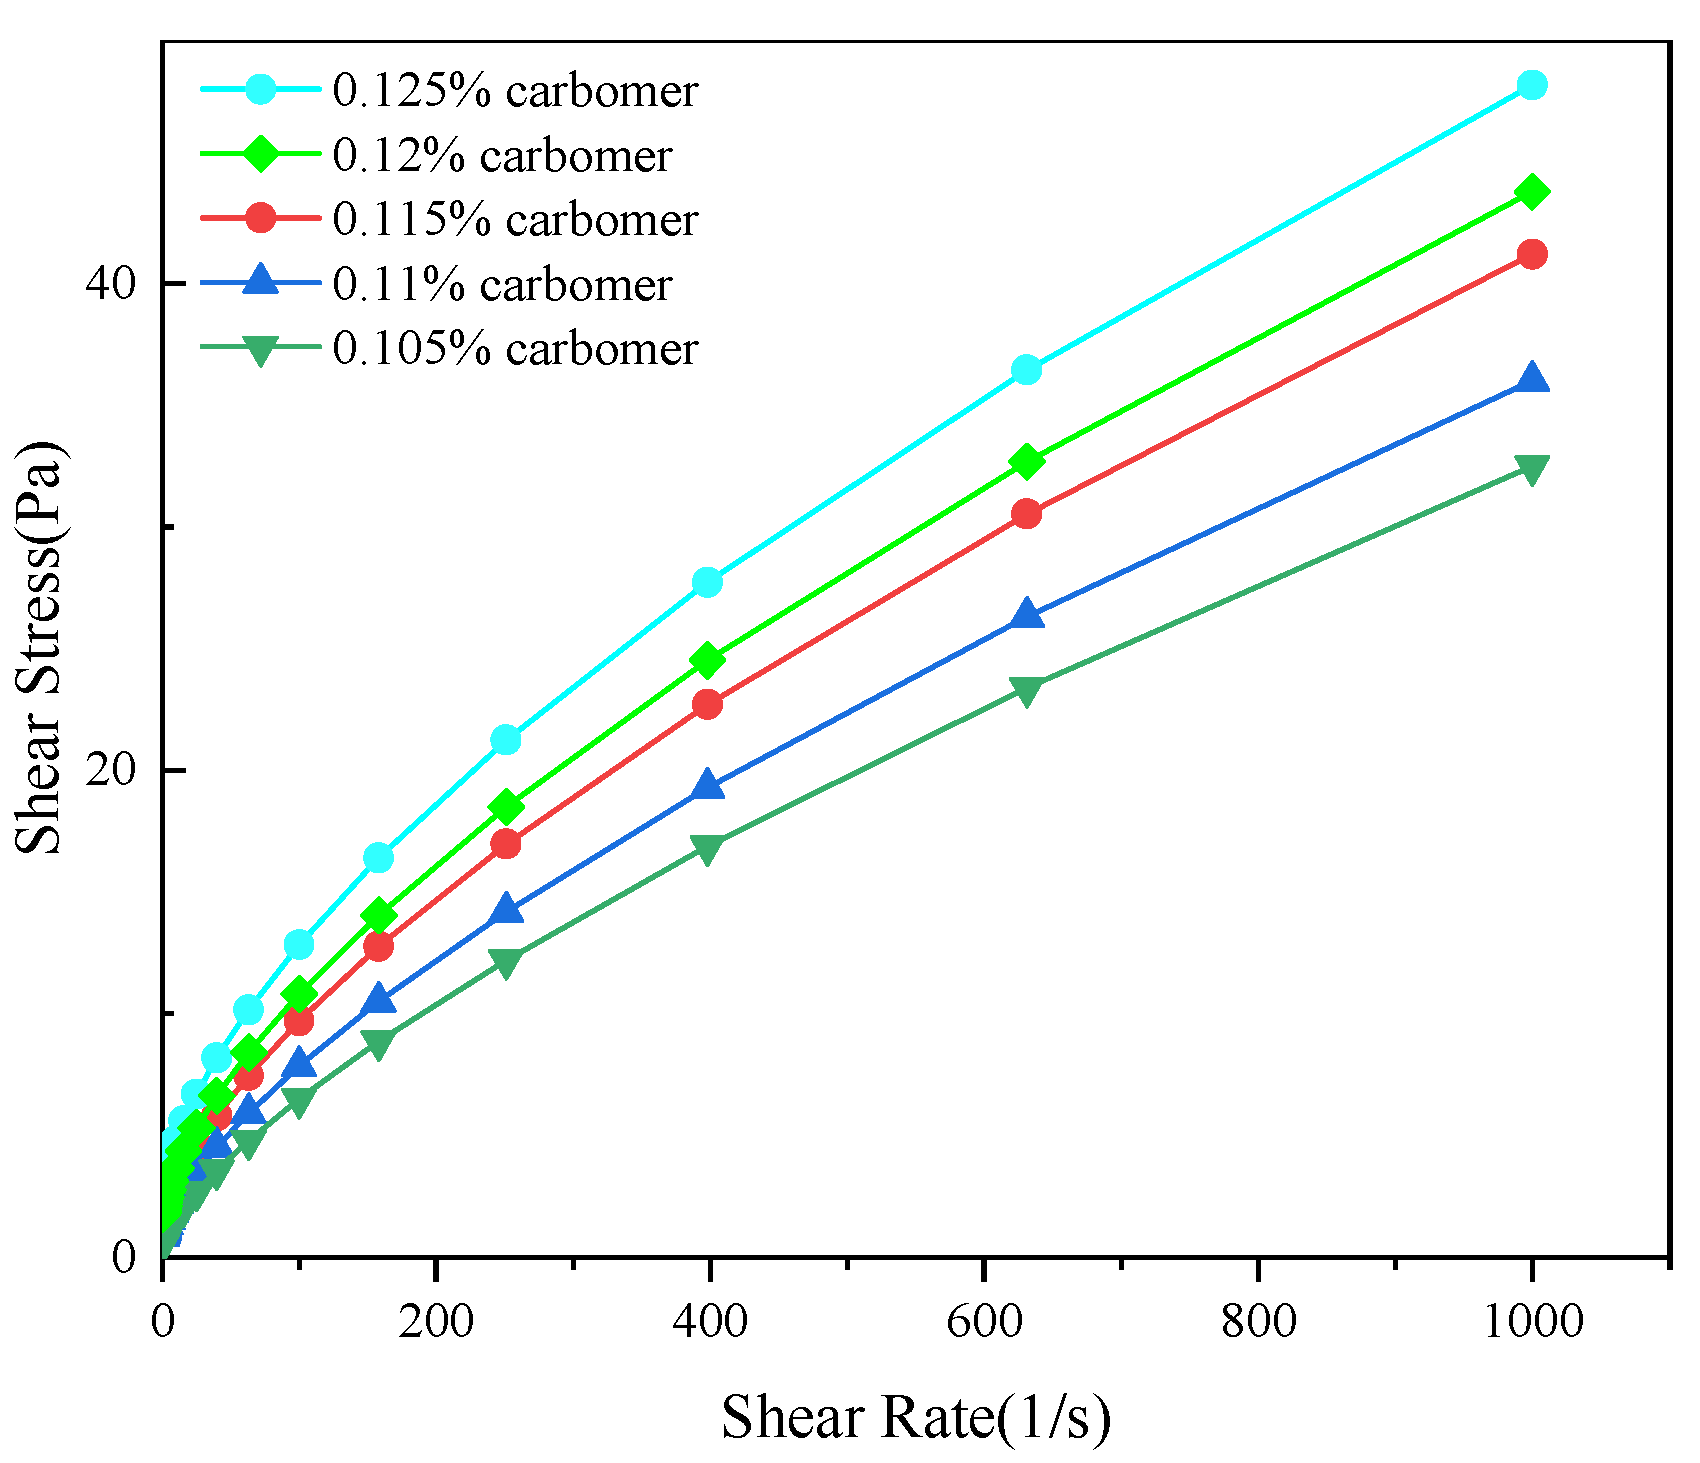
Four different concentrations of glycerol, seven different concentrations of carboxymethyl cellulose (CMC) and five different concentrations of carbomer aqueous solution were selected as experimental fluids. After mixing glycerol, CMC and carbomer with water, seal for at least 24 h. After the bubbles escape, test the rheological parameters of different fluids with an advanced rheometer (Anton Paar MCR 92). Figure 1, Figure 2 and Figure 3 show rheological curves of different flui; it can be seen from the figure that the three aqueous solutions are, respectively, typical NF, power-law fluid and Herschel-Bulkley fluid.
The corresponding constitutive equations of Newton, Herschel-Bulkley and Power-law fluids (PLFs) are exhibited in Table 1.
Where τ represents the shear stress, Pa; τ 0 denotes the yield value, Pa. γ represents the shear rate, 1/s; K denotes the fluid consistency coefficient, Pa·sn.
Fitting the rheological curves in Figure 1, Figure 2 and Figure 3 with the constitutive model in Table 1, we can obtain the consistency index K and fluidity index n (Table 2).

2.2. Measurement of Particle Shape Factor

The SP materials adopted in the experiment are glass, zirconia and stainless steel. The density is 7930 kg/m3, 6080 kg/m3 and 2500 kg/m3, respectively, and the particle diameter is 1–5 mm. Using different materials is mainly to expand the Reynolds number range of particles.
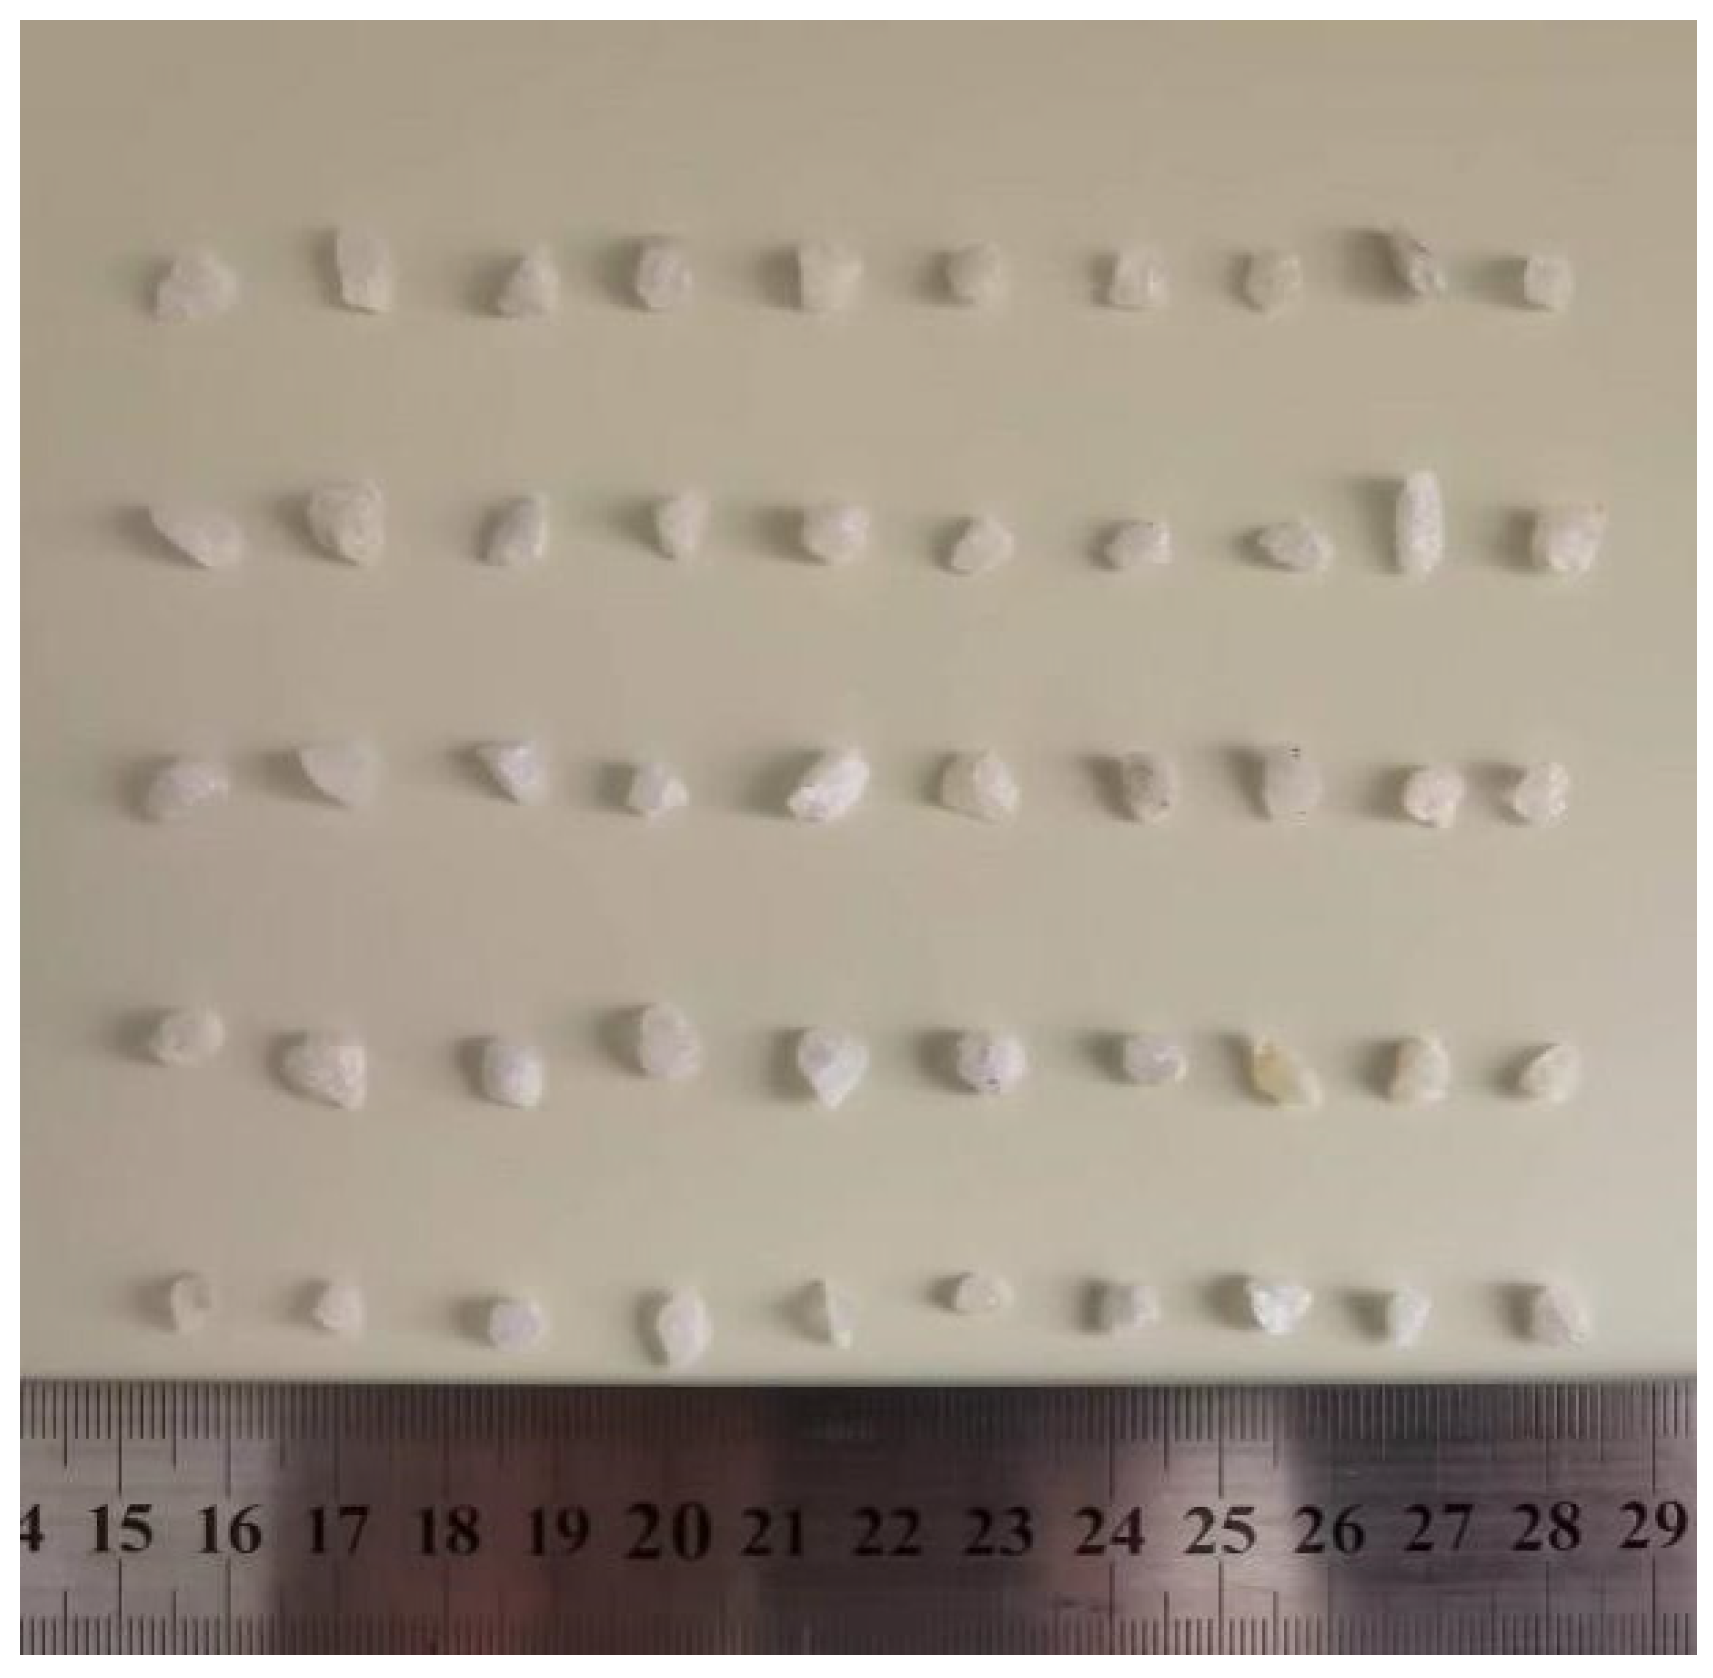
In this study, white quartz sand particles (see Figure 4) are selected as the sedimentation experiment of non-spherical particles, featuring a density of 2650 kg/m3 and an equivalent diameter of 1.64–5.8 mm.
At present, circularity c is the simplest one among many shape factors that describe particle irregularity. Circularity c refers to the ratio of the maximal projection surface circumference of the particle to its equivalent circle circumference; it’s a 2D shape parameter, and its formula is:
c = π d A P p
in which d A represents the diameter of the equivalent circle of the maximal projection plane of the particle, m; P p denotes the maximum projection surface perimeter of the particle, m.
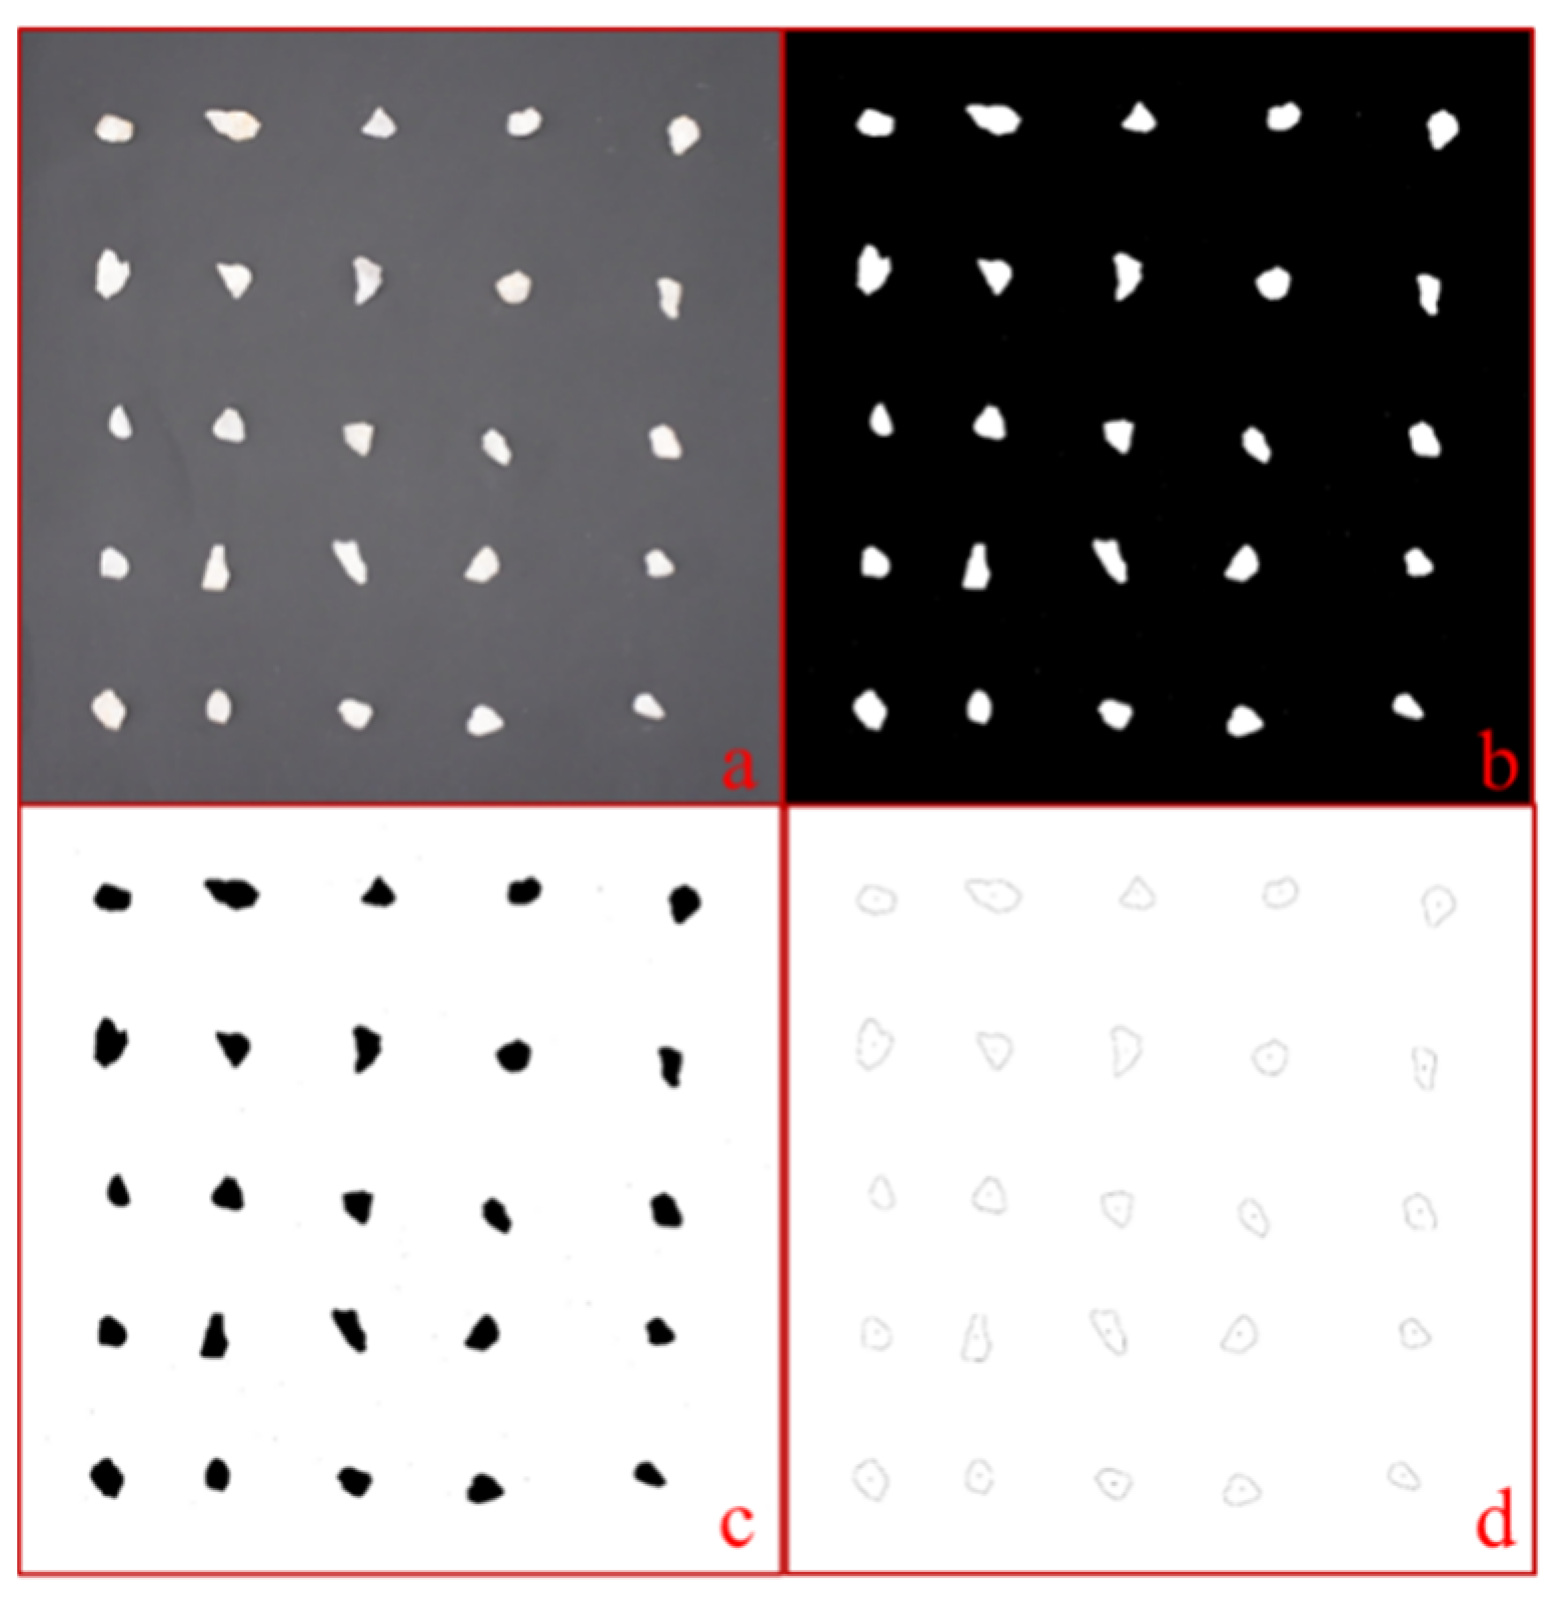
Circularity is sensitive to the particle profile irregularity and easy to measure. Therefore, circularity C is more suitable to be introduced into the settlement drag coefficient model. The measurement of circularity requires to process the image with the image processing commercial software ImageJ (Version 1.53c), ImageJ is open source software which is developed by the National Institutes of Health. Figure 5 shows a conversion example of an irregular shaped sand image. In the image processing process, the digital image (Figure 5a) captured by the camera is first converted into an 8-bit grayscale image as shown in Figure 5b). Then, the gray threshold approach is employed for identifying the particle edge (Figure 5c). During the identification process, the confirmed particle edge is made for coinciding with the original particle edge as much as possible, and the circularity is finally determined (Figure 5d).

2.3. Experimental Equipment and Procedures

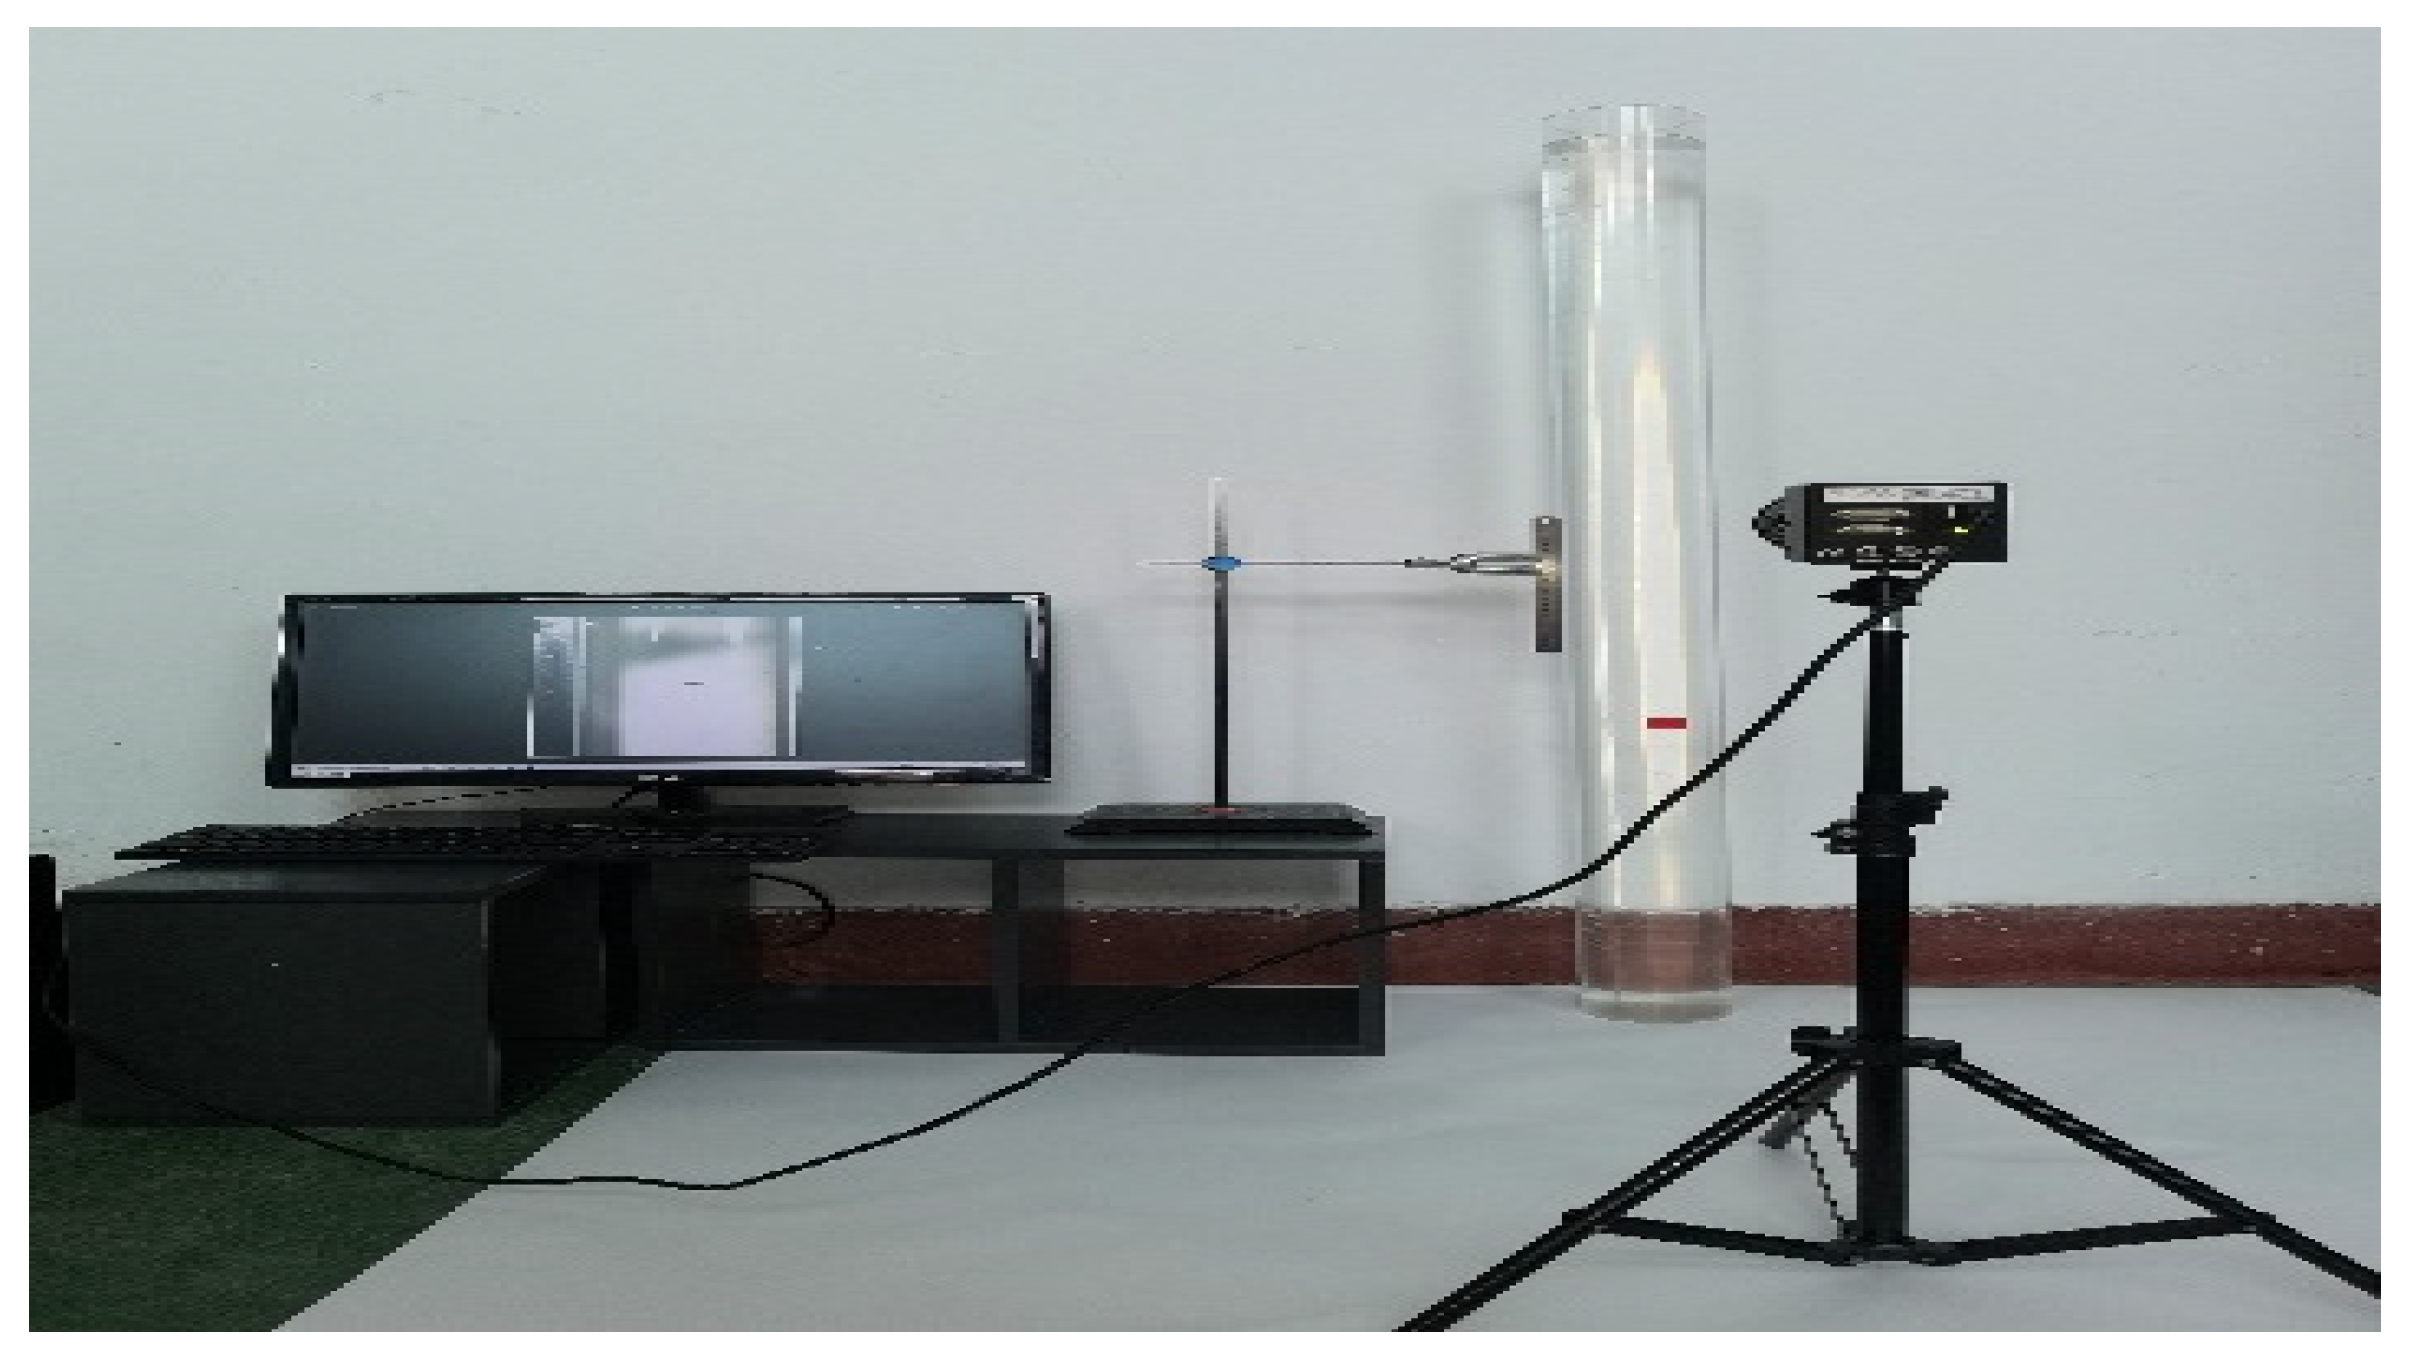
Carry out the particle sedimentation experiment in a transparent plexiglass cylinder featuring a height of 1800 mm and an inner diameter of 100 mm. Use a high-speed camera for capturing the sedimentation course. The photos of the sedimentation experiment device are exhibited in Figure 6. Various contents of carbomer aqueous solution, CMC and glycerol solution should be prepared before the experiment, and stirred for more than 8 h with a mixer to fully dissolve them. Pour the experimental fluid into the organic glass inner tube and let it stand for 12 h to make the gas in the fluid fully escaped and stabilize the internal flow field. To ensure good solid-liquid contact, immerse the experimental particles in the experimental fluid and allow them to stand for more than 24 h, so that the particle surface is fully wetted and the surface gas is fully escaped, so as to eliminate the influence of the physical interaction between the experimental fluid and the particle surface on the particle settling speed during the settling experiment.
Place the experimental particlesbelow the liquid surface of the vertical pipe for making them freely settle along the pipe center; use a high-speed camera for capturing the settling motion trajectory of particles in a circular tube, and multiple image frames of the particle motion trajectory at various times are acquired. Stay 5 min after each group of experiments to ensure the stability of the internal flow field before the next experiment, so as to eliminate the influence of the particle settling trail in the previous experiments on the next particle settling speed; Conduct three repeated measurements for each particle under the same settlement conditions to ensure that the average deviation of the three measurement results is less than 5%.
The position of the particles at different times is analyzed and processed by the graphics digitizing software GetData graph digitizer for determining the coordinates of the particles in each frame of image. The ratio of the particle displacement between two frames to the time interval is the particle settling velocity (PSV). Then, the settlement drag coefficient and particle RN can be calculated according to the corresponding settlement velocity correlation.
Generally, the SDCPs is usually calculated by Equation (2):
C d = 4 ( ρ p ρ l ) g d e 3 V s 2 ρ l
where C d is the settlement drag coefficient; g represent gravitational acceleration, m/s2; d e denotes the effective sedimentation particle size, m; V s represents the settling speed of particles, m/s; ρ P is particle density, kg/m3; ρ l denotes fluid density, kg/m3.
When particles settle in fluids with different properties, particle Reynolds number (RN) expression is different. When particles settle in Newtonian fluid, the Reynolds number of particles is expressed as follows:
Re N = ρ p V s d e μ
where Re N represents the particle RN settling in Newtonian fluid, μ is the viscosity of Newtonian fluid, Pa·s.
When a particle settles in a PLF, the particle RN is expressed as follows:
Re N = ρ p V s 2 n d e n K
If the particles settle in the Herschel-Bulkley fluid (HBF), the Reynolds number expression of particle is as follows:
Re N = ρ p V s 2 n d e n K + τ 0 ( d e V s ) n
where τ 0 represents the fluid yield value, Pa; K denotes the fluid consistency coefficient, Pa·sn; n represents fluid fluidity index, dimensionless.

3. Results and Discussion

3.1. Drag Coefficient of SPs

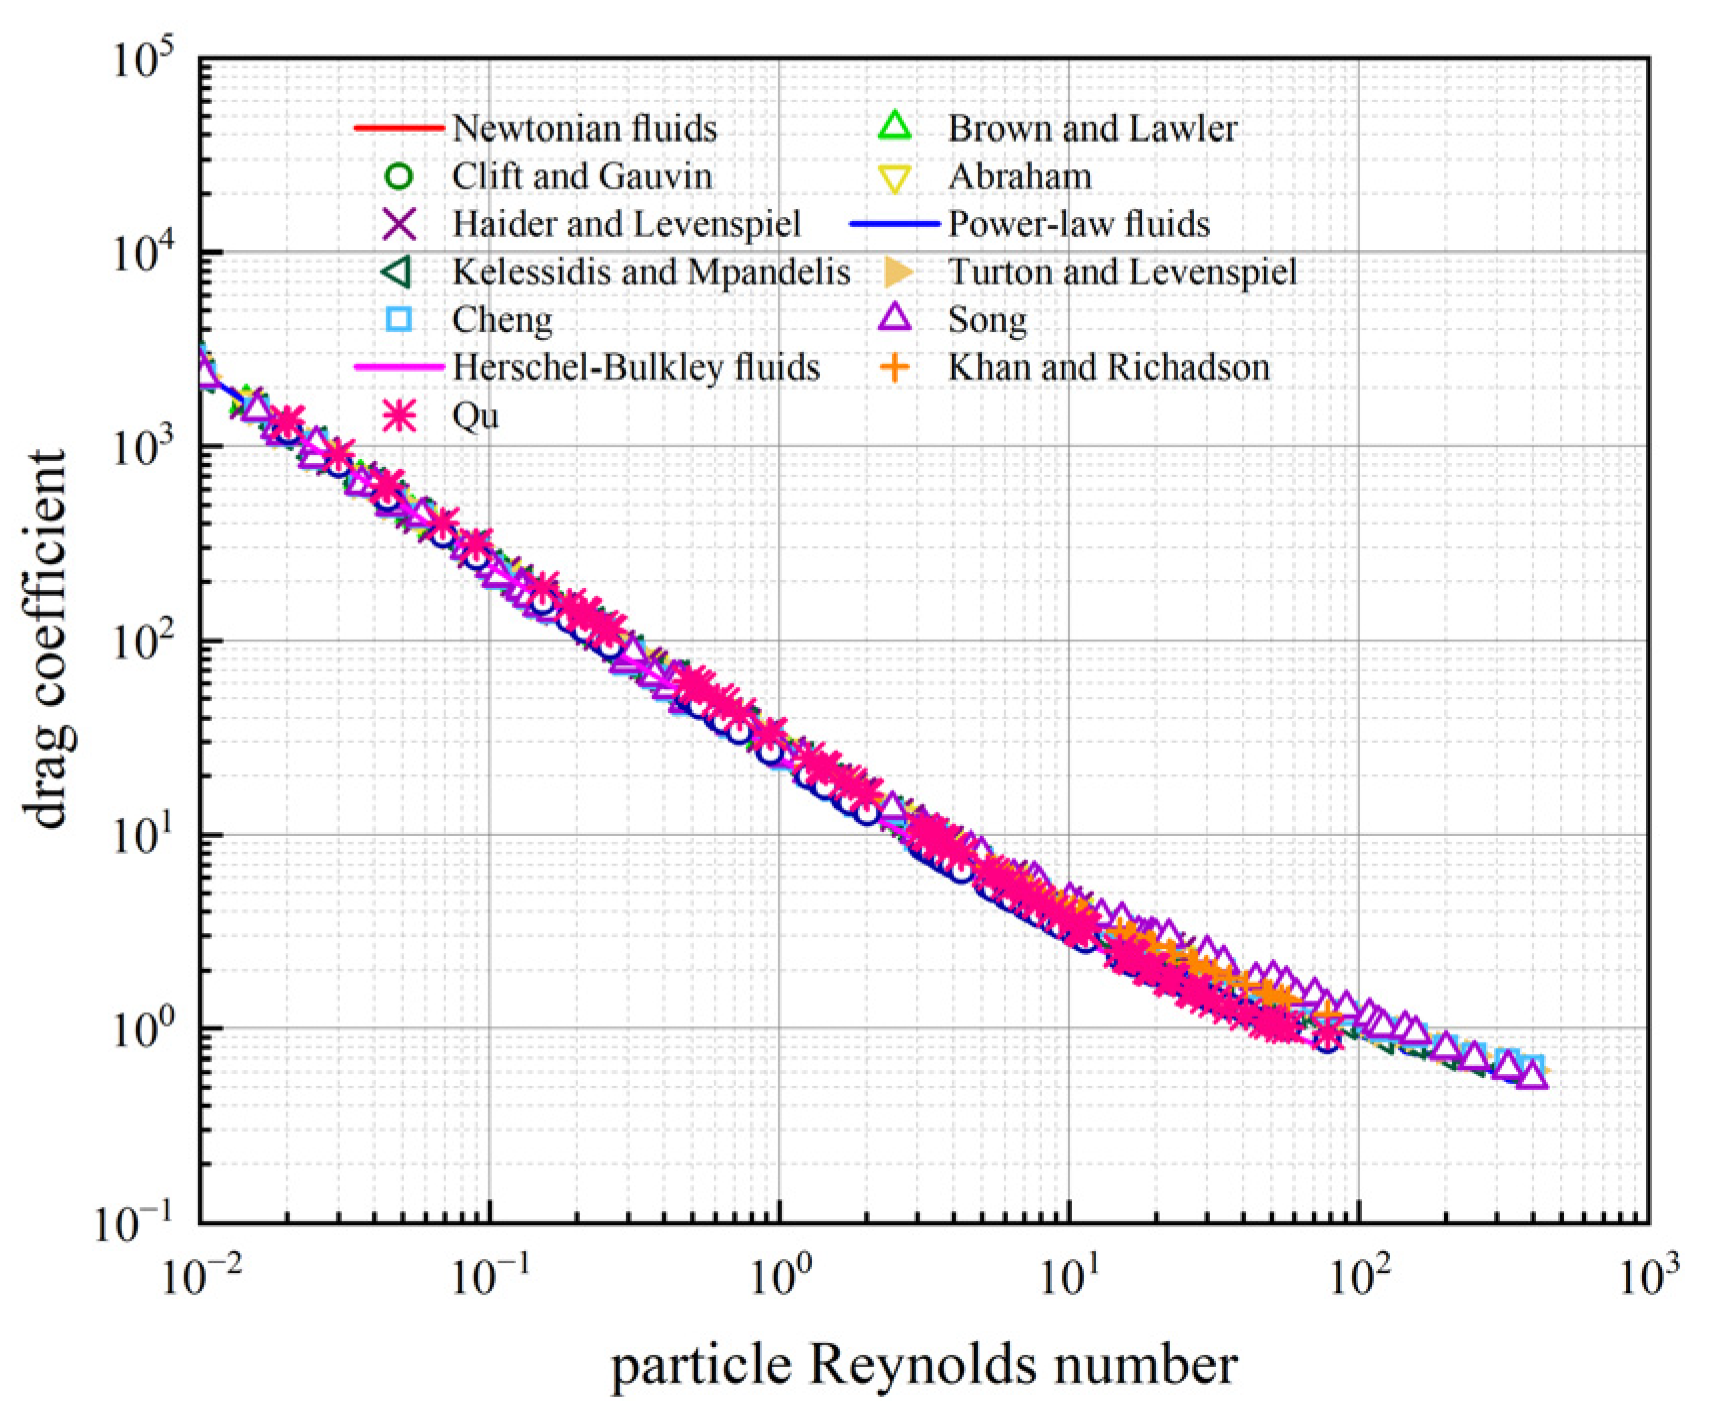
Based on results of spherical particle sedimentation experiment, the CD-ReN curves of different fluids are drawn in classical logarithmic coordinates (Figure 7). The figure also includes the predicted values of seven models such as Turton, Haider, brown, Cheng and others. The specific forms of different models are listed in Table 3. Experimental data of spherical particle sedimentation are consistent with the predicted values of existing models (Figure 7).
In this study, root average squared logarithmic error (RMSLE), average relative error (MRE) and sum of the square errors (SSE) were used to evaluate the disparity between the experimental value and the anticipated one of the model. Calculation formulas of MRE, RMSLE and SSE are as follows:
M R E = 1 N i = 1 N | C D P , i C D M , i | C D M , i × 100 %
R M S L E = 1 N i = 1 N ( ln C D P , i ln C D M , i ) 2
S S E = i = 1 N ( C D P , i C D M , i ) 2 i = 1 N ( C D M , i ) 2
where N represents the quantity of samples; C D P denotes the settlement drag coefficient calculated by the model, dimensionless; C D M is the settlement drag coefficient measured by experiments, dimensionless.
The error statistics between the experimental values of the SDCSPs in NF and NNF and the predicted values of previous models are shown in Table 4.
The experimental outcomes of the settlement drag coefficient of Newtonian fluid perfectly align with the predicted outcomes of various models, and the average error is within 5% (Table 4). However, the error between the experimental value and the anticipated one of spherical particles in NNF is relatively large. In power-law fluid (PLF), the MRE between the experimental result and the predicted value of each model is 9.62%, 10.61%, 10.78% and 12.57% respectively, while in HBF, the MRE is 20.57% and 15.66% respectively. Due to the large error, the existing CD-ReN relation expression for the SDCSPs cannot be directly used for NNFs. Therefore, it’s necessary to establish a new mode for accurately anticipating the SDCSPs in NNFs.
Cheng (2009) [20] proposed a widely used relation expression of settlement drag coefficient, which is an empirical function of Reynolds number (ReN):
C D , s p h = 24 Re N ( 1 + A Re N ) B + C [ 1 exp ( D Re N E ) ]
in which E, D, C, B and A are all correlation coefficients, dimensionless, and C D , s p h are settlement drag coefficients of spherical particles.
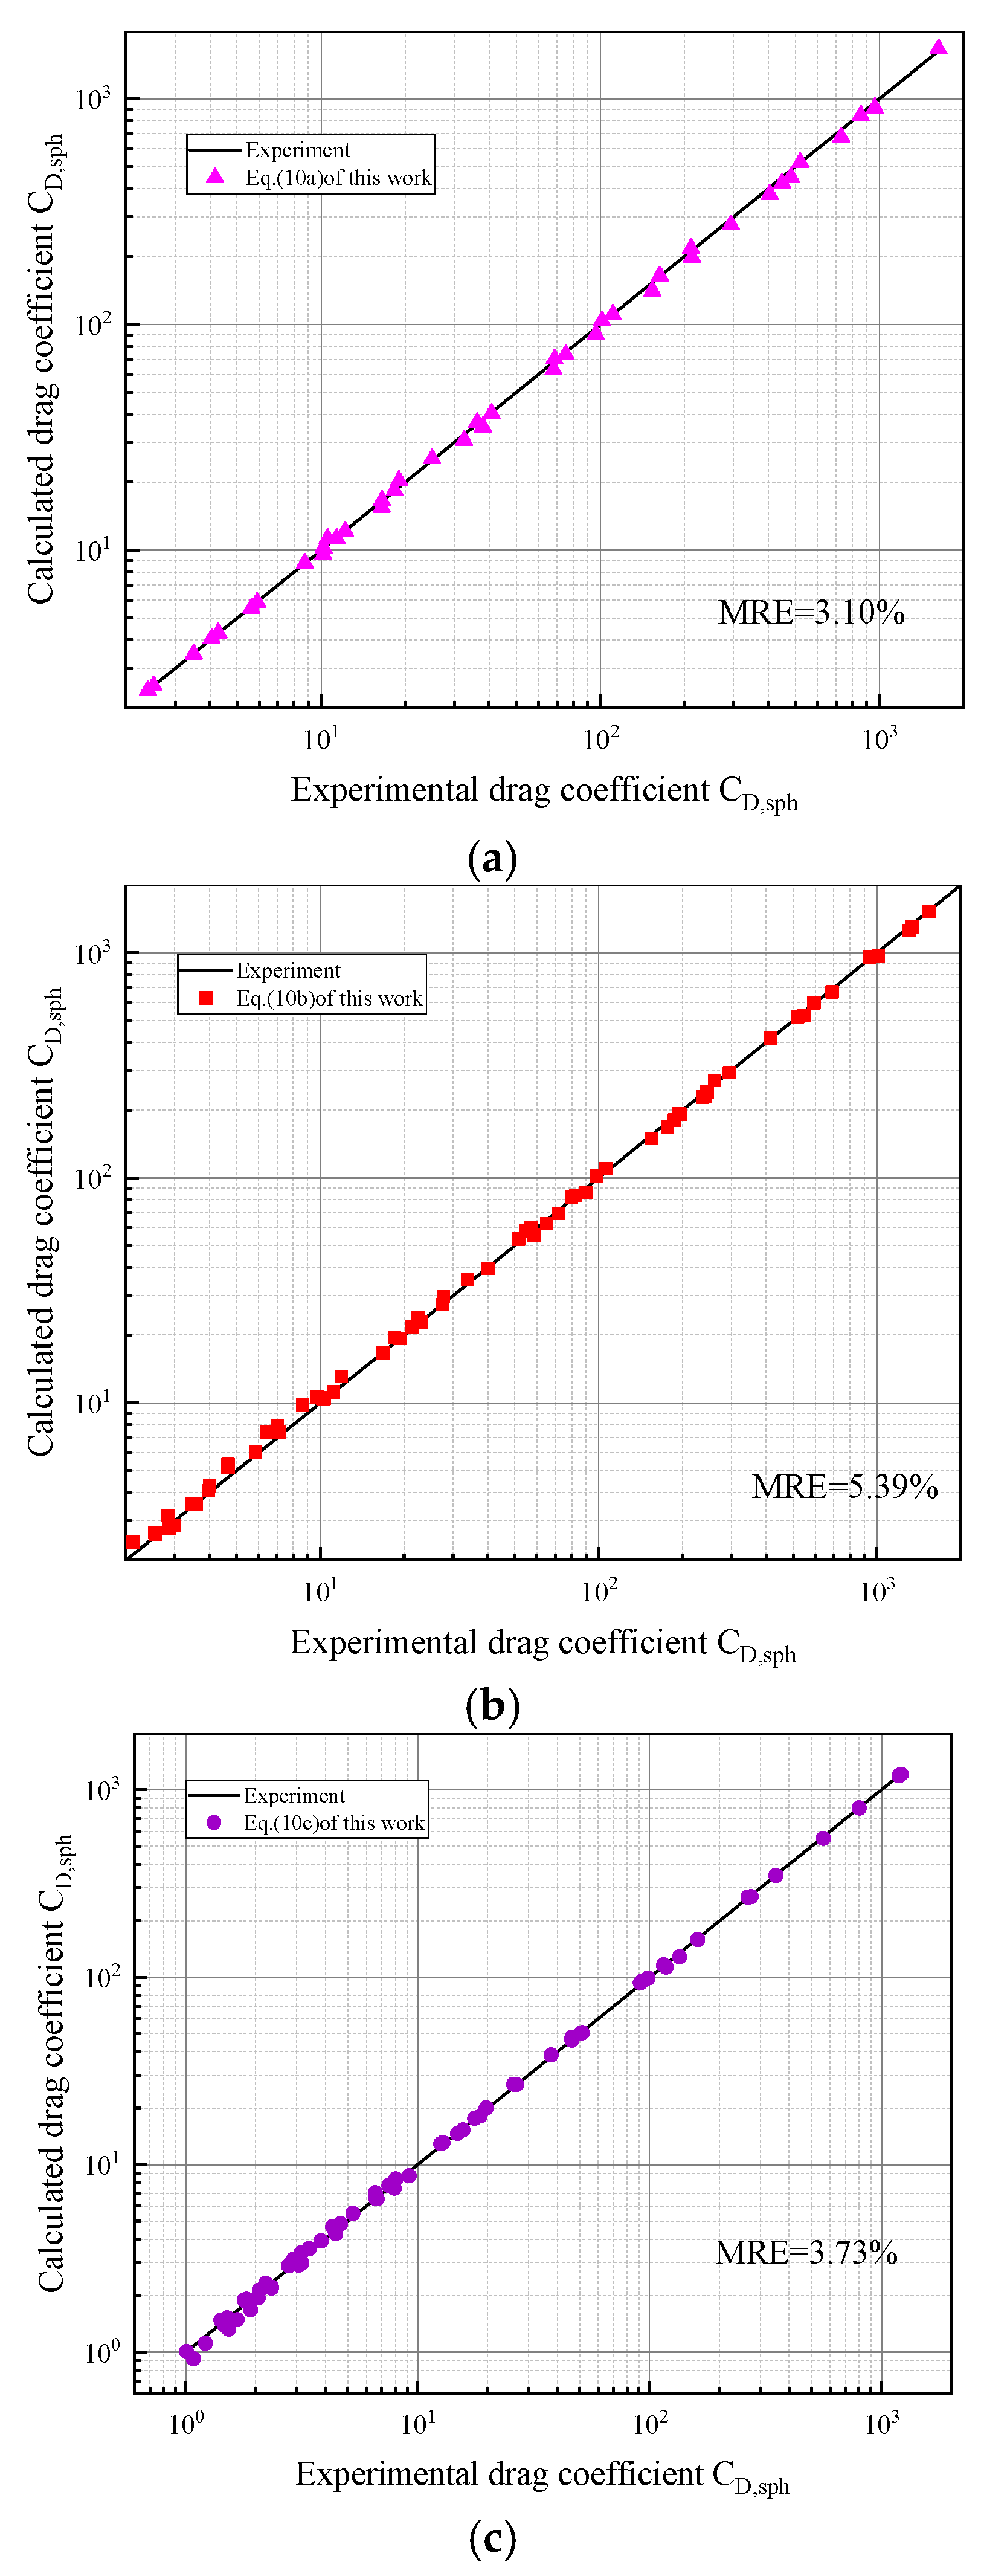
By fitting the experimental data, the anticipation mode of SDC CD-ReN of SPs in NF, PLF and HBF is finally regressed, as shown in formula (10). The comparison between the predicted value of spherical particle CD and the experimental data is shown in Figure 8. Figure 8 uses a log coordinate axis, where the abscissa is the experimental measured value of the spherical particles in the fluid, and the ordinate is the predicted value of the model. The calculated results of formula (10) perfectly align with the experimental data. By comparing the predicted values and experimental values of Newtonian fluid (Figure 8a), PLF (Figure 8b) and HBF (Figure 8c), the MREs between the predicted values and experimental ones of the mode proposed in the study are 3.10%, 5.39% and 3.73%, which are lower than the predicted values of previous models in Table 4; it means that the proposed model can well predict the settlement drag coefficient of spherical particles (SDCSPs) in fluids with different rheological models.
{ C D , s p h = 24 Re N ( 1 + 1.197 Re N ) 0.161 + 0.663 [ 1 exp ( 0.229 Re N 1.032 ) ] ( a ) C D , s p h = 24 Re N ( 1 + 0.987 Re N ) 0.228 + 0.217 [ 1 exp ( 0.983 Re N 0.263 ) ] ( b ) C D , s p h = 24 Re N ( 1 + 0.200 Re N ) 0.215 + 0.168 [ 1 exp ( 0.529 Re N 0.991 ) ] ( c )

3.2. Drag Coefficient of NSPs

The irregular NSPs shape will greatly affect the exerted drag force by the fluid, like rock debris and proppant, thus changing their final settlement speed. Therefore, considering the particle shape impact, the circularity C is introduced, and the correlation formula of the settlement coefficient of NSPs, CD,irregular, is proposed:
C D , i r r e g u l a r = C D , s p h exp [ α Re N β ( 1 c ) λ ]
where C D ,   i r r e g u l a r is the SDCNPs; α , β and λ represents the correlation coefficient, dimensionless.
Similarly, though fitting the experimental data of non-spherical sand settlement, the parameters in formula (11) can be obtained, substitute them into formula (10), then the expression of sand settlement drag coefficient CD,irregular is as follows:
{ C D , i r r e g u l a r = ( 24 Re N ( 1 + 1.197 Re N ) 0.161 + 0.663 [ 1 exp ( 0.229 Re N 1.032 ) ] ) exp [ 1.230 Re N 0.038 ( 1 c ) 0.040 ] ( a ) C D , i r r e g u l a r = ( 24 Re N ( 1 + 0.987 Re N ) 0.228 + 0.217 [ 1 exp ( 0.983 Re N 0.263 ) ] ) exp [ 1.382 Re N 0.004 ( 1 c ) 0.063 ] ( b ) C D , i r r e g u l a r = ( 24 Re N ( 1 + 0.200 Re N ) 0.215 + 0.168 [ 1 exp ( 0.529 Re N 0.991 ) ] ) exp [ 1.319 Re N 0.046 ( 1 c ) 0.012 ] ( c )
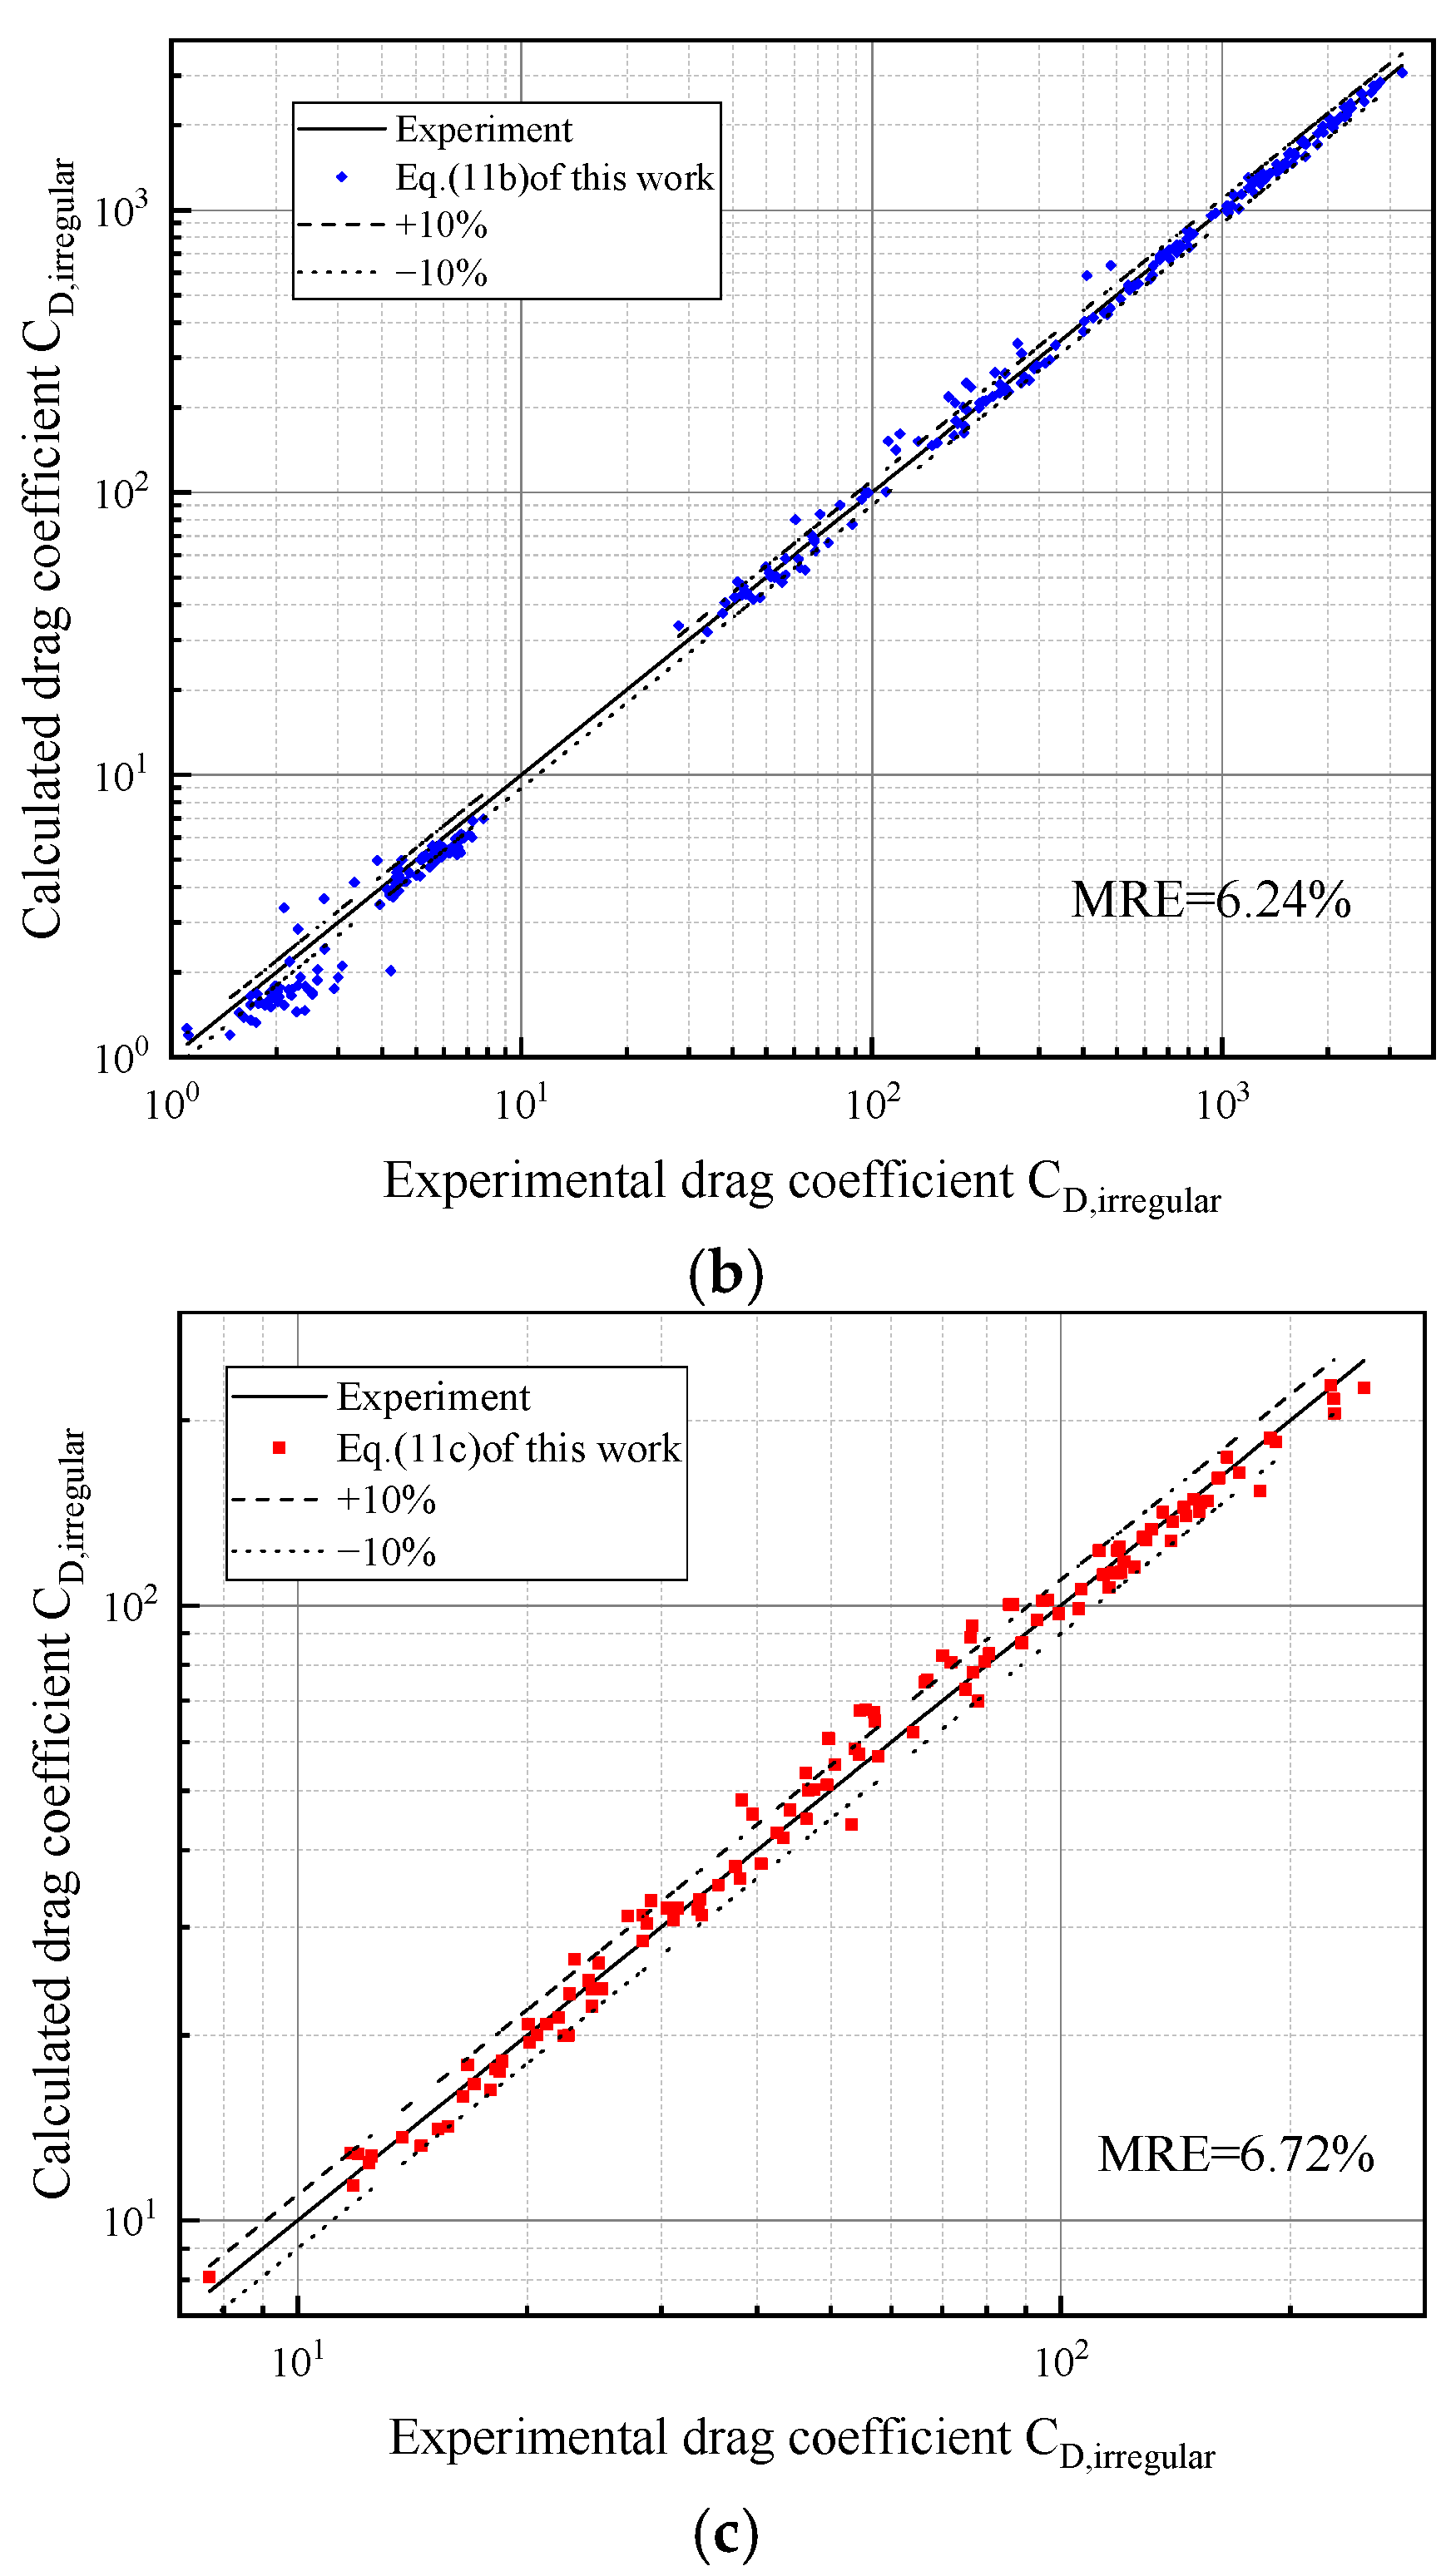
By comparing the predicted and experimental values of Newtonian fluid (Figure 9)), PLF (Figure 9b) and HBF (Figure 9c), the calculated results of formula (12) perfectly align with the experimental data. The errors between the anticipated and experimental values of the mode presented in the investigation are 5.70%, 6.24% and 6.72%, respectively.

4. Conclusions

The settling features of NSPs and SPs in different fluids are studied experimentally. In order to expand the experimental data and scope of application, the Newton, Herschel-Bulkley and Power-law fluids (PLFs) were selected in experimental fluids. A new formula for computing the SDCSPs in NF and NNF is proposed by modifying the correlations proposed by Cheng (2009). According to the anticipation mode of the drag coefficient of SPs, and introducing the shape factor circularity c, which is easier to determine, the settlement drag coefficient model of NSPs in NF and NNF is proposed. The Reynolds number of the proposed model is 0.01–158 and the circularity is 0.348–1. The predicted values perfectly align with experimental values, and the average relative errors are 5.70%, 6.24% and 6.72%, respectively. This work can provide a valuable reference for proppant migration cuttings settlement researchers; it should be noted that this study has certain limitations because only Newton, Herschel-Bulkley and Power-law fluids are considered. Therefore, in future research, other types of fluids will be combined and modified with this model, and there will be a more accurate understanding of the settlement characteristics of irregular particles in non-Newtonian fluids.

Author Contributions

Writing—review and editing, J.L.; writing—original draft preparation, Z.H.; conceptualization, G.X.; investigation, L.Y. All authors have read and agreed to the published version of the manuscript.

Funding

The authors express their appreciation to the Fund Project: basic research program on deep petroleum resource accumulation and key engineering technologies (No: U19B6003) of Sinopec Research Institute of Petroleum Engineering Co., Ltd.

Conflicts of Interest

On behalf of all the co-authors, the corresponding author declares no conflict of interest.

References

  1. Awad, A.M.; Hussein, I.A.; Nasser, M.S.; Karami, H.; Ahmed, R. CFD modeling of particle settling in drilling fluids: Impact of fluid rheology and particle characteristics. J. Pet. Sci. Eng. 2021, 199, 108326. [Google Scholar] [CrossRef]
  2. Qu, J.; Yan, T.; Sun, X.; Li, Z.; Li, W. Decaying swirl flow and particle behavior through the hole cleaning device for horizontal drilling of fossil fuel. Energies 2019, 12, 336. [Google Scholar] [CrossRef] [Green Version]
  3. Zhang, G.; Gutierrez, M.; Chao, K. Hydrodynamic and mechanical behavior of multi-particle confined between two parallel plates. Adv. Powder Technol. 2019, 30, 439–450. [Google Scholar] [CrossRef]
  4. Stokes, G.G. On the effect of the internal friction of fluids in the motion of pendulums. Trans. Cambridge Philos. Soc. 1851, 9, 8–106. [Google Scholar]
  5. Abraham, F.F. Functional dependence of drag coefficient of a sphere on Reynolds number. Phys. Fluids 1970, 13, 2194–2195. [Google Scholar] [CrossRef]
  6. Clift, R.; Gauvin, W.H. Motion of entrained particles in gas streams. Can. J. Chem. Eng. 1971, 49, 439–448. [Google Scholar] [CrossRef]
  7. Brown, P.P.; Lawler, D.F. Sphere drag and settling velocity revisited. J. Environ. Eng. 2003, 129, 222–231. [Google Scholar] [CrossRef]
  8. Terfous, A.; Hazzab, A.; Ghenaim, A. Predicting the drag coefficient and settling velocity of spherical particles. Powder Technol. 2013, 239, 12–20. [Google Scholar] [CrossRef]
  9. Agwu, O.E.; Akpabio, J.U.; Alabi, S.B.; Dosunmu, A. Settling velocity of drill cuttings in drilling fluids: A review of experimental, numerical simulations and artificial intelligence studies. Powder Technol. 2018, 339, 728–746. [Google Scholar] [CrossRef]
  10. Goossens, W.R.A. Review of the empirical correlations for the drag coefficient of rigid spheres. Powder Technol. 2019, 352, 350–359. [Google Scholar] [CrossRef]
  11. Yao, S.; Chang, C.; Hai, K.; Huang, H.; Li, H. A review of experimental studies on the proppant settling in hydraulic fractures. J. Pet. Sci. Eng. 2022, 208, 109211. [Google Scholar] [CrossRef]
  12. Chhabra, R.P. Motion of spheres in power law (viscoinelastic) fluids at intermediate Reynolds numbers: A unified approach. Chem. Eng. Process. Process Intensif. 1990, 28, 89–94. [Google Scholar] [CrossRef]
  13. Lali, A.M.; Khare, A.S.; Joshi, J.B.; Nigam, K.D.P. Behaviour of solid particles in viscous non-Newtonian solutions: Settling velocity, wall effects and bed expansion in solid-liquid fluidized beds. Powder Technol. 1989, 57, 39–50. [Google Scholar] [CrossRef]
  14. Kelessidis, V.C. Terminal velocity of solid spheres falling in Newtonian and non-Newtonian liquids. Tech. Chron. Sci. J. TCG 2003, 5, 43–54. [Google Scholar]
  15. Shah, S.N.; El Fadili, Y.; Chhabra, R.P. New model for single spherical particle settling velocity in power law (visco-inelastic) fluids. Int. J. Multiph. Flow 2007, 33, 51–66. [Google Scholar] [CrossRef]
  16. Peden, J.M.; Luo, Y. Settling velocity of variously shaped particles in drilling and fracturing fluids. SPE Drill. Eng. 1987, 2, 337–343. [Google Scholar] [CrossRef]
  17. Kelessidis, V.C.; Mpandelis, G. Measurements and prediction of terminal velocity of solid spheres falling through stagnant pseudoplastic liquids. Powder Technol. 2004, 147, 117–125. [Google Scholar] [CrossRef]
  18. Turton, R.; Levenspiel, O. A short note on the drag correlation for spheres. Powder Technol. 1986, 47, 83–86. [Google Scholar] [CrossRef]
  19. Haider, A.; Levenspiel, O. Drag coefficient and terminal velocity of spherical and nonspherical particles. Powder Technol. 1989, 58, 63–70. [Google Scholar] [CrossRef]
  20. Cheng, N.S. Comparison of formulas for drag coefficient and settling velocity of spherical particles. Powder Technol. 2009, 189, 395–398. [Google Scholar] [CrossRef]
  21. Song, X.; Xu, Z.; Li, G.; Pang, Z.; Zhu, Z. A new model for predicting drag coefficient and settling velocity of spherical and non-spherical particle in Newtonian fluid. Powder Technol. 2017, 321, 242–250. [Google Scholar] [CrossRef]
  22. Okesanya, T.; Abdukarimov, A.; Kuru, E. Generalized models for predicting the drag coefficient and settling velocity of rigid spheres in viscoelastic and viscoinelastic power-law fluids. J. Pet. Sci. Eng. 2020, 191, 107077. [Google Scholar] [CrossRef]
  23. Khan, A.R.; Richardson, J.F. The resistance to motion of a solid sphere in a fluid. Chem. Eng. Commun. 1987, 62, 135–150. [Google Scholar] [CrossRef]
  24. Zhang, G.; Li, M.; Geng, K.; Han, R.; Xie, M.; Liao, K. New integrated model of the settling velocity of proppants falling in viscoelastic slick-water fracturing fluids. J. Nat. Gas Sci. Eng. 2016, 33, 518–526. [Google Scholar] [CrossRef]
  25. Padhy, S.; Rodriguez, M.; Shaqfeh, E.; Iaccarino, G.; Morris, J.; Tonmukayakul, N. The effect of shear thinning and walls on the sedimentation of a sphere in an elastic fluid under orthogonal shear. J. Non-Newton. Fluid Mech. 2013, 201, 120–129. [Google Scholar] [CrossRef]
  26. Williams, G.P. Particle roundness and surface texture effects on fall velocity. J. Sediment. Petrol. 1997, 36, 255–259. [Google Scholar] [CrossRef]
  27. Wadell, H. The coefficient of resistance as a function of Reynolds number for solids of various shapes. J. Frankl. Inst. 1934, 217, 459–490. [Google Scholar] [CrossRef]
  28. Tran-Cong, S.; Gay, M.; Michaelides, E.E. Drag coefficients of irregularly shaped particles. Powder Technol. 2004, 139, 21–32. [Google Scholar] [CrossRef]
  29. Corey, A.T. Influence of the Shape on the Fall Velocity of Sand Grains. Ph.D. Thesis, Colorado State University, Fort Collins, CO, USA, 1949. [Google Scholar]
  30. Bouwman, A.M.; Bosma, J.C.; Vonk, P.; Wesselingh, J.H.A.; Frijlink, H.W. Which shape factor (s) best describe granules? Powder Technol. 2004, 146, 66–72. [Google Scholar] [CrossRef]
  31. Hölzer, A.; Sommerfeld, M. New simple correlation formula for the drag coefficient of non-spherical particles. Powder Technol. 2008, 184, 361–365. [Google Scholar] [CrossRef]
  32. Wang, Y.; Zhou, L.; Wu, Y.; Yang, Q. New simple correlation formula for the drag coefficient of calcareous sand particles of highly irregular shape. Powder Technol. 2018, 326, 379–392. [Google Scholar] [CrossRef]
  33. Chien, S.F. Settling velocity of irregularly shaped particles. SPE Drill. Complet. 1994, 9, 281–289. [Google Scholar] [CrossRef]
  34. Dioguardi, F.; Mele, D. A new shape dependent drag correlation formula for non-spherical rough particles. Exp. Results. Powder Technol. 2015, 277, 222–230. [Google Scholar] [CrossRef]
  35. Xu, Z.; Song, X.; Li, G.; Pang, Z.; Zhu, Z. Settling behavior of non-spherical particles in power-law fluids: Experimental study and model development. Particuology 2019, 46, 30–39. [Google Scholar] [CrossRef]
  36. Rushd, S.; Hafsa, N.; Al-Faiad, M.; Arifuzzaman, M. Modeling the settling velocity of a sphere in Newtonian and non-Newtonian fluids with machine-learning algorithms. Symmetry 2021, 13, 71. [Google Scholar] [CrossRef]
  37. Barati, R.; Neyshabouri, S.A.A.S.; Ahmadi, G. Development of empirical models with high accuracy for estimation of drag coefficient of flow around a smooth sphere: An evolutionary approach. Powder Technol. 2014, 257, 11–19. [Google Scholar]
  38. Akanni, O.; Fu, C.; Guo, B. Drag Coefficients of Irregularly Shaped Particles in Newtonian Fluids. Sustainability 2021, 13, 7517. [Google Scholar] [CrossRef]
  39. Gavrilov, A.A.; Finnikov, K.A.; Podryabinkin, E.V. Modeling of steady Herschel–Bulkley fluid flow over a sphere. J. Eng. Thermophys. 2017, 26, 197–215. [Google Scholar] [CrossRef]
  40. Zhou, C.; Su, J.; Chen, H.; Shi, Z. Terminal velocity and drag coefficient models for disc-shaped particles based on the imaging experiment. Powder Technol. 2022, 398, 117062. [Google Scholar] [CrossRef]
  41. Okesanya, T.; Kuru, E.; Sun, Y. A New Generalized Model for Predicting the Drag Coefficient and the Settling Velocity of Rigid Spheres in Viscoplastic Fluids. SPE J. 2020, 25, 3217–3235. [Google Scholar] [CrossRef]
  42. Yan, T.; Qu, J.Y.; Sun, X.F.; Li, W.; Chen, Y.; Hu, Q.B. A novel predictive model of drag coefficient and settling velocity of drill cuttings in non-Newtonian drilling fluids. Pet. Sci. 2021, 18, 1729–1738. [Google Scholar] [CrossRef]
Figure 1. Rheological plots of glycerol aqueous solutions with different concentrations.
Processes 10 01990 g001
Figure 2. Rheological curves of CMC aqueous solutions with different concentrations.
Processes 10 01990 g002
Figure 3. Rheological curves of carbomer aqueous solutions with different concentrations.
Processes 10 01990 g003
Figure 4. Physical properties of natural sand.
Processes 10 01990 g004
Figure 5. Conversion example of irregular sand image: (a) Original RGB image; (b) Converted into an 8-bit grayscale image; (c) Thresholding of images; (d) Draw profile.
Processes 10 01990 g005
Figure 6. Particle sedimentation test equipment.
Processes 10 01990 g006
Figure 7. Relationship between spherical particle sedimentation experiment and predicted CD-ReN.
Processes 10 01990 g007
Figure 8. Comparison between predicted value and experimental data of CD of spherical particles: (a) NF; (b) PLF; (c) HBF.
Processes 10 01990 g008
Figure 9. Comparison between anticipated CD value of NSPs and experimental data: (a) NF; (b) PLF; (c) HBF.
Processes 10 01990 g009aProcesses 10 01990 g009b
Table 1. Common fluid rheological models.
Rheological ModelsEquation
Newton τ = μ B γ
Power law τ = k γ n
Herschel-Bulkley τ = τ 0 + k γ n
Table 2. Rheological parameters of different fluids.
Test FluidsTemperature, (°C)Density, kg/m3Rheological Parameters
τ0, PaK, Pa·snn
80 wt % glycerol24.3121000.045621
90 wt % glycerol22.1122000.170591
95 wt % glycerol24.5124000.341441
100 wt % glycerol22.9125000.884621
0.25 wt % CMC20.31001.500.01990.8986
0.5 wt % CMC20.21001.500.08150.7797
1 wt % CMC20.9100300.51440.6470
1.25 wt % CMC21.31003.201.12560.5891
1.5 wt % CMC22.1100401.81280.5569
1.75 wt % CMC21.41004.502.93100.5203
2 wt % CMC20.0100604.78030.4791
0.105 wt % carbomer23.910000.50410.21110.7268
0.11 wt % carbomer24.310000.83630.28030.6995
0.115 wt % carbomer23.910001.29900.37570.6754
0.12 wt % carbomer23.610001.68410.43040.6634
0.125 wt % carbomer23.610002.41080.54320.6418
Table 3. CD-ReN correlation of spherical particles settling in NF and NNF proposed by predecessors.
ReferenceCD-ReN Empirical Correlations
Abraham [5] C D = ( 24 Re N + 0.5407 ) 2
Clift and Gauvin [6] C D = 24 Re N ( 1 + 0.15 Re N 0.687 ) + 0.42 1 + 42500 / Re N 1.16
Brown and Lawler [7] C D = 24 Re N ( 1 + 0.15 Re N 0.681 ) + 0.407 1 + 8710 / Re N
Kelessidis and Mpandelis [17] C D = 24 Re N ( 1 + 0.1407 Re N 0.6018 ) + 0.2118 1 + 0.42150 / Re N
Turton and Levenspiel [18] C D = 24 Re N ( 1 + 0.173 Re N 0.657 ) + 0.413 1 + 16300 / Re N 1.09
Haider and Levenspiel [19] C D = 24 Re N ( 1 + 0.186 Re N 0.6459 ) + 0.4251 1 + 6880.95 / Re N
Cheng [20] C D = 24 Re N ( 1 + 0.27 Re N ) 0.43 + 0.47 [ 1 exp ( 0.04 Re N 0.38 ) ]
Song [21] C D = 24 Re N ( 1 + 0.35 Re N ) 0.44
Khan and Richadson [23] C D = ( 2.25 Re N 0.31 + 0.36 Re N 0.06 ) 3.45
Qu [42] C D = 24 Re N ( 1 + 0.282 Re N 0.229 ) + 167.28 1 33000 / Re N
Table 4. Error statistics of SDCSPs in Newtonian fluid (NF) and non-Newtonian fluid (NNF).
Fluid TypeCorrelationPrediction Error (%)
MRERMSLESSE
Newtonian fluidBrown and Lawler3.414.100.14
Clift and Gauvin3.300.300.14
Abraham4.895.920.15
Haider and Levenspiel4.044.480.13
Power-law fluidKelessidis and Mpandelis 9.6210.741.21
Turton and Levenspiel10.6111.971.21
Cheng10.7812.411.18
Song12.5714.481.18
Herschel-Bulkley fluidKhan and Richadson20.5721.950.02
Qu15.6615.931.33
Publisher’s Note: MDPI stays neutral with regard to jurisdictional claims in published maps and institutional affiliations.