Article

Numerical Simulation Study on the Effect of Port Water Injector Position on the Gasoline Direct Injection Engine

Key Laboratory of Low-Grade Energy Utilization Technologies and Systems, Ministry of Education, Chongqing University, Chongqing 400044, China
*
Author to whom correspondence should be addressed.
Processes 2022, 10(10), 1909; https://doi.org/10.3390/pr10101909
Submission received: 1 September 2022 / Revised: 13 September 2022 / Accepted: 19 September 2022 / Published: 21 September 2022
(This article belongs to the Special Issue Internal Combustion Engine Combustion Processes)

Abstract

:
This paper explores the effects of six different cases of port water injection on the combustion, knock suppression and emissions of a supercharged gasoline direct injection (GDI) engine through numerical simulation. The six different intake port water injection cases included three vertical distances from cylinder center to water injector and two different injection directions. The results showed that cases 2 and 4 allowed more water and air to enter the cylinder and thus suppressed the knock, so the pressure oscillation was small. Case 2 had the largest turbulent kinetic energy in the center of the cylinder, which in turn facilitated the propagation of flame to the cylinder wall and suppressed the knock. The water injection cases shortened the combustion delay period compared to the no water cases. At the same time, the strong low temperature reaction of the end mixture produced a large amount of CH2O that decomposed into HCO. A high concentration and a large area of HCO distribution can predict the occurrence of a knock. In addition, the water injection cases (except for case 6) reduced the in-cylinder soot, unburned hydrocarbon (UHC) and CO emissions compared to the no water cases, but it increased NOX emissions.

1. Introduction

With the shortage of fossil fuels and the deterioration of the environment, governments around the world have introduced regulations to control CO2 emissions (e.g., the “carbon neutrality” proposed by China). Automakers have responded to these regulations by introducing their own electric and hybrid vehicles as a way to reduce the use of fossil fuel. Electric vehicles are indeed a viable replacement power plant for internal combustion engines (ICEs), but they have many drawbacks that need to be addressed, such as high initial costs, long charging times, limited driving range, battery recycling issues and emissions from the power generation facility itself [1]. In addition, electric vehicles are not truly zero-emission vehicles, due to non-exhaust particle emissions (higher than motor vehicles). Most importantly, the production of batteries leads to soil acidification and water eutrophication. Hybrid vehicles will be the main power source in the coming years, so improving the thermal efficiency of ICEs is an urgent issue to be addressed. ICE downsizing and increasing the compression ratio (CR) are effective means to improve the thermal efficiency, but will increase the thermal load in the cylinder, which may cause knock [2,3,4,5].
Researchers have thought of various ways to suppress knock, such as mixture enrichment [6], delayed ignition time [7,8,9], exhaust gas recirculation (EGR) [10,11,12] and a variable compression ratio (VCR) [13]. However, all these measures have certain shortcomings. For example, mixture enrichment and delayed ignition time sacrifice the thermal efficiency of ICEs and increase UHC emissions [9]. Exhaust gas recirculation can largely suppress knock, but large proportions of EGR will deteriorate the combustion stability of ICEs and increase soot emissions. A variable compression ratio requires a complex mechanism to achieve the effect of knock suppression, so its cost is high.
Combined with the above analysis, a compromise is usually required for the usual methods between thermal efficiency, emissions and knock suppression effects. However, water injection (WI) can provide a better solution, which can effectively reduce the thermal load in the cylinder without deteriorating the thermal efficiency and emissions. Teodosio [14] verified this opinion. He compared four types of knock suppression measures: variable valve actuation (VVA), VCR, EGR and WI, by means of numerical simulations, and found that WI had the best knock suppression in the medium-to-high load range, resulting in the most significant thermal efficiency improvement.
Water is introduced into ICEs with both physical and chemical effects. The physical aspects include charge cooling and charge dilution. The charge cooling effect is due to the high latent heat of vaporization (2257 kJ/kg) [15] and the high specific heat ratio of water. Both charge cooling and charge dilution reduce flame propagation velocity and prolong autoignition. At the same time, Chen [16] indicates that charge dilution has a greater impact on the performance of ICEs compared to charge cooling. Water is also involved in the chemistry of mixtures. Due to the complexity of the mechanism, only a few researchers have explored the chemical effects of water on simple hydrocarbons. By means of numerical simulations, Wei et al. [17] investigated the effect of water on natural gas engines. Their results show that small amounts of water have no significant chemical effect on natural gas engines. As the amount of water increases, the water inhibits the decomposition reaction of H2O2 (H2O2 + (M) = OH + OH) and therefore the combustion phase is prolonged.
There are three ways to introduce water into the engine, namely emulsion [18,19,20], direct water injection (DWI) [21,22,23,24,25,26] and port water injection (PWI) [27,28,29,30,31,32]. Emulsions are very unstable, which means that surfactants and temperature have a very strong influence on the droplet size in emulsions. Moreover, the proportion of water in the emulsion is fixed and cannot be changed with the change of the ICE’s loading. Therefore, the current research mainly focuses on PWI and DWI. Li [21] explored the effect of DWI on GDI and showed that the knock intensity and cycle work decreased with the increase in water injection ratio. Water injection is also beneficial to reduce NOX, CO and UHC emissions. Zhang [22] conducted DWI experiments on a two-cylinder diesel engine. The earlier the water was injected during the compression stroke, the higher the thermal efficiency when the water injection quality was small. If the water injection was large, it was better to inject in the late stage of the compression stroke. A 0.4 ms water injection duration and 180 degCA before top dead center (BTDC) injection time have the highest thermal efficiency improvement. Worm [31] conducted experiments on the effect of PWI on the combustion stage, combustion efficiency, indicated mean effective pressure (IMEP) and efficiency in a turbocharged spark ignition gasoline engine. The results showed that at 3000 rmp, PWI increased the thermal efficiency by 5% for fuel with a knock resistance index of 87. At 4000 rmp, the thermal efficiency increased by 7%, and the exhaust temperature decreased by 200 °C. Tornatore’s [32] PWI experiments on a port fuel injection engine showed that setting the water-to-fuel ratio to 0.2 effectively suppressed knock, thereby increasing the ignition advance angle and reducing the indicated fuel consumption by 12%.
In summary, the application of DWI and PWI on GDI engines has the potential to reduce the propensity for knock, improve fuel economy and reduce emissions. PWI technology has a cost advantage over DWI technology as it can be applied directly to GDI engines with only minor modifications [31]. In addition, PWI can reduce the intake air temperature, increase the intake air density and improve the intake air volume. Compared with DWI, PWI causes less negative impact from water film corrosion. Because of the low injection pressure of PWI, the formation of water film on the intake port wall can be avoided as much as possible with the right injection angle. Because DWI has a high injection pressure and is located inside the cylinder, it is easy for a water film to form on the cylinder wall, reducing lubricant effectiveness. Therefore, PWI was chosen in this paper to suppress the knock of the turbocharged GDI engine.
Upon analyzing the literature as above, it can be found that most of the research on PWI focuses on physical aspects and little analysis is performed on chemical mechanisms, such as the relationship between knock and intermediate combustion products during water injection. Therefore, this research analyzed the effect of different PWI positions and directions on the combustion reaction process of the end mixture near the cylinder wall and the mechanism of HCO radical generation. Knock intensity (KI) combined with HCO radicals was used to characterize the knock.

2. Numerical Simulation Model, Verification and Knock Condition

2.1. Numerical Simulation Model

The geometric model, basic parameters and operating conditions of the GDI engine in this study are shown in Figure 1, Table 1 and Table 2. The compression top dead stop was 0 degCA.
The turbulence model is one of the most important submodels in numerical simulation, which is related to the flow and distribution of air, fuel and water, and thus affects the accuracy of the calculation. In this paper, the k-ε two-equation model proposed by Jones [33] was chosen. This model can reduce the computational cost while ensuring the computational accuracy. The combustion model used in this paper is the SAGE model, which can be easily implemented for different fuels by changing the mechanism file [34]. The mechanism file selected for this paper was constructed by our group and contains 113 components and 201 reactions [35]. The selection of each model is shown in Table 3.

2.2. Initial Parameter and Calculation Conditions

The initial parameter settings are critical to the accuracy of a simulation. The initial boundary temperatures used in this paper were obtained from experiments and software (GT-POWER) calculations. The calculation starts at −360 degCA and ended at 360 degCA. The details of the initial temperature of the boundary are shown in Table 4.

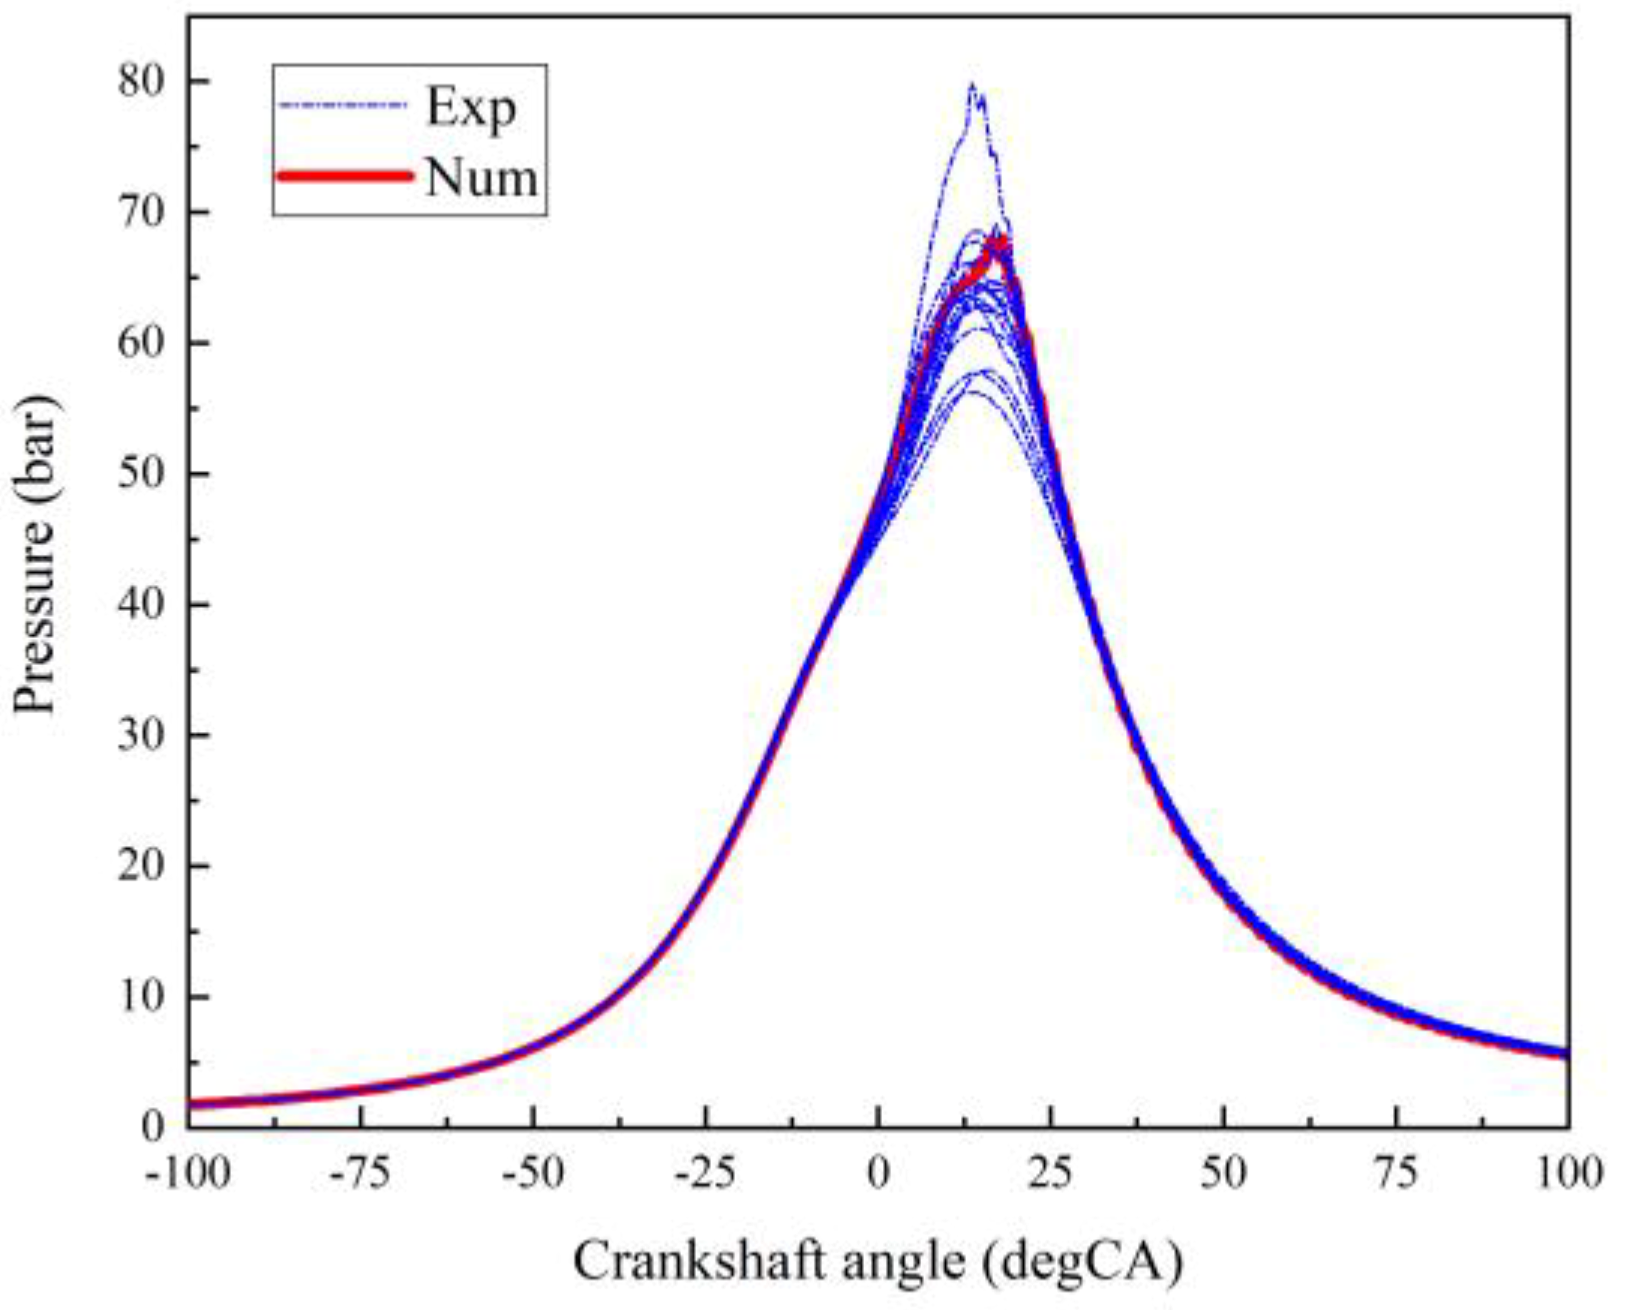
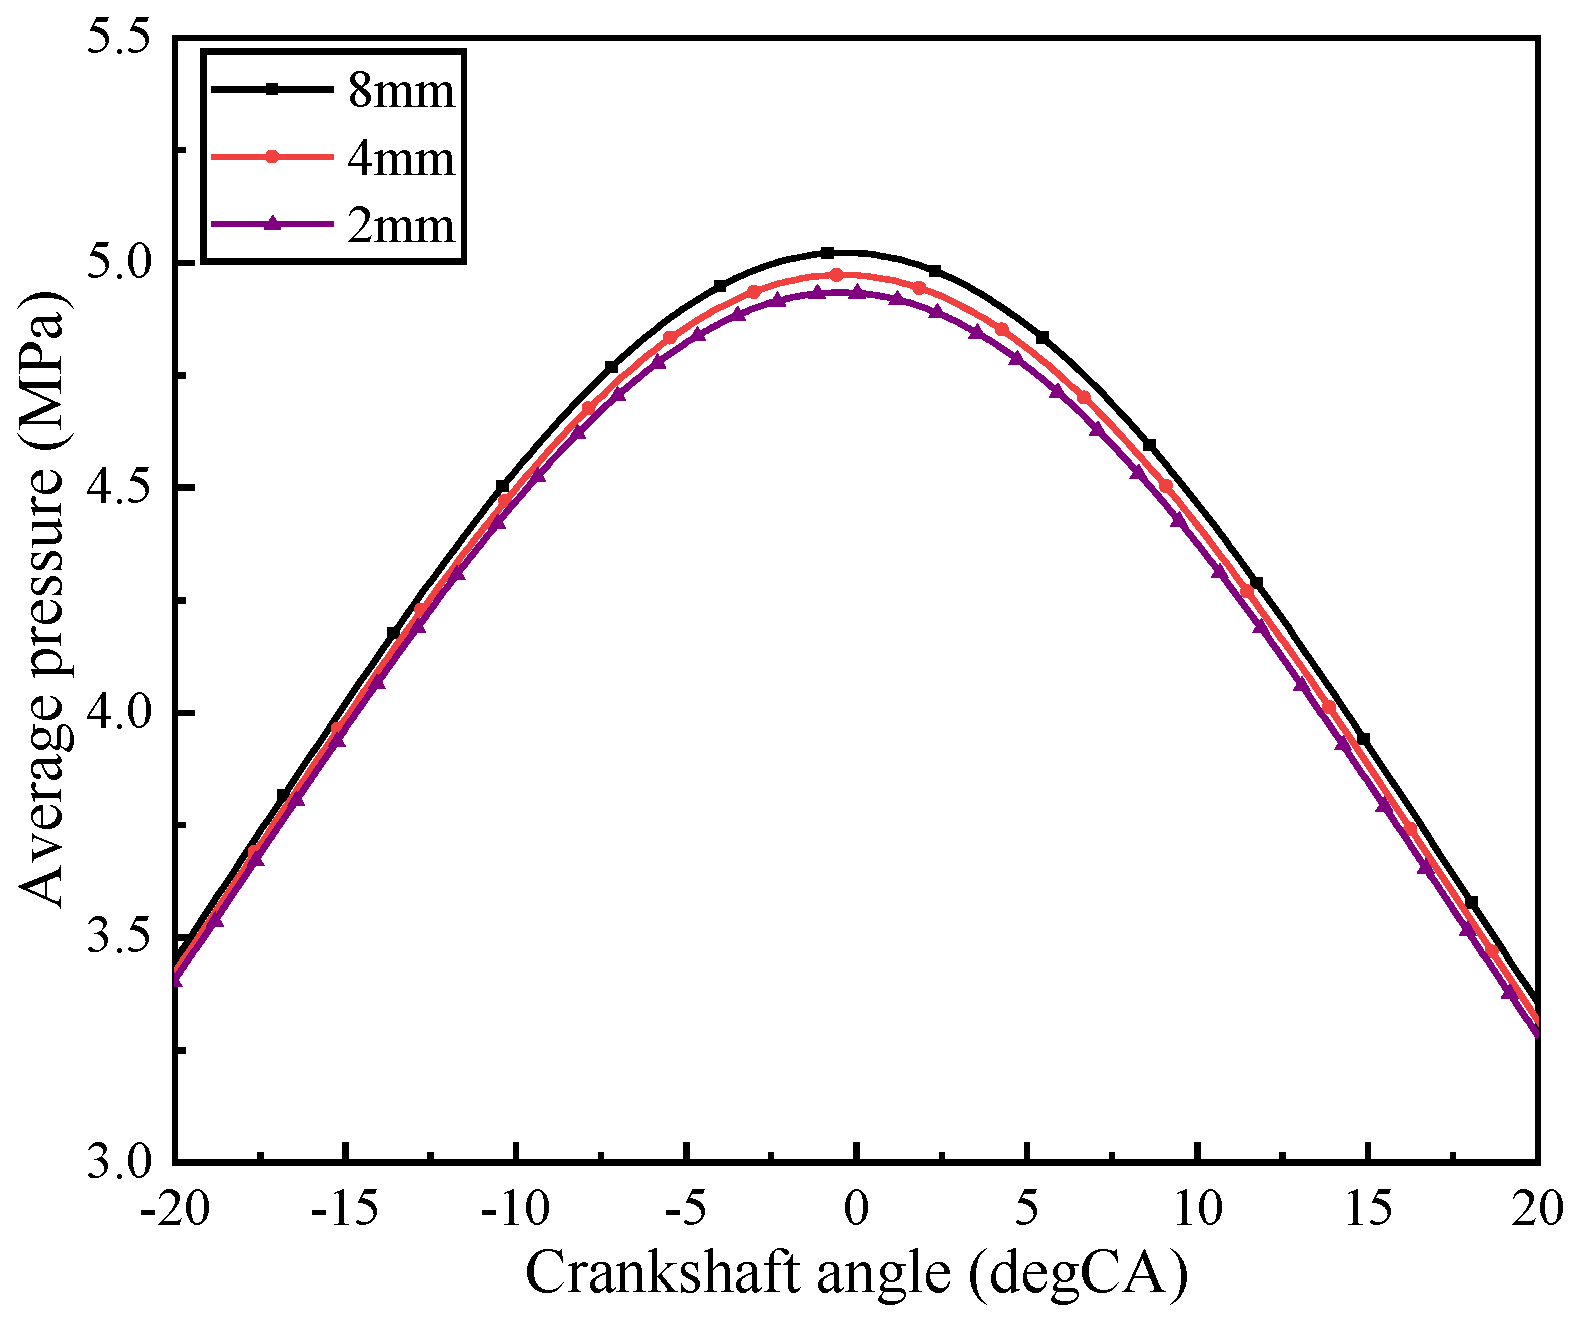
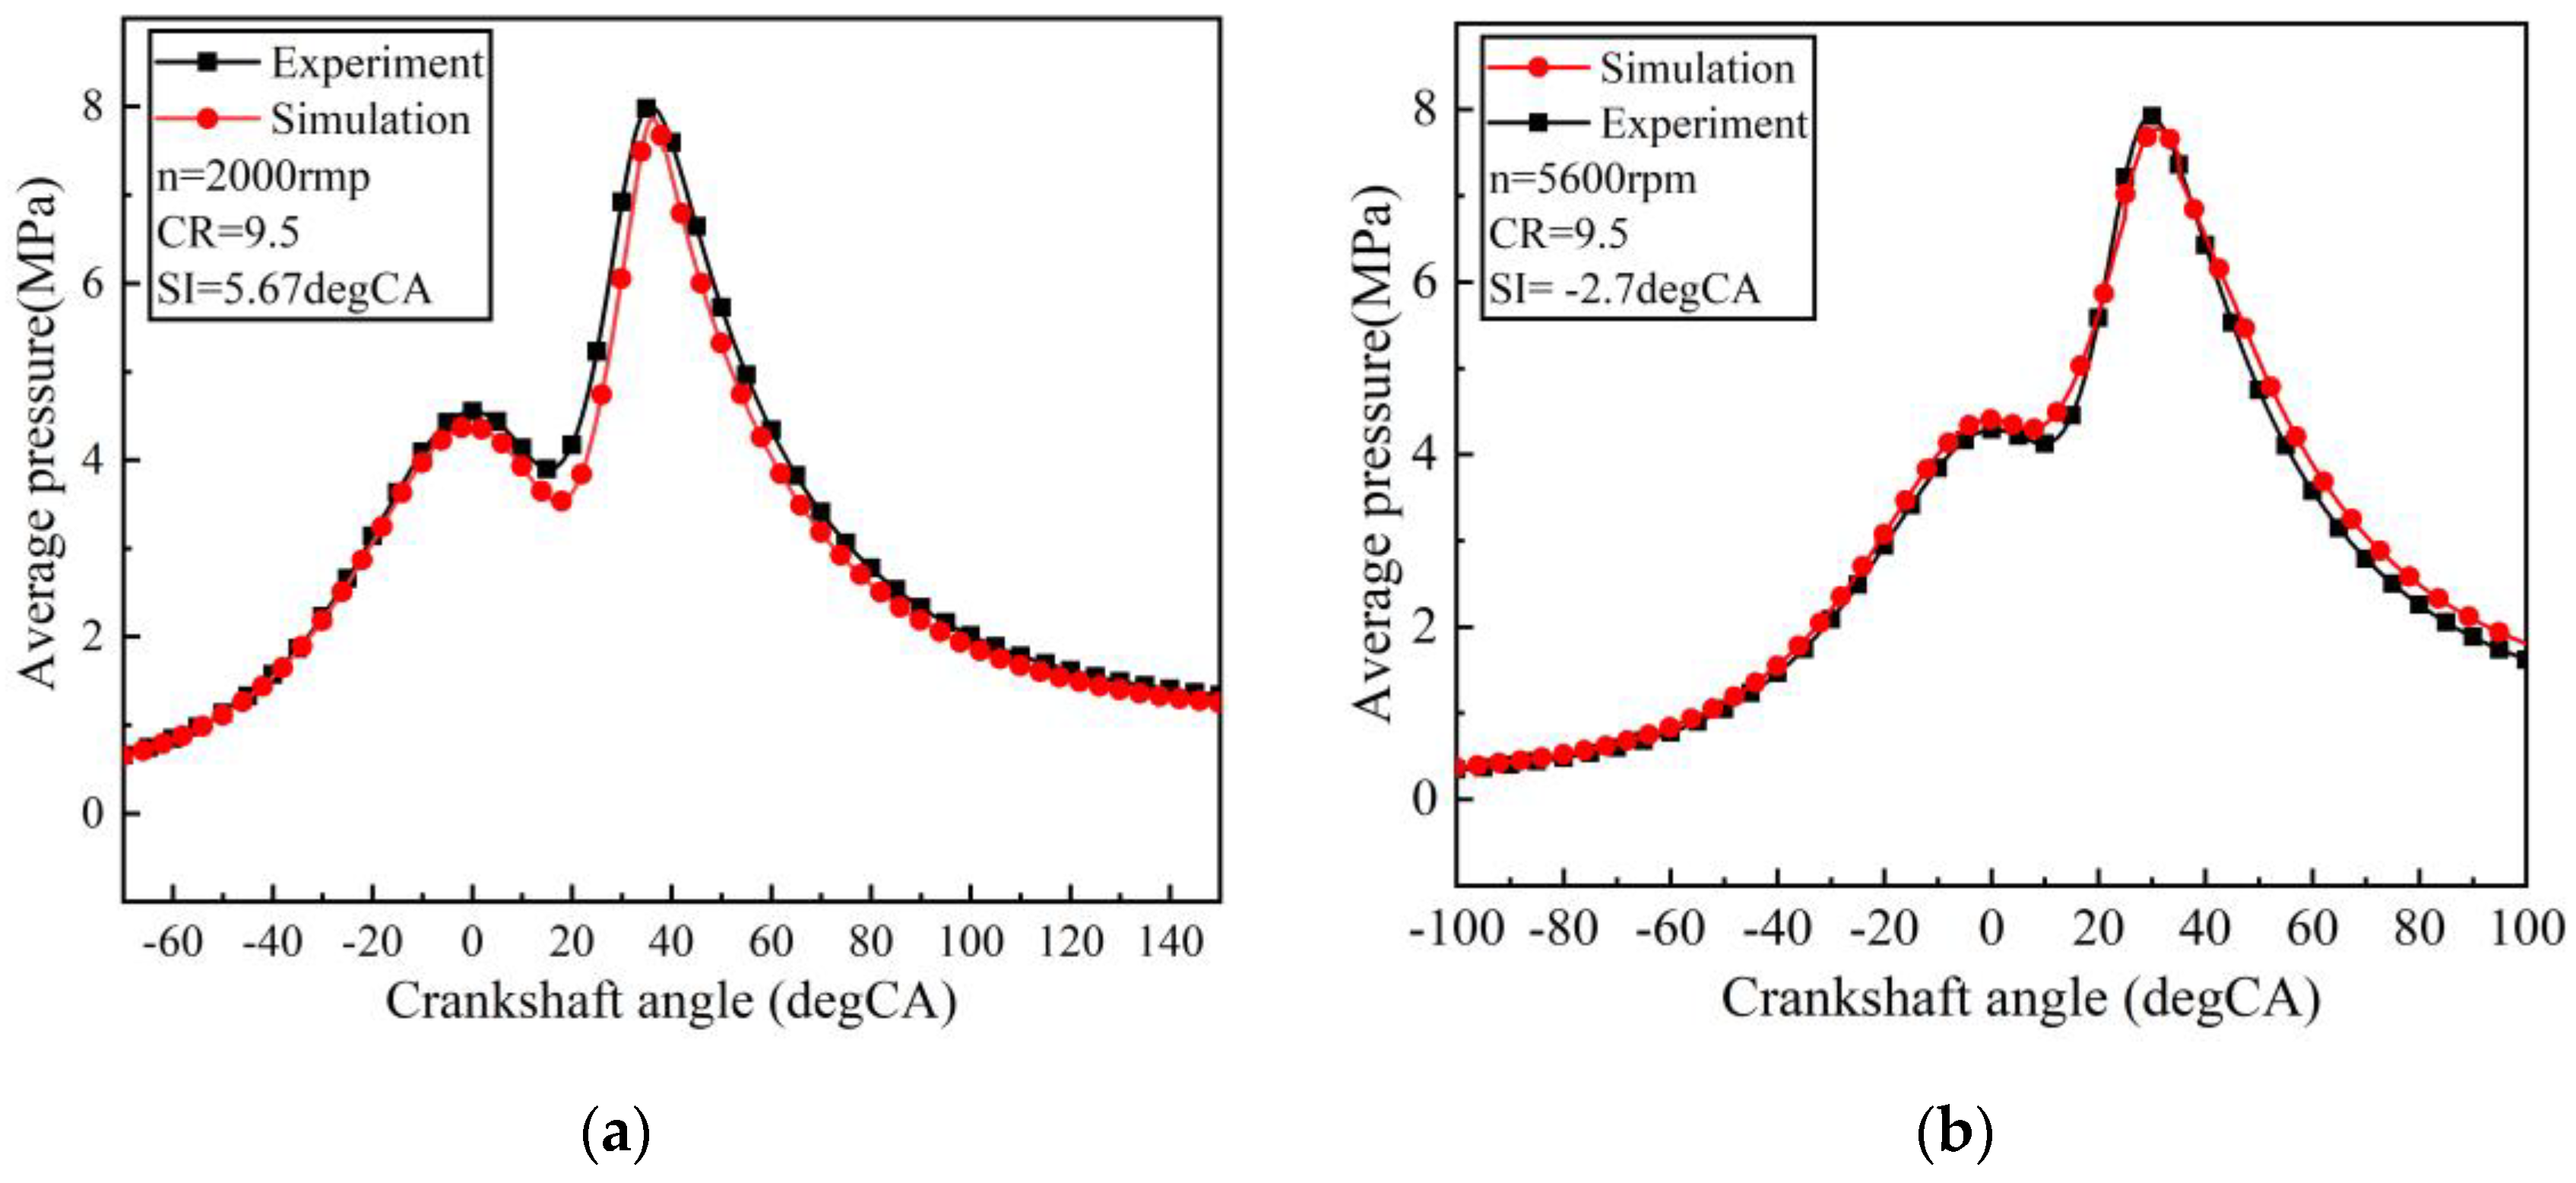
2.3. Verification of the Numerical Simulation Model of GDI Engine

In this paper, three grid sizes of 8 mm, 4 mm and 2 mm were first selected for grid independence verification. Grid embedding was adopted in some locations at some moments to improve the accuracy of the calculation. Grid embedding included adaptive mesh refinement (AMR) and fixed embedding. Adaptive mesh refinement, including of the cylinder and intake region, was adopted to accurately capture changes in temperature and velocity gradients. Other locations with fixed embedding levels are shown in Table 5.
Figure 2 shows the average pressure curves in the cylinder for the three grid sizes obtained from the cold flow calculation. As can be seen from the figure, the calculation difference between the grid size of 4 mm and 2 mm was small, while 8 mm had a large error. Considering the calculation cost and accuracy, the 4 mm grid size was the most suitable one.
To verify the reliability of the numerical model, numerical simulation results and experimental results also needed to be compared. The verification conditions were divided into low-speed and high-speed conditions, and the specific experimental operating parameters are shown in Table 6. Figure 3 shows the pressure comparison between the experimental and numerical simulation values for the two speeds. As can be seen from the figure, the error between the numerical simulation and the experimental results for both low and high-speed conditions was less than 5%. Therefore, the numerical model in this paper can effectively simulate the operating conditions of the GDI engine.
A comparison between numerical simulation and experimental pressure under the knock conditions was performed in order to verify the validity of the numerical submodel. The parameters of the model used for the validation are shown in Table 7, and the selection of all submodels of this model was exactly the same as those of this paper. Because the chosen validation operating conditions did not always result in knock, 20 consecutive cycles of experimental pressure data and one cycle of numerical simulation data were chosen. As shown in Figure 4, the experimental data and the numerical simulation data match well under the knock condition, so the numerical submodel selected in this paper can fully reproduce the combustion process in the cylinder under the knock conditions.

2.4. Determination of the Knock Conditions

The GDI gasoline engines are most prone to knock at low speeds and high loads [9,36], so the 2000 rpm operating condition was chosen for this paper. In addition, the GDI engine was induced to knock by increasing CR and advancing ignition time. The changed parameters of the GDI engine in this section are shown in Table 8.
The KI is commonly used to quantify the knock intensity. KI is expressed as the average of the PPmax values (peak-to-peak values of the oscillation signal) for N different monitor points. It is generally considered that the GDI has knocked when KI > 2 [36,37].
KI = 1 N 1 N PP max , n
The location away from the spark plug and near the cylinder wall is the most prone to knock, so the monitor point was arranged near the cylinder wall, as shown in Figure 5.

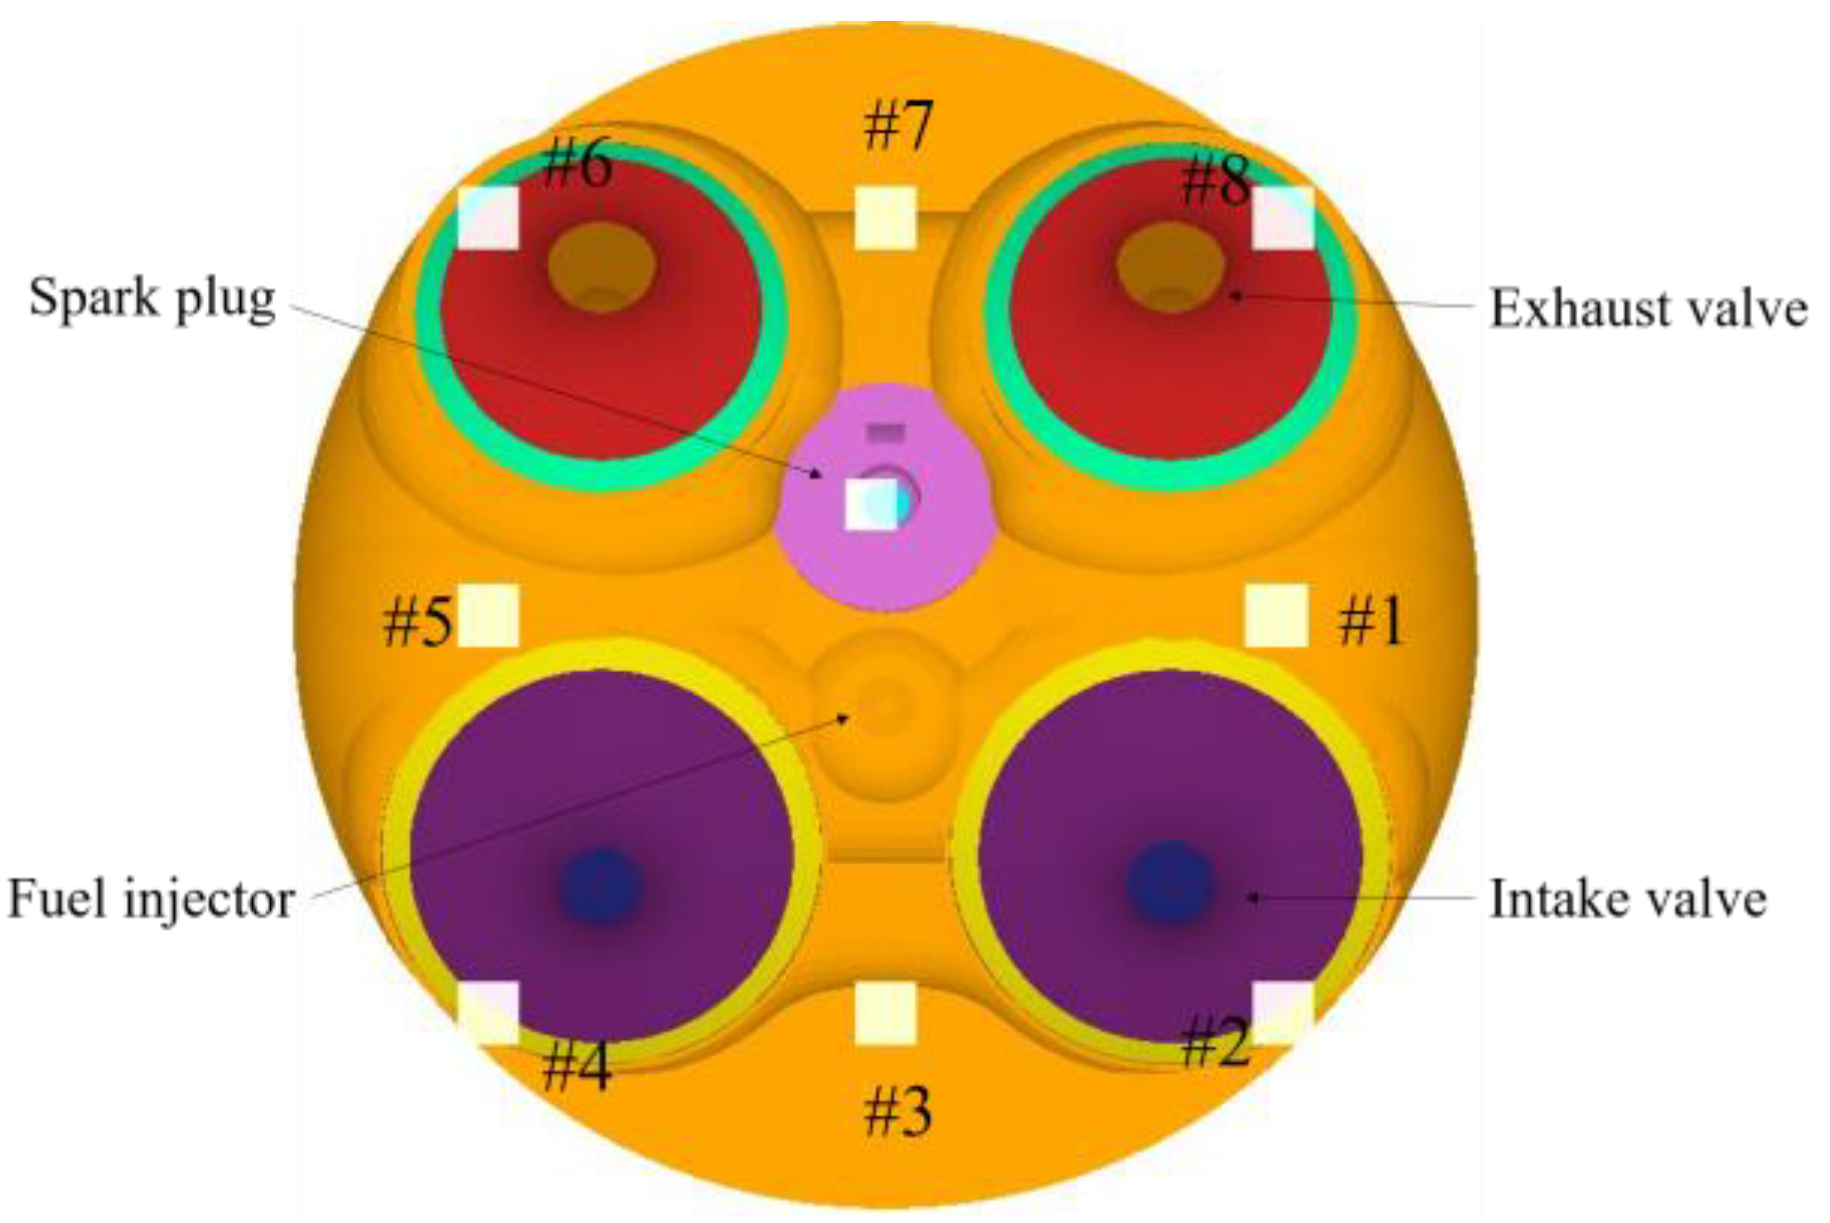
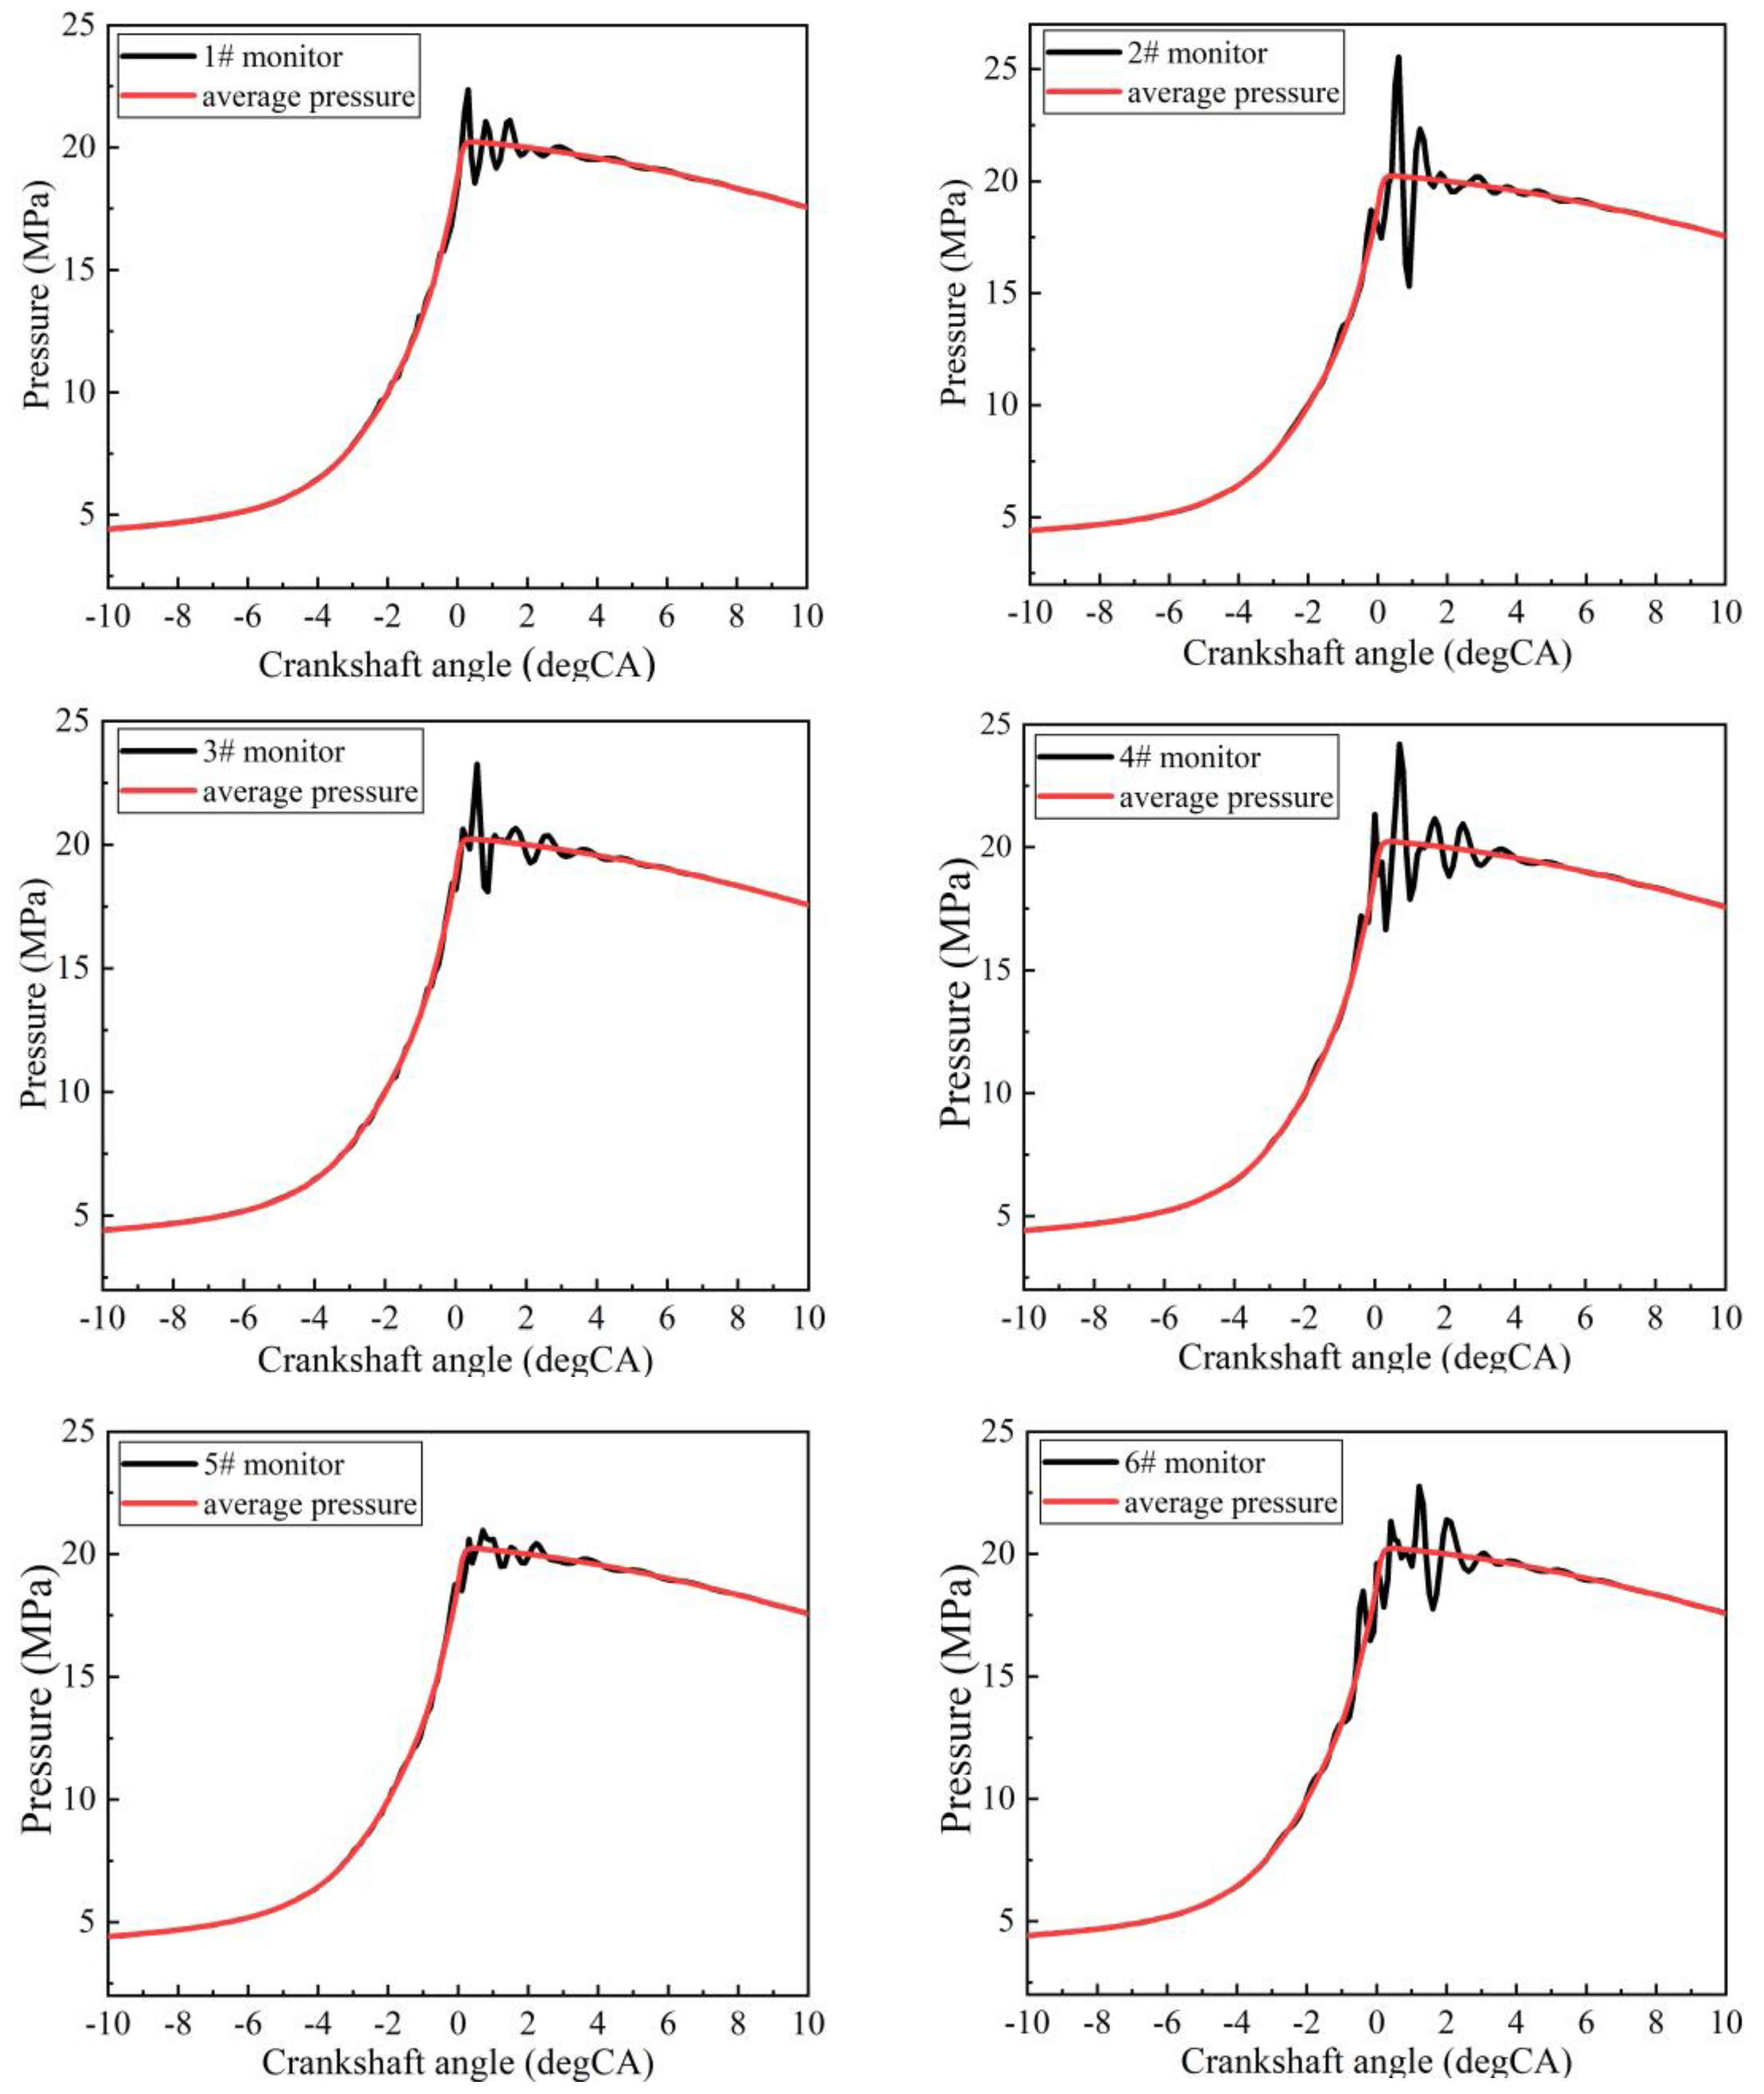
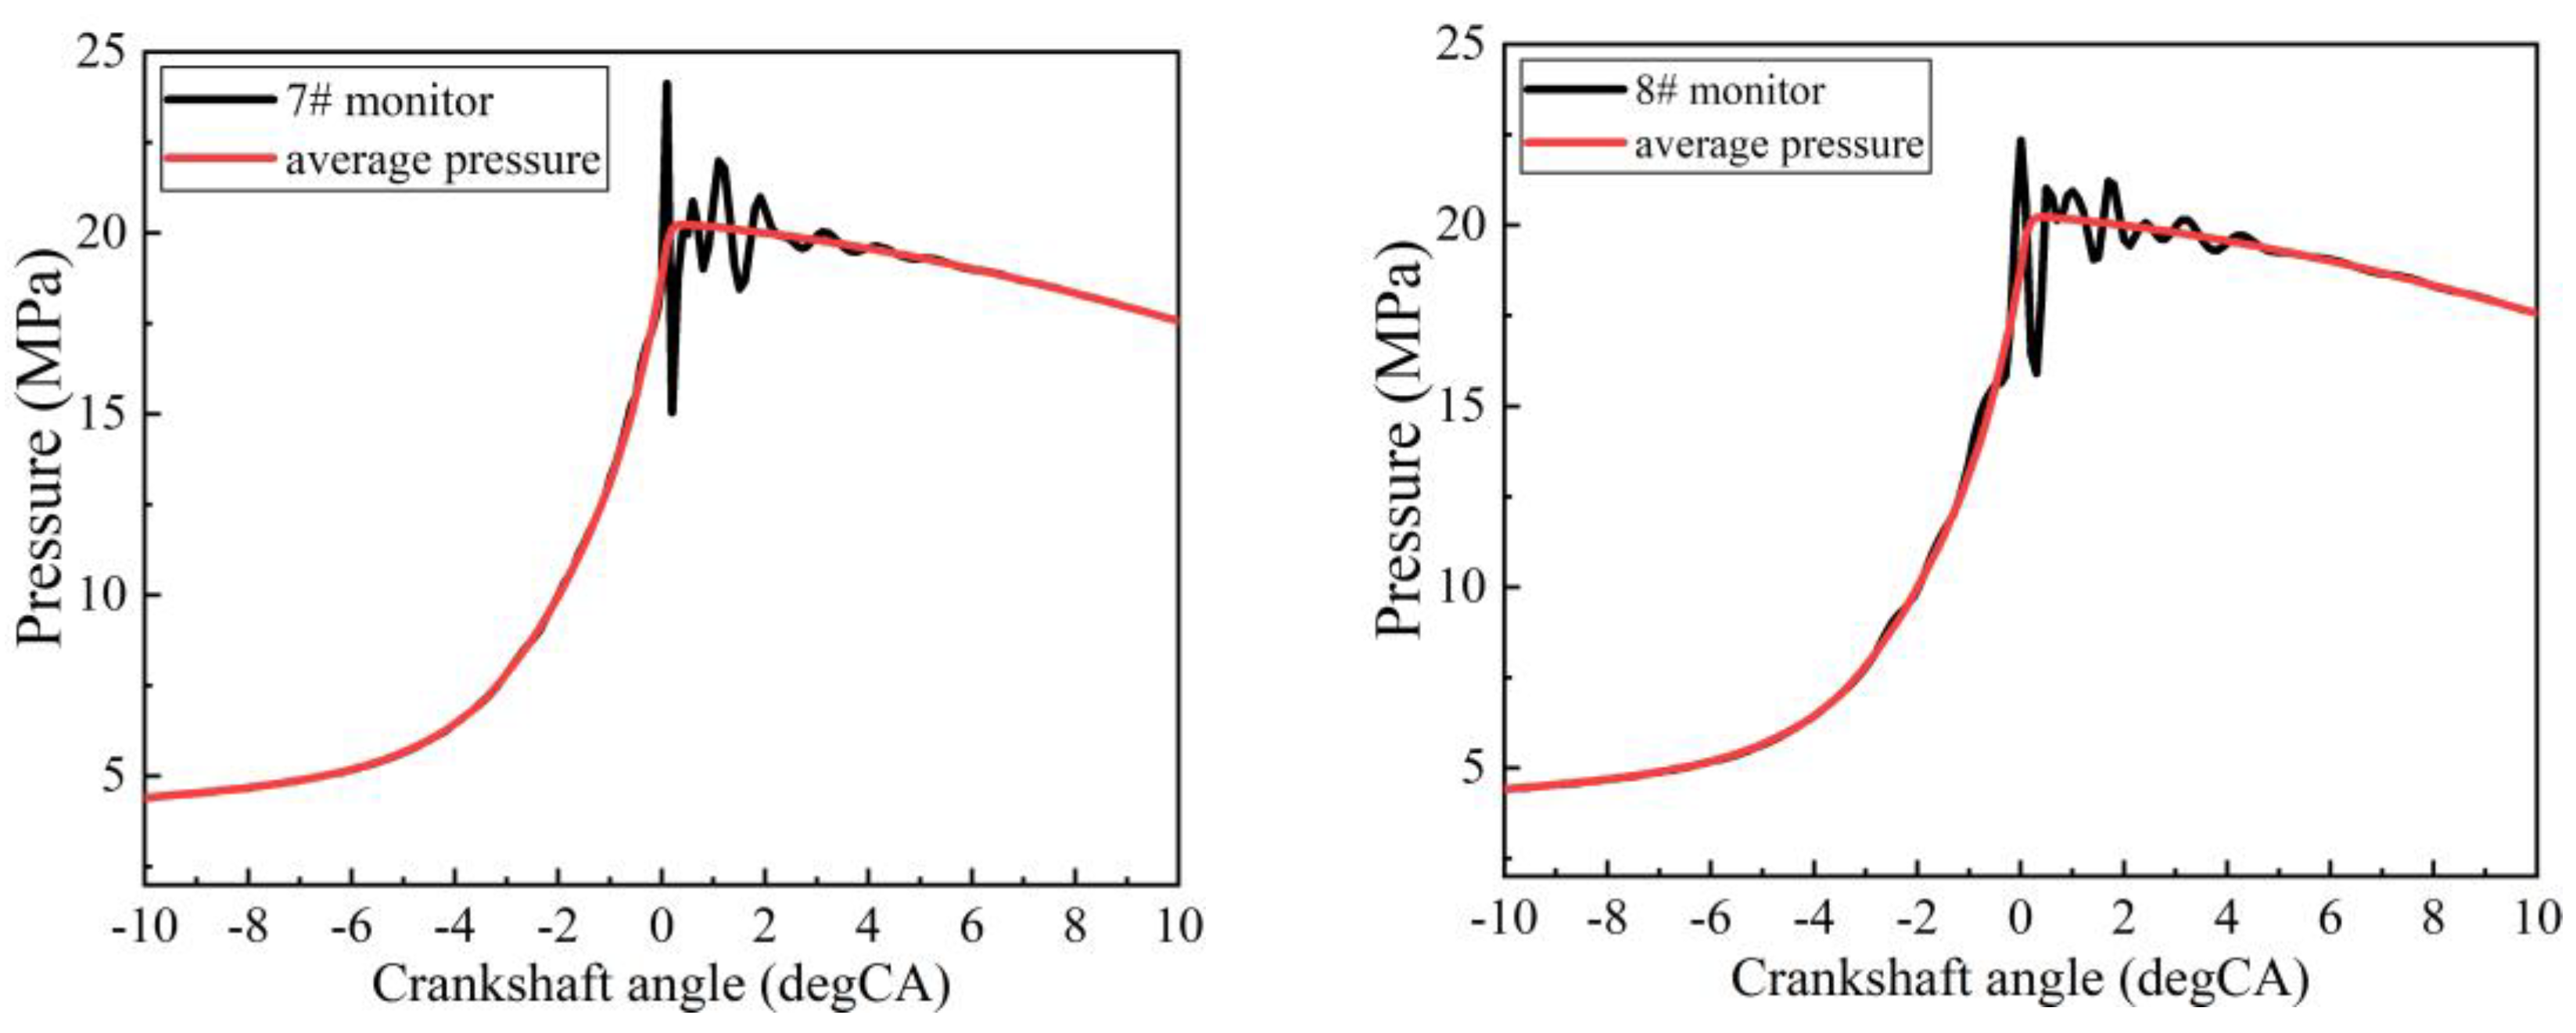
2.5. Knock Detection

This paper focused on the identification of knock by KI and free radicals. The main combustion intermediates analyzed in this section are shown in Figure 6, including H2O2, CH2O, OH and HCO radicals.
As shown in Figure 6a, the mass fraction of fuel (IC8H18) near the cylinder wall decreased rapidly at the top dead center, indicating that a knock was likely to have occurred at this time. Zhen et al. [38] found that CH2O and H2O2 radicals are rapidly generated when the end gas mixture undergoes low temperature reactions. As shown in Figure 6b,c, high concentrations of H2O2 and CH2O mass fractions appeared in the end region at −1 degCA, indicating that this region experienced strong low temperature reactions. As the temperature in the end region increases further, H2O2 decomposes to OH and OH reacts with CH2O, so the high concentration region of both is shrinking at 0 degCA. CH2O reacts with OH to generate HCO, and then HCO reacts with OH to generate CO. This process generates a lot of heat and therefore causes the engine to knock. At 0 degCA, the area of high HCO concentration in the end region is the largest, so it can be concluded that a knock has indeed occurred at this time. The specific reaction equation is shown below.
H2O2 + (M) = OH + OH + (M)
CH2O + OH = HCO + H2O
HCO + OH = CO + H2O
Figure 7 shows the pressure change curves of eight monitor points, among which points 2, 4, 6, 7 and 8 show drastic pressure fluctuations. The pressure curve at the monitor point starts to fluctuate sharply around 0 degCA, verifying the start moment of the knock. According to the definition of KI, a KI value of 3 indicates that a strong knock has occurred.

3. Results and Discussion

The location and direction of the PWI engine water injector directly affect the evaporation and distribution characteristics of the water in the intake port and cylinder, which in turn affects its knock suppression effect. Six different cases of water injection were designed, including three vertical distances from the cylinder center to the water injector (0.07, 0.1 and 0.13 m) and two different injection directions (60° and 90°), as shown in Figure 8. The injection direction refers to the angle between the line of central symmetry of the six nozzles and the longitudinal axis (z-axis). The longitudinal axis and the line of central symmetry of the cylinder coincide. The specific water injection parameters are shown in Table 9.

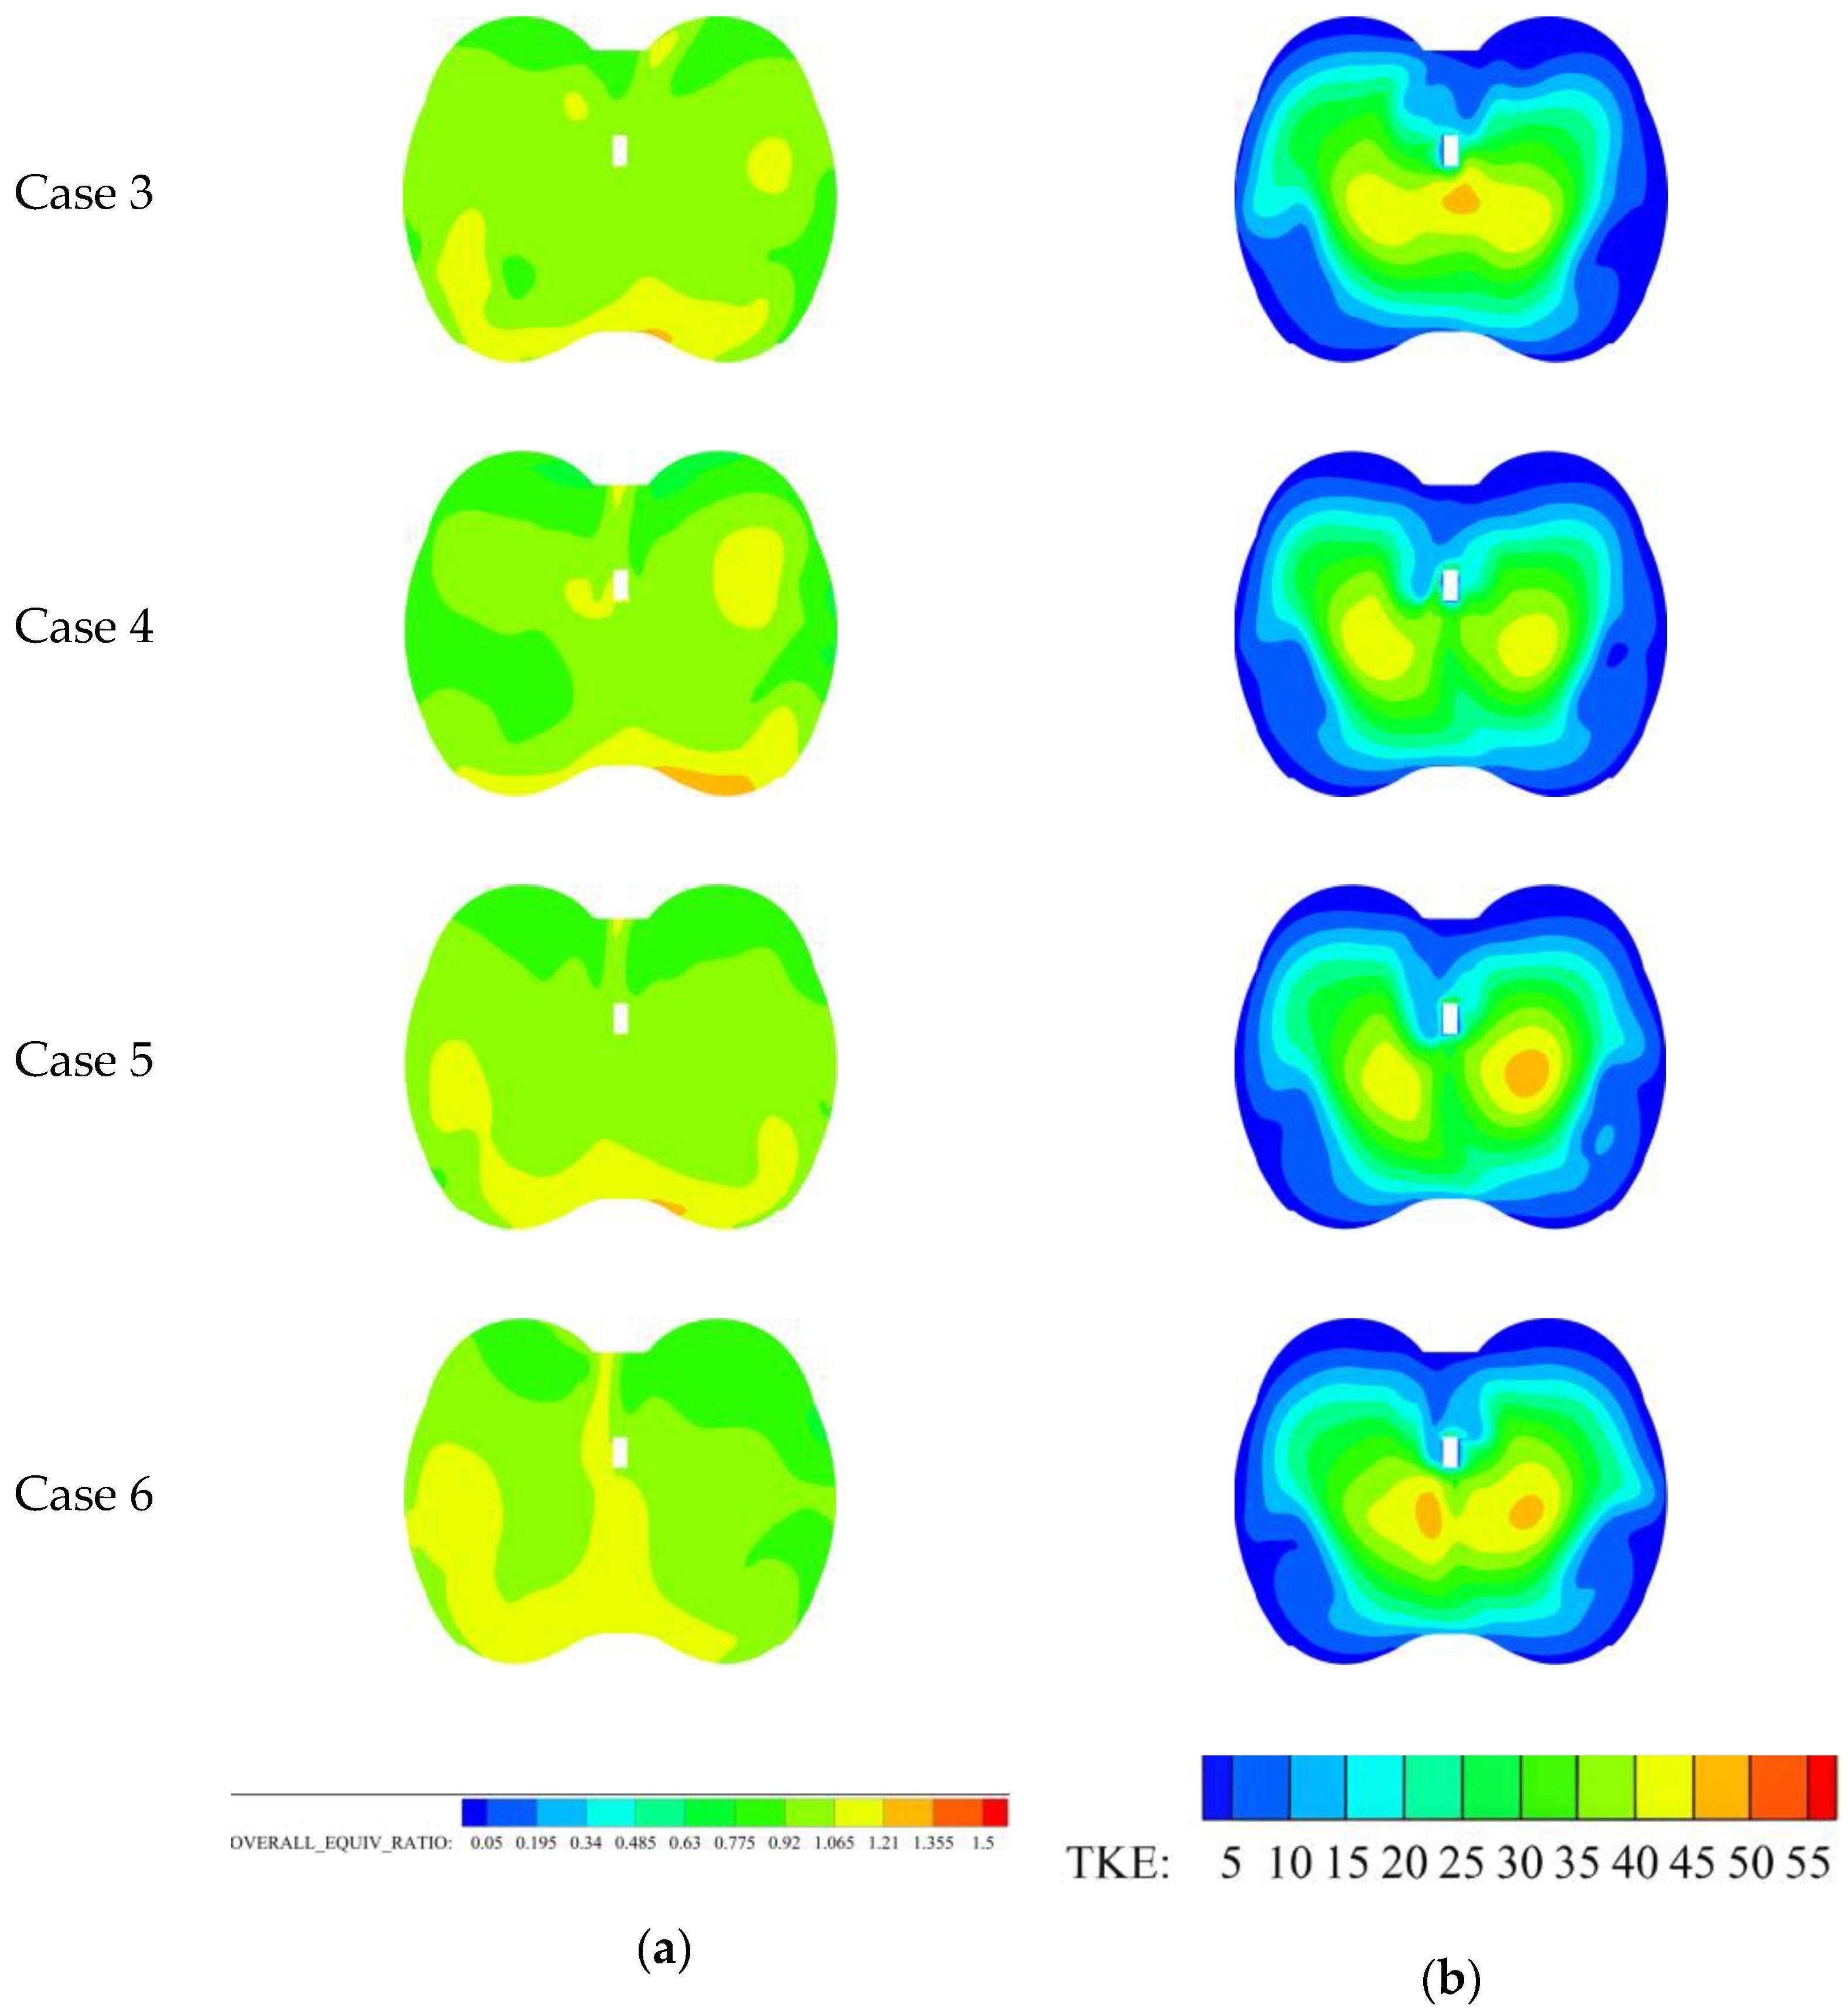
3.1. Different Water Injection Cases: The Atomization of Water and Mixture Formation

Figure 9 shows the effect of different water injection cases on the water distribution at the moment of ignition. As can be seen from the figure, in cases 2 and 4 water evaporated fast. In cases 3 and 5, a large water film was formed due to the direction of the injection. The water injectors in case 5 and 6 were positioned furthest from the cylinder center, thus leaving a large amount of unevaporated water in the intake port. The ideal water distribution is to get as much water into the cylinder as possible and let it evaporate in the cylinder. Therefore, cases 2 and 4 had a much better water distribution. By comparing the 60° and 90° water injection cases, it can be found that the 90° installation direction is more reasonable because its intake port wall wetting area is smaller. A smaller intake wetting area means less corrosion on the intake port wall.
The equivalence ratio and turbulent kinetic energy (TKE) distribution in the cylinder at different water injection cases at the moment of ignition time are shown in Figure 10. The equivalence ratio near the intake valve was greater than that near the exhaust valve in the six water injection cases. The equivalence ratios near the intake valves were basically around 1.1, which was the most suitable ratio for ignition and flame propagation. Figure 10b shows the TKE for different water injection cases, and the TKE in the center region of the cylinder was larger than that region around the cylinder. The TKE in the center of the cylinder in case 2 was the largest, which helped to accelerate the propagation of flame to the cylinder wall, thus inhibiting the occurrence of spontaneous combustion of the end mixture.
Water evaporates in the intake port and lowers the intake air temperature, so the density of the intake air will increase, but at the same time, water vapor will occupy part of the intake air volume. If the benefit of increased intake density is greater than the effect of water vapor occupying the intake volume, then the amount of intake air entering the cylinder will increase, and vice versa. As can be seen in Figure 11, PWI technology increases the amount of air entering the cylinder, indicating a more pronounced effect of increased air intake density. The equivalence ratio of case 4 was the smallest, indicating that this case had the most air mass entering the cylinder. An equivalence ratio of less than 1 ensures complete combustion of the fuel theoretically, but it also has the potential to increase the combustion temperature and thus the NOX emissions.

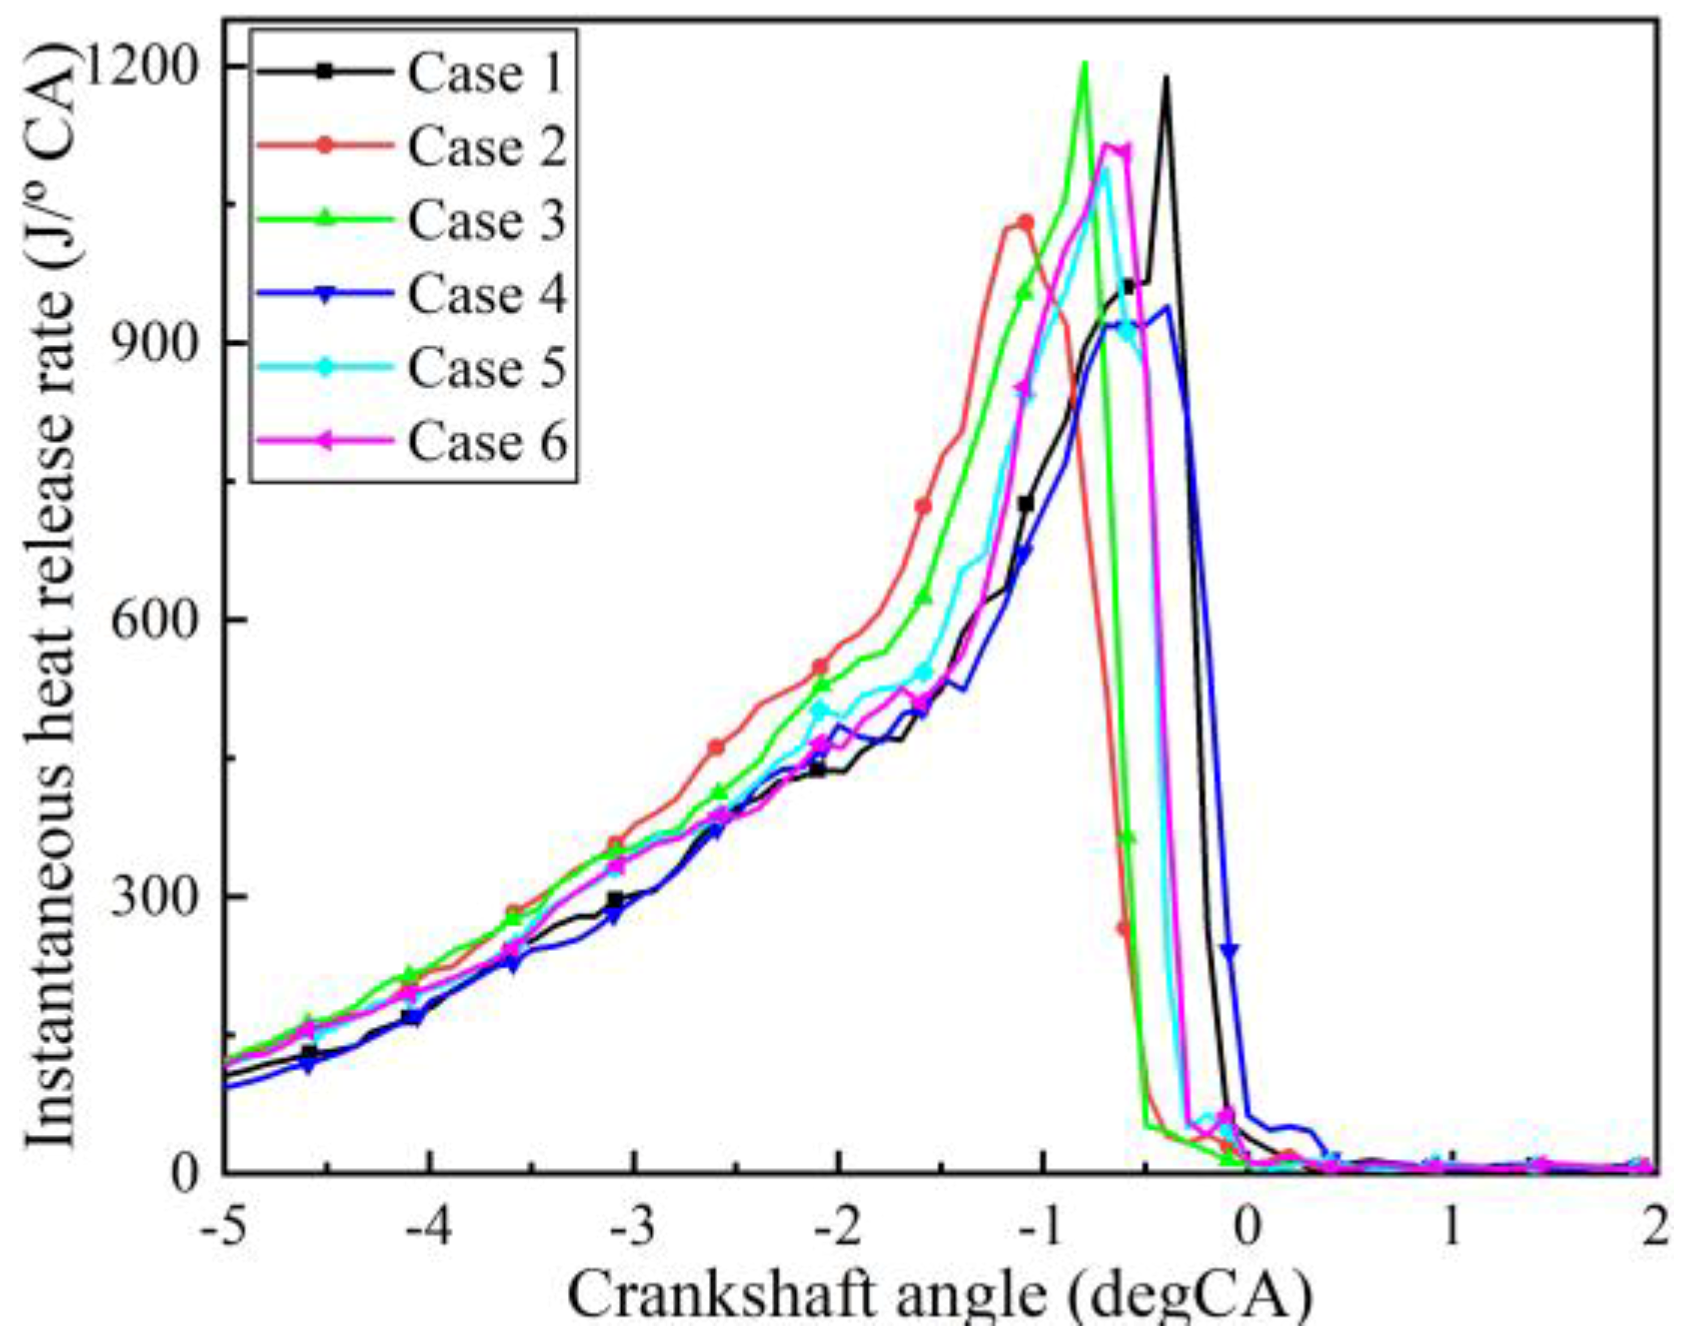
3.2. Different Water Injection Cases: Combustion Characteristics and Knock Suppression

Figure 12a,b shows the average pressure and temperature in the cylinder for different water injection cases. It can be seen that the different water injection cases have little effect on the peak pressure and temperature in the cylinder, but affect the combustion rate. Figure 12c shows the ignition delay and combustion phase for different water injection cases. The ignition delay is defined as the time between the moment of ignition and the 10% mass fraction combustion position, and the combustion duration is defined as the time between the 10% mass fraction combustion position and the 90% mass fraction combustion position. As shown in Figure 12c, case 2 had a relatively short ignition delay and combustion duration, so its fuel burned the fastest. Case 4 had the longest ignition delay, so its combustion rate was the slowest. This phenomenon is mainly related to the TKE in the cylinder at the moment of ignition. Case 2 had the largest TKE (larger than 55) in the center of the cylinder, so its ignition delay was the shortest. Case 3 had a large area of high TKE in the center of the cylinder, so the ignition delay was only a little longer than in case 2.
Figure 13 shows the pressure curves of eight monitor points for different water injection cases. Among the six cases, the pressure fluctuations at the eight monitor points in cases 2 and 4 were small, while the pressure fluctuations in cases 1, 5 and 6 were significant. The monitor points with strong pressure oscillations were points 6, 7 and 8, which were all located below the exhaust valve. Because of the small equivalence ratio under the exhaust valve, the flame propagation was slow and the flame had not yet propagated to the end mixture before the strong low temperature reaction occurred near the cylinder wall, which can lead to the occurrence of knock.
It is also worth noting that the combustion delay period for the six water injection cases was shorter than when the water was not injected. The increase in cylinder temperature drives the H2O entering the cylinder to produce OH through a series of reaction Equations (R4)–(R7), as shown in Figure 14. The early generation of large amounts of OH radicals leads to an earlier dehydrogenation reaction of OH and fuel as well, thus shortening the combustion delay period, which is consistent with Singh’s [39] study.
H + OH + M = H2O + M
OH + H2 = H2O + H
2OH = O + H2O
OH + HO2 = H2O + O2
According to the definition of KI, the KI values of each case are shown in Figure 15. The knock of cases 2 and 4 was suppressed, while in cases 1, 3, 5 and 6 the knock was enhanced. This was related to the distribution of water, the overall equivalence ratio and the increased number of OH radicals in the cylinder. If the charge cooling effect and the dilution effect are greater than the effect of the enhanced low temperature reaction of the end mixture due to the increase of OH radicals, the knock will be suppressed, and vice versa. From the previous analysis, it is clear that more water and air entered the cylinder in case 2 and 4, so the cooling effect and dilution effect were strong. The enhanced effect of the low temperature reaction of the end mixture due to the increased number of OH radicals was more pronounced in the other four cases.

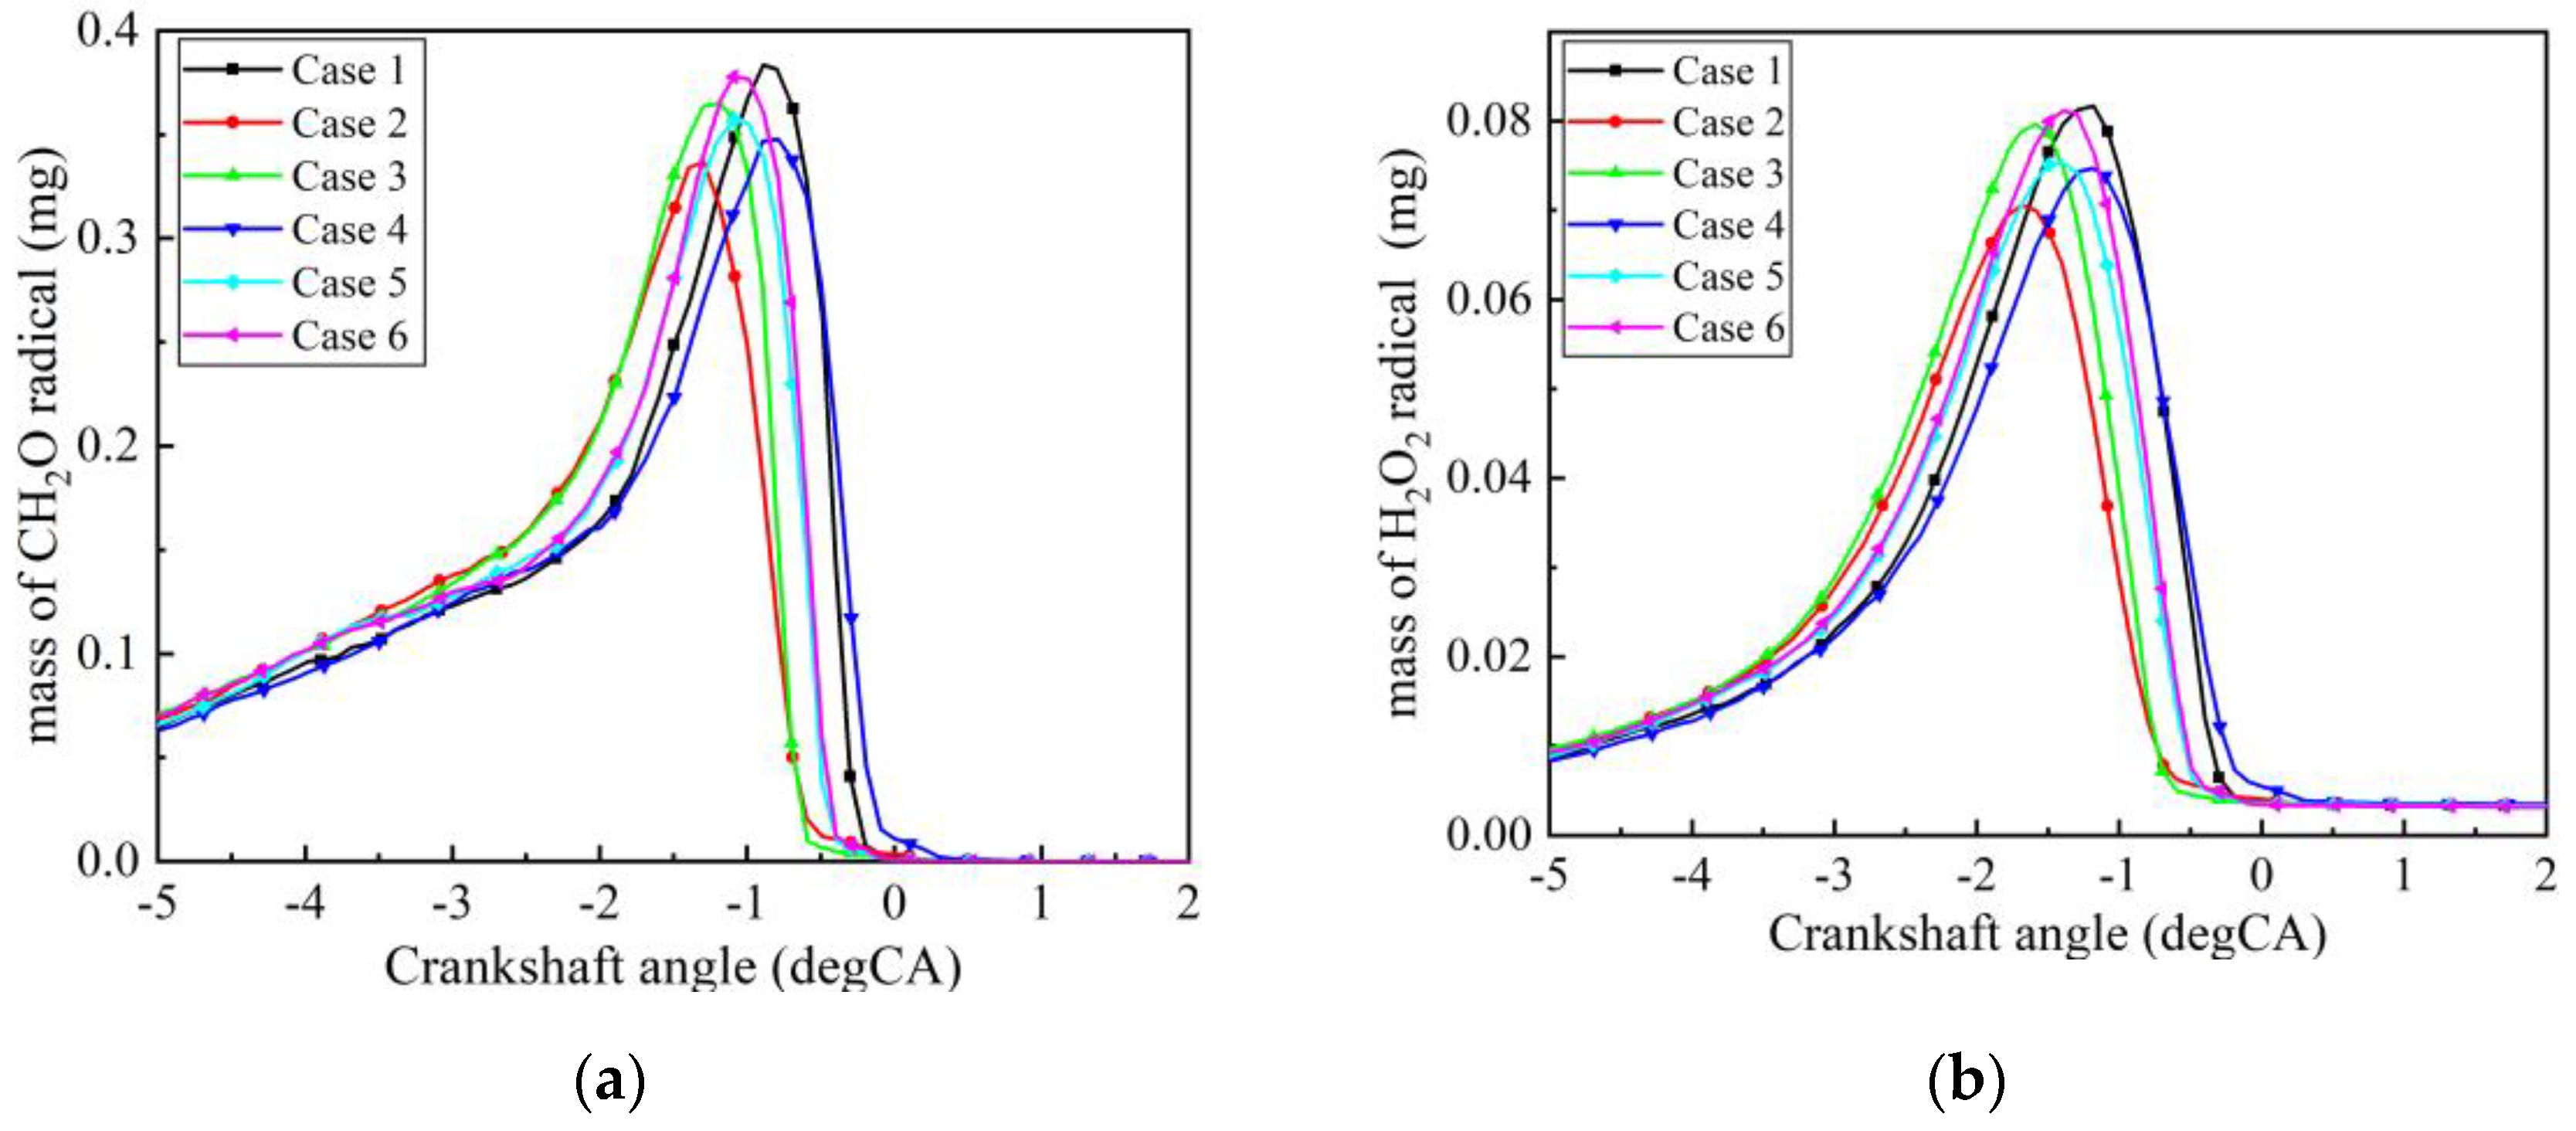
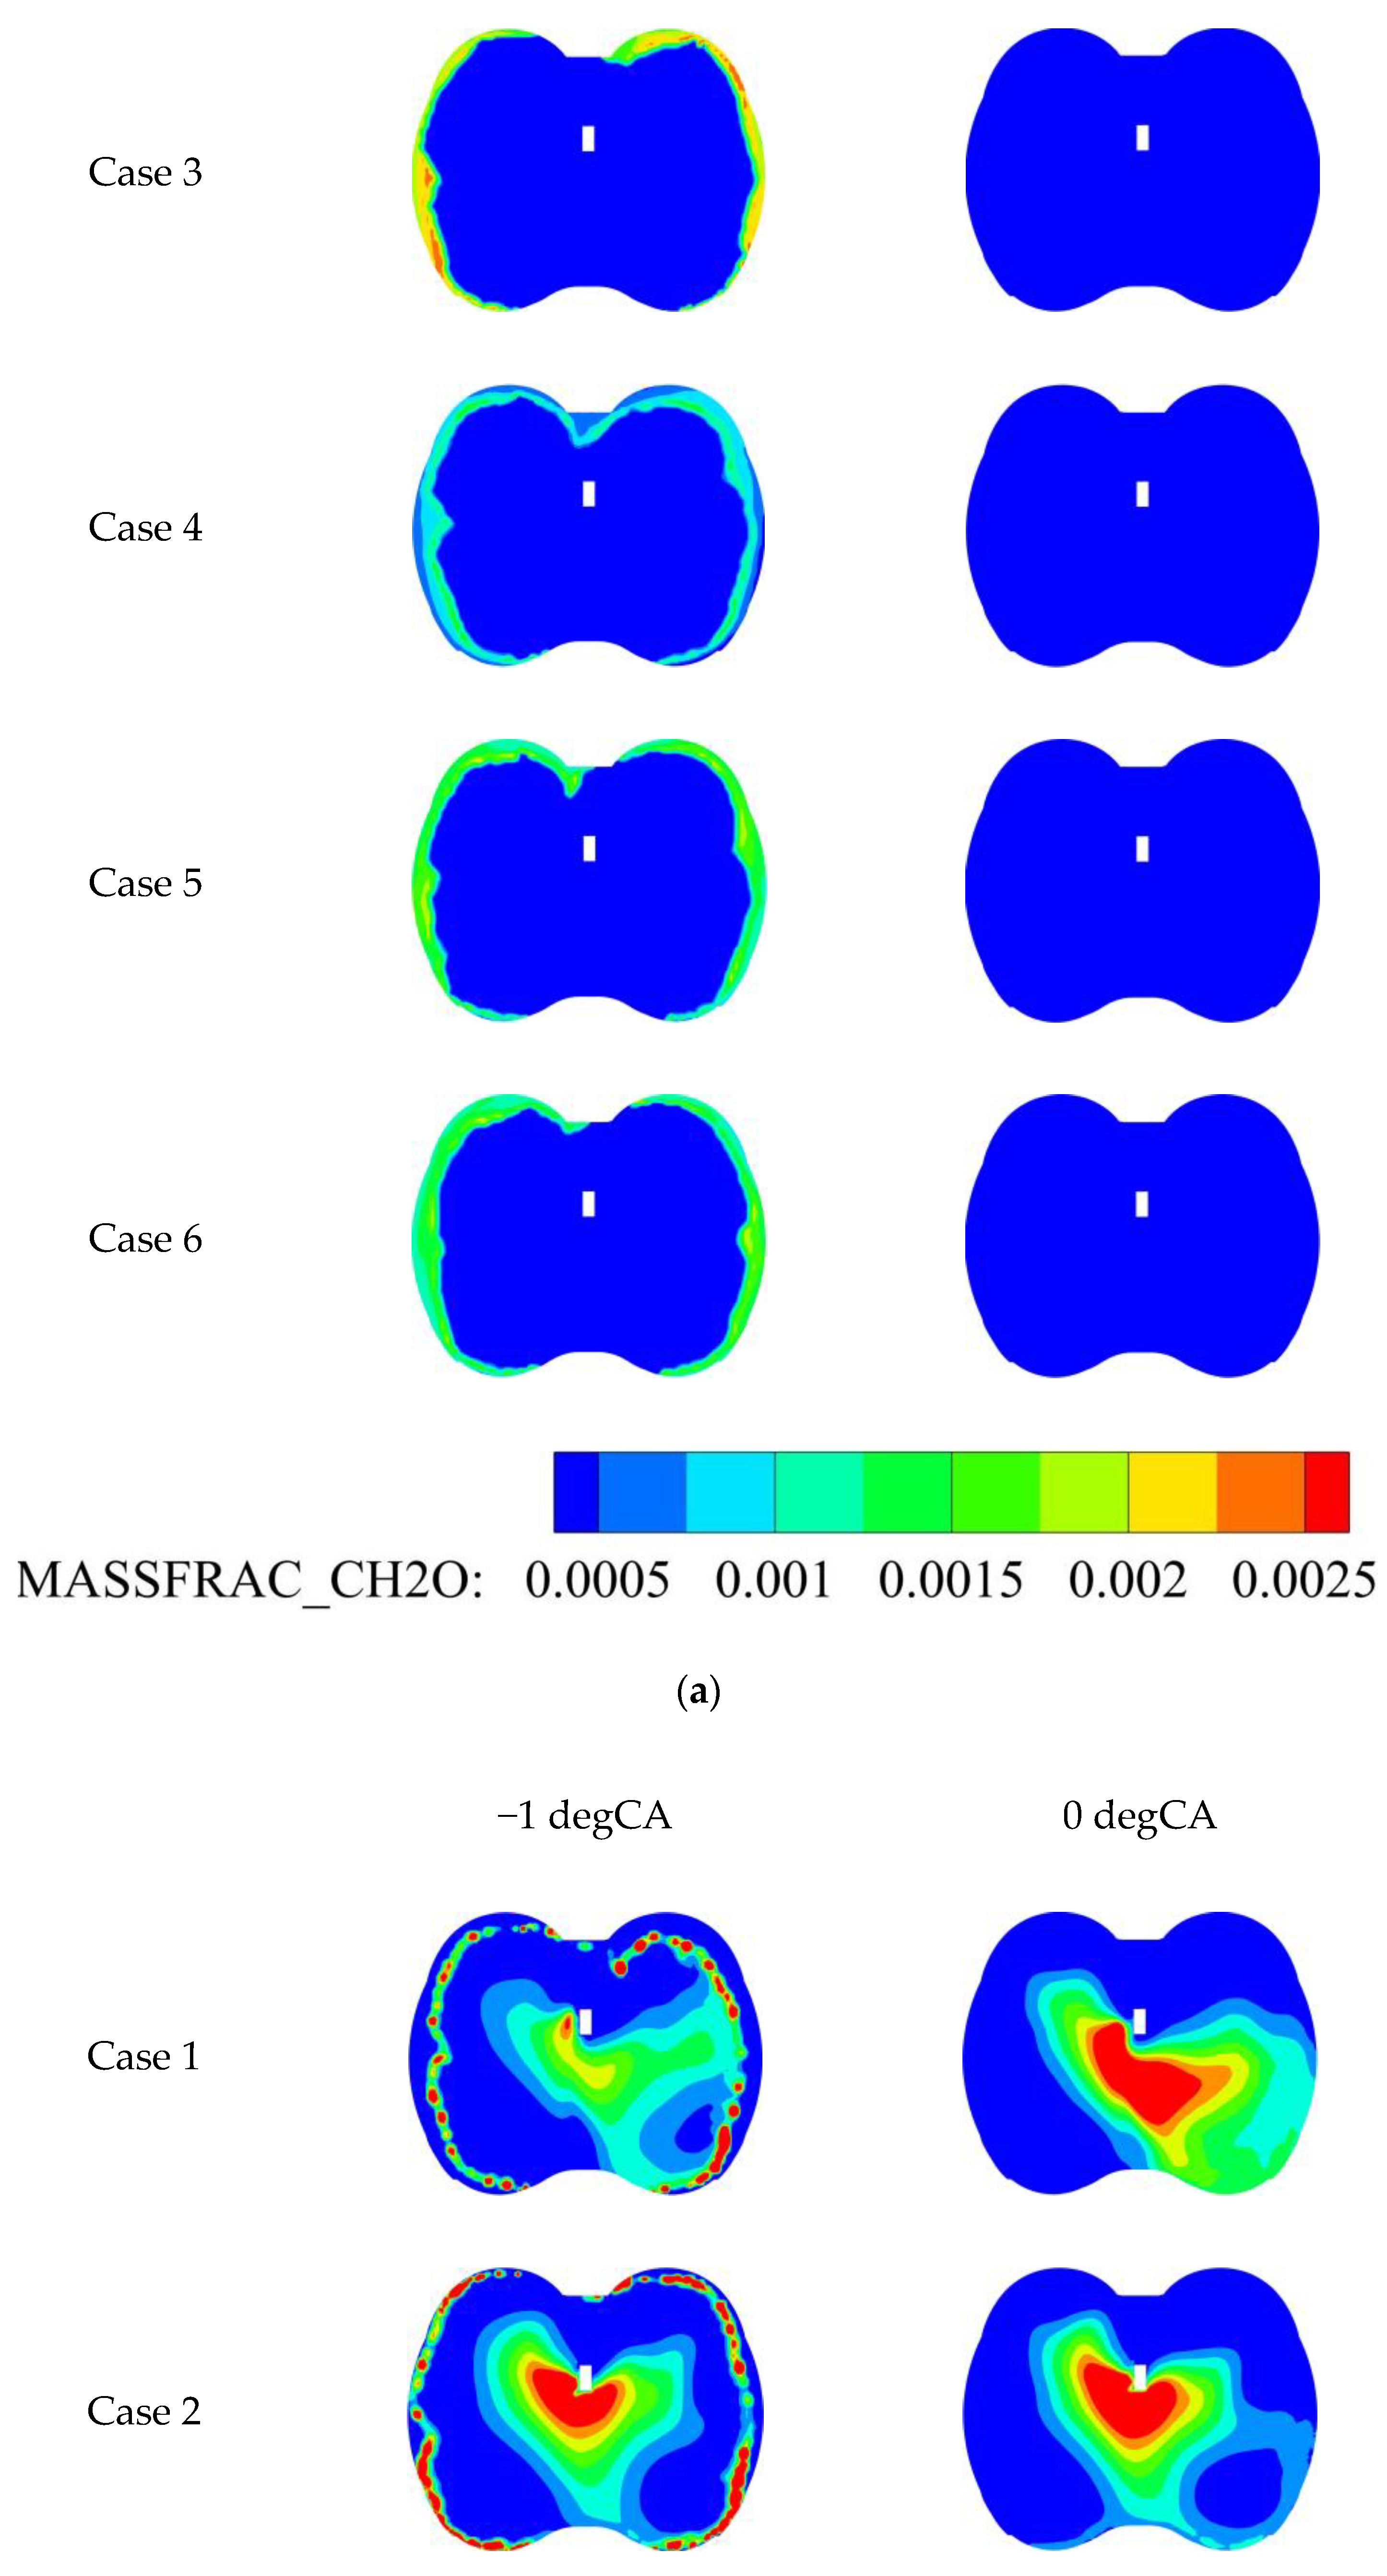
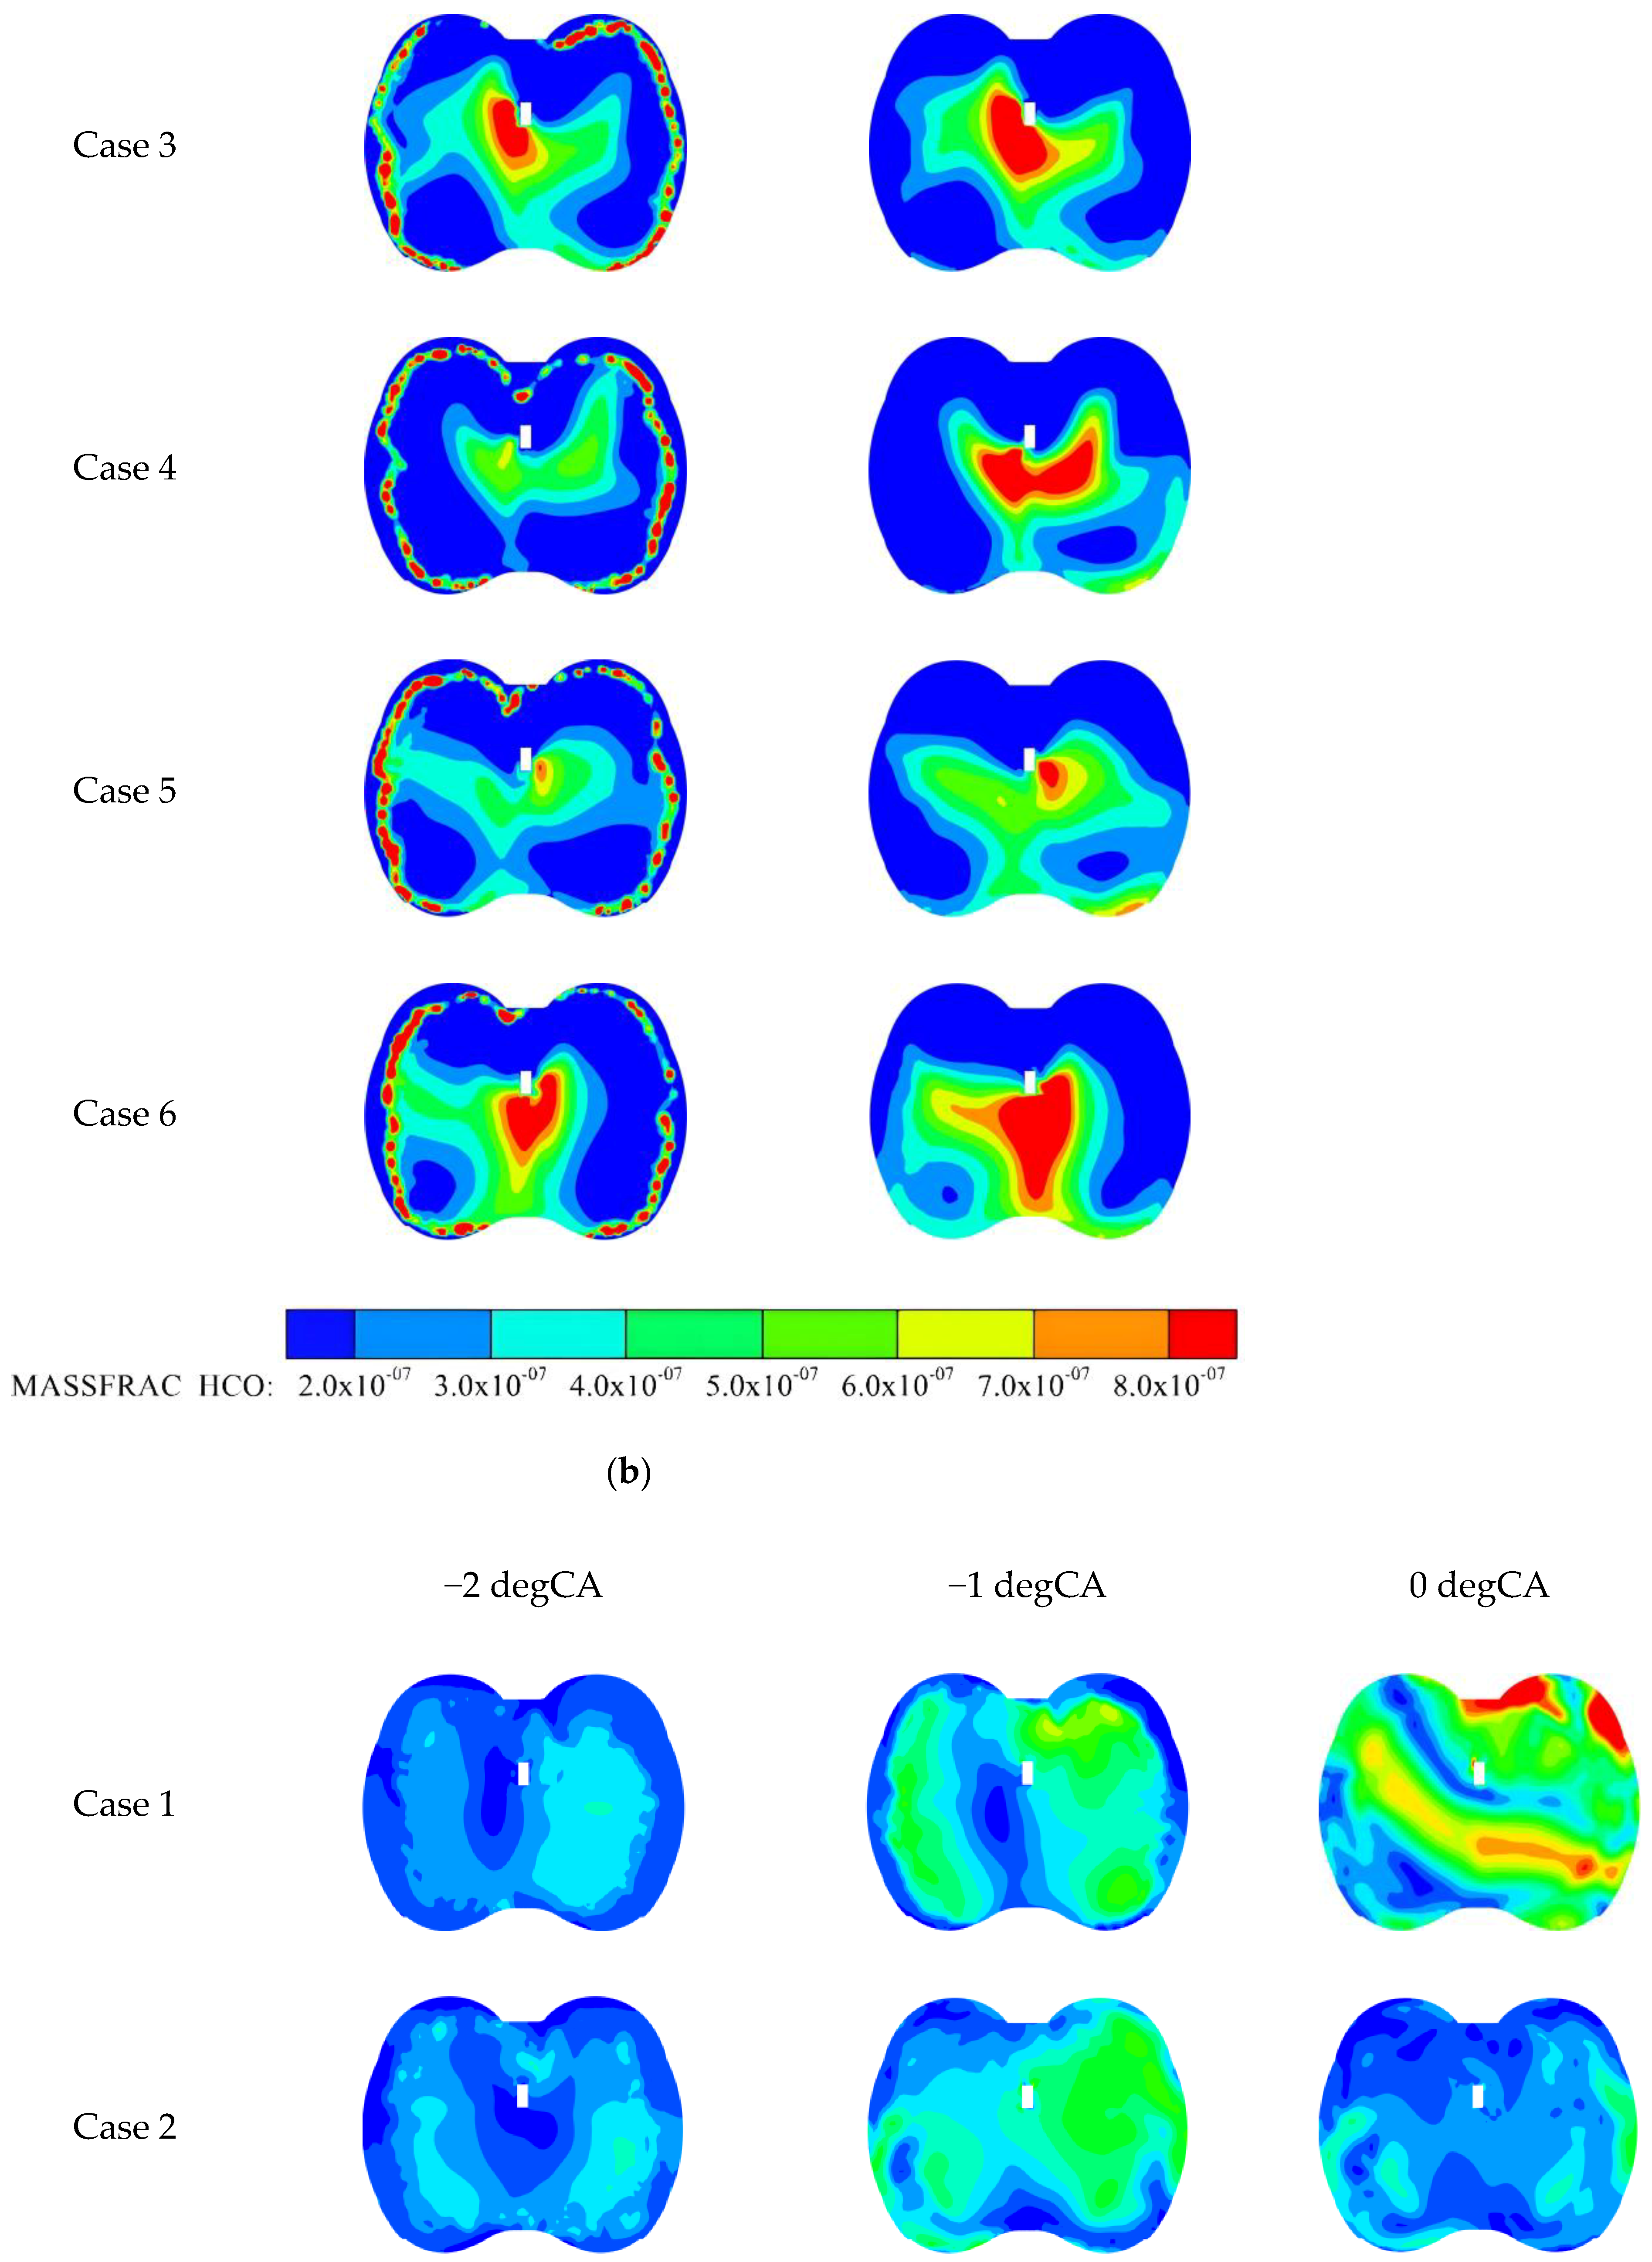
3.3. Different Water Injection Cases: Intermediate Combustion Products

Figure 16 shows the comparison of H2O2 and CH2O masses in the cylinder for the six water injection cases. It can be seen that the peak H2O2 and CH2O masses of cases 1, 3, 5 and 6 were higher compared to those of cases 2 and 4, indicating that a stronger low temperature reaction occurred. Strong low temperature reactions can make the high temperature reaction phase heat release more intense, which often triggers knock. As shown in Figure 17, the high peak masses of CH2O and H2O2 corresponded to the high peak instantaneous heat release.
Figure 18a verifies that the end mixture of case 2 had the weakest low temperature reaction of any end mixture because of the smallest distribution area of CH2O in this case compared to other cases. Although the CH2O of case 4 was widely distributed, its low mass fraction indicates that the low temperature reaction of its end mixture was also weak. In addition, the CH2O concentration under the intake valve was significantly smaller than under the exhaust valve in the six cases, which is related to equivalence ratio distribution.
The high concentration of HCO in the center of the cylinder indicates that the region has entered a high temperature reaction. If a high concentration of HCO is also present near the cylinder wall, it indicates that a knock may have occurred [38,40]. As shown in Figure 18b, case 6 had the largest area of high HCO concentration at 0 degCA, including distributing a high concentration of HCO near the cylinder wall, so its knock intensity was the largest. Cases 1 and 5 also had a large amount of HCO distribution near the cylinder wall, so their knock intensity was larger compared to that of cases 2 and 4.
Wang [41] found that local burned gas velocity in the cylinder will reach more than 100 m/s after the occurrence of a knock, while in a non-knock case it was generally only 30 to 50 m/s. According to the velocity magnitude distribution graph in Figure 18c, it can be seen that the local burned gas velocities in the cylinders of cases 1, 3, 5 and 6 near −1 degCA started to surge above 100 m/s, indicating that a knock occurred. In contrast, the burned gas velocity in the cylinders of cases 2 and 4 was maintained at about 60 m/s, and no abnormal combustion occurred.
In order to measure the magnitude of cycle work in different cases of water injection, the P-V diagram shown in Figure 19a was plotted in this paper, which was integrated to obtain the cycle work as shown in Figure 19b. From the graph, it can be seen that case 2 had the largest cycle work (1041 J), followed by case 4 (1036 J), and the smallest cycle work was that of case 6 (1024 J). This is related to knock intensity. A strong knock intensity leads to enhanced heat transfer between the cylinder walls and the mixture, and therefore heat transfer losses are enhanced.

3.4. Different Water Injection Cases: The Emissions Characteristics

NOX will be generated in a high-temperature oxygen-rich environment, while soot will be generated in a high-temperature oxygen-deficient environment. Therefore, NOX and soot emissions are difficult to reduce at the same time. From Figure 20a,b, it can be seen that PWI (except for in case 6) made NOX emissions higher and soot emissions lower compared to the no water cases. This is because PWI makes the amount of oxygen entering the cylinder increase, as shown in Figure 11.
UHC is the product of incomplete combustion, and its formation factors are flame quenching, oil film and crevice effect [26]. Figure 20c shows that the UHC values were relatively low for all cases except case 6. In addition, CO emissions were highly similar to UHC emissions because CO is also a product of incomplete combustion. For CO emissions, the PWI cases (except for in case 6) had reduced CO emissions compared to the no water cases due to the increased amount of oxygen in the cylinder. Case 6 showed a different emission pattern compared to the other PWI cases because its oil film mass was too large, as shown in Figure 21, resulting in a portion of the fuel not participating in combustion at the beginning of the expansion stroke but coming off the cylinder wall and into the center of the cylinder later in the expansion. A complete combustion is not possible at this time due to the low cylinder temperature.
In conclusion, the emission characteristics of cases 2 and 4 were better because their soot, UHC and CO emissions were lower compared to that of the no water cases, despite the increase in NOX emissions.

4. Conclusions

This paper focused on the suppression effect of different PWI installation cases on the knock of GDI engines. Six different cases of water injection were designed, including three vertical distances from the cylinder center to the water injector (0.07, 0.1 and 0.13 m) and two different injection directions (60 and 90°). The main findings are as follows:
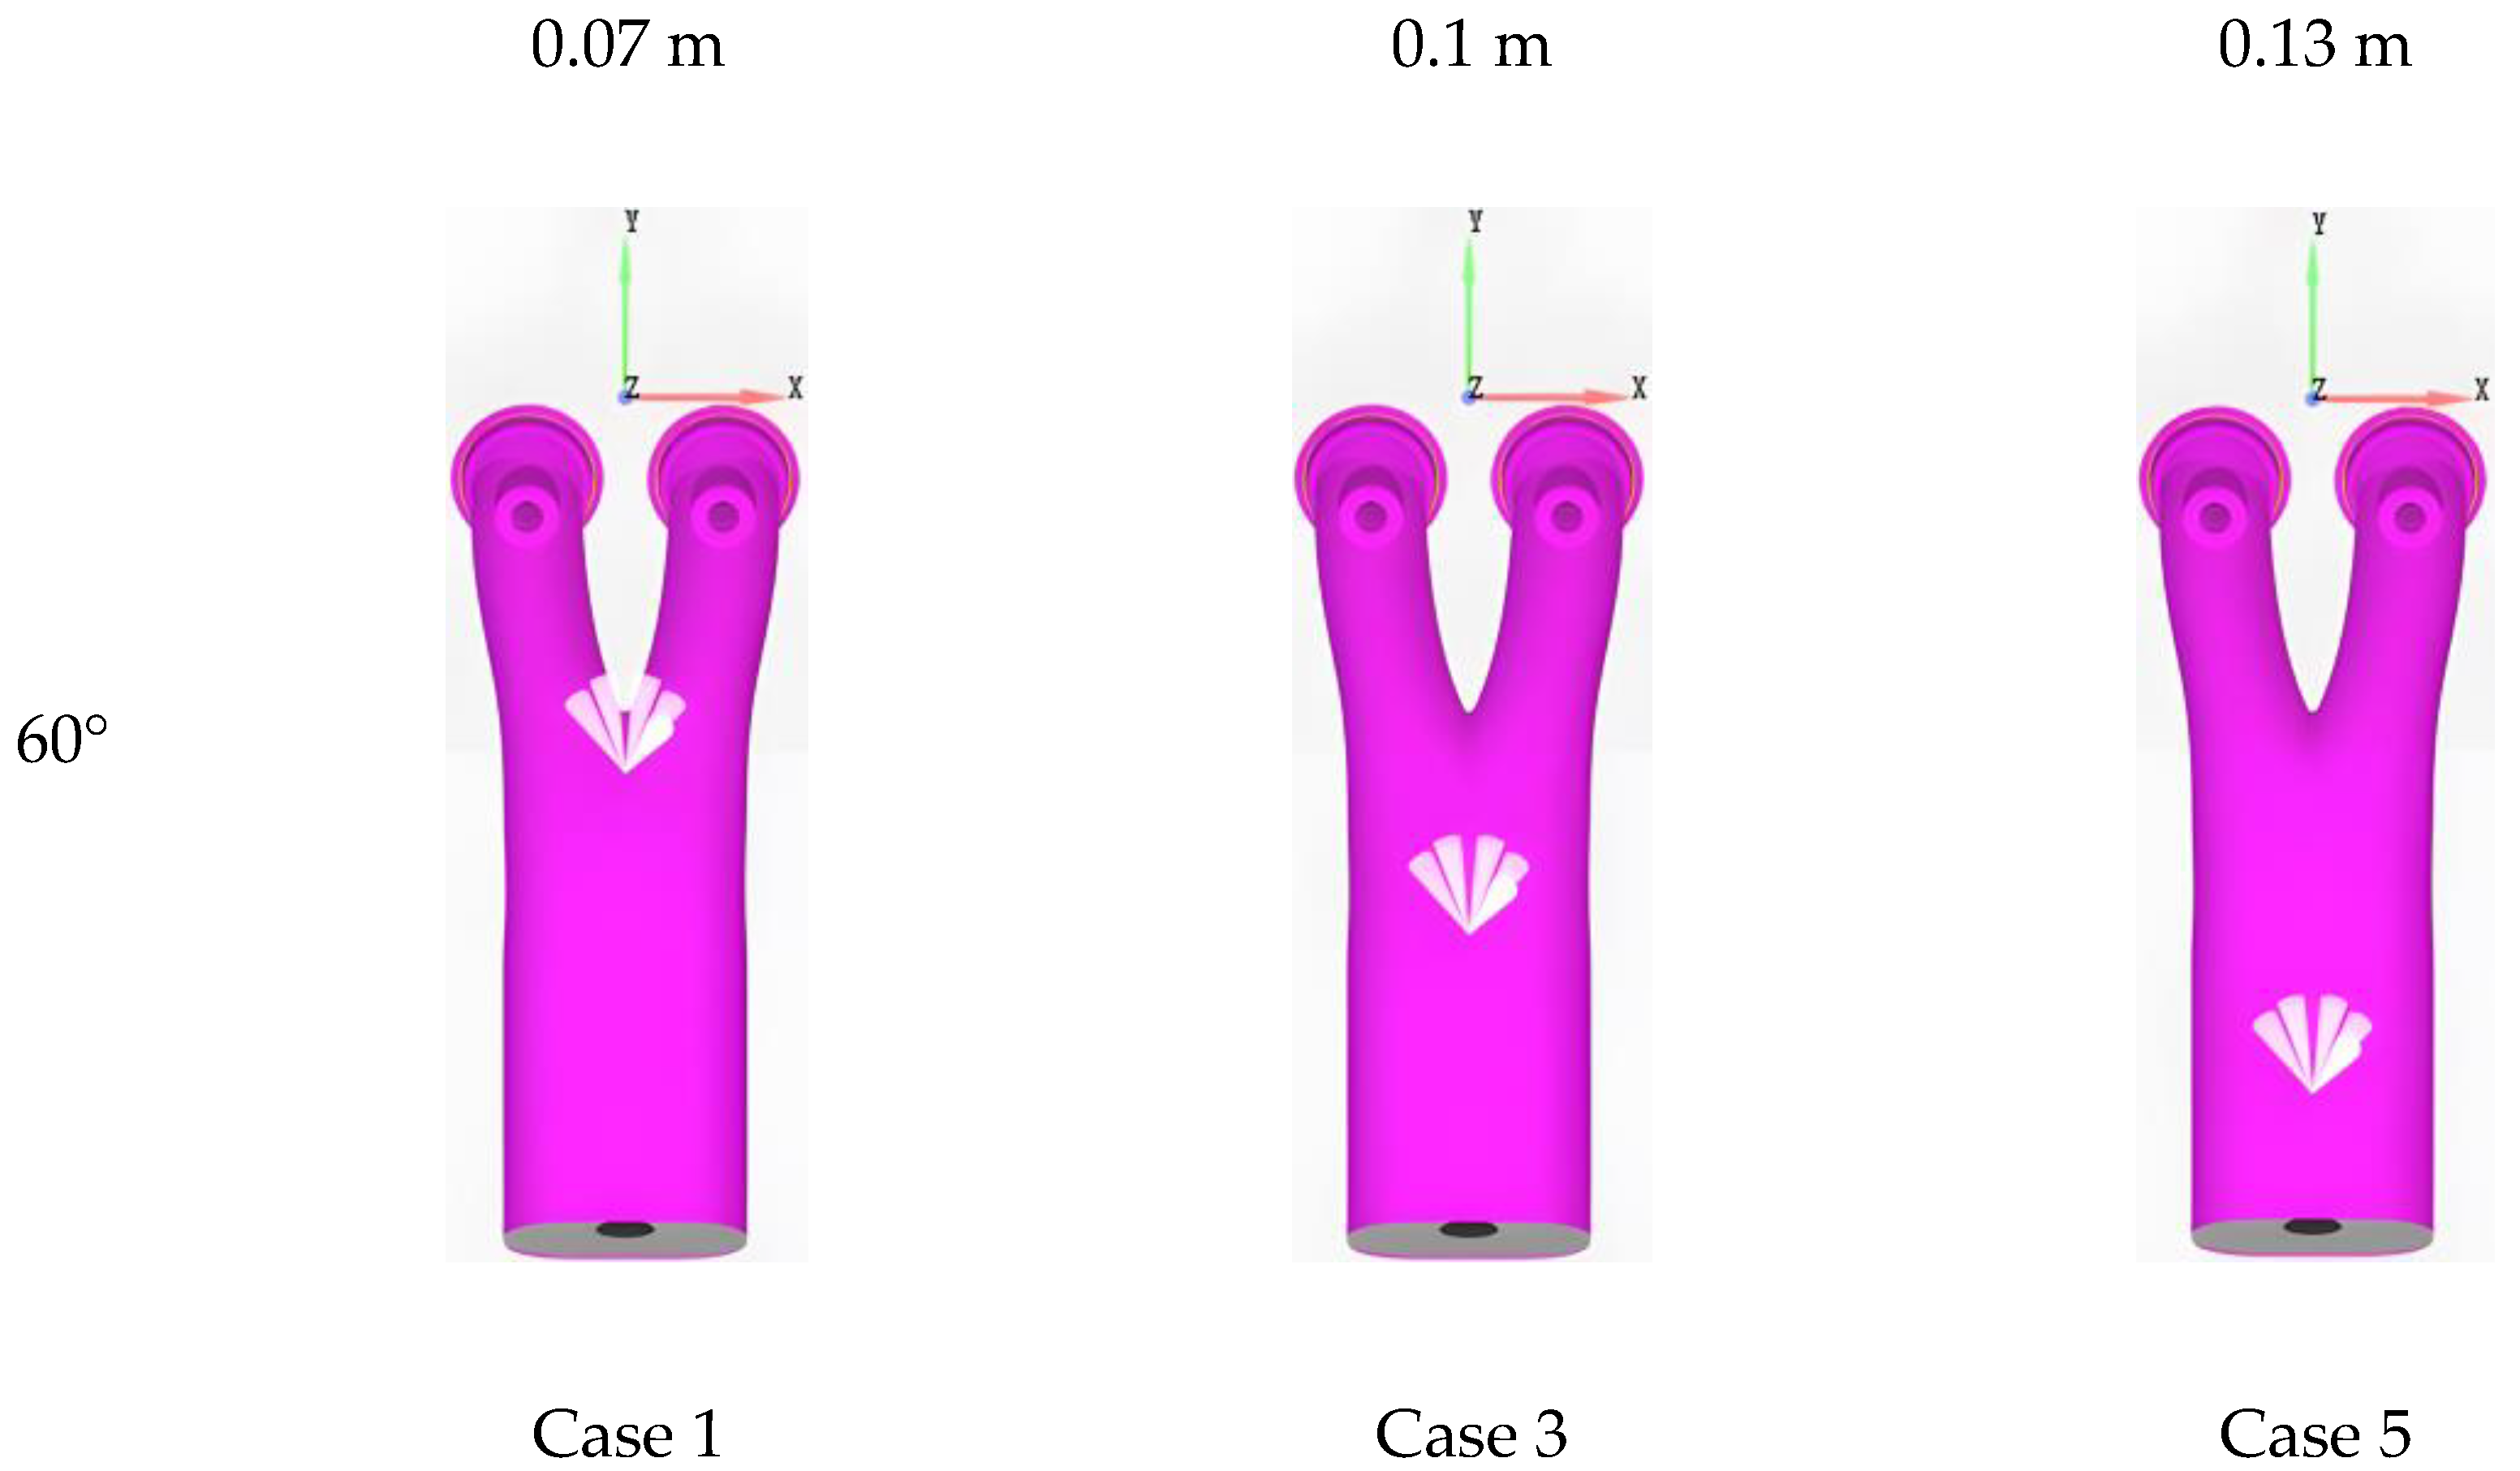
  • Different vertical distances and injection directions affect the distribution of water in the intake port and in the cylinder. The 90° injection direction is more reasonable than the 60°, because the water in the 90° injection direction case has less impact on the intake port wall. Cases 2 and 4 had ideal injection positions, as these two cases allowed as much water as possible to enter the cylinder for evaporation, which is favorable to knock inhibition.
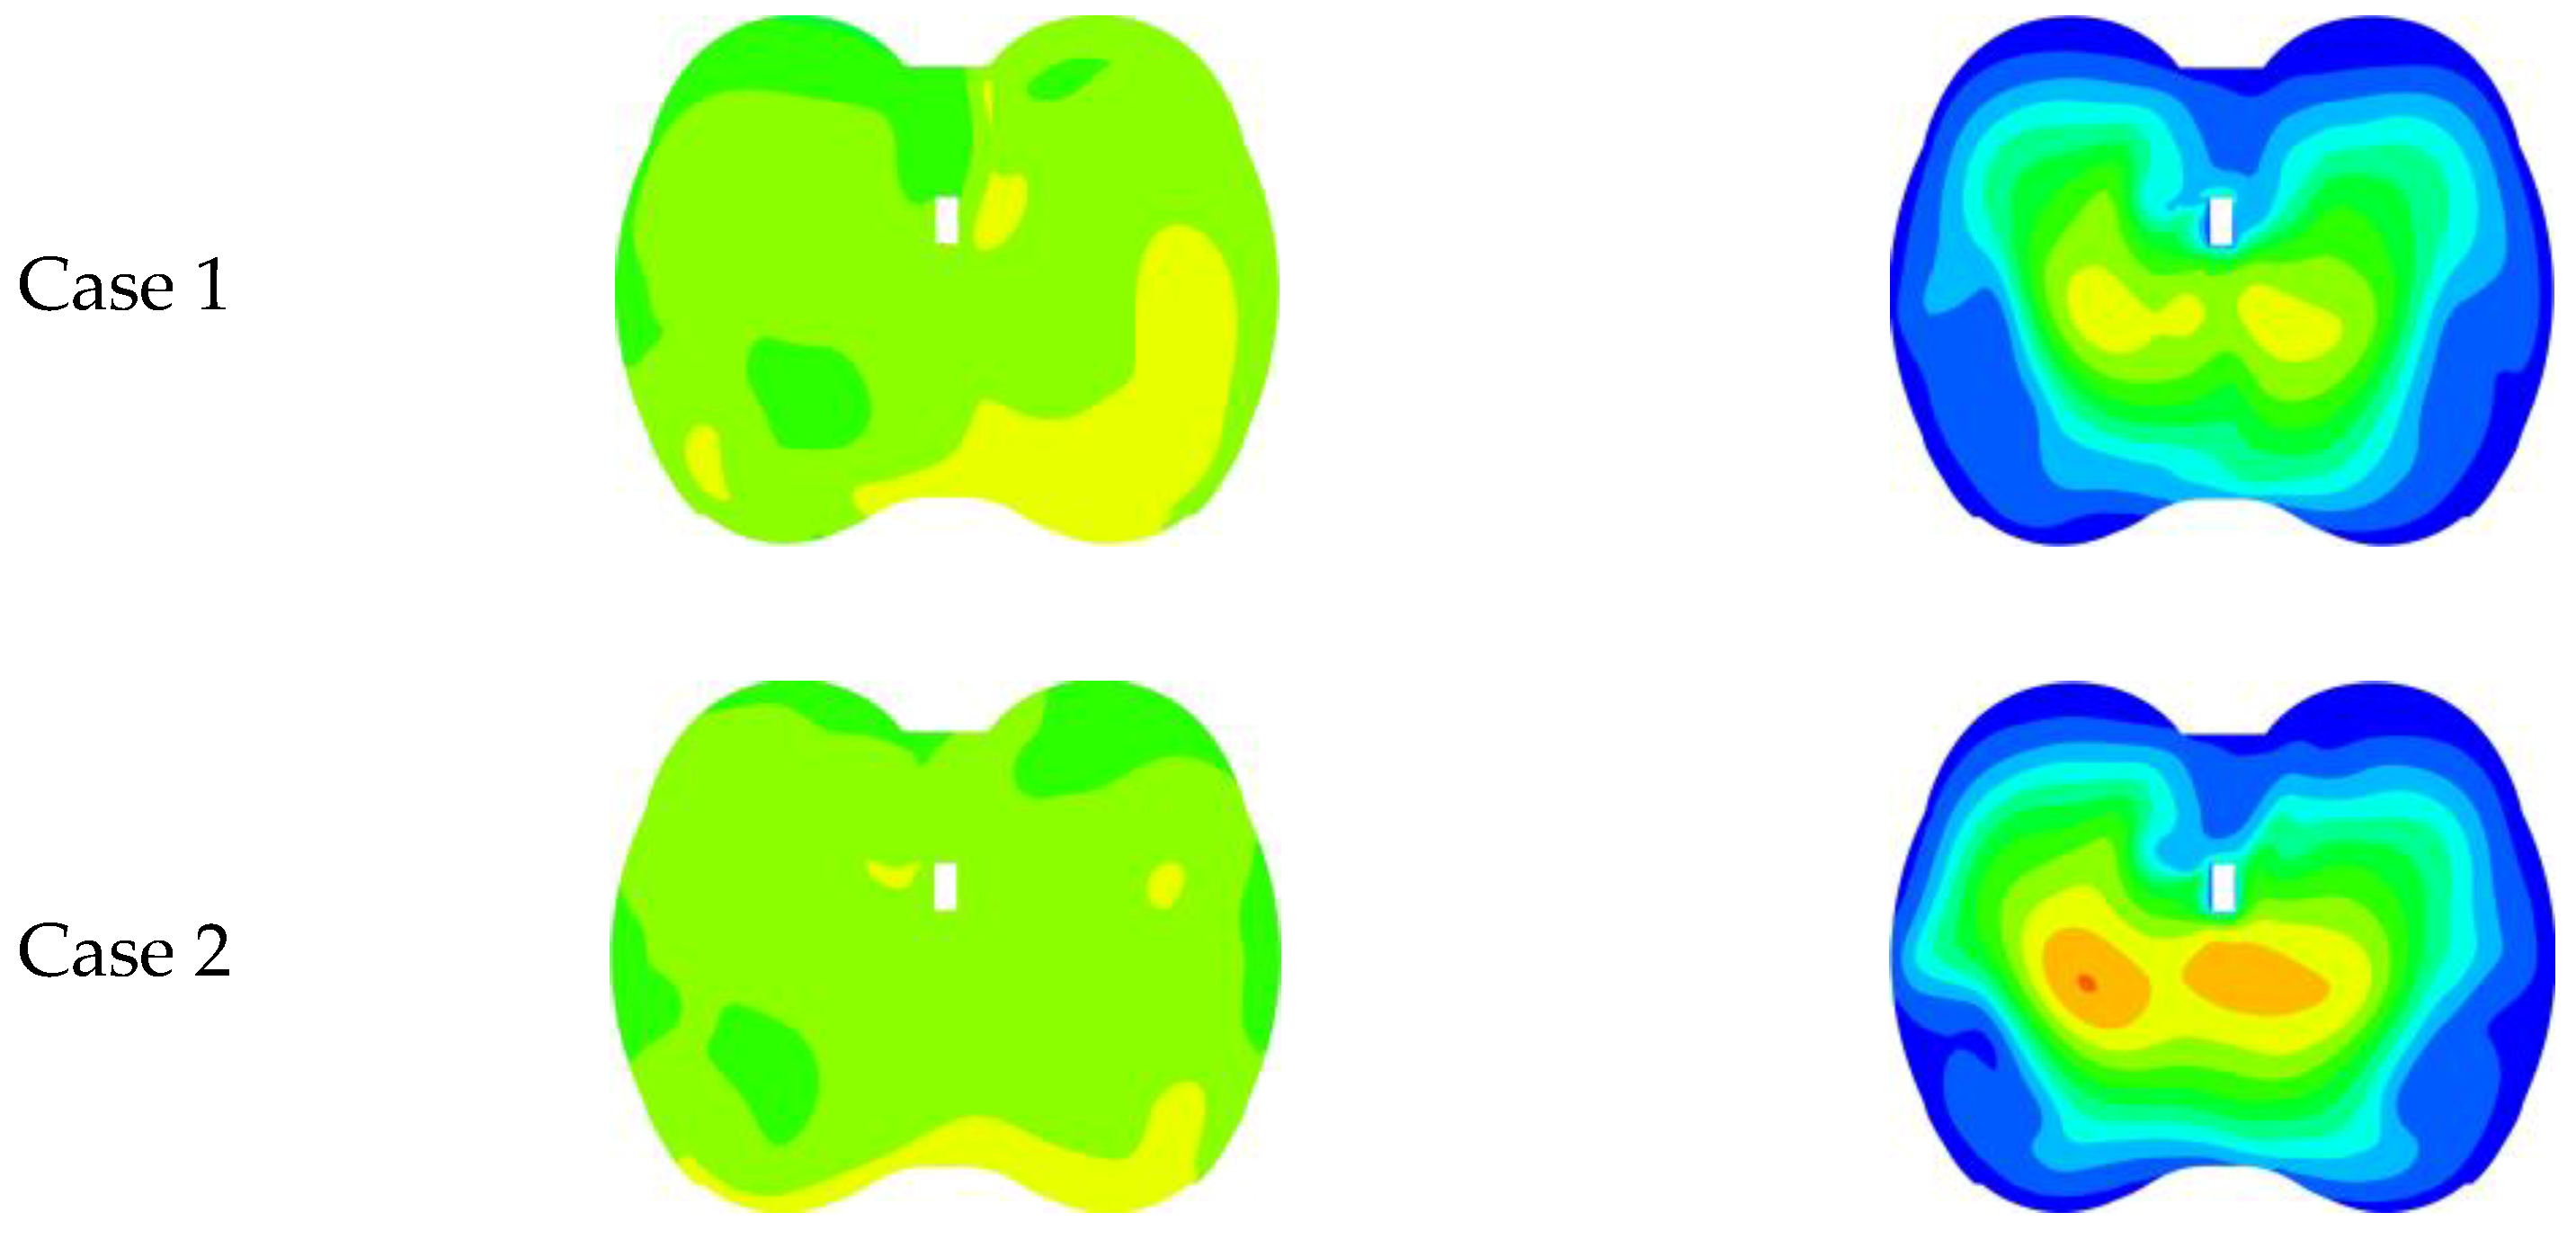
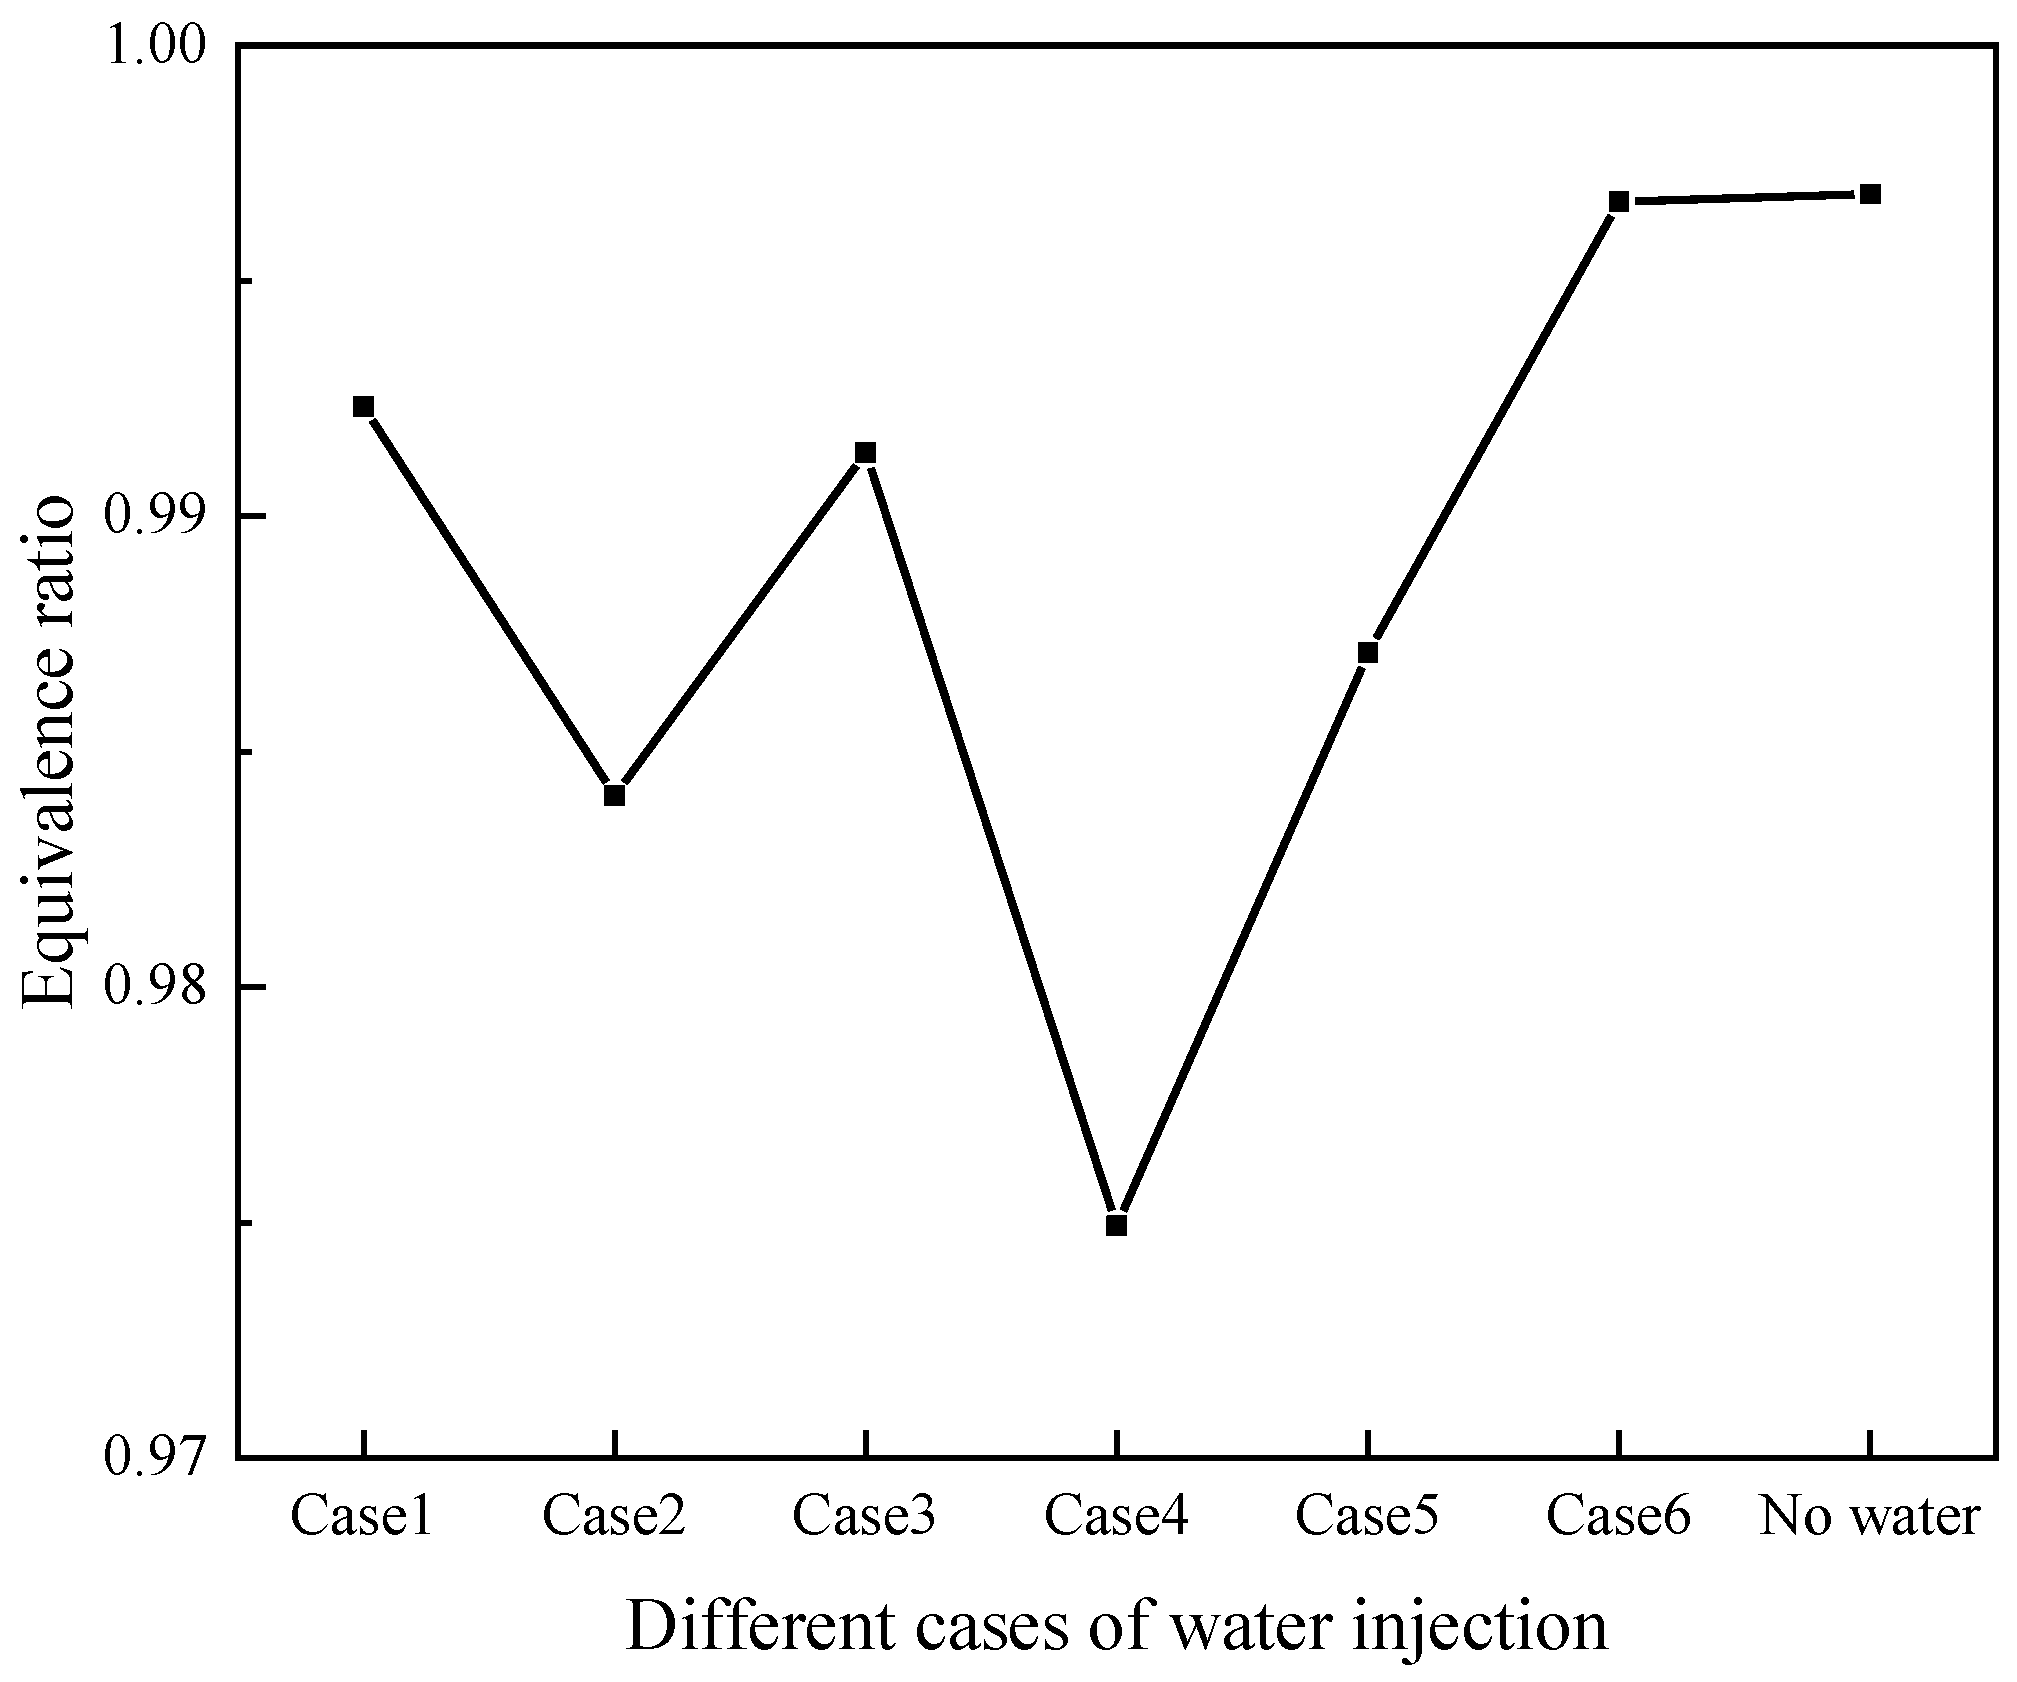
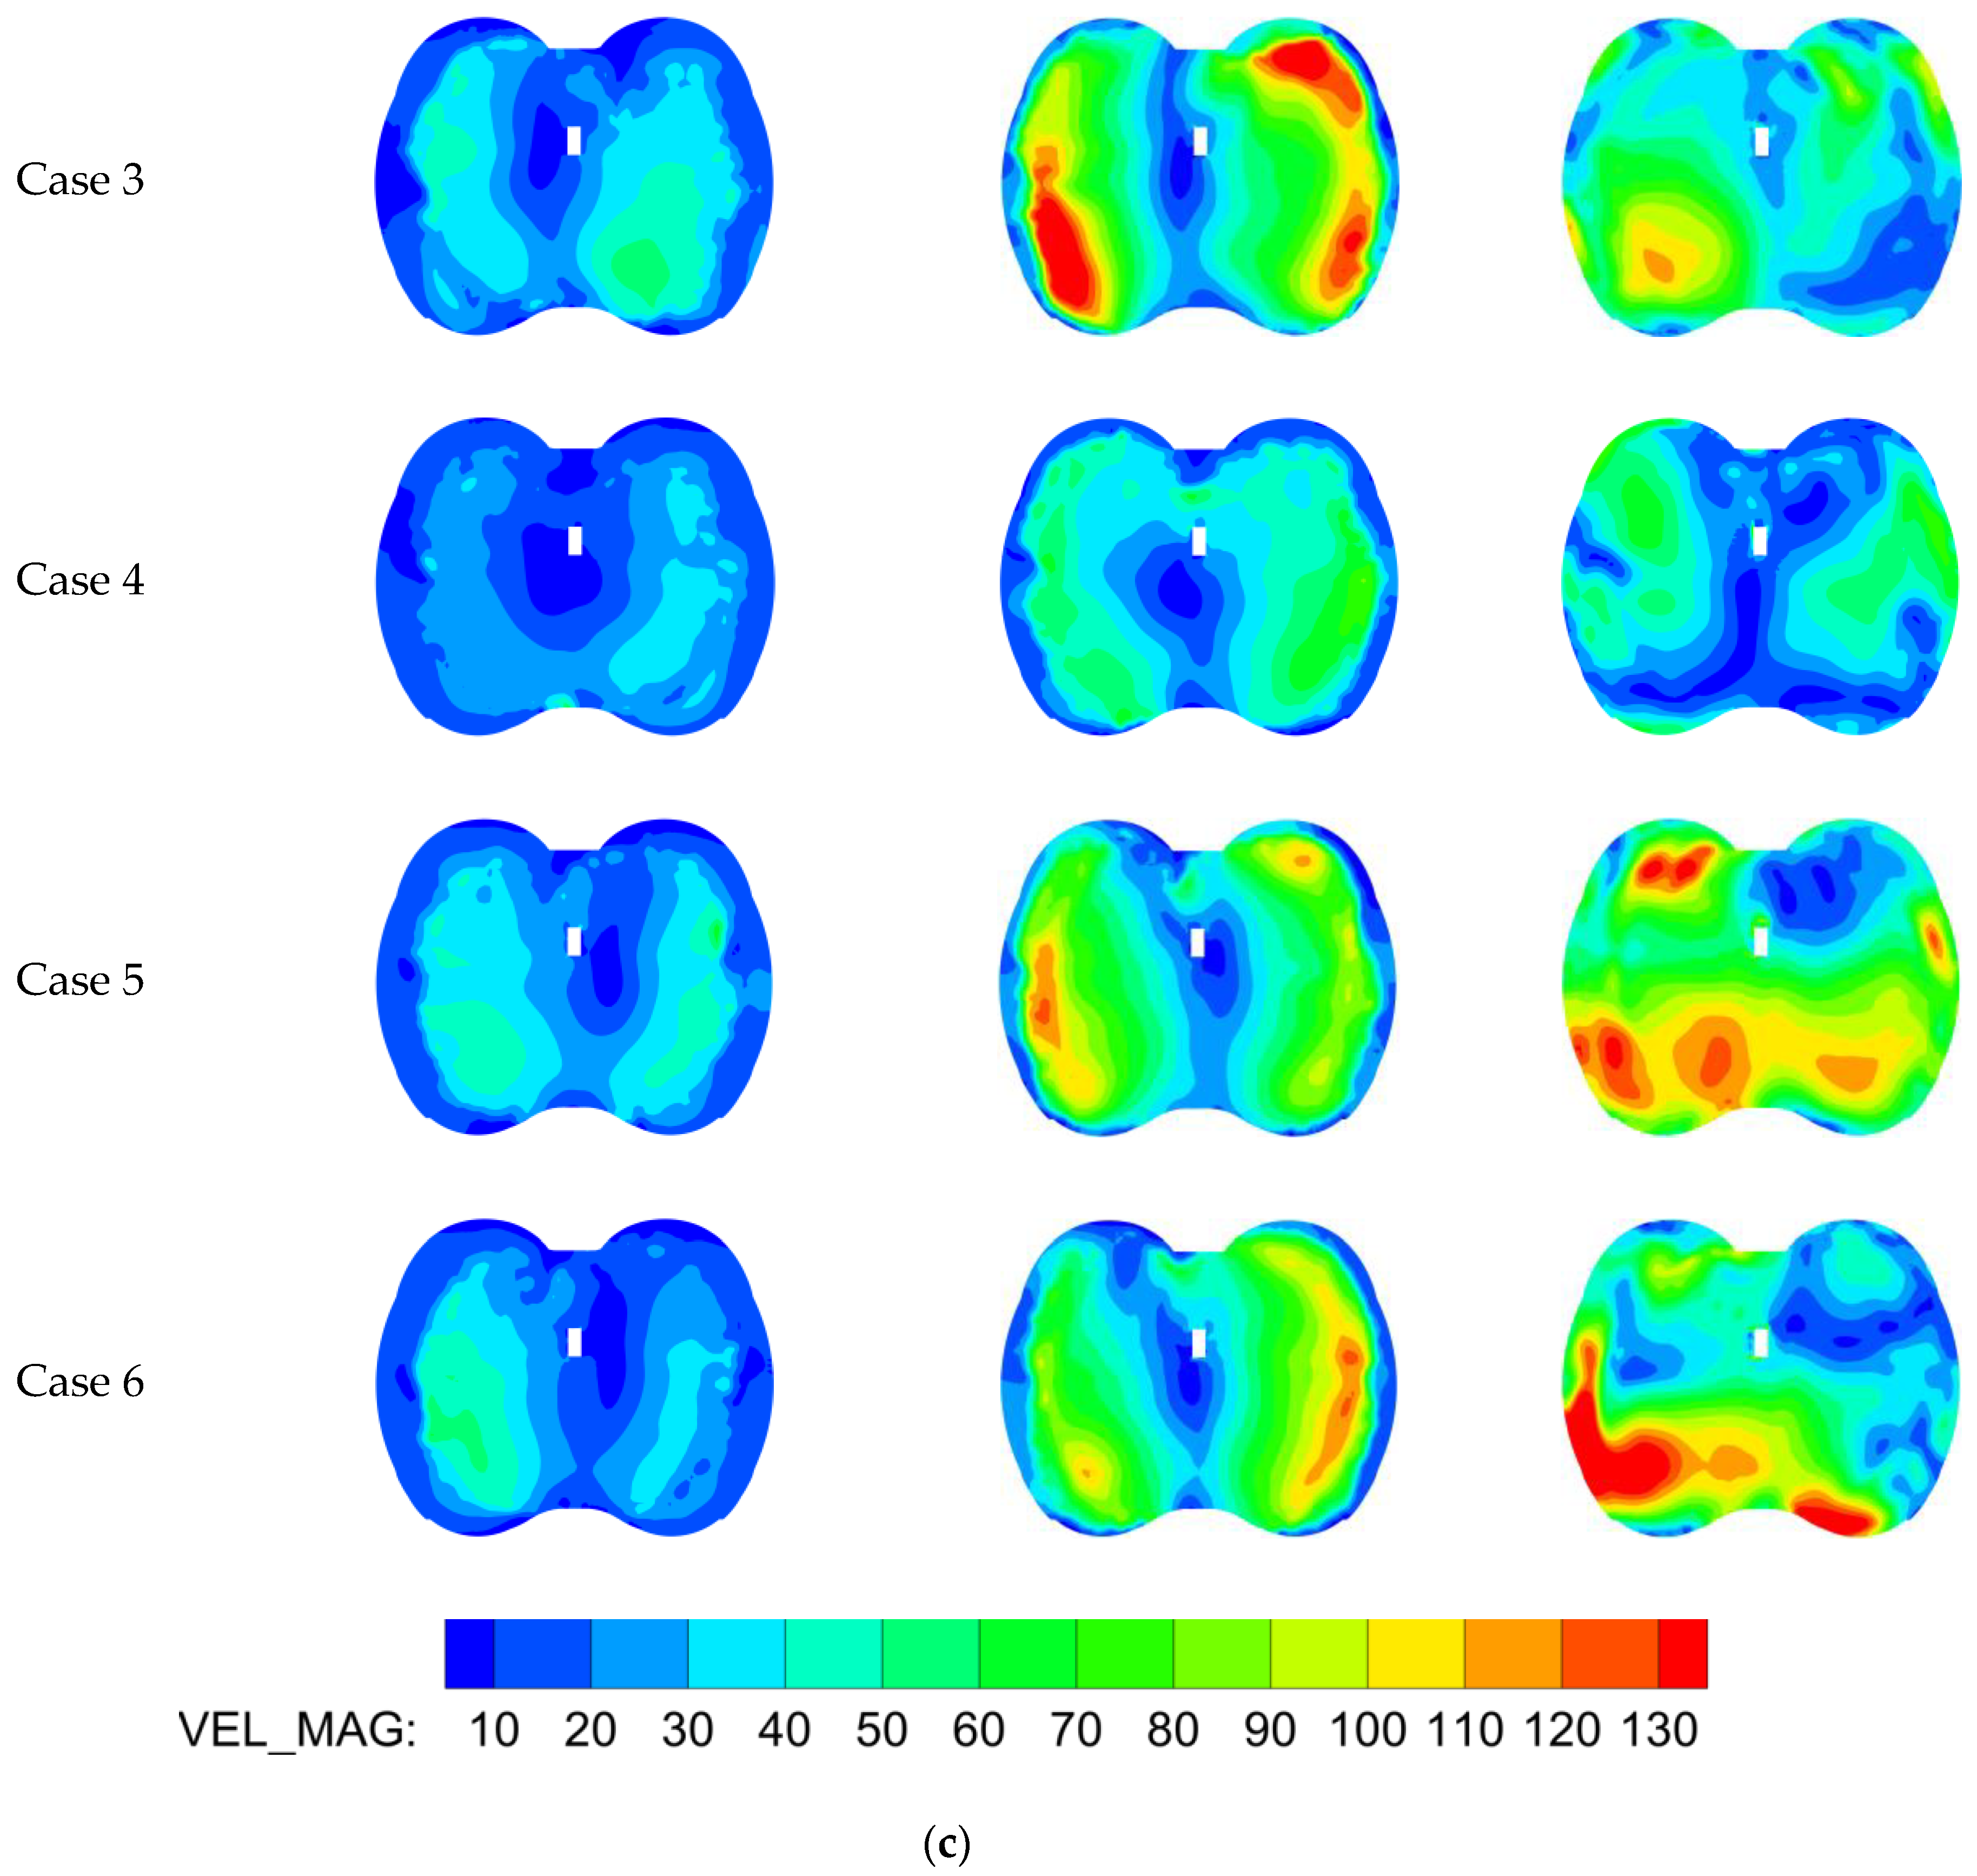
  • The PWI technology allowed for increased air density at the intake port and therefore a lower in-cylinder equivalence ratio compared to the no water cases. In addition, in the six cases, the equivalence ratio under the intake valve was greater than that under the exhaust valve, and the TKE in the center of the cylinder was greater than that around the cylinder wall. The center of the cylinder of case 2 showed the largest TKE due to differences in the flow of the mixture caused by differences in injector installation, which facilitates the propagation of the flame to the cylinder wall and reduces the tendency to knock.
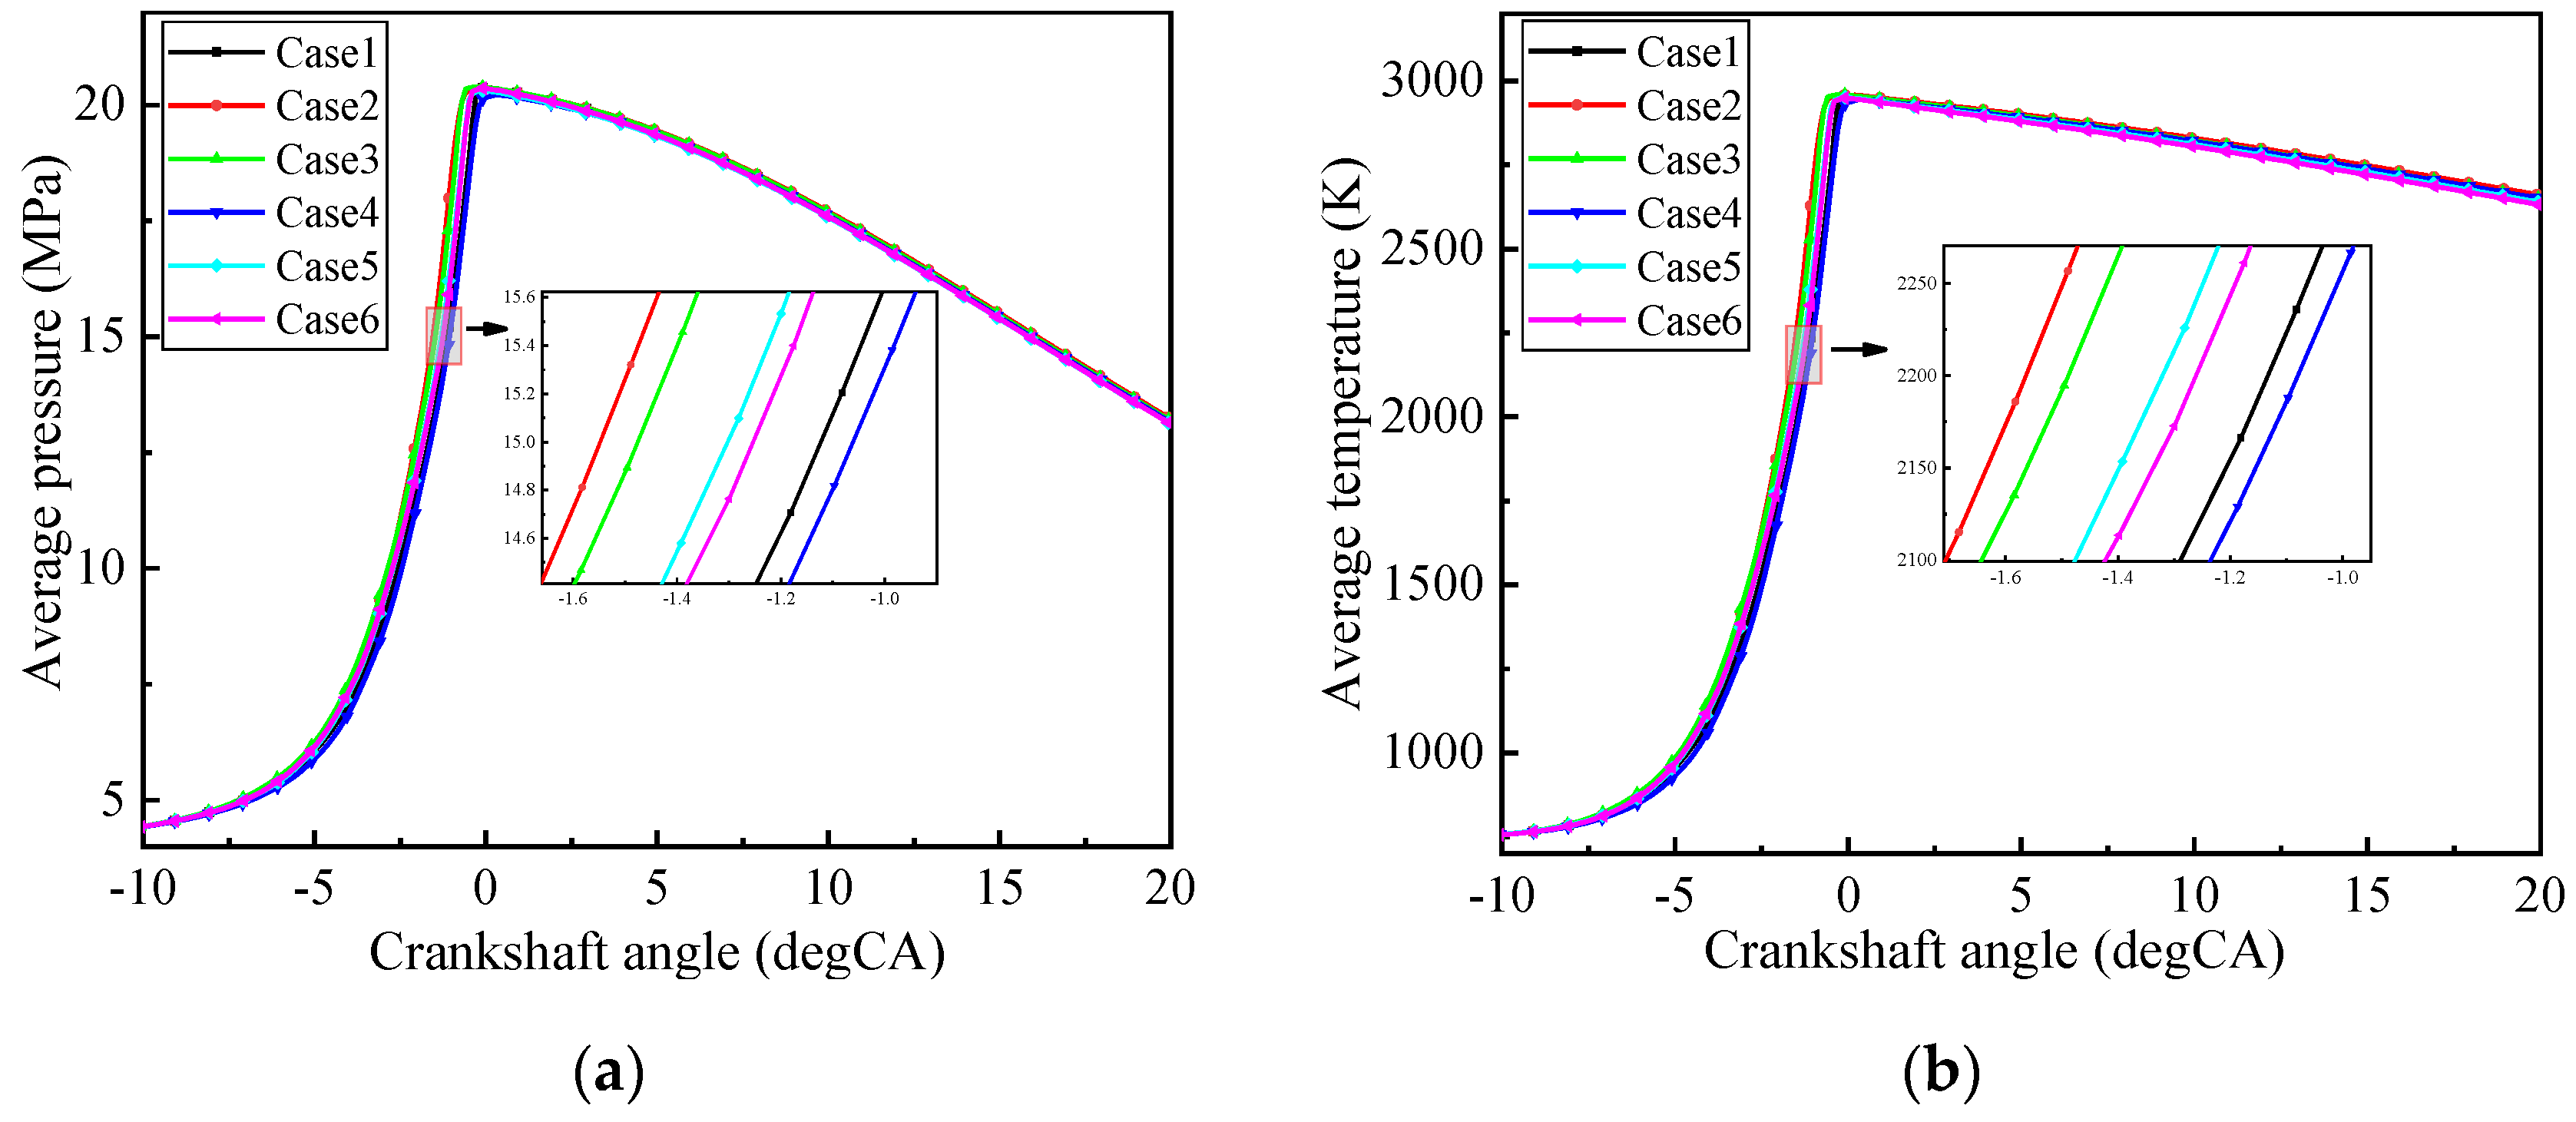
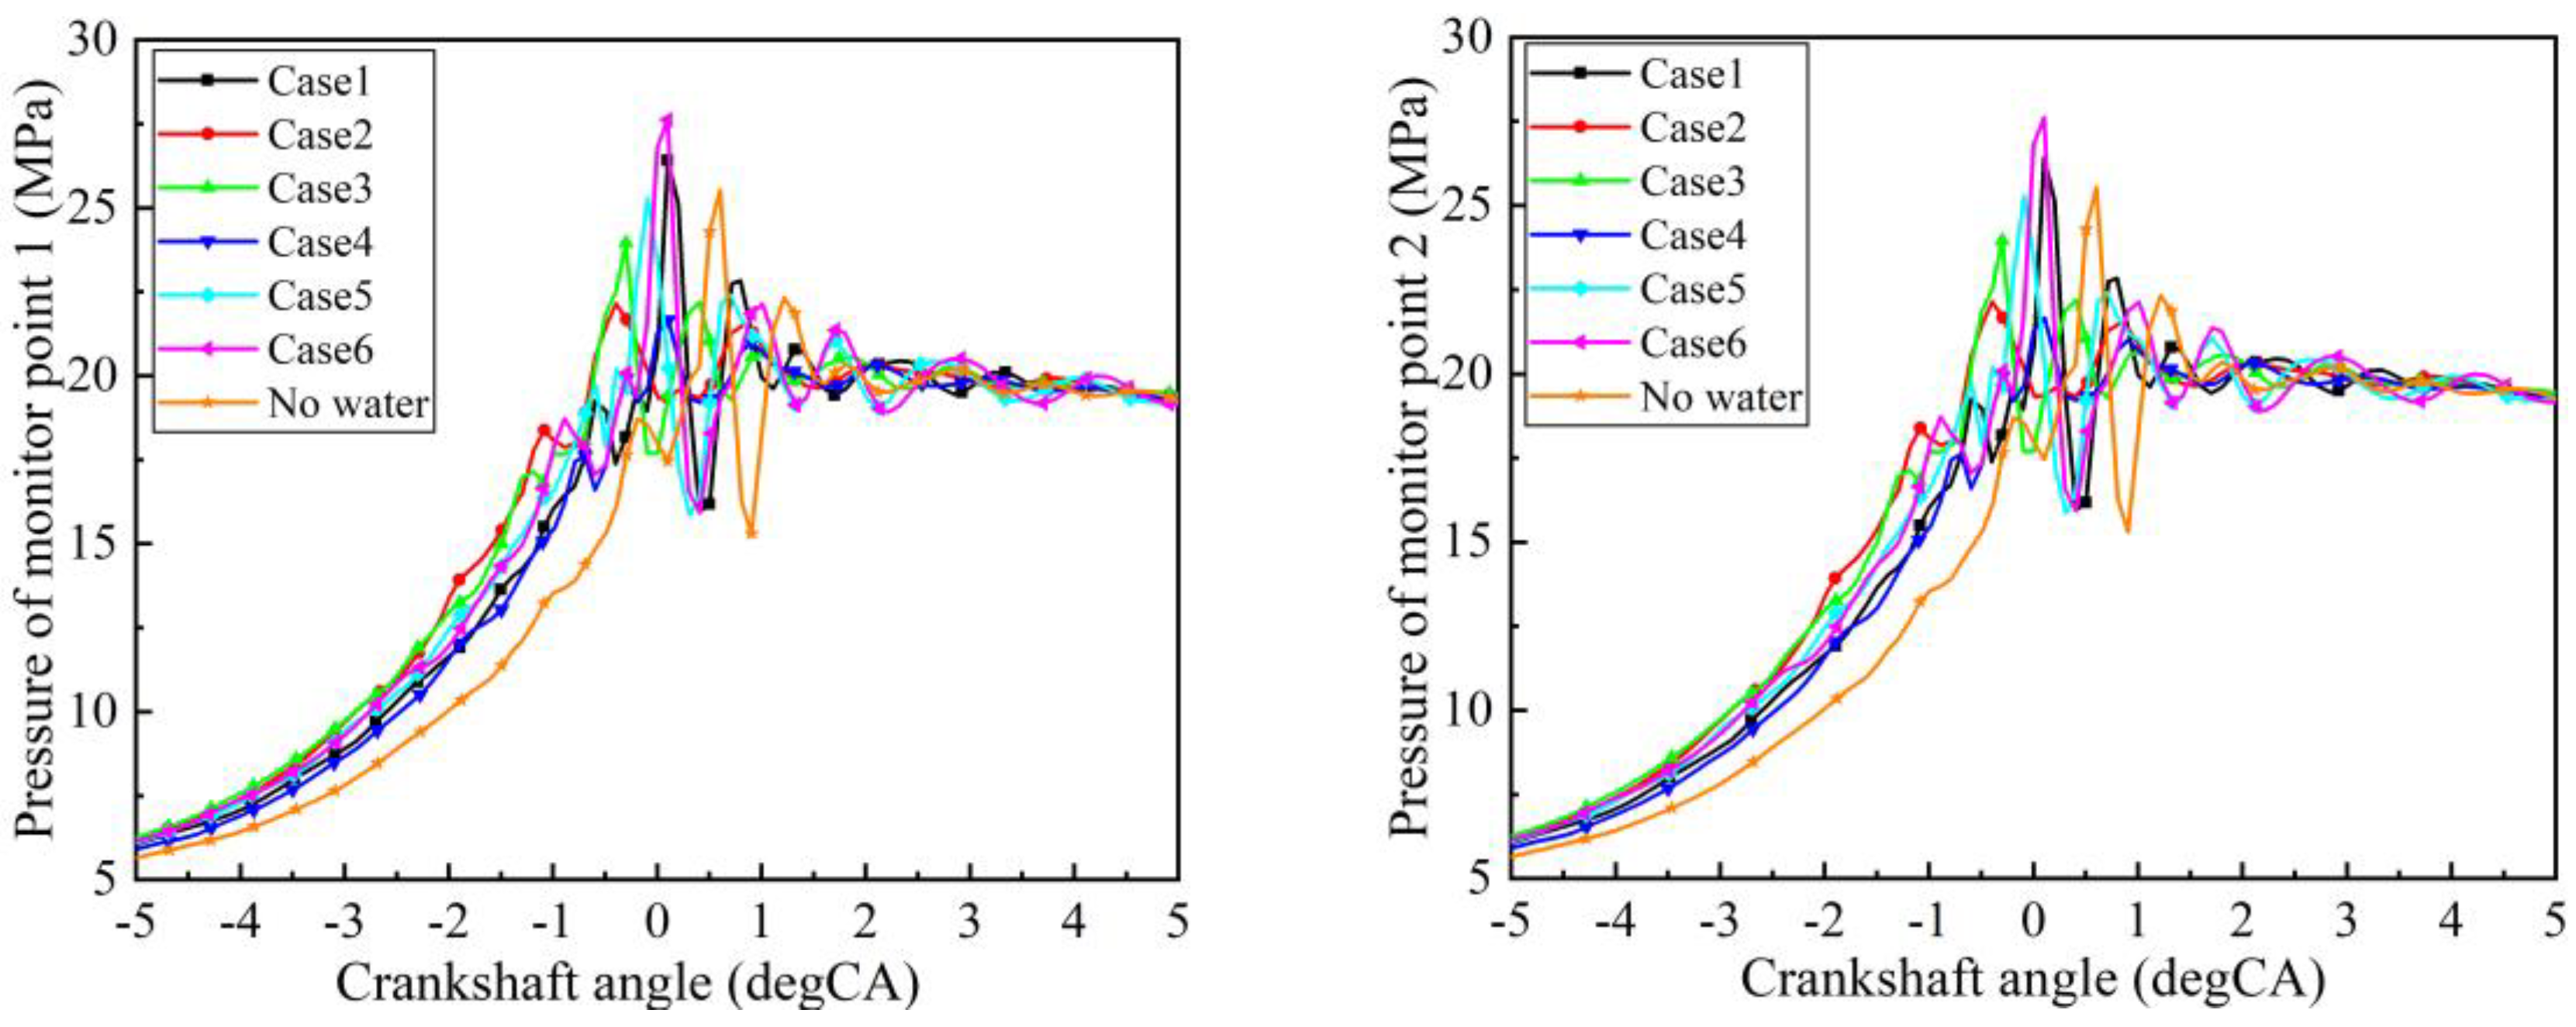
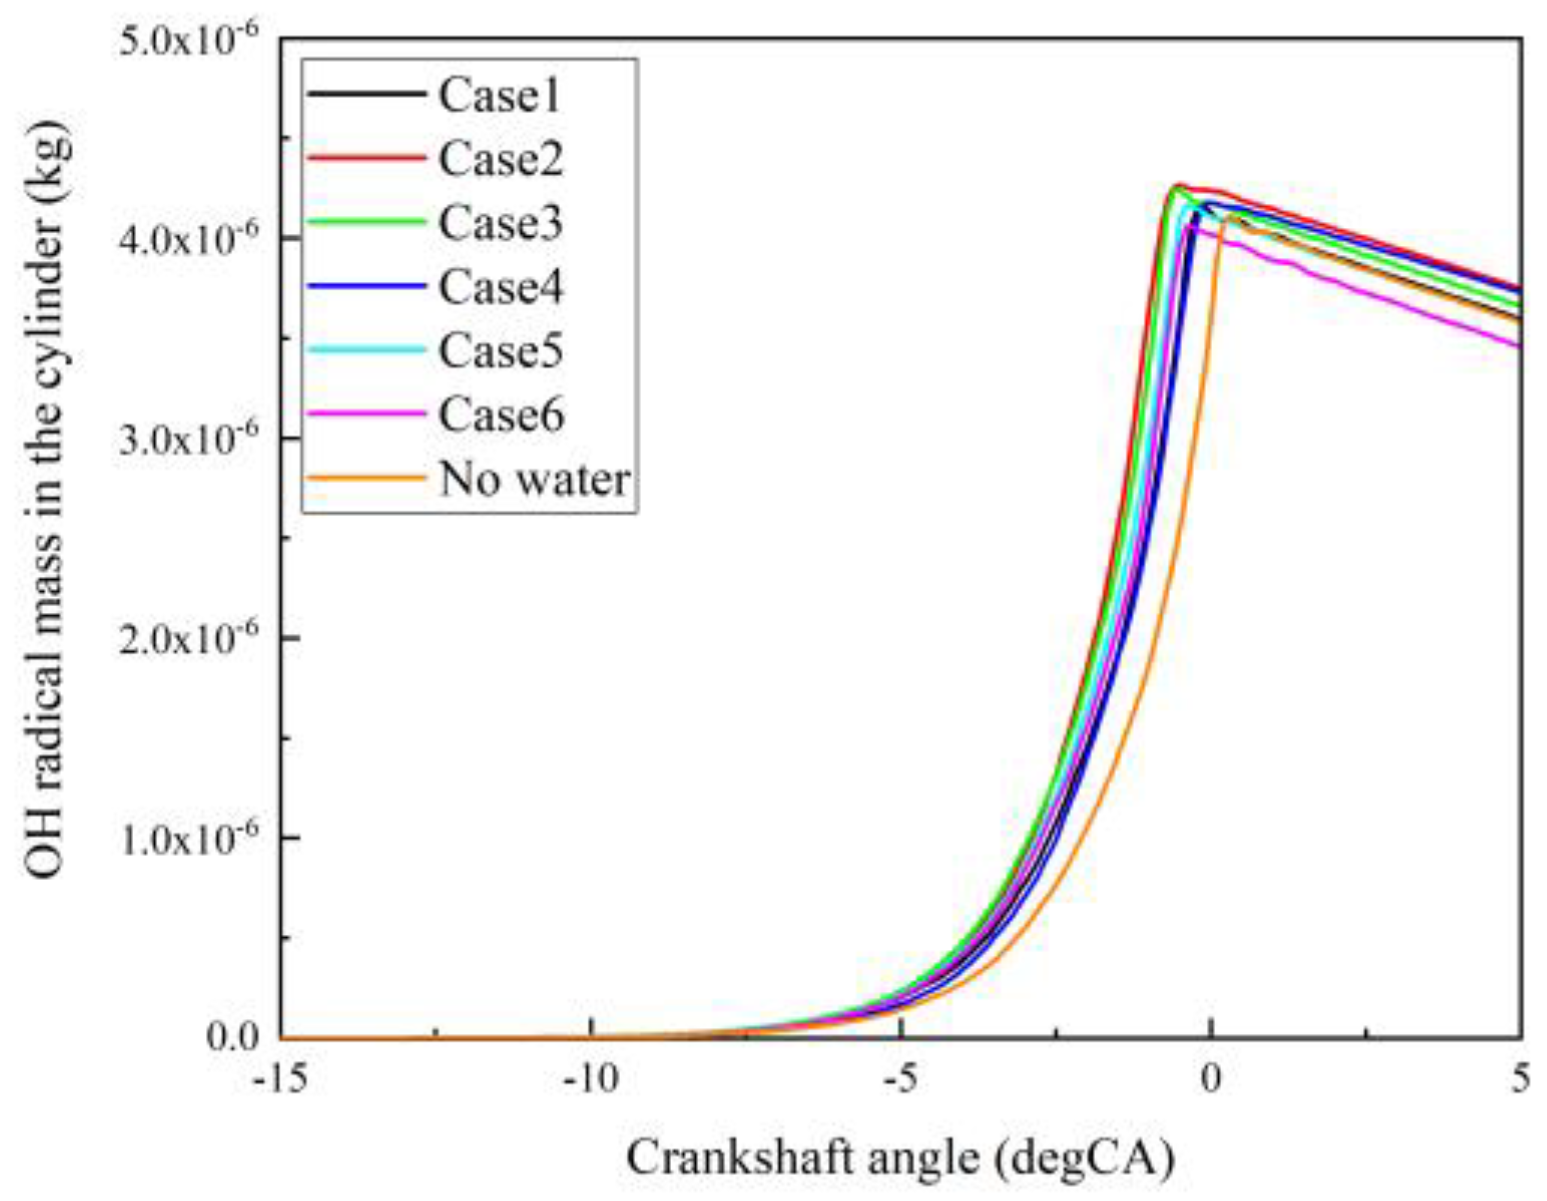
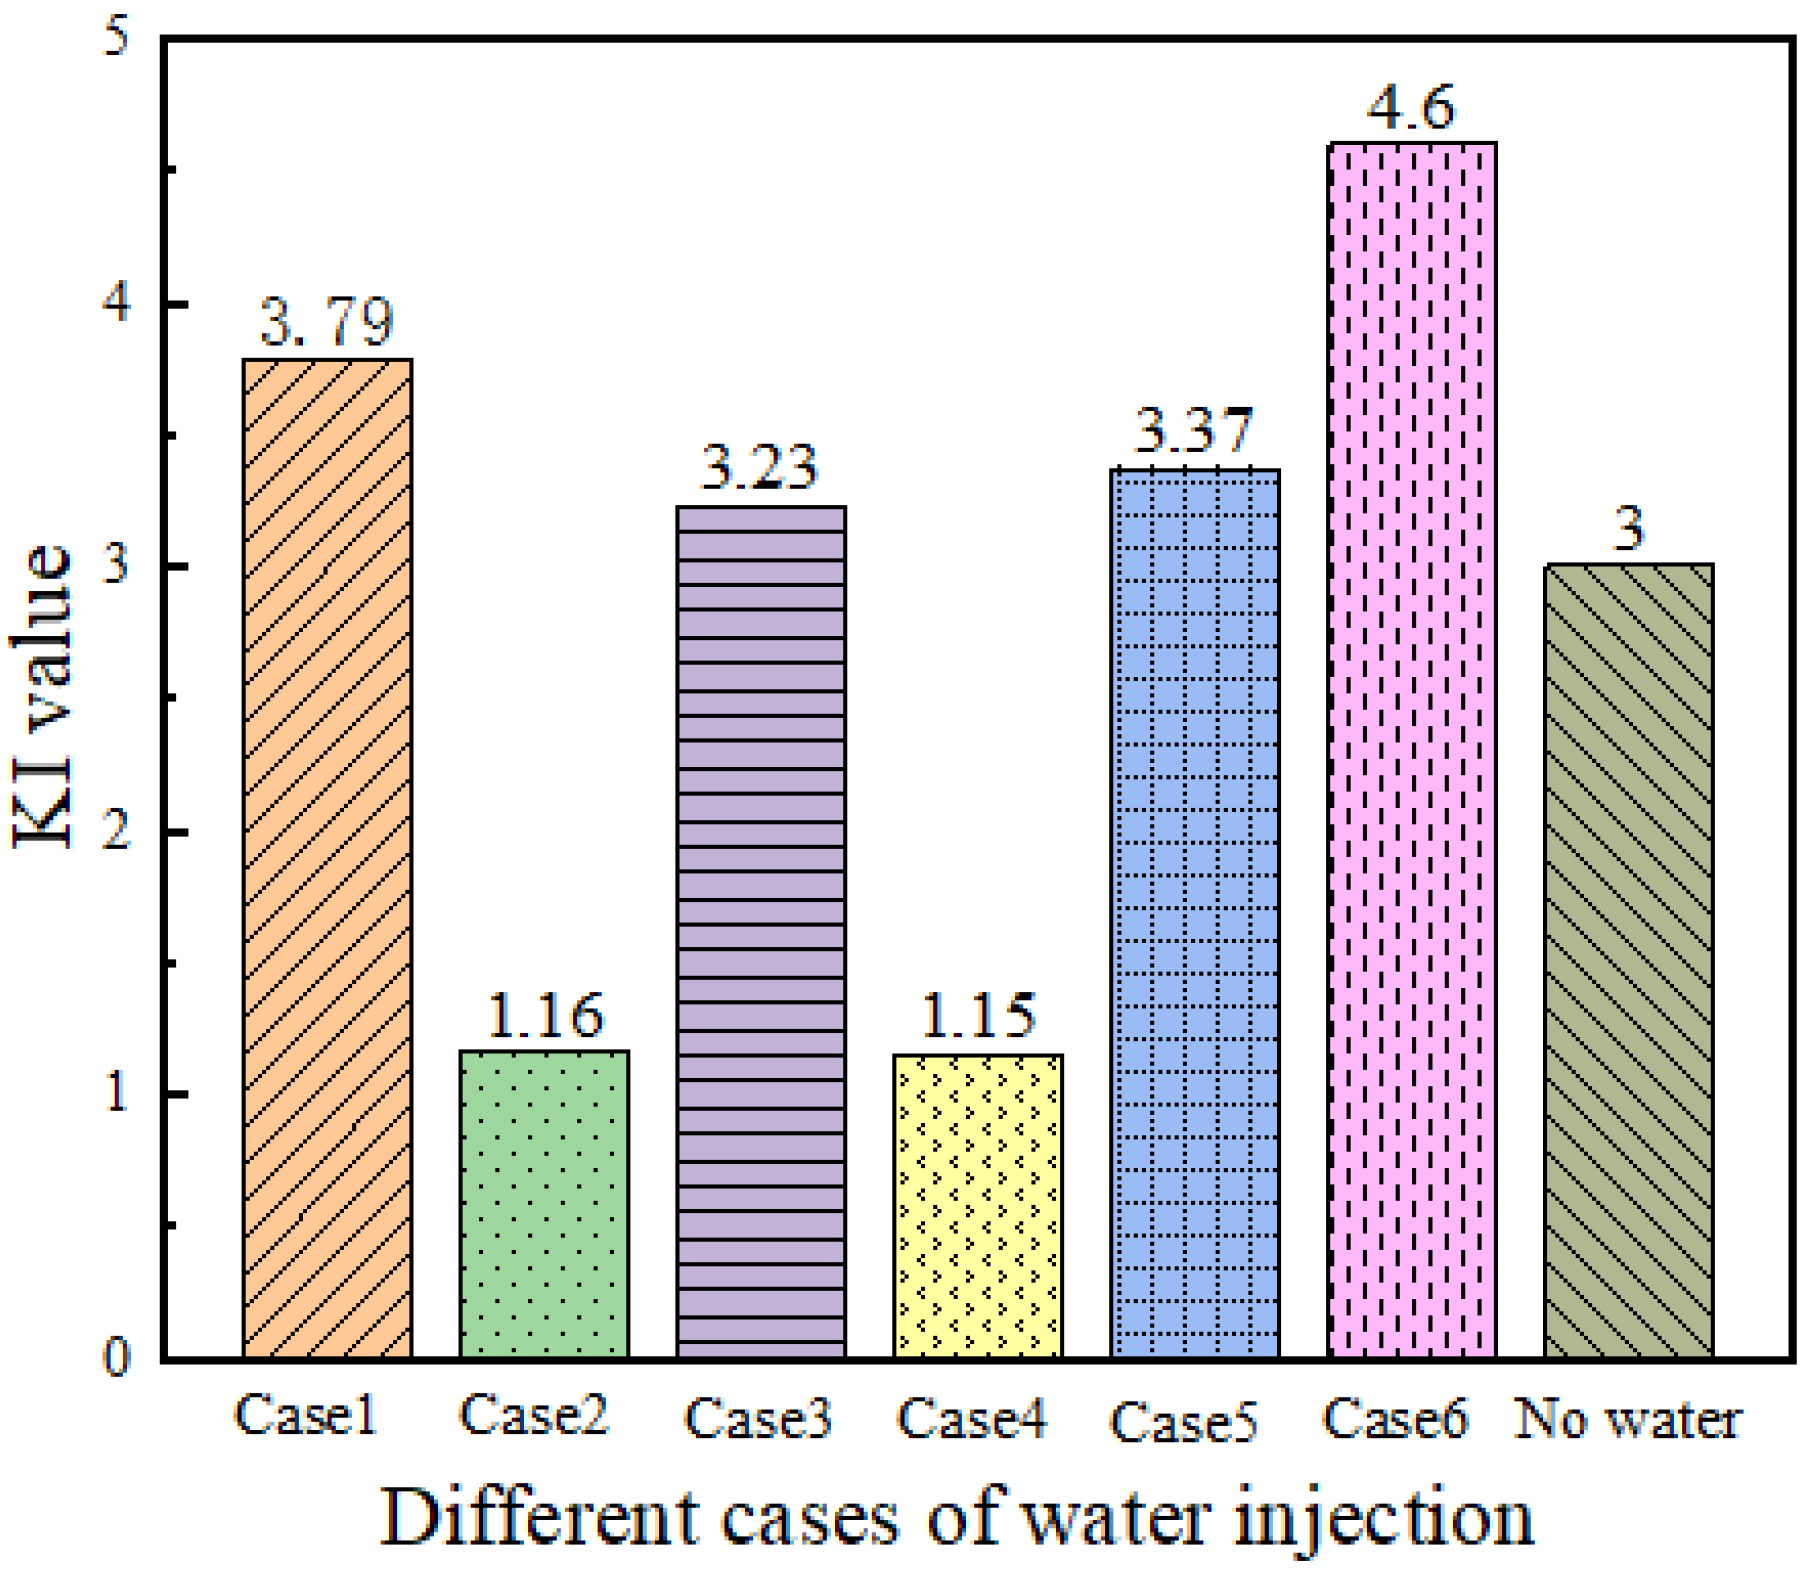
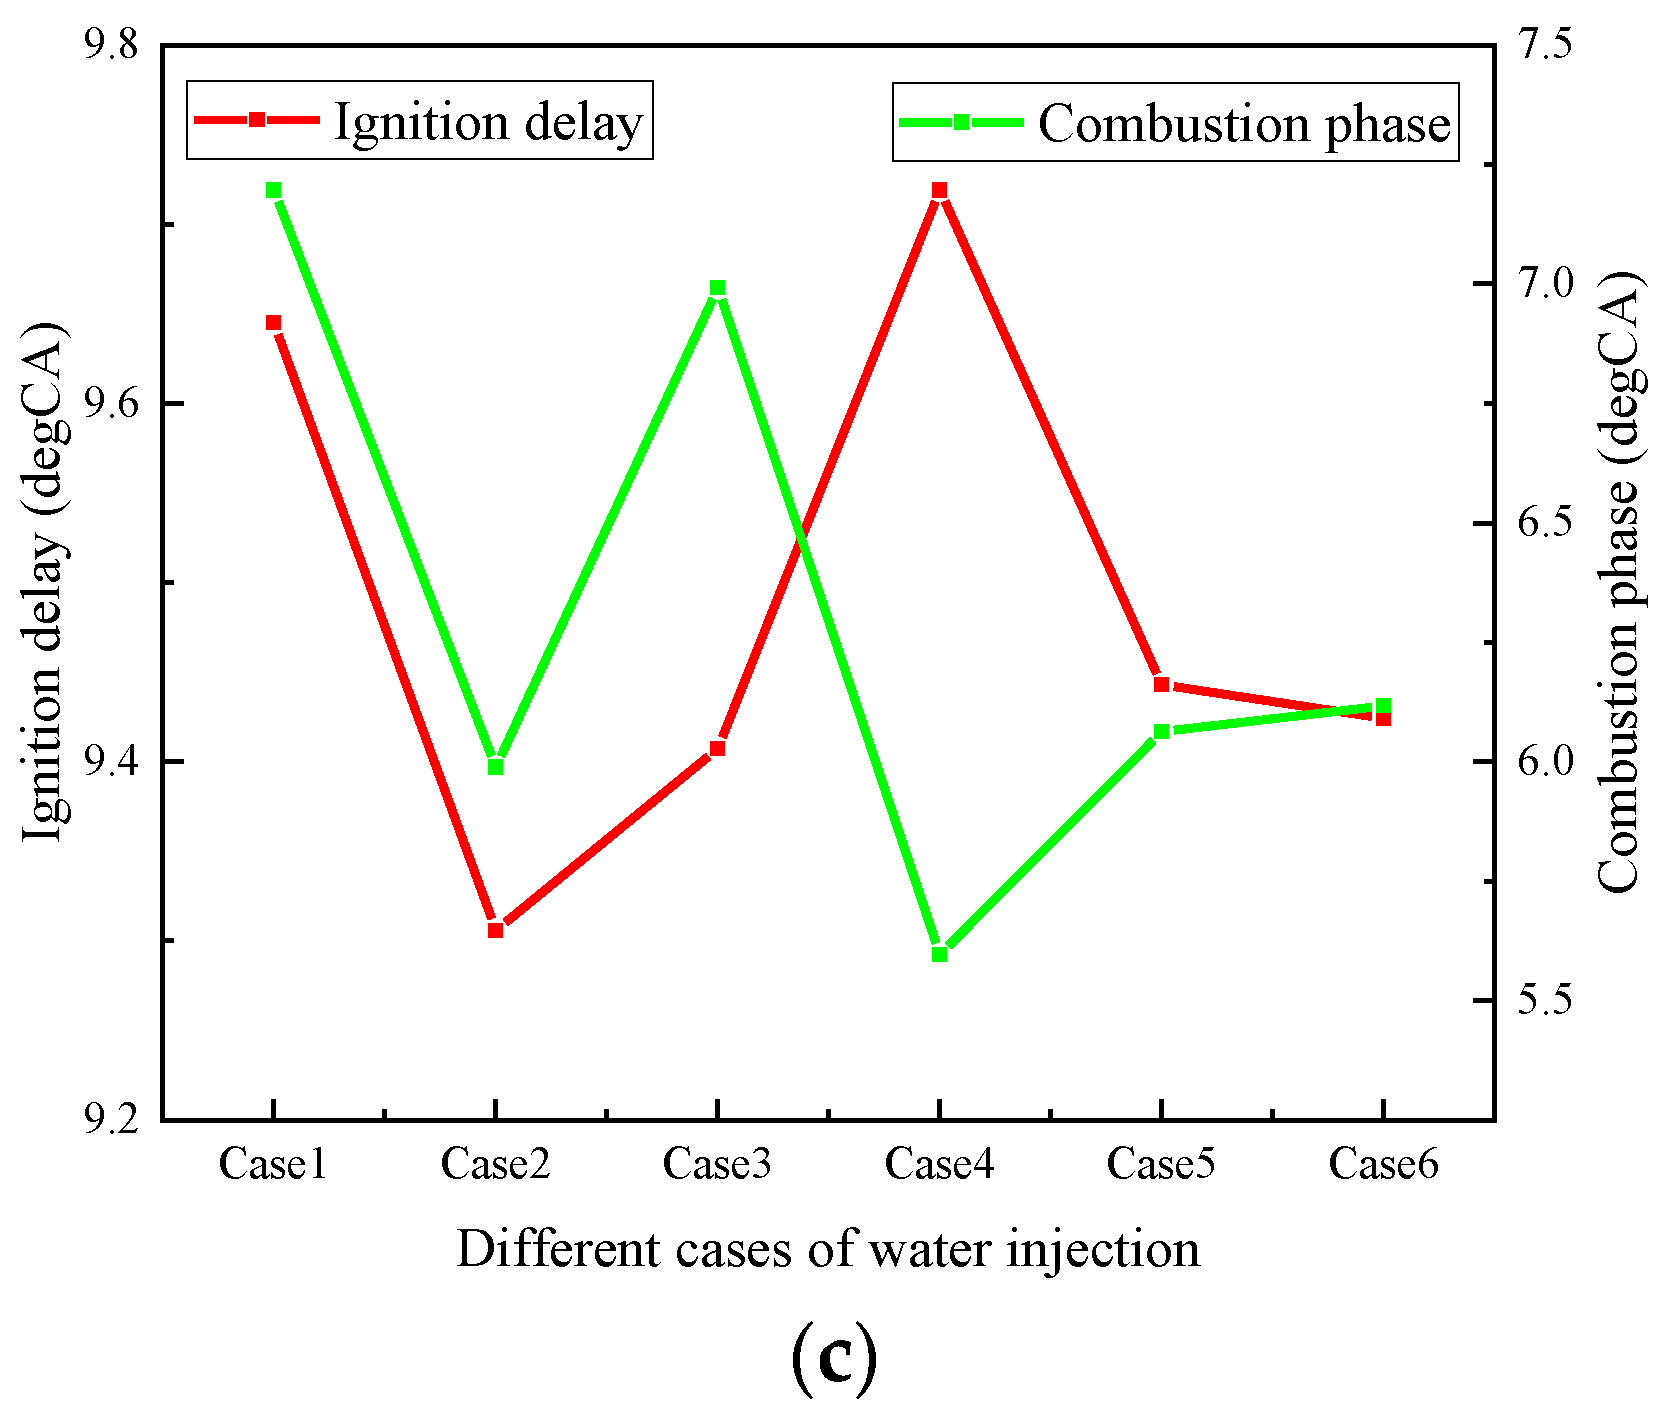
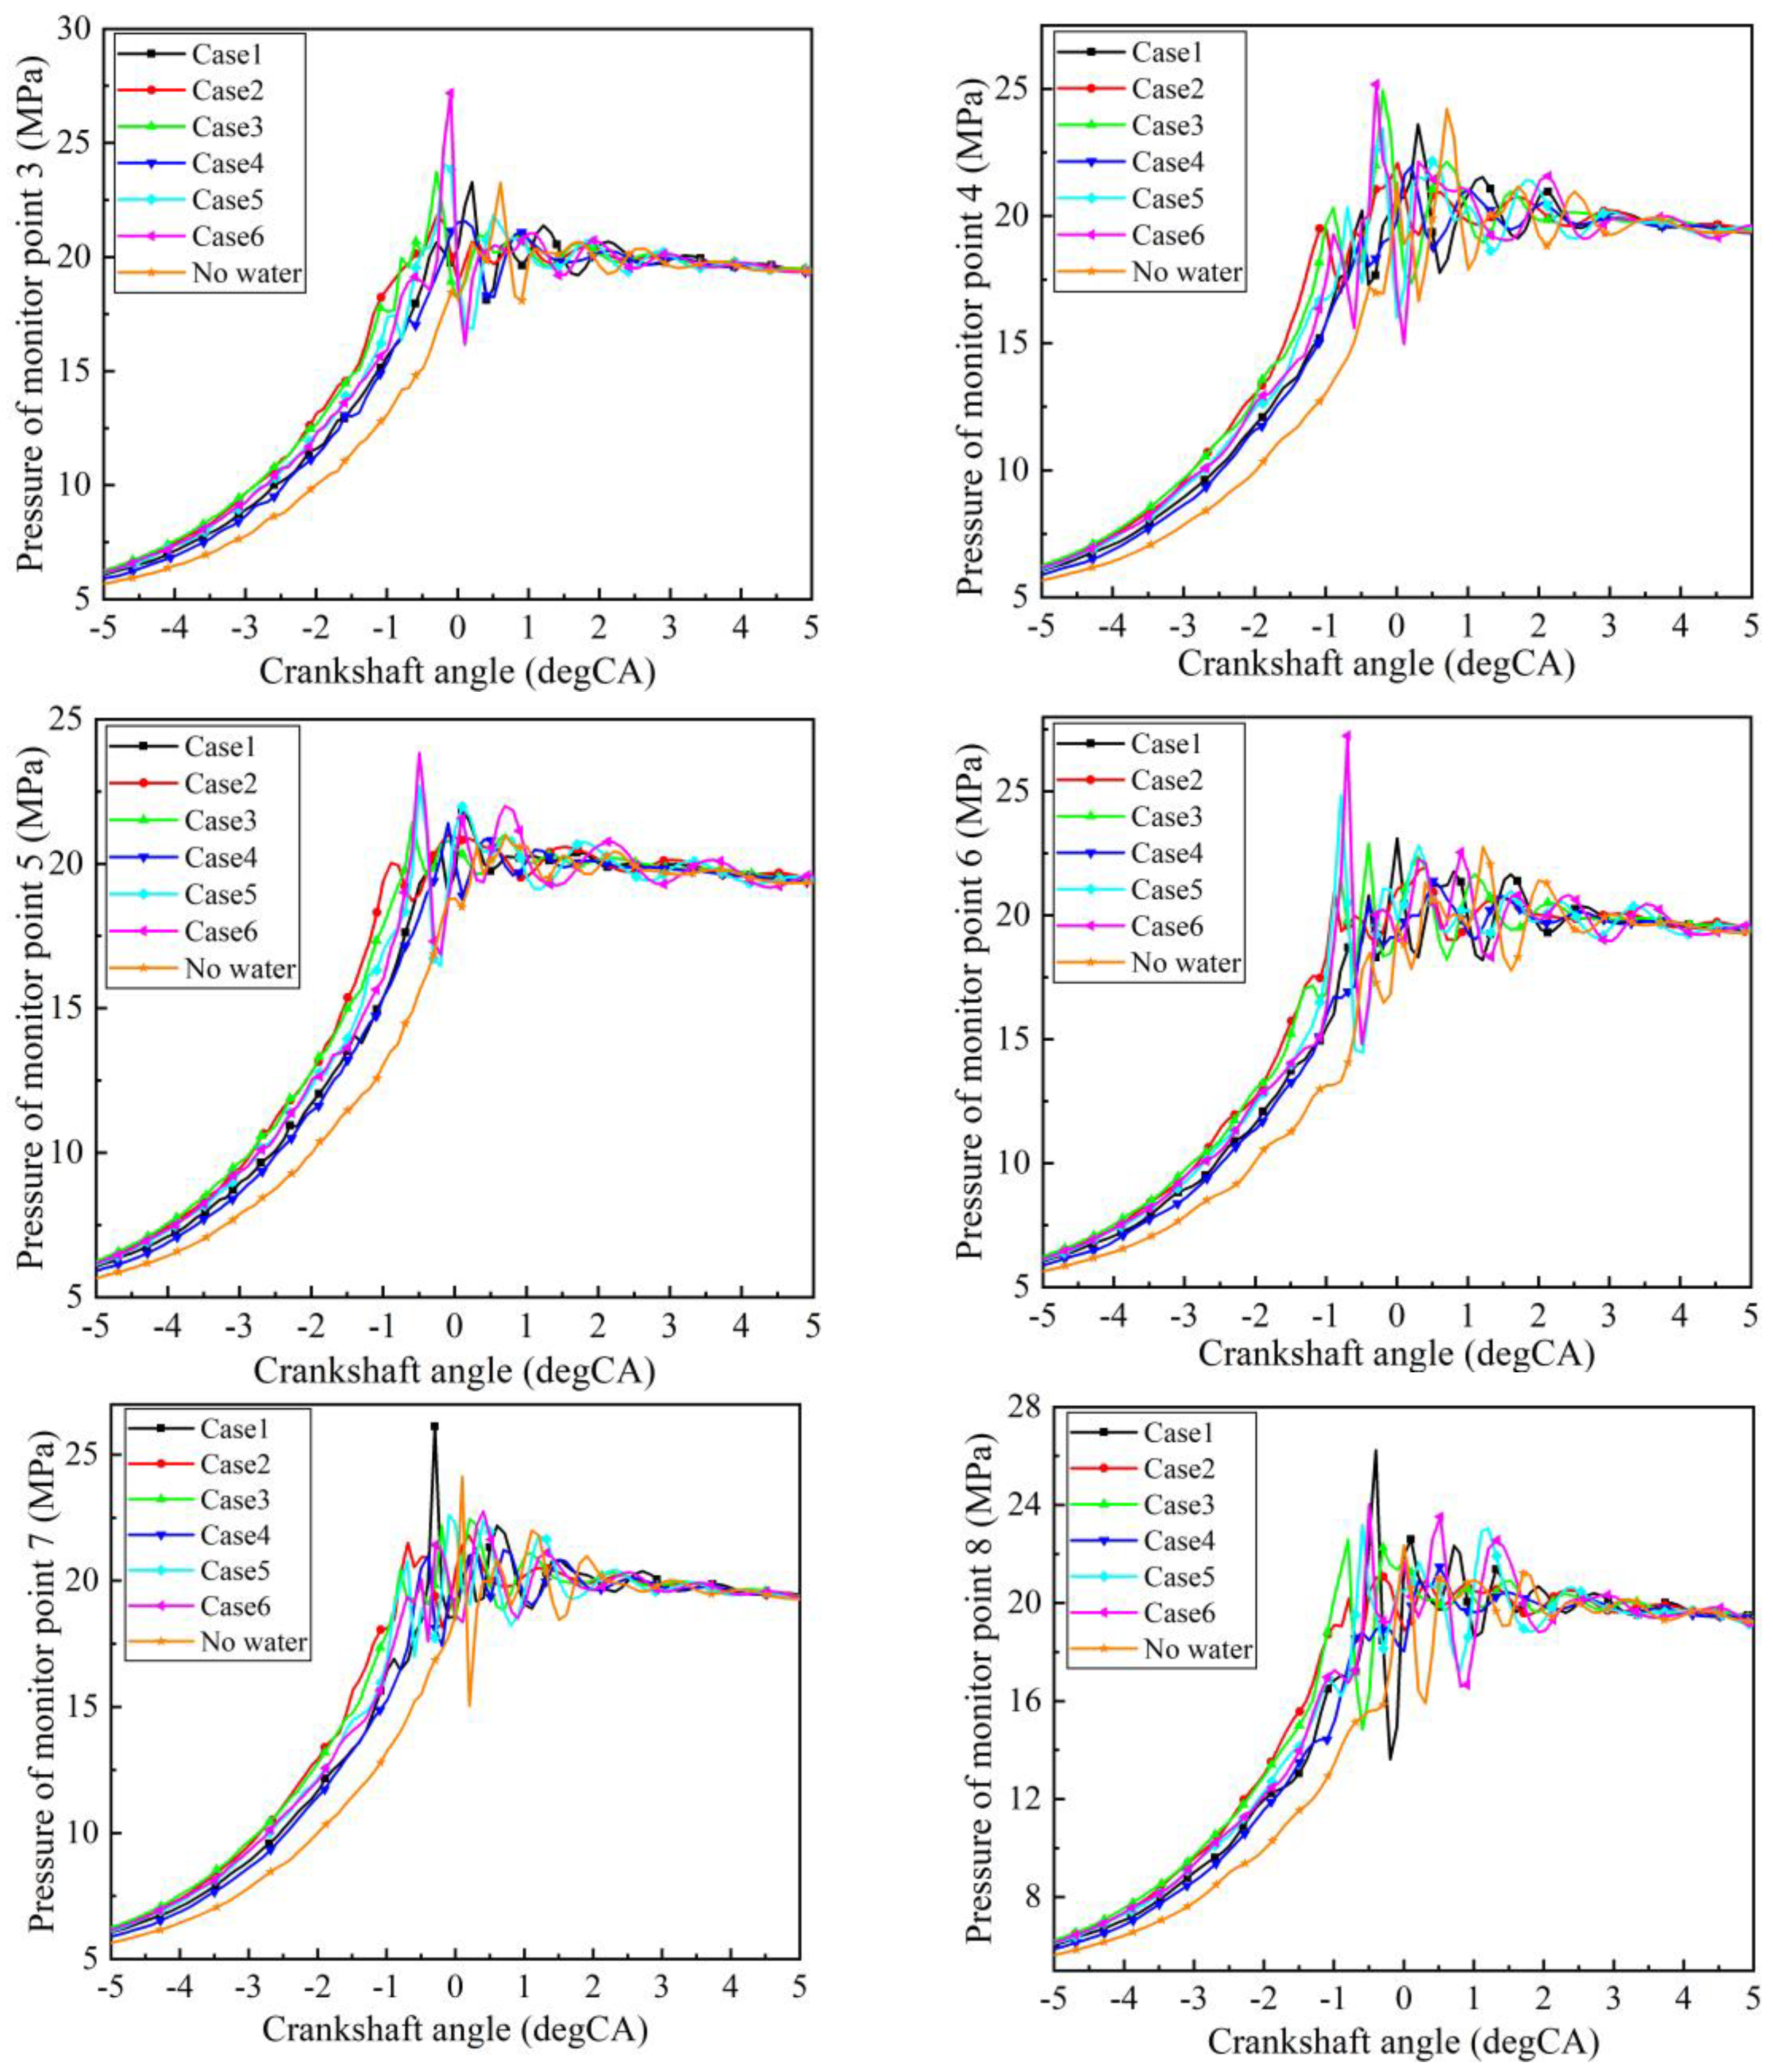
  • The difference in water injector position has little effect on the peak in-cylinder temperature and pressure, but affects the combustion rate. Cases 2 and 4 successfully suppressed the knock, so that the pressure oscillations were not significant in both cases. Interestingly, the water injection promoted the generation of OH radicals in the cylinder, so the PWI cases had a shorter combustion delay period compared to the no water cases.
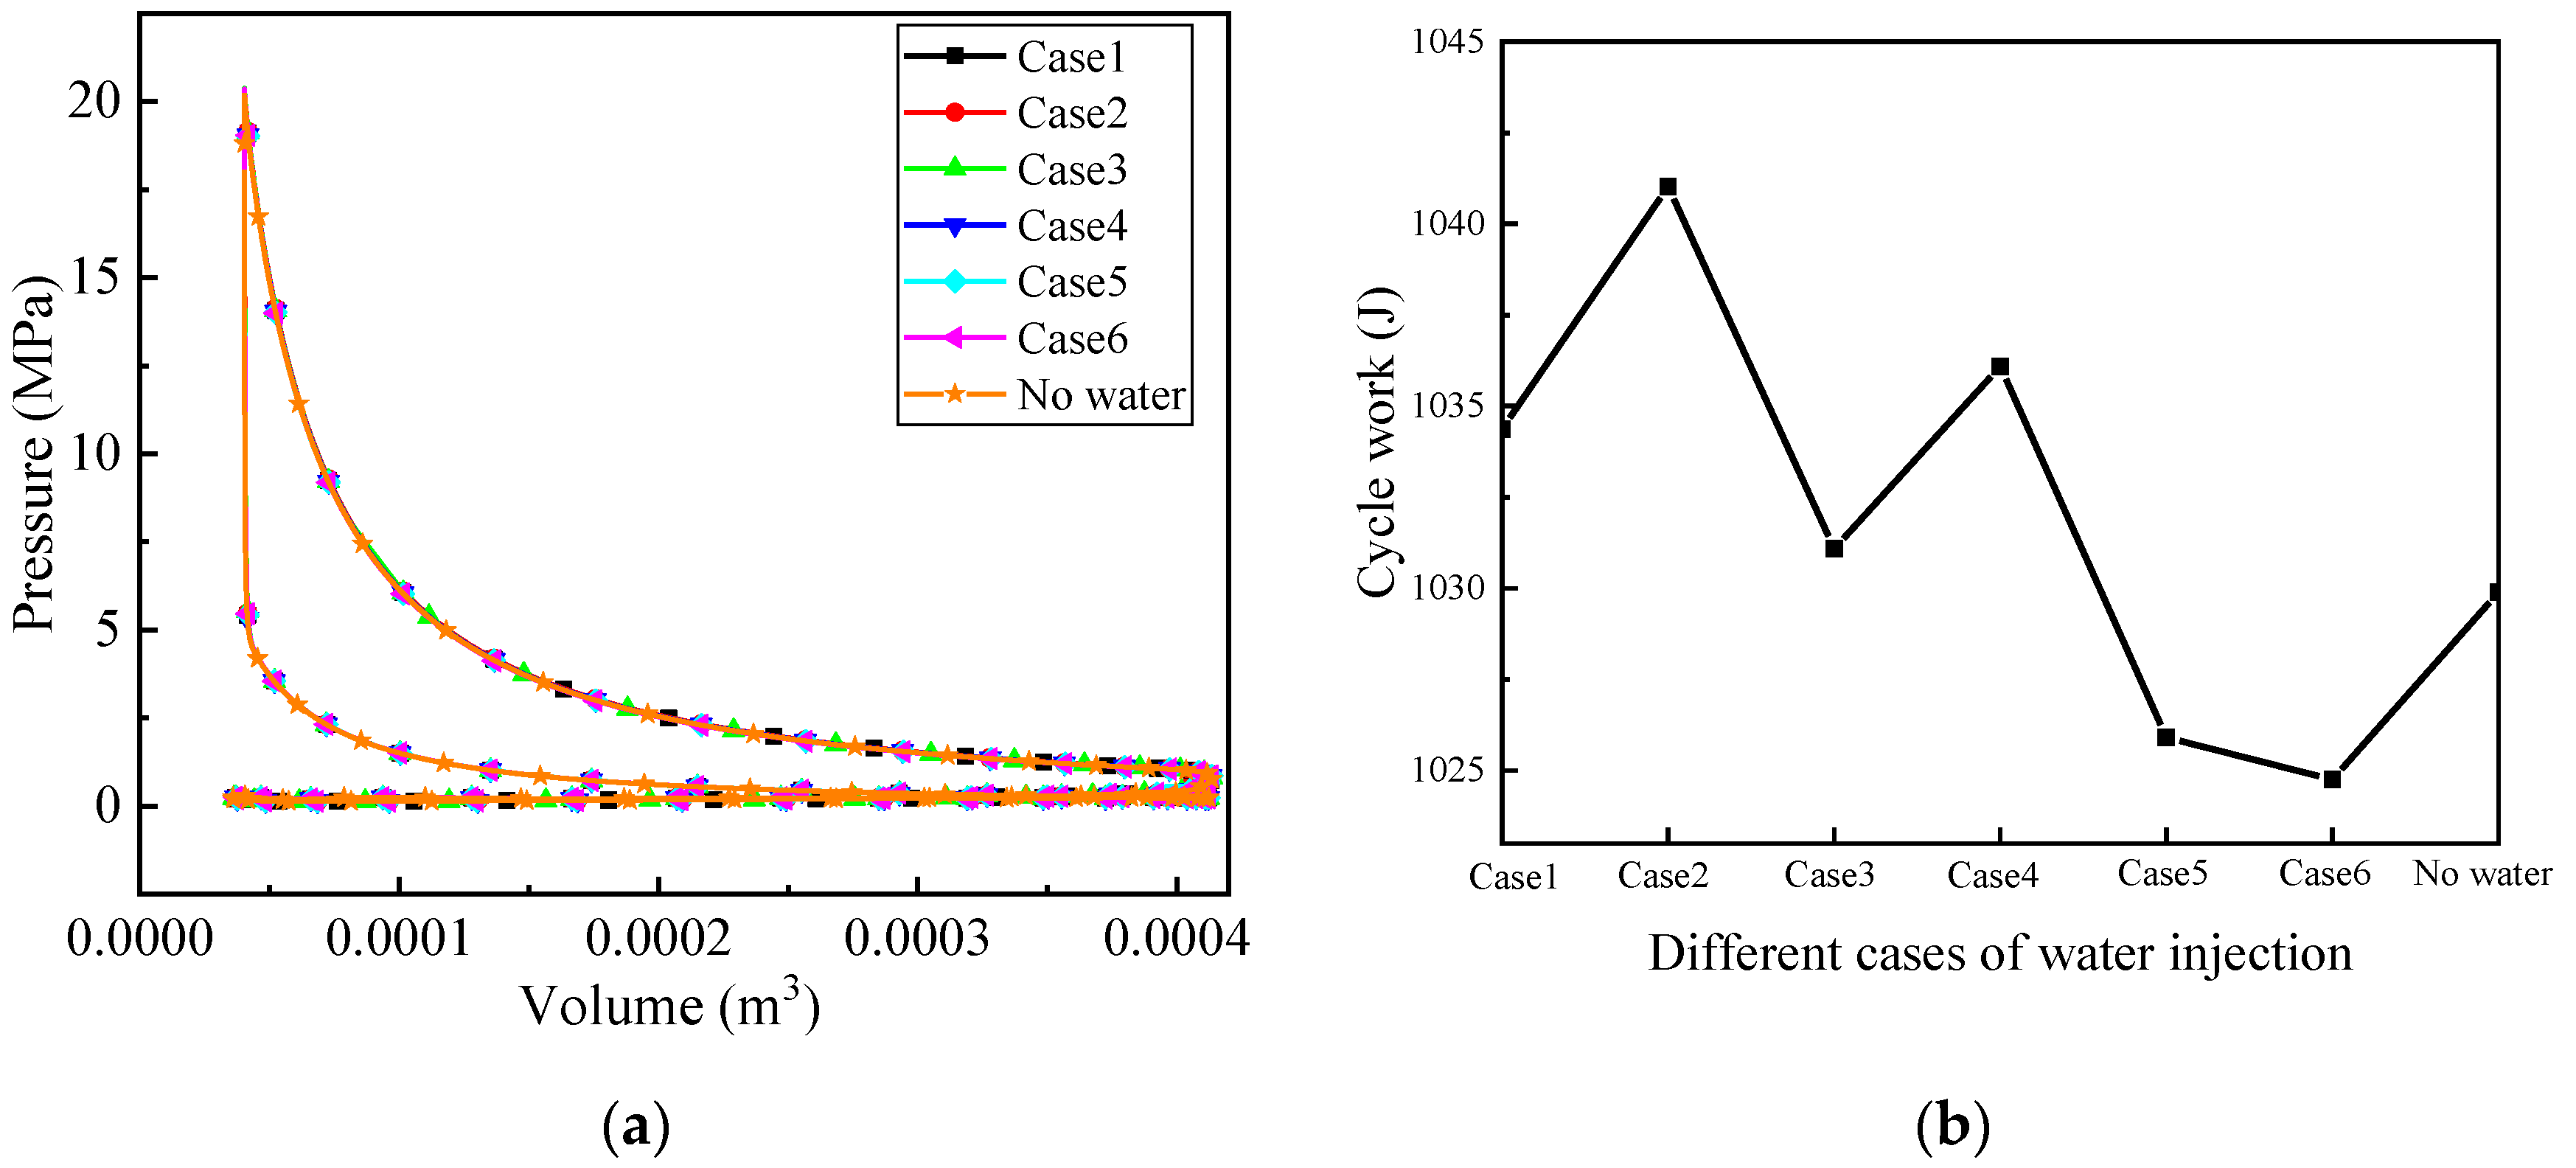
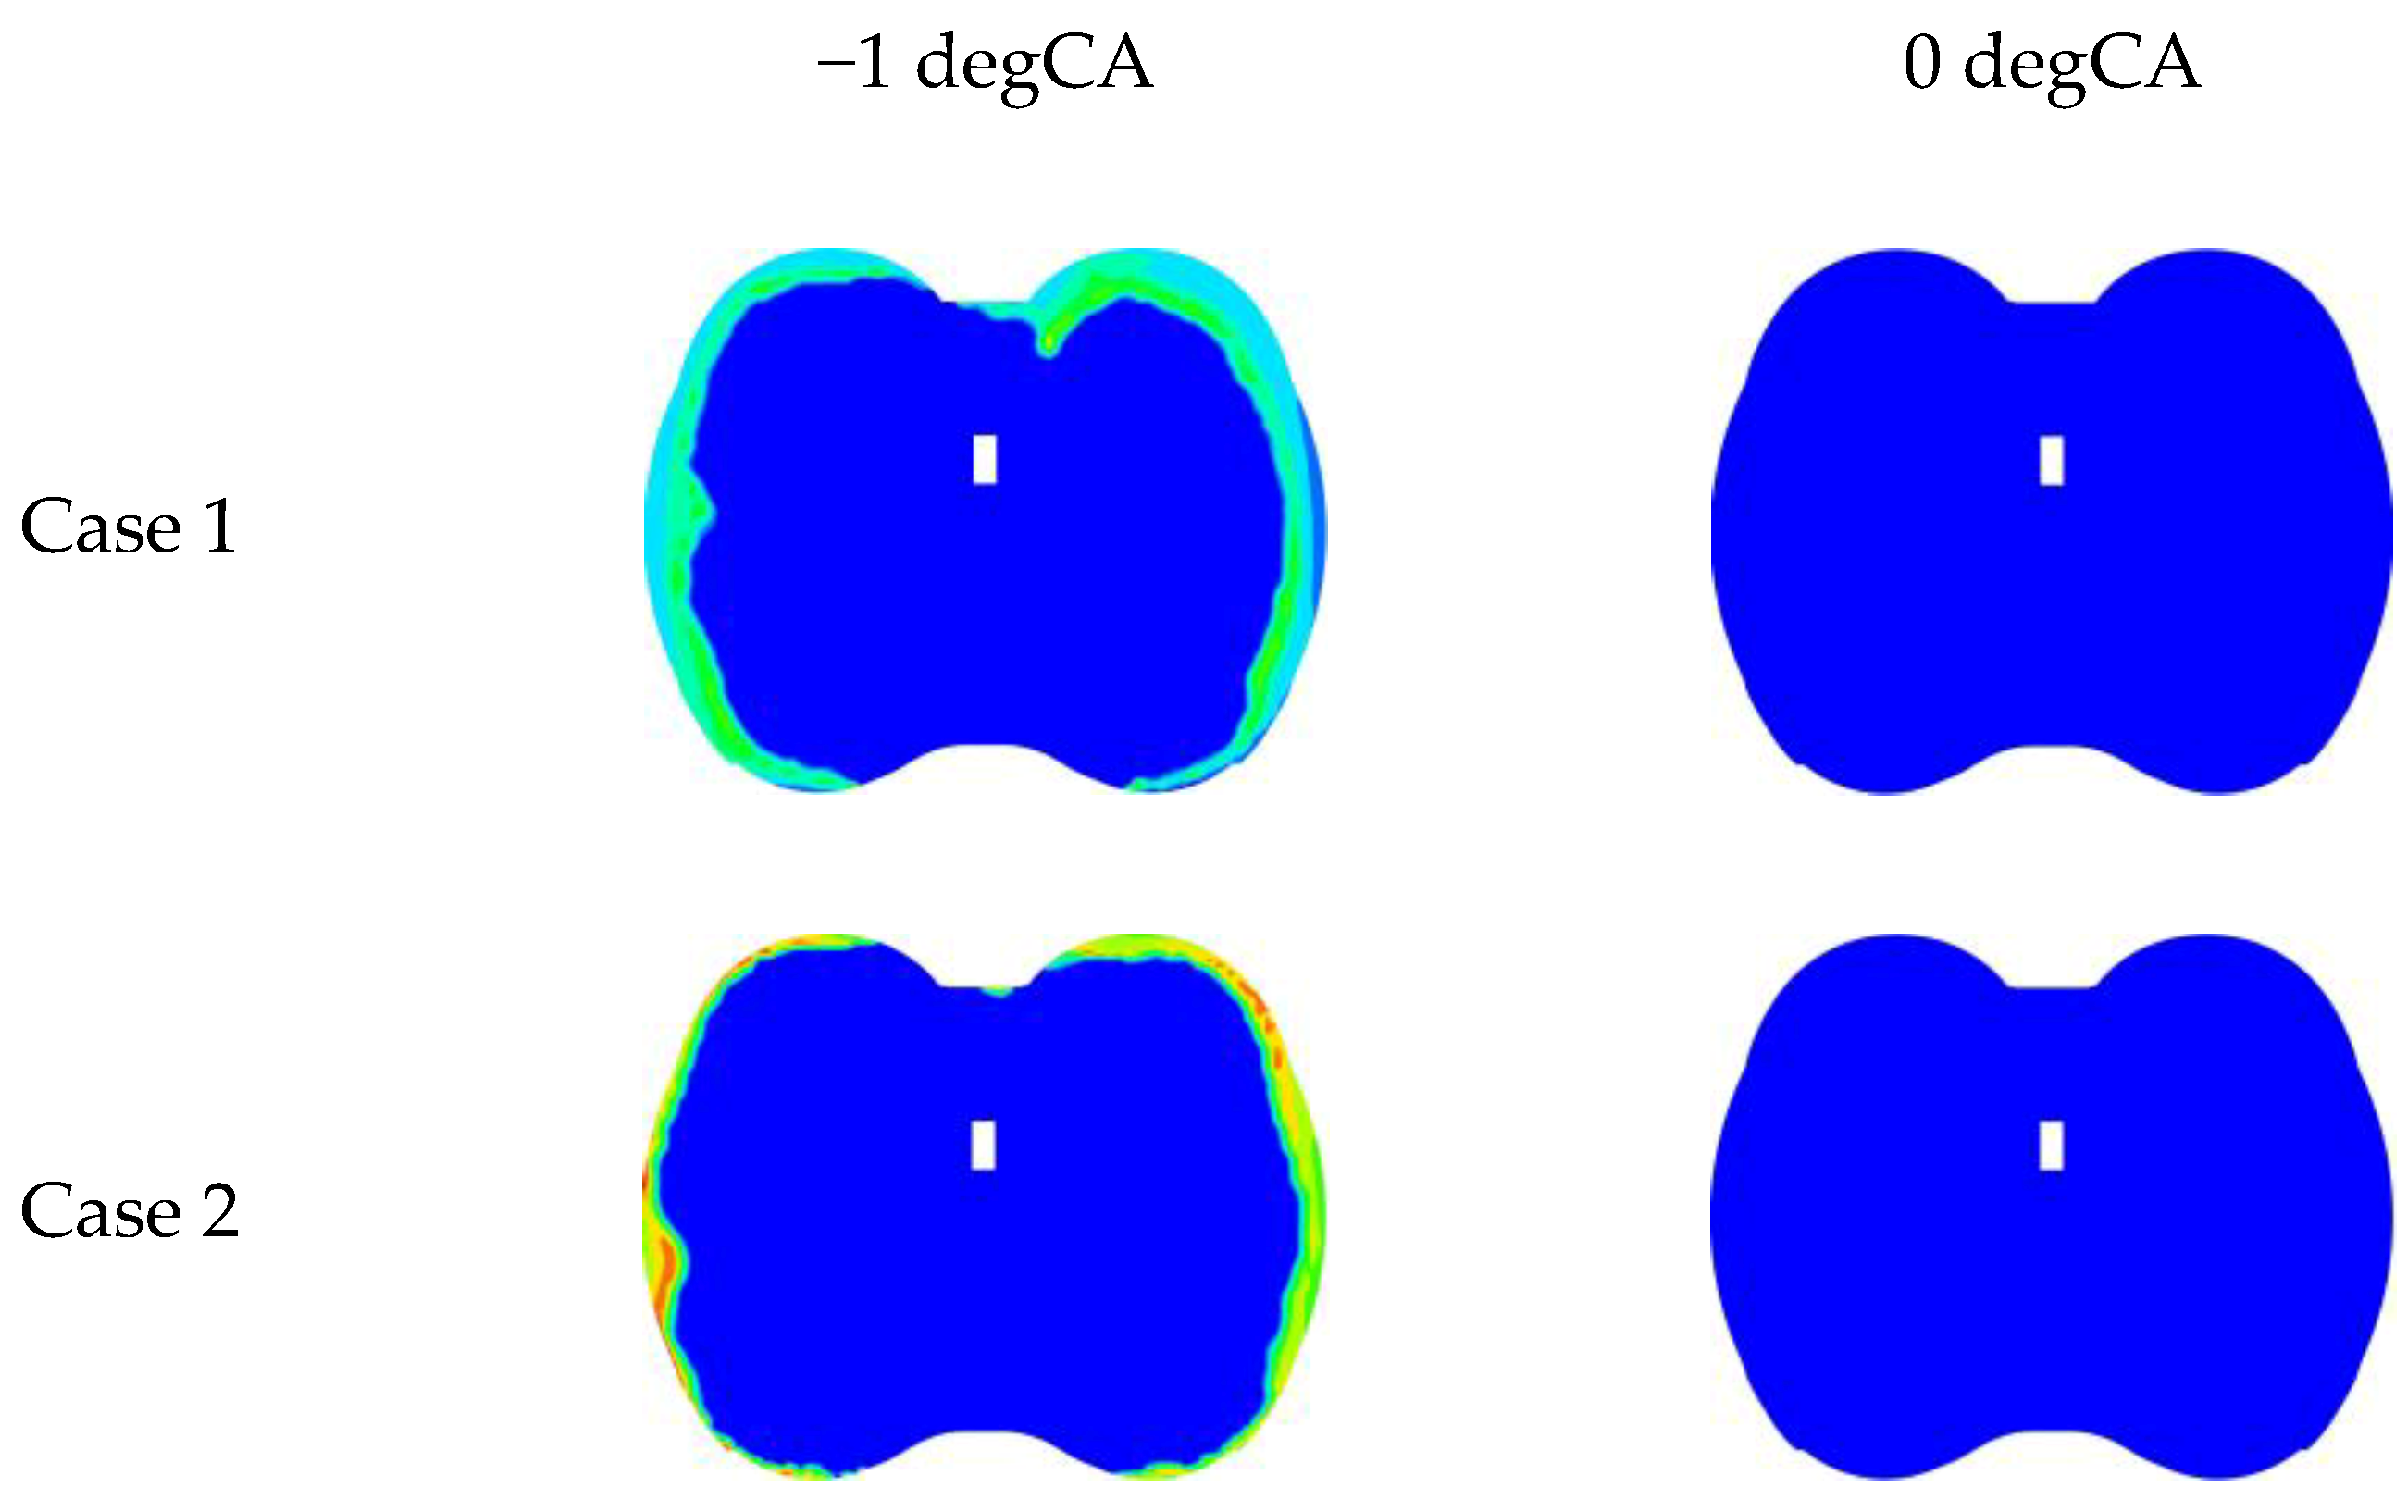
  • Strong low temperature reactions tend to cause a knock in the high-temperature reaction stage. When the knock occurs, the local burned gas velocity in the cylinder will exceed 100 m/s. The cycle work of case 2 was the largest. Because the knock was suppressed, the turbulence intensity in the cylinder and the heat transfer loss were low.
  • PWI (except for in case 6) can reduce in-cylinder soot emissions and increase NOX emissions. PWI (except for in case 6) also reduced in-cylinder UHC and CO emissions. Case 6 caused combustion deterioration due to too high in-cylinder oil film quality.

Author Contributions

Methodology, X.D.; software, Z.Z. (Zhongjie Zhang) and X.D.; validation, Z.Z. (Zhongjie Zhang) and Z.Z. (Zhaolei Zheng); writing—original draft preparation, X.D. and Z.Z. (Zhongjie Zhang); writing—review and editing, Z.Z. (Zhongjie Zhang) and Z.Z. (Zhaolei Zheng). All authors have read and agreed to the published version of the manuscript.

Funding

This research was funded by the Special Key Project of Chongqing Technology Innovation and Application Development, China, grant number cstc2020jscx-dxwtBX0024.

Data Availability Statement

Not applicable.

Conflicts of Interest

The authors declare no conflict of interest.

References

  1. Golzari, R.; Zhao, H.; Hall, J.; Bassett, M.; Williams, J.; Pearson, R. Impact of intake port injection of water on boosted downsized gasoline direct injection engine combustion, efficiency and emissions. Int. J. Engine Res. 2019, 22, 295–315. [Google Scholar] [CrossRef]
  2. Amann, M.; Alger, T.; Mehta, D. The effect of EGR on low-speed pre-ignition in boosted SI engines. In Proceedings of the SAE 2011 World Congress and Exhibition, Detroit, MI, USA, 12–14 April 2011. [Google Scholar]
  3. Haenel, P.; Seyfried, P.; Kleeberg, H.; Tomazic, D. Systematic approach to analyze and characterize pre-ignition events in turbocharged direct-injected gasoline engines. In Proceedings of the SAE 2011 World Congress and Exhibition, Detroit, MI, USA, 12–14 April 2011. [Google Scholar]
  4. Hudson, C.; Gao, X.; Stone, R. Knock measurement for fuel evaluation in spark ignition engines. Fuel 2001, 80, 395–407. [Google Scholar] [CrossRef]
  5. Zahdeh, A.; Rothenberger, P.; Nguyen, W.; Anbarasu, M.; Schmuck-Soldan, S.; Schaefer, J.; Goebel, T. Fundamental Approach to Investigate Pre-Ignition in Boosted SI Engines. SAE Int. J. Engines 2011, 4, 246–273. [Google Scholar] [CrossRef]
  6. Grandin, B.; Denbratt, I.; Bood, J.; Brackmann, C.; Bengtsson, P.-E.; Gogan, A.; Mauss, F.; Sunden, B. Heat release in the end-gas prior to knock in lean, rich and stoichiometric mixtures with and without EGR. In Proceedings of the SAE 2002 World Congress, Detroit, MI, USA, 4–7 March 2002. [Google Scholar]
  7. Abu-Qudais, M. Exhaust gas temperature for knock detection and control in spark ignition engine. Energy Convers. Manag. 1996, 37, 1383–1392. [Google Scholar] [CrossRef]
  8. Lim, G.; Lee, S.; Park, C.; Choi, Y.; Kim, C. Effect of ignition timing retard strategy on NOx reduction in hydrogen-compressed natural gas blend engine with increased compression ratio. Int. J. Hydrogen Energy 2014, 39, 2399–2408. [Google Scholar] [CrossRef]
  9. Wang, Z.; Liu, H.; Reitz, R.D. Knocking combustion in spark-ignition engines. Prog. Energy Combust. Sci. 2017, 61, 78–112. [Google Scholar] [CrossRef]
  10. Su, J.; Xu, M.; Li, T.; Gao, Y.; Wang, J. Combined effects of cooled EGR and a higher geometric compression ratio on thermal efficiency improvement of a downsized boosted spark-ignition direct-injection engine. Energy Convers. Manag. 2014, 78, 65–73. [Google Scholar] [CrossRef]
  11. Potteau, S.; Lutz, P.; Leroux, S.; Moroz, S.; Tomas, E. Cooled EGR for a turbo SI engine to reduce knocking and fuel consumption. In Proceedings of the Powertrain and Fluid Systems Conference and Exhibition, Rosemont, IL, USA, 29 October–1 November 2007. [Google Scholar]
  12. Zheng, M.; Reader, G.T.; Hawley, J.G. Diesel engine exhaust gas recirculation––a review on advanced and novel concepts. Energy Convers. Manag. 2004, 45, 883–900. [Google Scholar] [CrossRef]
  13. Morikawa, K.; Moriyoshi, Y.; Kuboyama, T.; Imai, Y.; Yamada, T.; Hatamura, K. Investigation and Improvement of LSPI Phenomena and Study of Combustion Strategy in Highly Boosted SI Combustion in Low Speed Range. In Proceedings of the SAE 2015 World Congress and Exhibition, Detroit, MI, USA, 21–23 April 2015. [Google Scholar]
  14. Teodosio, L.; De Bellis, V.; Bozza, F. Combined Effects of Valve Strategies, Compression Ratio, Water Injection, and Cooled EGR on the Fuel Consumption of a Small Turbocharged VVA Spark-Ignition Engine. SAE Int. J. Engines 2018, 11, 643–656. [Google Scholar] [CrossRef]
  15. Cengel, Y.A.; Boles, M.A. Thermodynamics: An engineering approach, second edition. Appl. Mech. Rev. 1995, 48, B66. [Google Scholar]
  16. Chen, B.; Zhang, L.; Han, J.; Chen, X. Investigating the effect of increasing specific heat and the influence of charge cooling of water injection in a TGDI engine. Appl. Therm. Eng. 2019, 149, 1105–1113. [Google Scholar] [CrossRef]
  17. Wei, X.; Qian, Y.; Meng, S.; Hua, Y.; Qiu, L.; Sun, Y.; Wan, J.; Zhang, X. Effects of Coupling Port Water Injection and Egr on the Spray Water Evolution, Combustion and Emission of a Premixed Stoichiometric Natural Gas Engine: A Numerical Study. Fuel 2022, 324, 124315. [Google Scholar] [CrossRef]
  18. Segawa, D.; Yamasaki, H.; Kadota, T.; Tanaka, H.; Enomoto, H.; Tsue, M. Water-coalescence in an oil-in-water emulsion droplet burning under microgravity. Proc. Combust. Inst. 2000, 28, 985–990. [Google Scholar] [CrossRef]
  19. Samec, N.; Kegl, B.; Dibble, R.W. Numerical and experimental study of water/oil emulsified fuel combustion in a diesel engine. Fuel 2002, 81, 2035–2044. [Google Scholar] [CrossRef]
  20. Abu-Zaid, M. Performance of single cylinder, direct injection Diesel engine using water fuel emulsions. Energy Convers. Manag. 2004, 45, 697–705. [Google Scholar] [CrossRef]
  21. Li, A.; Zheng, Z.; Peng, T. Effect of water injection on the knock, combustion, and emissions of a direct injection gasoline engine. Fuel 2020, 268, 117376. [Google Scholar] [CrossRef]
  22. Sun, X.; Ning, J.; Liang, X.; Jing, G.; Chen, Y.; Chen, G. Effect of direct water injection on combustion and emissions characteristics of marine diesel engines. Fuel 2022, 309, 122213. [Google Scholar] [CrossRef]
  23. Zhang, Z.; Kang, Z.; Jiang, L.; Chao, Y.; Deng, J.; Hu, Z.; Li, L.; Wu, Z. Effect of direct water injection during compression stroke on thermal efficiency optimization of common rail diesel engine. In Proceedings of the 9th International Conference on Applied Energy, ICAE 2017, Cardiff, UK, 21–24 August 2017; pp. 1251–1258. [Google Scholar]
  24. Liu, Z.; Zheng, Z.; Zhang, Z.; Li, M. The effect of direct water injection on the combustion stability of a downsized boost engine under high compression ratios and load conditions. Fuel 2022, 308, 121945. [Google Scholar] [CrossRef]
  25. Arabaci, E.; Icingur, Y.; Solmaz, H.; Uyumaz, A.; Yilmaz, E. Experimental investigation of the effects of direct water injection parameters on engine performance in a six-stroke engine. Energy Convers. Manag. 2015, 98, 89–97. [Google Scholar] [CrossRef]
  26. Wang, J.; Duan, X.; Liu, Y.; Wang, W.; Liu, J.; Lai, M.-C.; Li, Y.; Guo, G. Numerical investigation of water injection quantity and water injection timing on the thermodynamics, combustion and emissions in a hydrogen enriched lean-burn natural gas SI engine. Int. J. Hydrogen Energy 2020, 45, 17935–17952. [Google Scholar] [CrossRef]
  27. Ishida, M.; Ueki, H.; Sakaguchi, D. Prediction of NOx reduction rate due to port water injection in a di diesel engine. In Proceedings of the International Fall Fuels and Lubricants Meeting and Exposition, Tulsa, OK, USA, 13–16 October 1997. [Google Scholar]
  28. Nicholls, J.E.; Ei-Messiri, I.A.; Newhali, H.K. Inlet manifold water injection for control of nitrogen oxides—Theory and experiment. Sae Trans. 1969, 78, 167–176. [Google Scholar]
  29. Cavina, N.; Rojo, N.; Businaro, A.; Brusa, A.; Corti, E.; De Cesare, M. Investigation of Water Injection Effects on Combustion Characteristics of a GDI TC Engine. In Proceedings of the SAE 13th International Conference on Engines and Vehicles, ICE 2017, Capri, Napoli, Italy, 10–14 September 2017. [Google Scholar]
  30. Berni, F.; Breda, S.; Lugli, M.; Cantore, G. A numerical investigation on the potentials of water injection to increase knock resistance and reduce fuel consumption in highly downsized GDI engines. In Proceedings of the 69th Conference of the Italian Thermal Engineering Association, ATI 2014, Milan, Italy, 10–13 September 2015; pp. 826–835. [Google Scholar]
  31. Worm, J.; Naber, J.; Duncan, J.; Barros, S.; Atkinson, W. Water Injection as an Enabler for Increased Efficiency at High-Load in a Direct Injected, Boosted, SI Engine. SAE Int. J. Engines 2017, 10, 951–958. [Google Scholar] [CrossRef]
  32. Tornatore, C.; Siano, D.; Marchitto, L.; Iacobacci, A.; Valentino, G.; Bozza, F. Water Injection: A Technology to Improve Performance and Emissions of Downsized Turbocharged Spark Ignited Engines. SAE Int. J. Engines 2017, 10, 2319–2329. [Google Scholar] [CrossRef]
  33. Jones, W.P.; Launder, B.E. Prediction of laminarization with a two- equation model of turbulence. Int. J. Heat Mass Transf. 1972, 15, 301–314. [Google Scholar] [CrossRef]
  34. Senecal, P.K.; Pomraning, E.; Richards, K.J.; Briggs, T.E.; Choi, C.Y.; McDavid, R.M.; Patterson, M.A. Multi-dimensional modeling of direct-injection diesel spray liquid length and flame lift-off length using cfd and parallel detailed chemistry. In Proceedings of the 2003 SAE World Congress, Detroit, MI, USA, 3–6 March 2003. [Google Scholar]
  35. Song, Y.; Zheng, Z.; Xiao, J. Development and validation of a reduced chemical kinetic mechanism for supercritical gasoline of GDI engine. Fuel 2019, 241, 676–685. [Google Scholar] [CrossRef]
  36. Liang, L.; Reitz, R.D.; Iyer, C.O.; Yi, J. Modeling knock in spark-ignition engines using a G-equation combustion model incorporating detailed chemical kinetics. In Proceedings of the 2007 World Congress, Detroit, MI, USA, 16–19 April 2007. [Google Scholar]
  37. Zhen, X.; Wang, Y.; Xu, S.; Zhu, Y. Study of knock in a high compression ratio spark-ignition methanol engine by multi-dimensional simulation. Energy 2013, 50, 150–159. [Google Scholar] [CrossRef]
  38. Zhen, X.; Wang, Y.; Zhu, Y. Study of knock in a high compression ratio SI methanol engine using LES with detailed chemical kinetics. Energy Convers. Manag. 2013, 75, 523–531. [Google Scholar] [CrossRef]
  39. Singh, D.; Nishiie, T.; Tanvir, S.; Qiao, L. An experimental and kinetic study of syngas/air combustion at elevated temperatures and the effect of water addition. Fuel 2012, 94, 448–456. [Google Scholar] [CrossRef]
  40. Merola, S.S.; Vaglieco, B.M. Knock investigation by flame and radical species detection in spark ignition engine for different fuels. Energy Convers. Manag. 2007, 48, 2897–2910. [Google Scholar] [CrossRef]
  41. Wang, Z.; Wang, Y.; Reitz, R.D. Pressure Oscillation and Chemical Kinetics Coupling during Knock Processes in Gasoline Engine Combustion. Energy Fuels 2012, 26, 7107–7119. [Google Scholar] [CrossRef]
Figure 1. Geometric model of the GDI engine.
Processes 10 01909 g001
Figure 2. Average pressure obtained from cold flow calculation for three grid sizes (CR = 9.5).
Processes 10 01909 g002
Figure 3. Pressure comparison of experimental results and numerical simulation results at (a) 2000 rpm (b) 5600 rpm.
Processes 10 01909 g003
Figure 4. Comparison of experimental and numerical pressure curves under knock conditions.
Processes 10 01909 g004
Figure 5. Schematic of monitor points.
Processes 10 01909 g005
Figure 6. The mass fraction distribution of (a) IC8H18, (b) H2O2, (c) CH2O, (d) OH and (e) HCO in the cylinder (CR = 10.3, ignition time = −14 degCA).
Processes 10 01909 g006aProcesses 10 01909 g006b
Figure 7. Pressure curves for 8 monitor points (CR = 10.3, ignition time = −14 degCA).
Processes 10 01909 g007aProcesses 10 01909 g007b
Figure 8. Diagram of the installation position of six different water injectors.
Processes 10 01909 g008aProcesses 10 01909 g008b
Figure 9. The distribution of water at the moment of ignition time in different water injection cases (CR = 10.3, ignition time = −14 degCA).
Processes 10 01909 g009
Figure 10. (a) Equivalence ratio and (b) TKE (m2/s2) at ignition time in different water injection cases (CR = 10.3, ignition time = −14 degCA).
Processes 10 01909 g010aProcesses 10 01909 g010b
Figure 11. Mean equivalence ratio in cylinder at ignition time in different water injection cases (CR = 10.3, ignition time = −14 degCA).
Processes 10 01909 g011
Figure 12. (a) Average pressure, (b) average temperature, (c) ignition delay and combustion phase in different water injection cases (CR = 10.3, ignition time = −14 degCA).
Processes 10 01909 g012aProcesses 10 01909 g012b
Figure 13. Pressure curves of eight monitor points in different water injection cases (CR = 10.3, ignition time = −14 degCA).
Processes 10 01909 g013aProcesses 10 01909 g013b
Figure 14. OH radical mass in the cylinder in different water injection cases (CR = 10.3, ignition time = −14 degCA).
Processes 10 01909 g014
Figure 15. KI values of each case (CR = 10.3, ignition time = −14 degCA).
Processes 10 01909 g015
Figure 16. Mass of (a) CH2O and (b) H2O2 radical in the cylinder in different water injection cases (CR = 10.3, ignition time = −14 degCA).
Processes 10 01909 g016
Figure 17. Instantaneous heat release rate in the cylinder in different water injection cases (CR = 10.3, ignition time = −14 degCA).
Processes 10 01909 g017
Figure 18. The mass fraction distribution of (a) CH2O and (b) HCO, and (c) velocity magnitude distribution in the cylinder in different water injection cases (CR = 10.3, ignition time = −14 degCA).
Processes 10 01909 g018aProcesses 10 01909 g018bProcesses 10 01909 g018cProcesses 10 01909 g018d
Figure 19. (a) P–V diagram and (b) cycle work in different water injection cases (CR = 10.3, ignition time = −14 degCA).
Processes 10 01909 g019
Figure 20. (a) Soot, (b) NOX, (c) UHC and (d) CO emissions in different water injector positions (CR = 10.3, ignition time = −14 degCA).
Processes 10 01909 g020aProcesses 10 01909 g020b
Figure 21. Oil film mass in different water injection cases (CR = 10.3, ignition time = −14 degCA).
Processes 10 01909 g021
Table 1. Basic parameters of the GDI engine.
ParameterNumerical Value
Number of cylinders1
Bore diameter (mm)76
Stroke (mm)82.6
Connecting rod length (mm)139.3
Displacement (L)0.375
CR9.5
Table 2. Operating conditions of the GDI engine.
ParameterNumerical Value
Rotational speed (rpm)2000
Ignition time (degCA)5.67
Start of fuel injection time (degCA)−280
Fuel injection duration (degCA)52.0
Mass of fuel injection (mg)65
Intake valves opening/closing timing (degCA)−409/−128
Exhaust valves opening/closing timing (degCA)150/395
Table 3. Selection of each submodel.
ModelSetting
Turbulence modelk-ε double equation
Combustion modelSAGE
Fuel fracture modelKH-RT
Fuel wall modelWall film
Collision modelNTC collision
Fuel evaporation modelFrossling
Wall heat transfer modelO’Rourke and Amsden
NOx modelExtended Zeldovich
Soot modelHiroyasu
Table 4. Initial temperature of the boundary.
BoundaryTemperature (K)
Piston head 565.9
Spark plug 1100.0
Cylinder wall500.0
Cylinder inside565
Intake port wall350
Exhaust port wall1064.65
Table 5. Setting of encryption level of the GDI engine.
Encrypted LocationEncrypted Levels
Cylinder2
Intake valve angle4
Exhaust valve angle4
Source4
Fuel injector4
Water injector4
Table 6. Experimental operating parameters.
ParameterLow-SpeedHigh-Speed
Start of fuel injection time (degCA)−280−330
Fuel injection duration (degCA)52.02140.13
Mass of fuel injection (mg)6562
Ignition time (degCA)5.67−2.7
Rotational speed (r/min)2000 5600
Table 7. Basic parameters of the knock validation engine.
ParameterNumerical Value
Number of cylinders1
Bore diameter (mm)75
Stroke (mm)127.5
Connecting rod length (mm)245
Displacement (L)0.563
CR17
Table 8. Knock operation conditions.
ParameterNumerical Value
CR10.3
Ignition time (degCA)−14
Rotational speed (r/min)2000
Table 9. Water injection parameters.
ParameterNumerical Value
Water temperature (K)298
Water injection time (degCA)−370
Water injection pressure (bar)5
Water injection mass (mg)19.53
Publisher’s Note: MDPI stays neutral with regard to jurisdictional claims in published maps and institutional affiliations.

