Article

CFD Analysis of a Large Marine Engine Scavenging Process

Faculty of Engineering, University of Rijeka, Vukovarska 58, 51000 Rijeka, Croatia
*
Author to whom correspondence should be addressed.
Processes 2022, 10(1), 141; https://doi.org/10.3390/pr10010141
Submission received: 26 August 2021 / Revised: 29 December 2021 / Accepted: 7 January 2022 / Published: 10 January 2022
(This article belongs to the Special Issue Enhancement of Heat Transfer and Fluid Flow)

Abstract

:
The scavenging process is an important part of the two-stroke engine operation. Its efficiency affects the global engine performance such as power, fuel consumption, and pollutant emissions. Slow speed marine diesel engines are uniflow scavenged, which implies inlet scavenging ports on the bottom of the liner and an exhaust valve on the top of the cylinder. A CFD model of such an engine process was developed with the OpenFOAM software tools. A 12-degree sector of the mesh was used corresponding to one of the 30 scavenging ports. A mesh sensitivity test was performed, and the cylinder pressure was compared to experimental data for the analyzed part of the process. The scavenging performances were analyzed for real operation parameters. The influence of the scavenge air pressure and inlet ports geometric orientation was analyzed. The scavenging process is analyzed by means of a passive scalar representing fresh air in the cylinder. Isosurfaces that show the concentration of fresh air were presented. The variation of oxygen and carbon dioxide with time and the axial and angular momentum in the cylinder were calculated. Finally, the scavenging performance for the various operation parameters was evaluated by means of scavenging efficiency, charging efficiency, trapping efficiency, and delivery ratio. It was found that the scavenging efficiency decreases with the engine load due to the shorter time for the process. The scavenging efficiency increases with the pressure difference between the exhaust and scavenging port, and the scavenging efficiency decreases with the increase in the angle of the scavenging ports. It was concluded that smaller angles than the industry standard of 20° could be beneficial to the scavenging efficiency. In the investigation, the charging efficiency ranged from 0.91 to over 0.99, the trapping efficiency ranged from 0.54 to 0.83, the charging efficiency ranged from 0.78 to 0.92, and the delivery ratio ranged from 1.21 to 2.03.

1. Introduction

Sea transport was always very important for the world economy, since it is the most economical if the cost per ton of goods and per distance is the benchmark. The most efficient power device for the ship is the large, slow speed, two-stroke, diesel engine. The greenhouse gas emissions and other pollutants from fossil fuel combustion are an important topic. The maritime transport focused on the problem from the year 2000 [
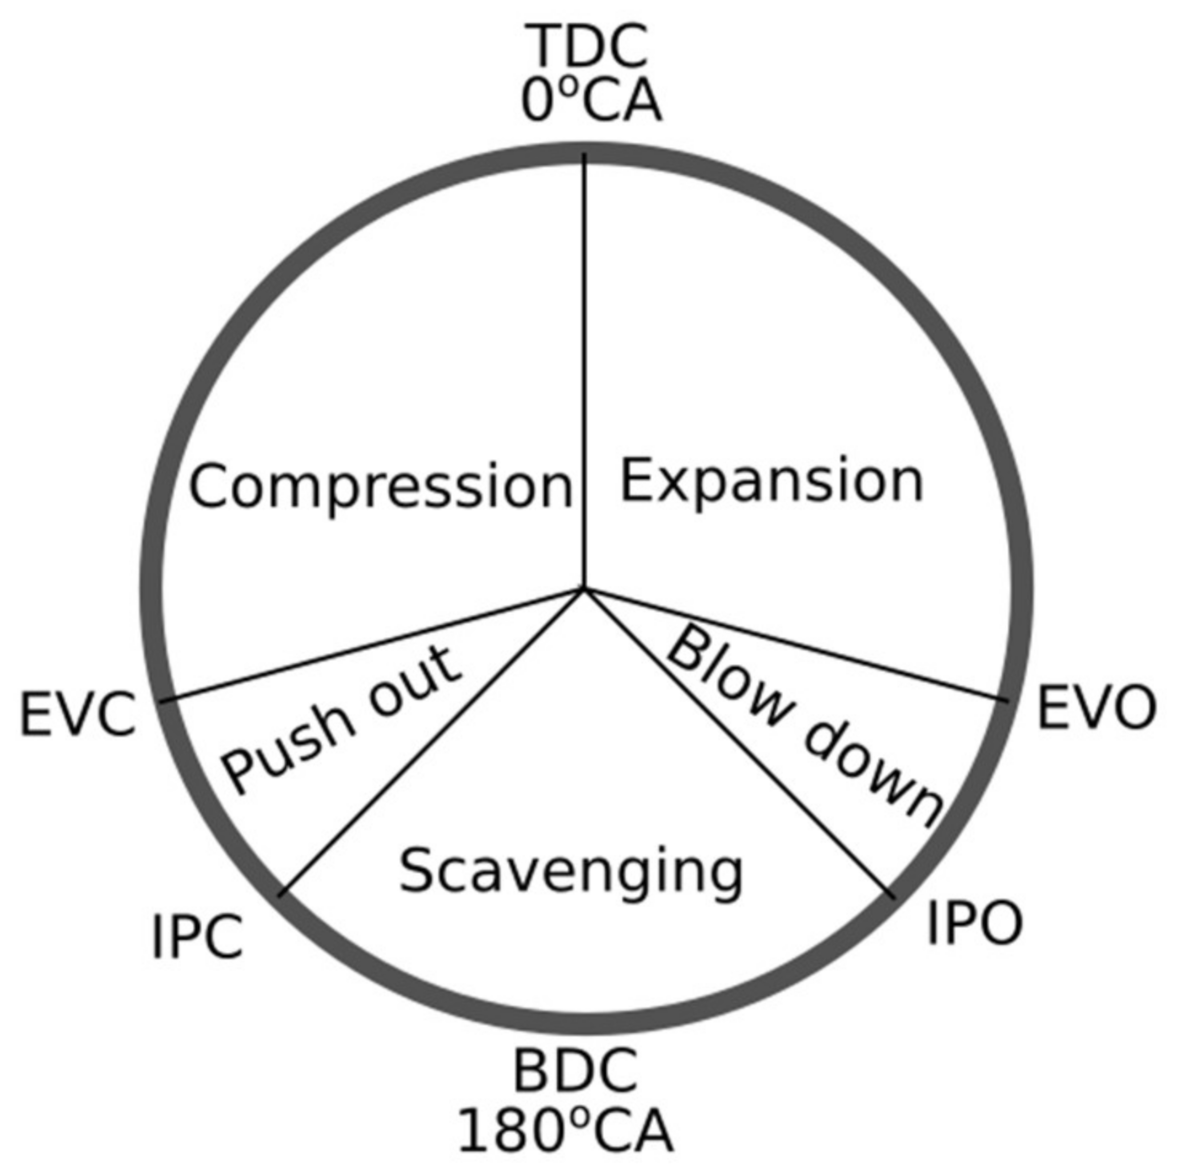
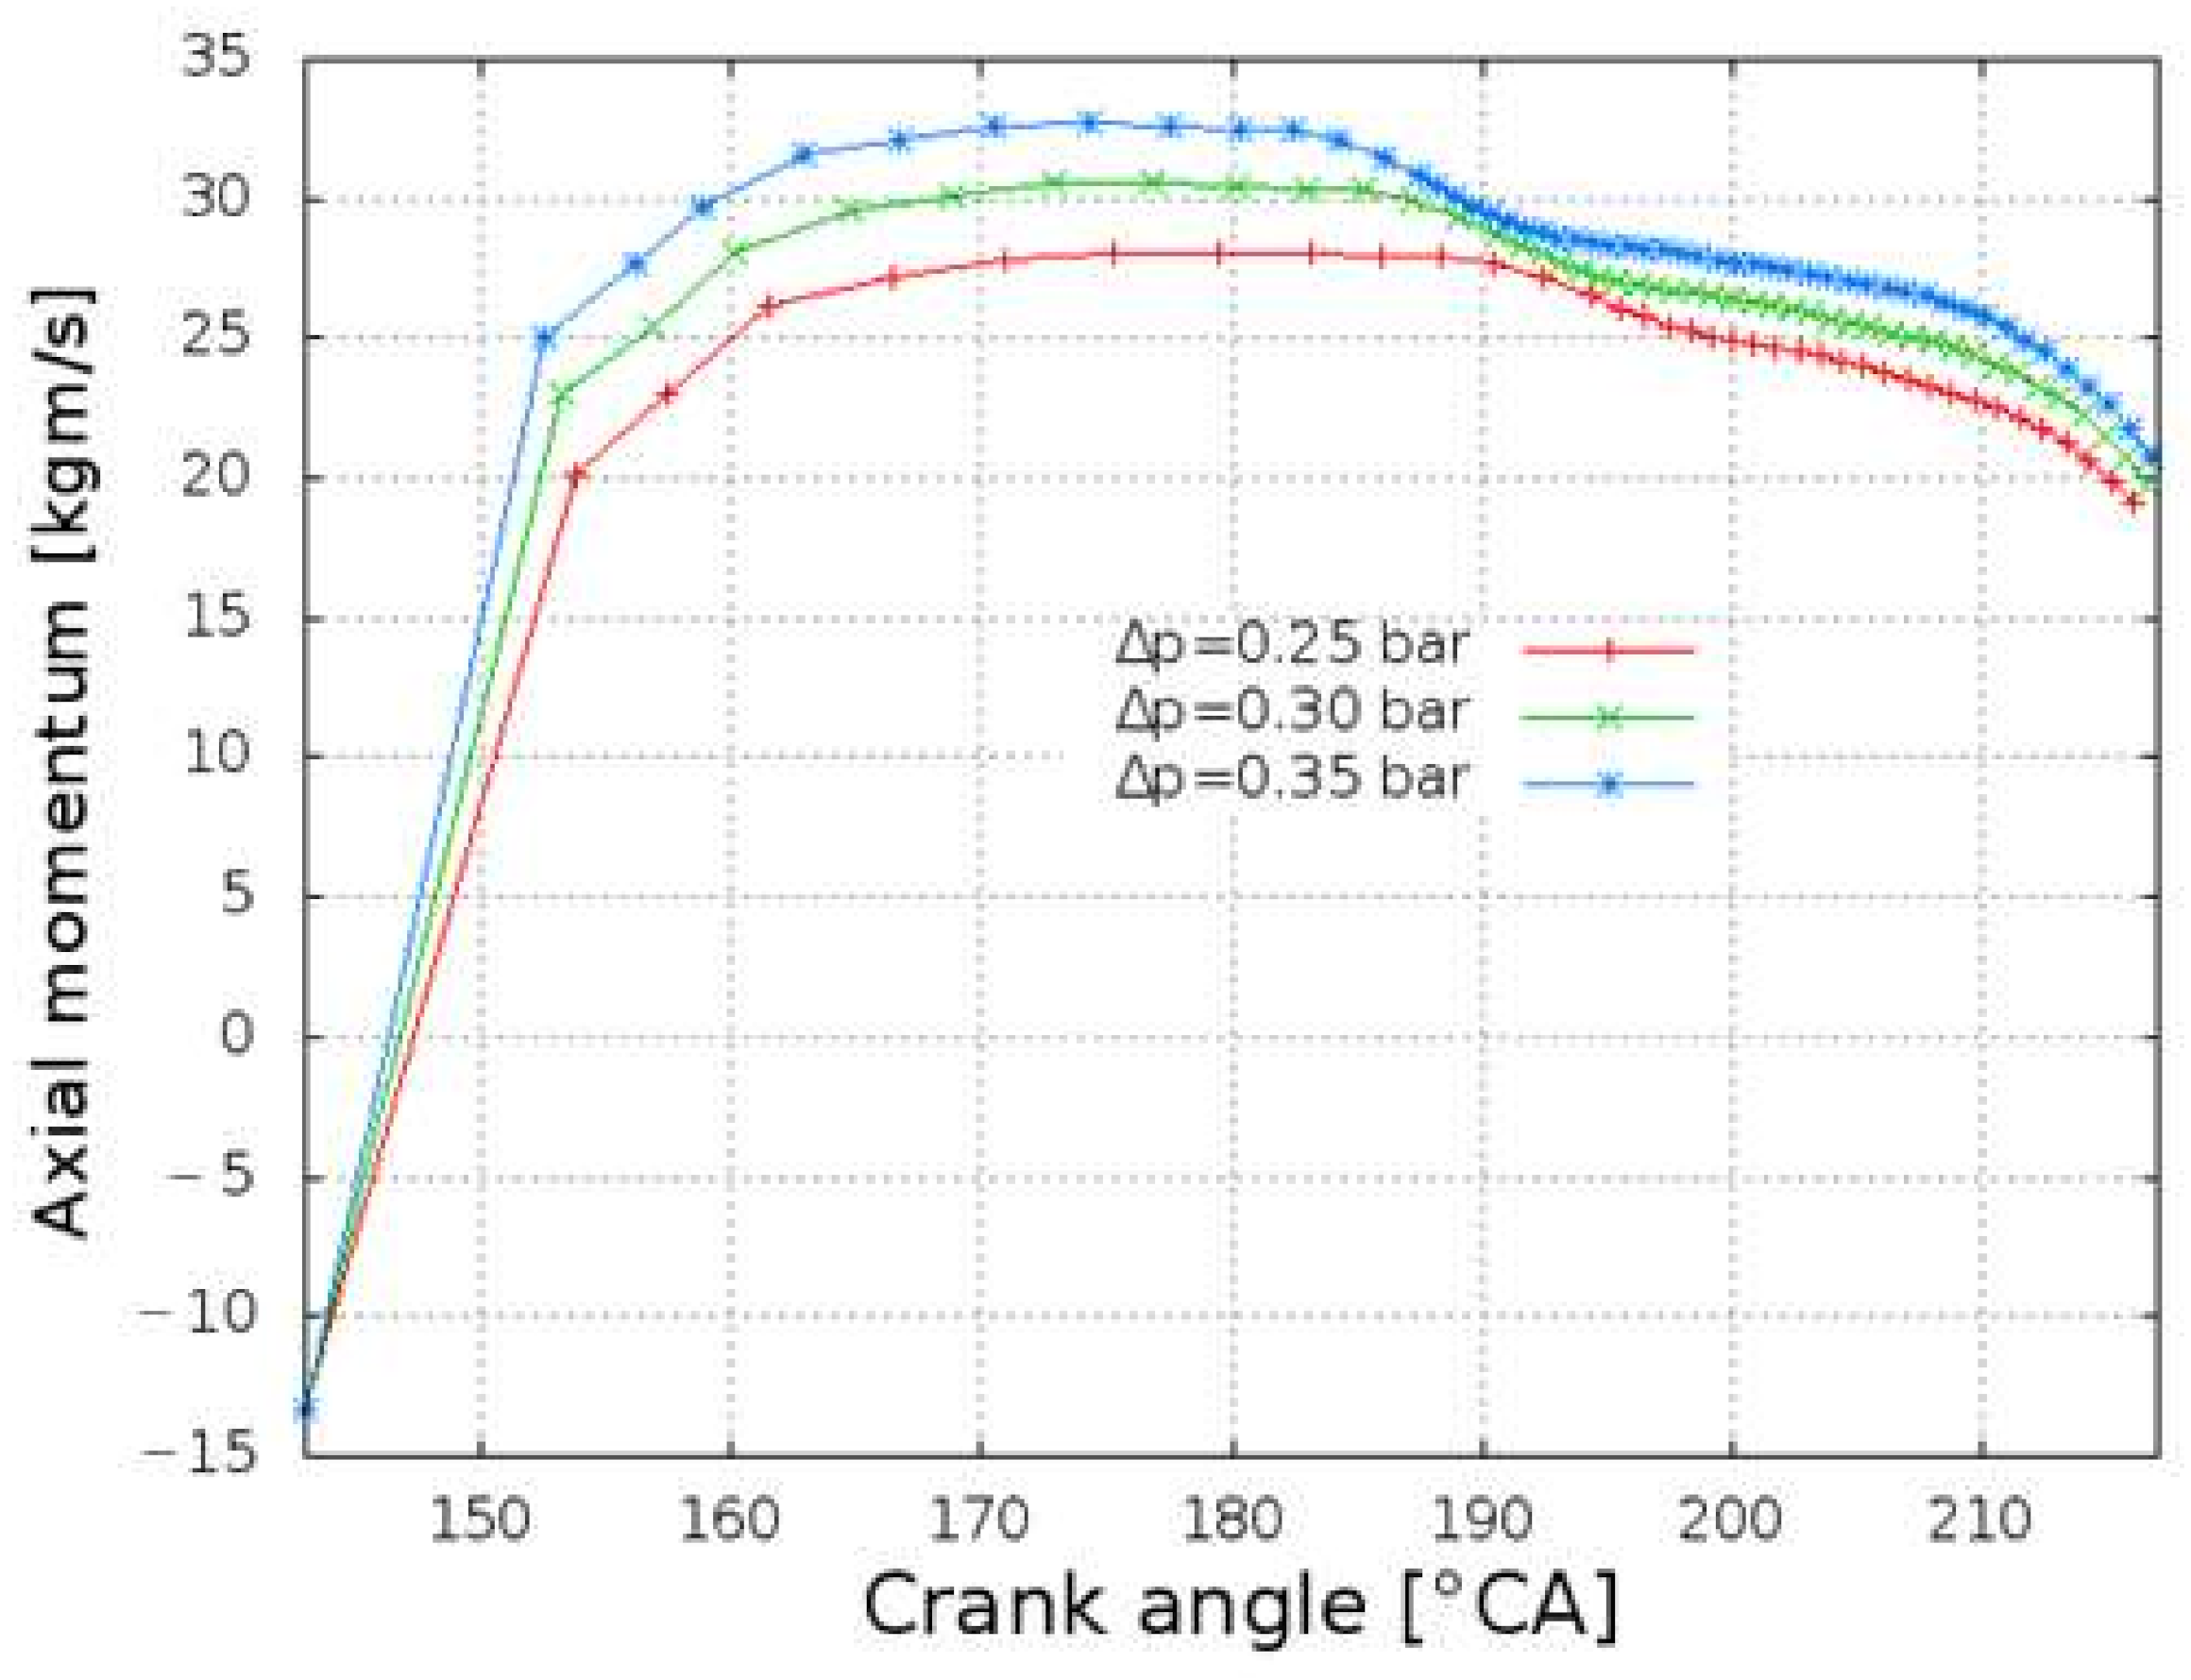
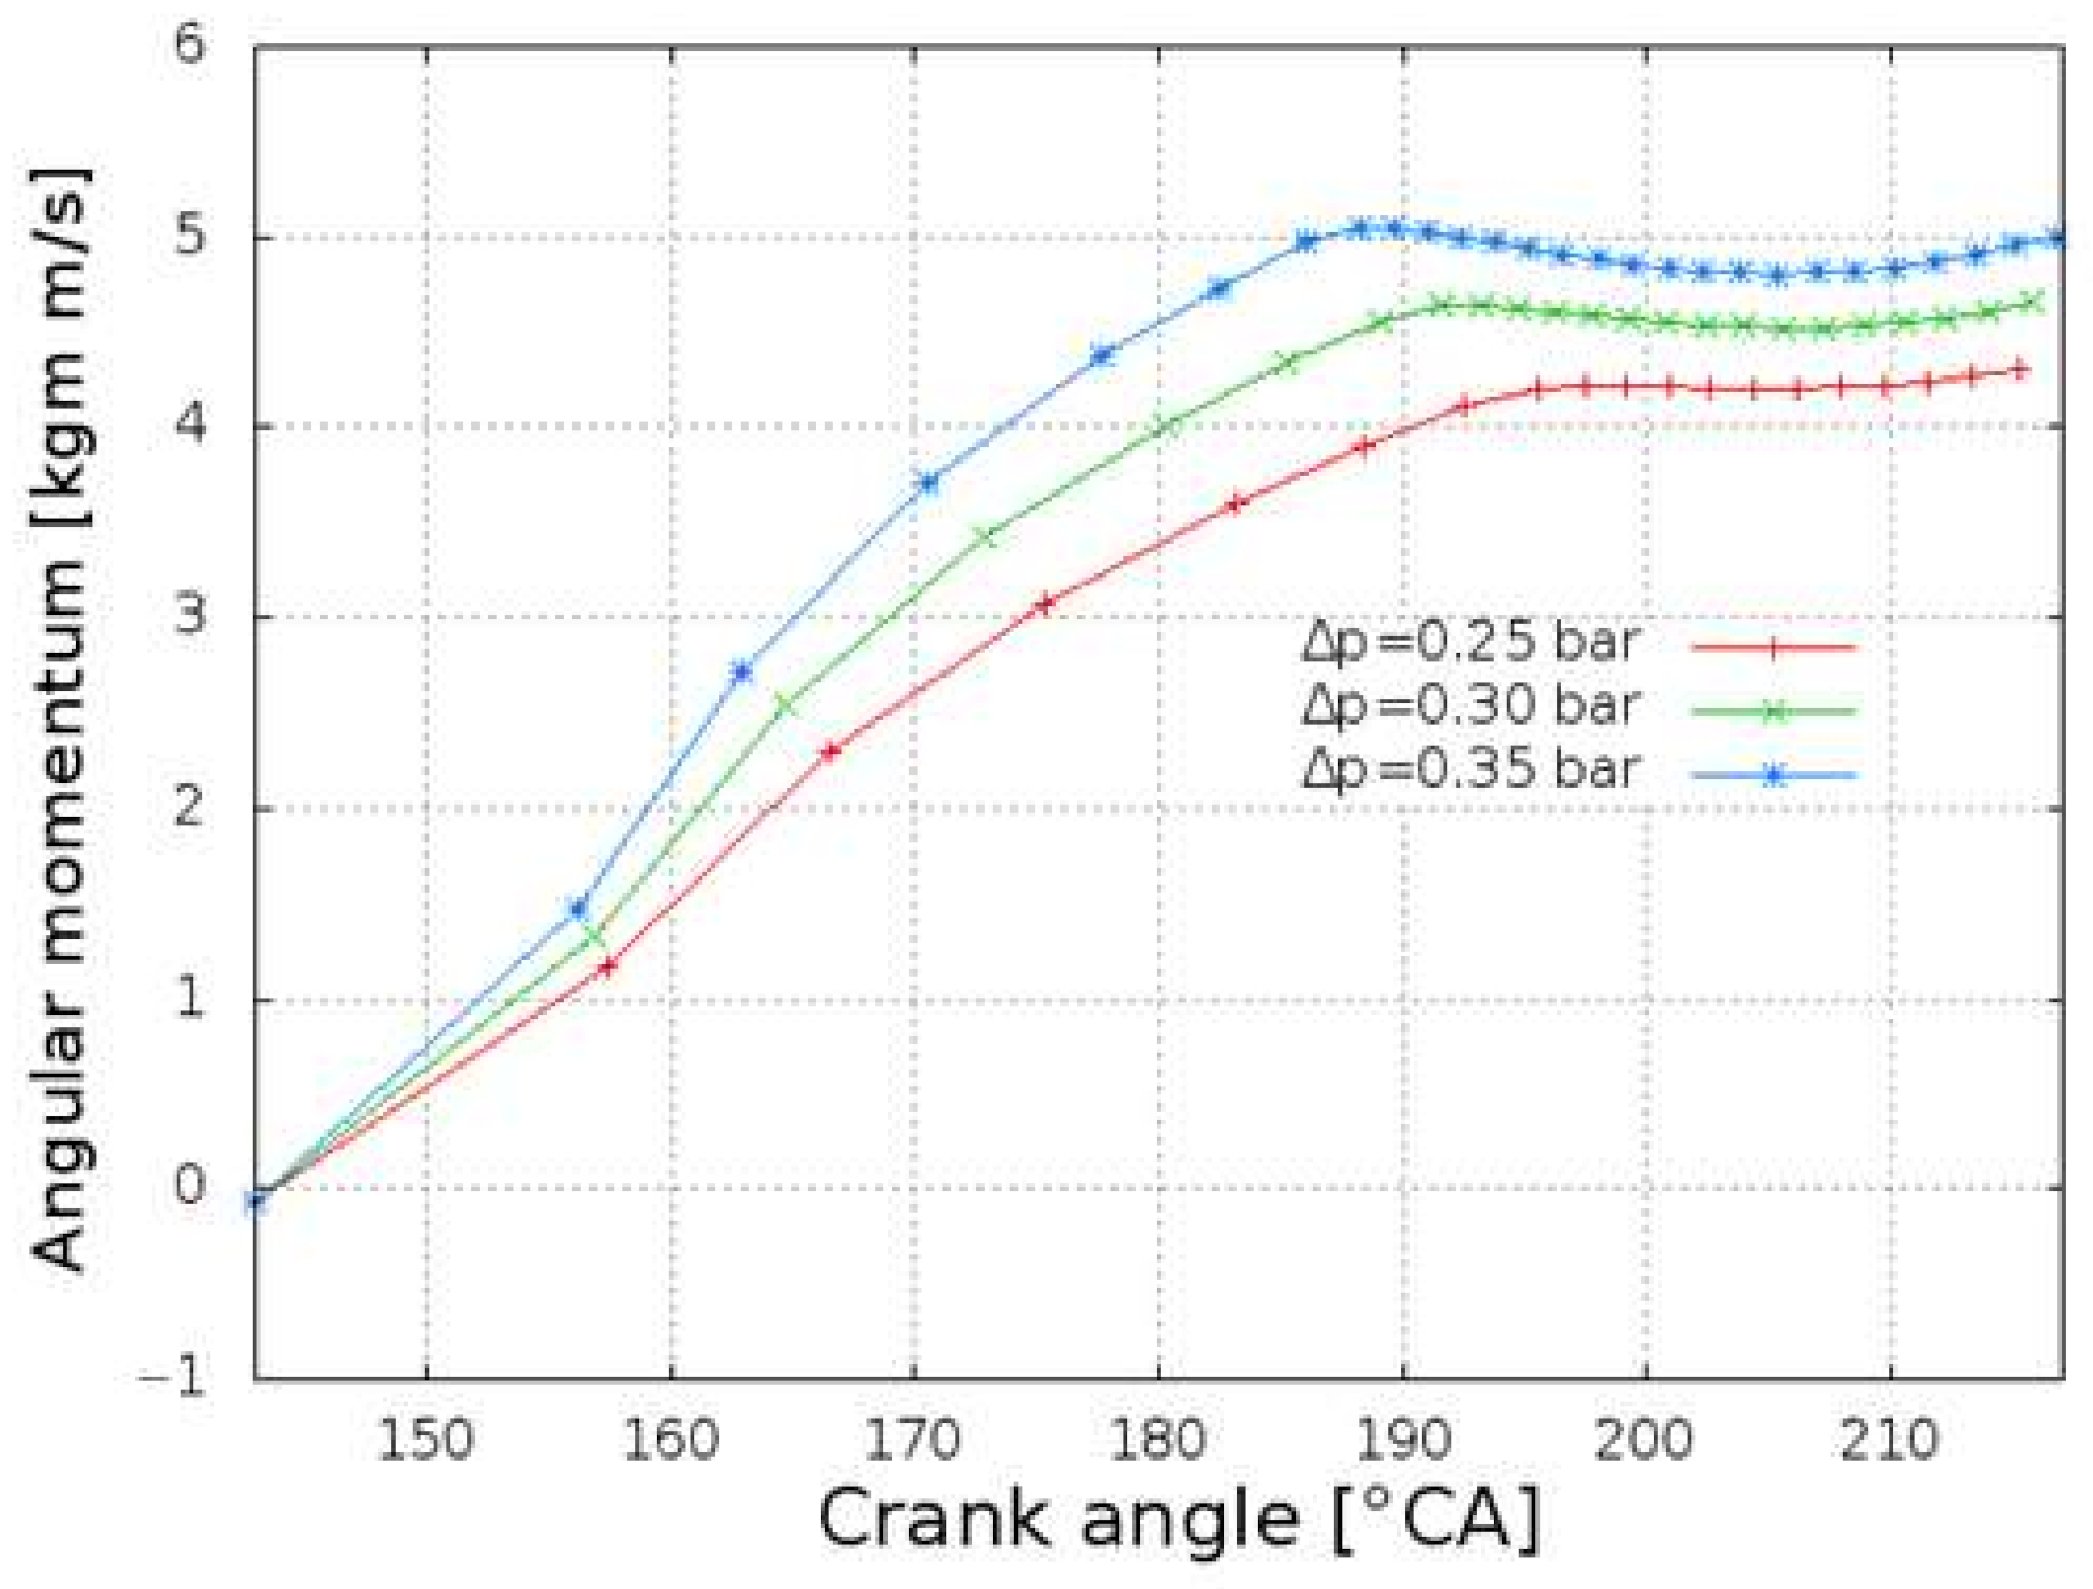
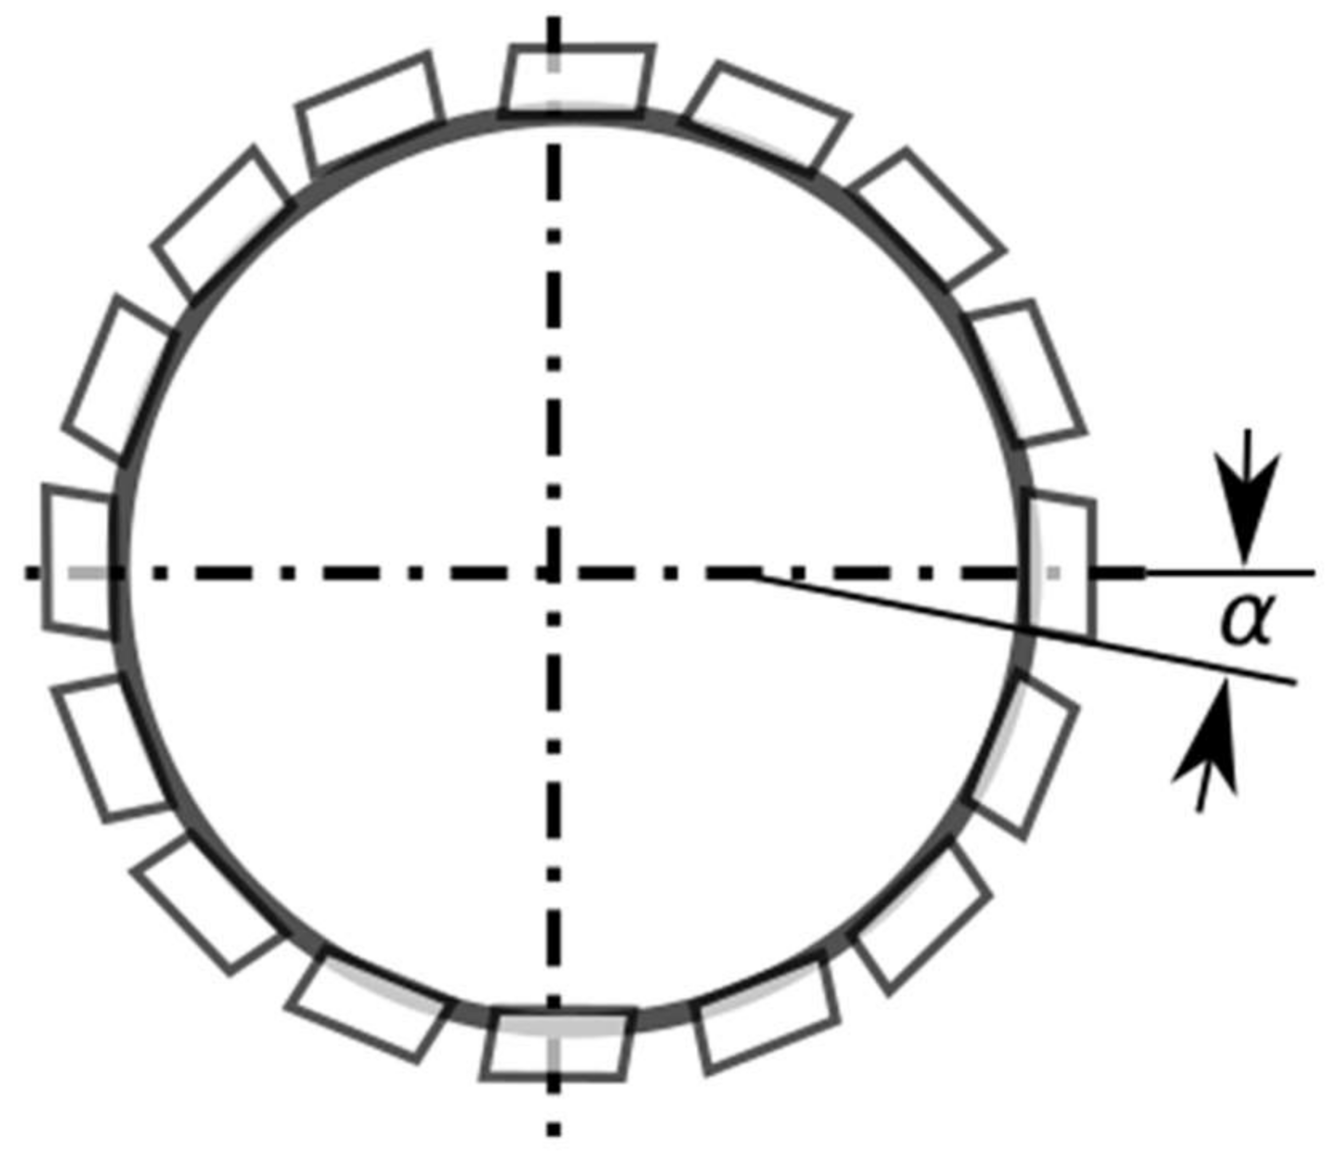
1], and after it, the topic became more and more important and the emission limits ever stringent. The NOx emissions have to be cut by 75% in most coastal areas from the year 2016. Even if there are some other competing technologies, the two-stroke engine remains practically the leading propulsion solution for many cargo ship types. The usual scavenging method for this type of engine is the uniflow scavenging. On the top of the cylinder, there is a centrally mounted, hydraulically operated exhaust valve. On the bottom of the liner, there are radially located scavenging ports that are opened when the piston moves to the bottom dead center and uncovers the ports. The scavenging process is essential for expelling the combustion products and replacing them with fresh air from the scavenging receiver. The scavenging ports are oriented with an angle (usually 20°) to the radial direction. This induces a swirling motion to the entering fresh air. The swirling motion enhances the scavenging process, liner cooling, and the mixing of the fuel with the air. Scavenging is influenced by the engine geometry, valve and port opening timing, and pressure difference between the scavenging receiver and exhaust duct [2]. The process is characterized by two typical problems: short-circuit losses and mixing. Short-circuit consists of escaping some of the fresh-air charge directly to the exhaust, and mixing means that there is a small amount of residual gases that remain trapped without being expelled. The process is hard to investigate because of the size and price of such engines and the relative scarcity of test engines worldwide. This is the reason for which CFD (Computational Fluid Dynamics) is the right tool to investigate the dynamics of the large marine diesel engine scavenging process. There are different types of commercial software that allow CFD analysis of engine processes. There are also some open-source projects that offer CFD analysis. OpenFOAM is such an open source, free of charge, CFD collection of solvers and libraries written in C++ [3]. For its availability, flexibility, and the collaboration between users, it is a good platform to use to approach uncommon CFD problems. Engine scavenging simulation needs to allow moving boundaries (piston and valve), variable surface inlet port, and all that with a very large domain. The solver engineFoam (a part of OpenFoam) was used as a basis for the simulations presented in this article [4,5].
Similar problems were analyzed by several authors. Lamas et al. [6] analyzed the scavenging process on a uniflow scavenged large marine engine by means of a CFD simulation. They used the ANSYS Fluent commercial software. To validate the numerical model, the in-cylinder pressure was compared with experimental measurements. The same authors in [7] performed a similar analysis on an opposed piston, two-stroke, diesel engine. They reported the influence of the number of inlet and exhaust ports, their configuration, and their inclination to the radial direction on scavenging performances. Sigurdsson et al. [8] developed an accurate CFD model of the scavenging flow in a marine diesel engine. The STAR-CD commercial software was used for the simulations and a 12° sector of the domain was simulated, corresponding to one of the thirty scavenging ports. The model was validated by comparing the tangential velocity for different discretization schemes and mesh densities and by comparing the simulated pressure to the experimentally measured one. They presented a detailed analysis of the scavenging flow and the conjugate heat transfer calculations for the piston crown.
Andersen in his PhD thesis [9] and in the series of related articles [10,11,12] performed a large marine engine scavenging process analysis. He used the OpenFOAM simulation software with the sliding interface and parallel computing functionality to get an advanced model of an experimental, two-stroke marine diesel engine. The model was validated by comparison to in-cylinder velocity measurements obtained with the Particle Image Velocimetry technique. The scavenging performances were analyzed for different operation points for various scavenge pressures and various scavenging port angles. A simple model to predict the scavenging process in marine two-stroke engines was derived.
Another thesis that analyzes the two-stroke engine scavenging process with OpenFOAM is that by Jönsson in [13]. In his report, he presents the methodology and the results of simulations of the flow in a stratified charged two-stroke engine. OpenFOAM was used for the simulations, and the results were compared to those obtained with commercial 1D and 3D software. Xu et al. [14] analyzed the swirl-loop scavenging process in an aircraft, two-stroke diesel engine. They observed the influence of the arrangement of the scavenge ports angles on engine performance. Particle Image Velocimetry experiments and Computational Fluid Dynamics (CFD) simulation are adopted to obtain the in-cylinder flow patterns.
Ghazikhani et al. [15] performed an experimental analysis of the influence of ethanol additives on a two-stroke engine performance, including on scavenging performances. Foteinos et al. [16] developed a phenomenological, three-zone, two-stroke engine scavenging model based on CFD simulation results. Ma et al. in [17,18,19] performed different analysis of the scavenging process of an opposed-piston folded cranktrain diesel engine. The tracer gas method is used to validate the accuracy of the scavenging profile. Wu et al. [20] analyzed the scavenging process of a two-stroke, free-piston engine. They used a 3D CFD model to investigate and optimize a wide range of parameters and obtained an 11% gain in scavenging efficiency. Jia et al. [21] analyzed the influence of valves and scavenging ports timing on the performance of a free-piston engine using Ricardo WAVE software. There were several other authors [22,23,24,25] that improved the understanding of the two-stroke engine scavenging process. Other investigations focus on advanced CFD methods that are used for complex marine problems based on implicit large eddy simulation and high-order methods [26,27,28]. Some important numerical details on low Mach number flows are presented in [29,30,31].
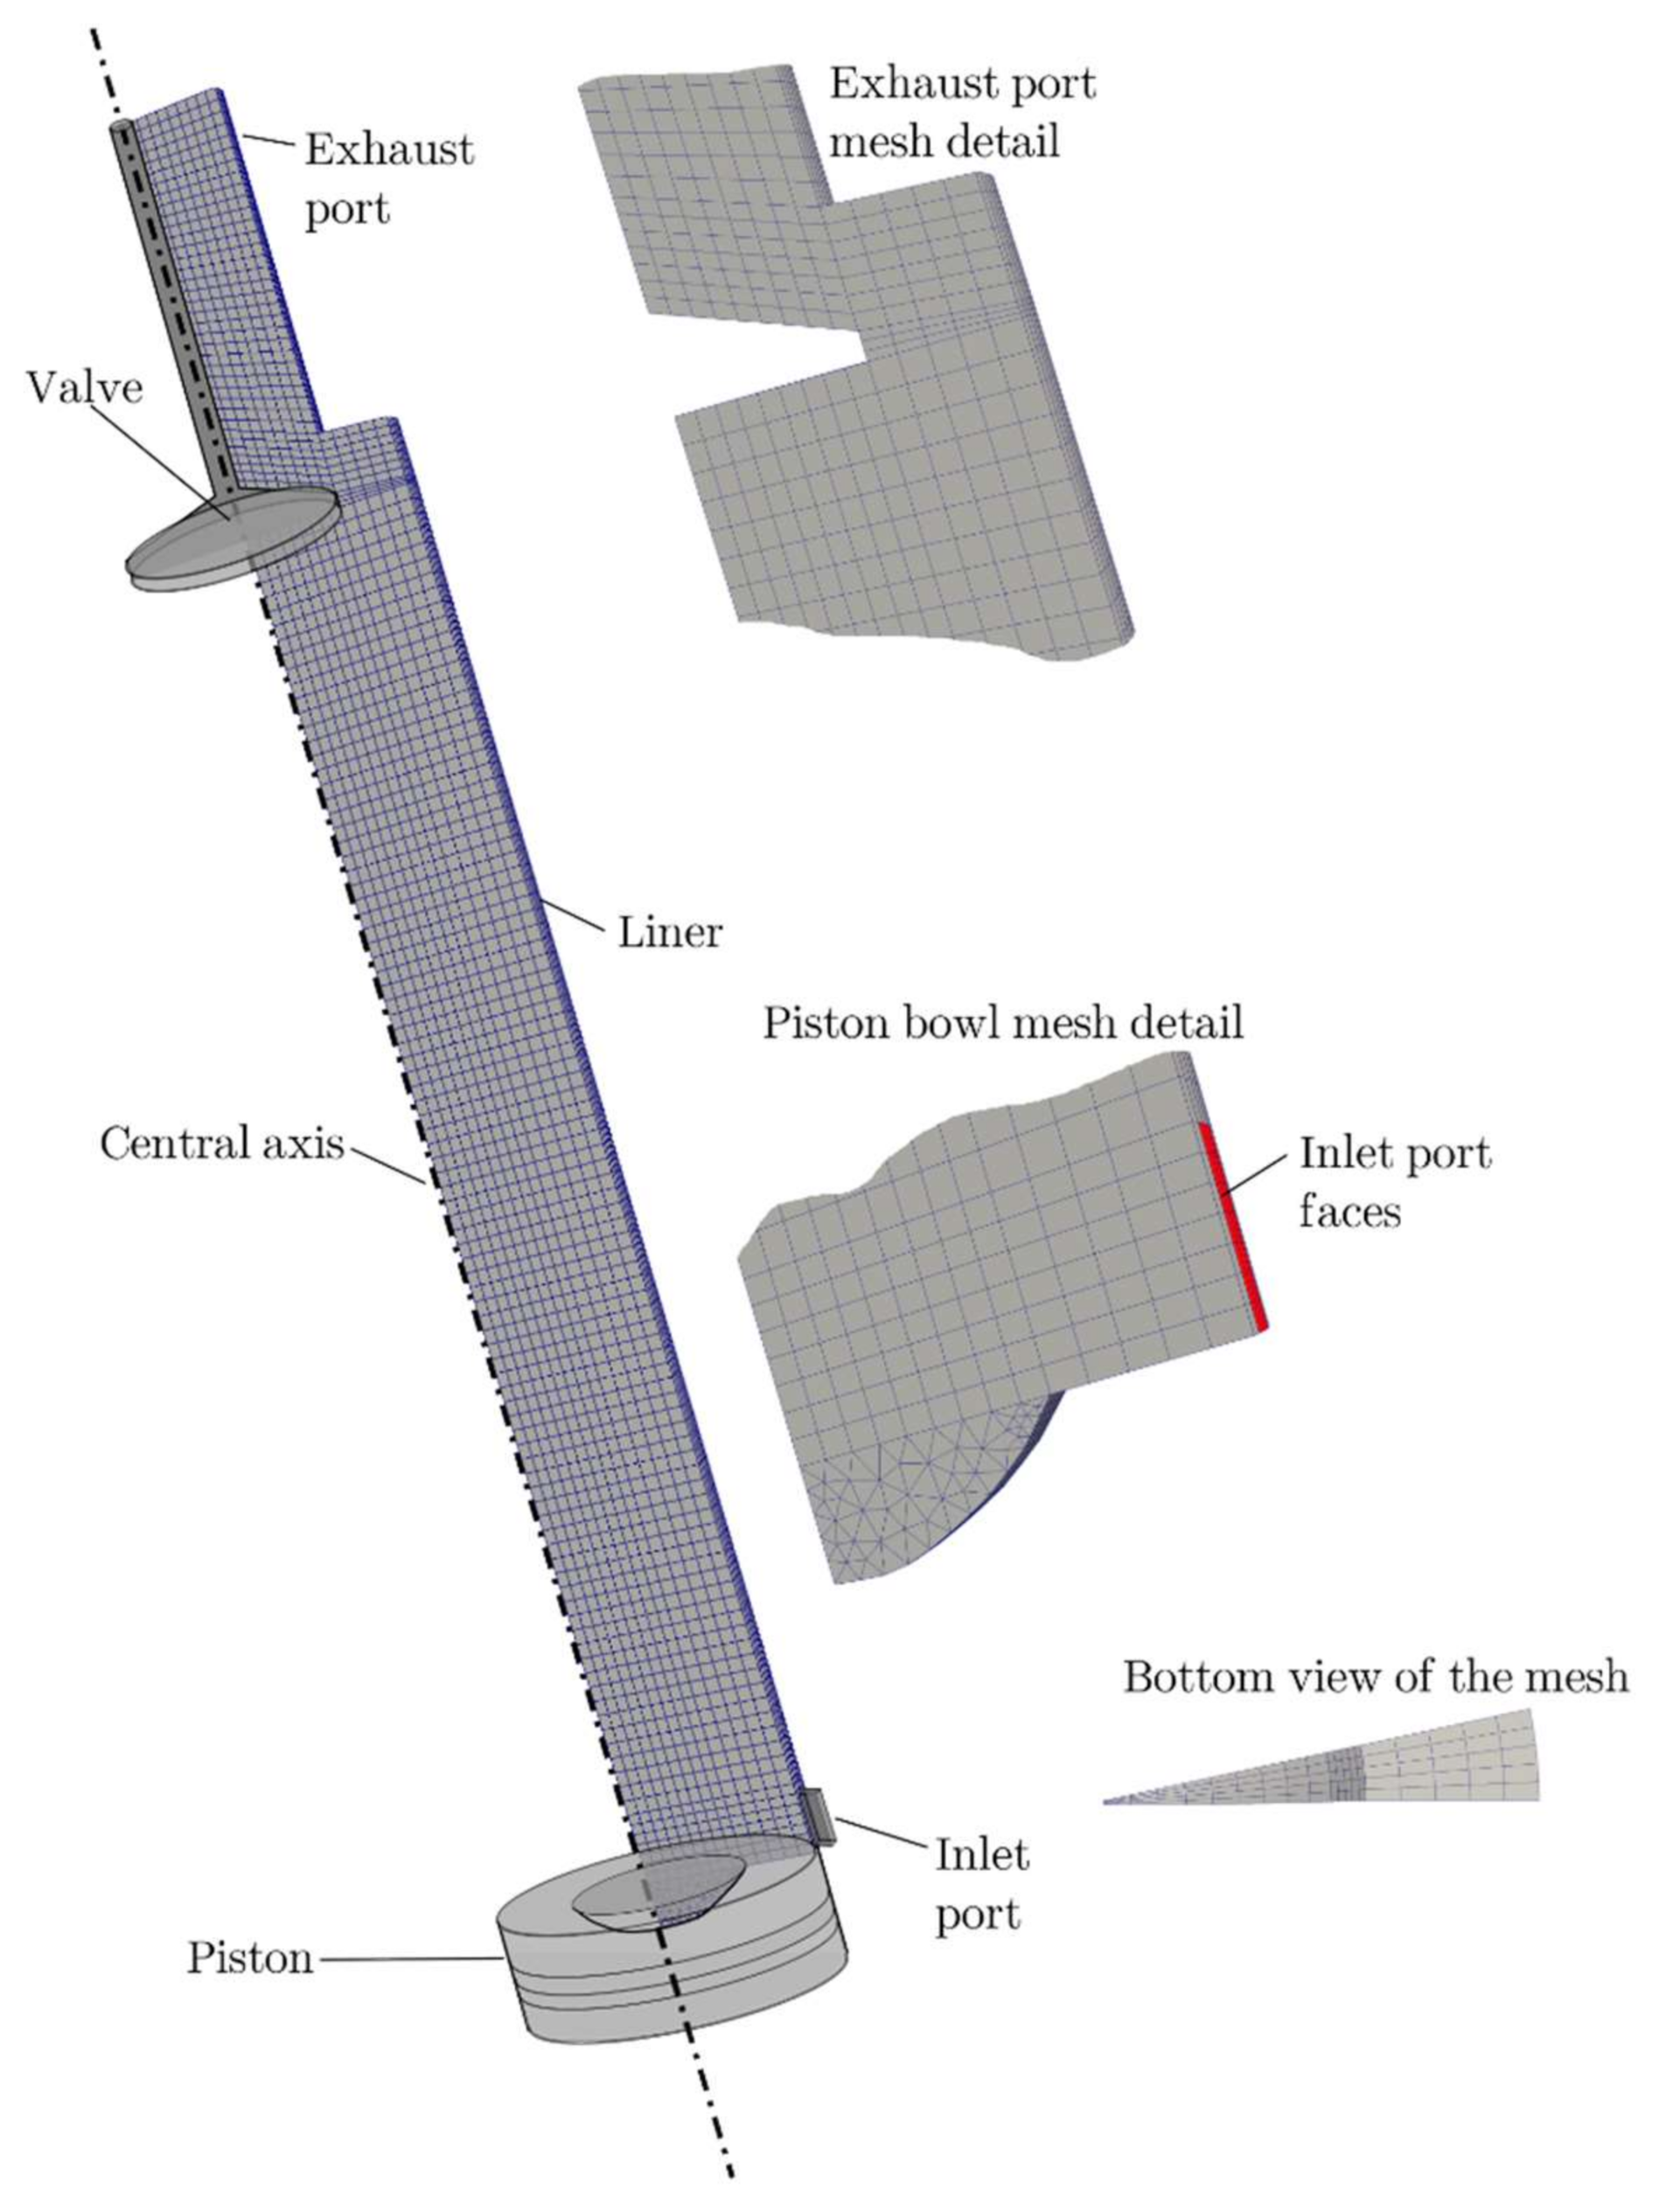
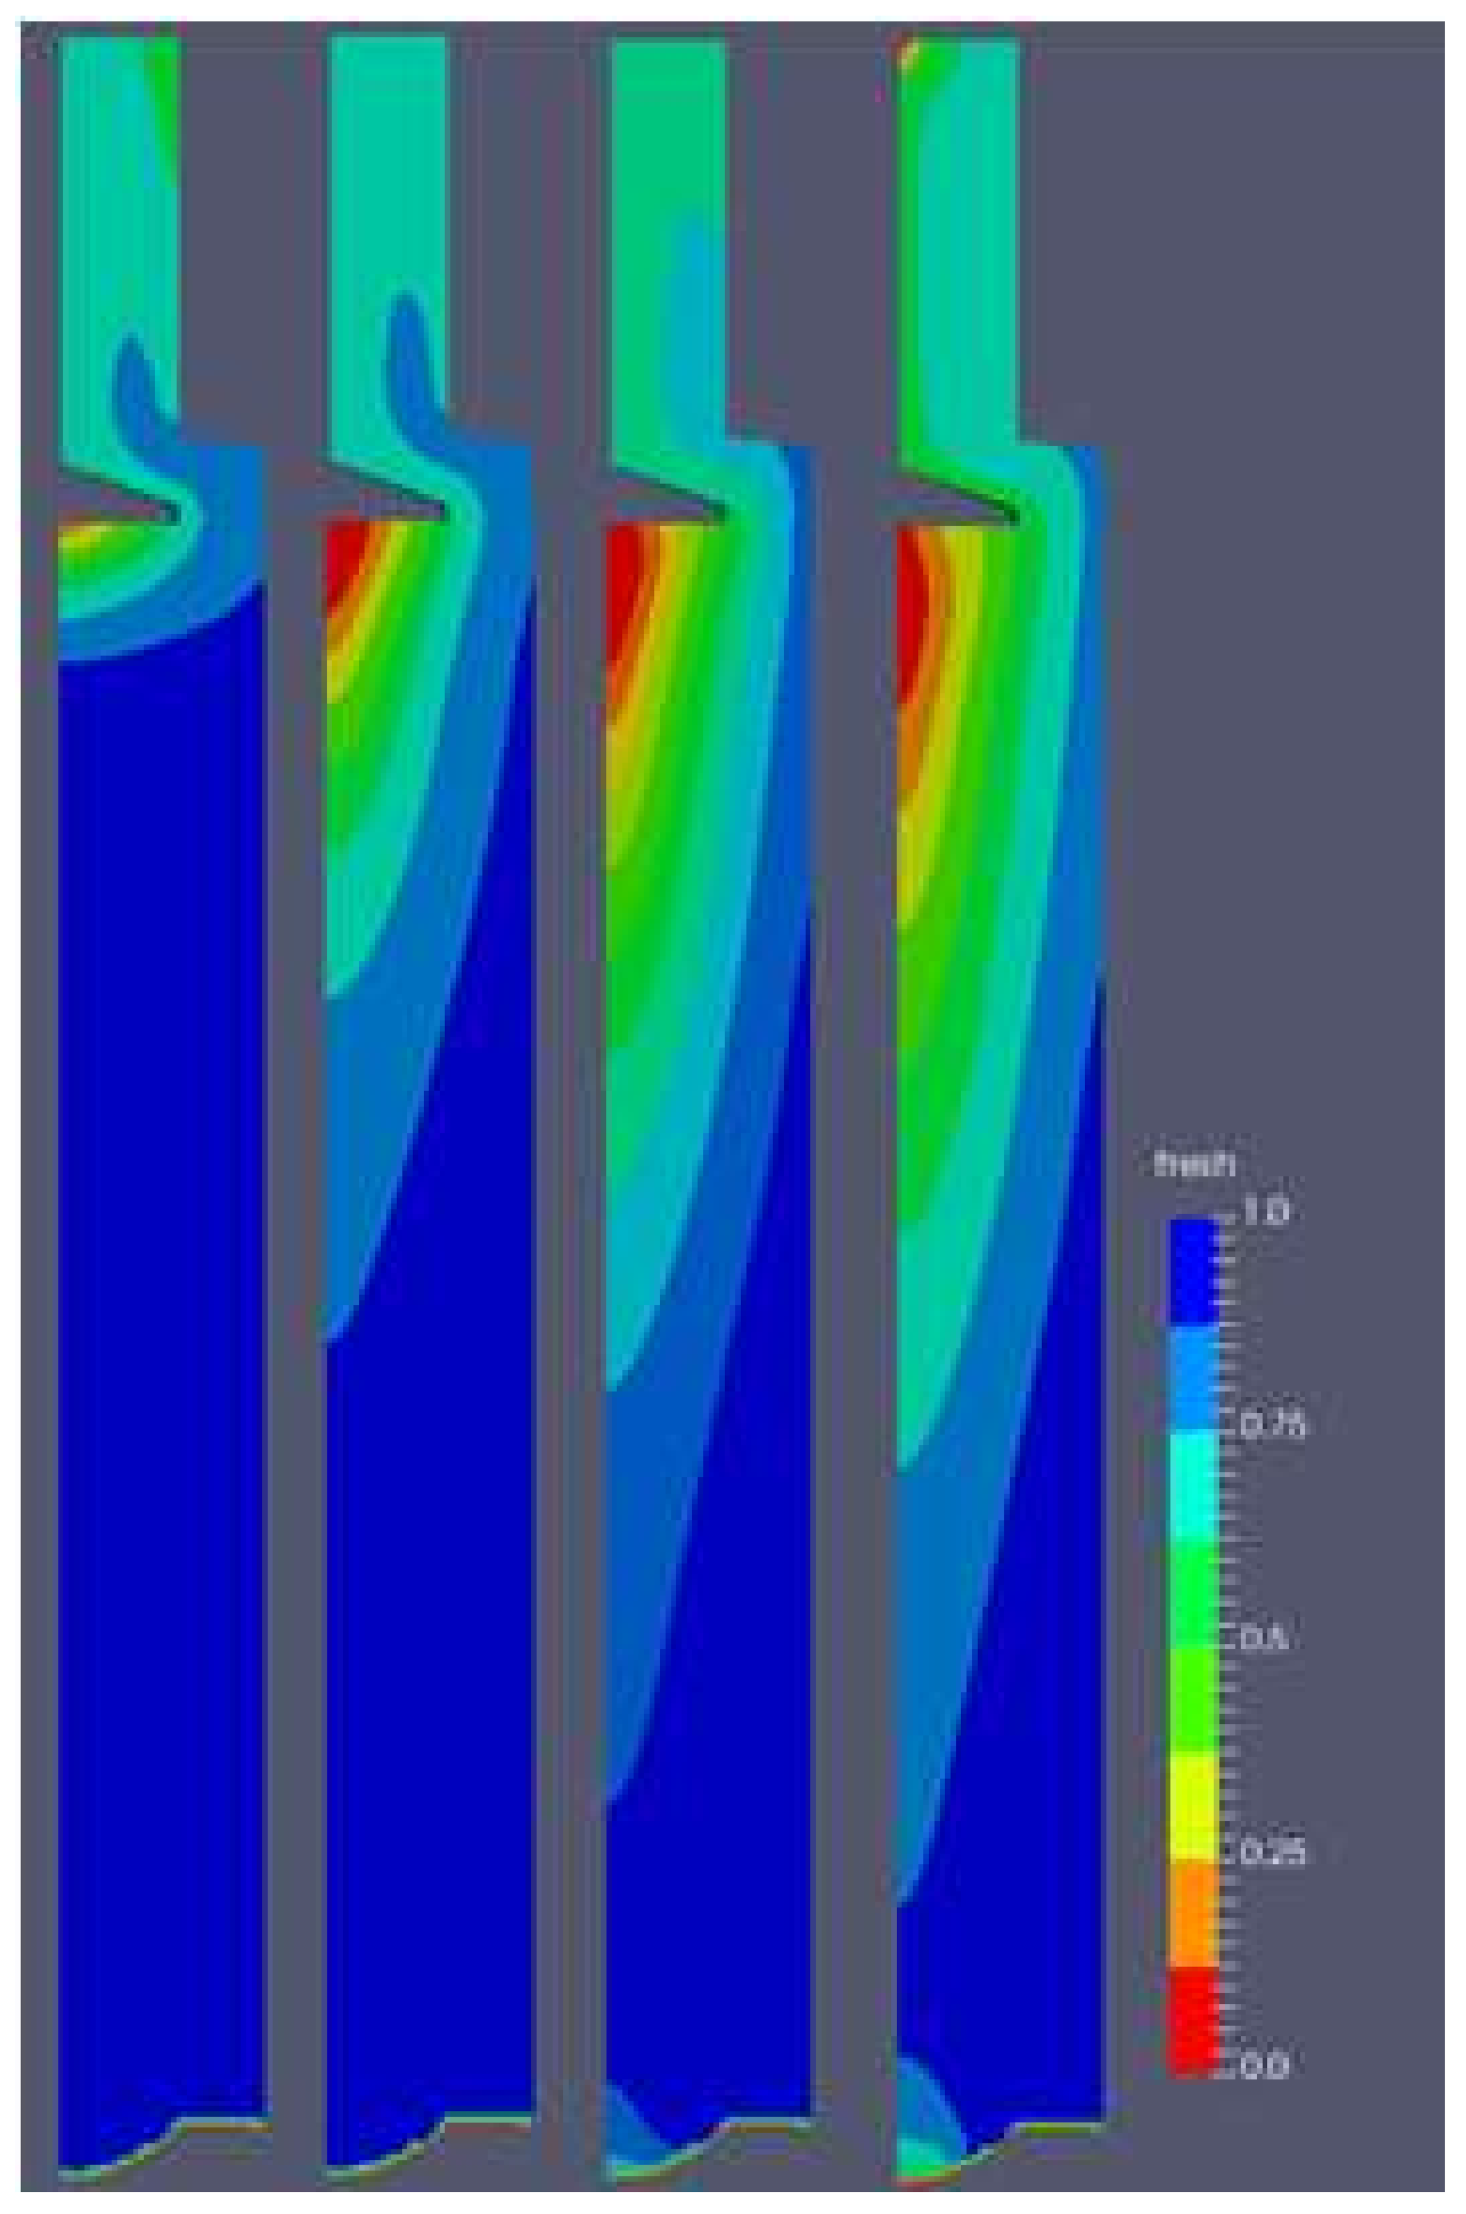
In the present paper, a CFD simulation of the gas exchange process during the scavenging of a large marine, two-stroke engine was performed. The free, open-source software OpenFOAM was used with a simplified sector mesh. The complex mesh (moving piston, moving valve, variable scavenging port area) was handled without sophisticated mesh manipulation procedures. Instead of using slidingInterface boundaries to connect and disconnect to the scavenging ports, the pressureDirectedInletVelocity boundary of the variable area was used. The short simulation time gave an opportunity to perform the simulation of several different cases.
After the introduction section where a contest and literature review were provided, the mathematical background is presented, including the scavenging parameters that were used. In the same section, some details about the engine used were provided alongside the description of the mesh generation process. Finally, in the second section, the validation of the model and the simulation procedure is provided. In the third section, the results are reported and discussed for the different operating regimes. First, the engine operation on different loads, then the scavenging process for different pressure differences among the scavenging and exhaust receiver, and finally, the influence of the scavenging port angle on the scavenging performance. The last section summarizes the conclusions of the analysis performed.

2. Materials and Methods

2.1. Mathematical Model

The OpenFOAM software was used to carry out the simulations. It is an open-source compilation of code written in the C++ programming language aimed to solve the Navier–Stokes equations based on the finite volume method [32]. In particular, the engineFoam solver was used. The transport equation for mass, momentum, sensible enthalpy, and chemical species are described by the following:
ρ ¯ t + · ( u ¯ ρ ¯ ) = 0 ,  
ρ ¯ u ¯ t + · ρ ¯ u ¯ u ¯ = p ¯ + · τ ¯ · ρ ¯ u u ¯ ,
ρ ¯ h ¯ t + ρ ¯ u ¯ h ¯ = D D t p + · ( λ c p h ¯ ρ ¯ h u ¯ ) + Q ¯ ,
ρ ¯ Y i ¯ t + · ρ ¯ u ¯ Y i ¯ = · ρ Γ Y i + R i ¯ · ρ ¯ Y i u ¯ ,
where ρ is the density, u is the gas velocity, p is the pressure, τ is the sheer stress tensor, h is the specific enthalpy, λ is the fluid conductivity, c p is the specific heat capacity at constant pressure, Q is a heat source, Y i is the species mass fraction of specie i, Γ is the species diffusion coefficient, and R is the reaction rate of specie i [33]. The overlined notation stands for the average value, while the double quotation marks denote the fluctuating components due to turbulence.
In order to track the concentration of fresh scavenging air, an equation for tracking a new passive scalar S was introduced:
ρ ¯ S ¯ t + · ρ ¯ u ¯ S ¯ = · ρ Γ S · ρ ¯ S u ¯ .  
The unknown Reynolds stresses (last term of the momentum equation) are solved by employing the Boussinesq hypothesis that is based on the assumption that in turbulent flows, the relation between the Reynolds stress and viscosity is similar to that of the stress tensor in laminar flows, but with increased (turbulent) viscosity:
· ρ ¯ u i u j ¯ = μ t ( u i x j + u j x i ) 2 3 ( ρ k + μ t u k x k ) δ i j ,
where μ t is the turbulent viscosity and k is the turbulent kinetic energy. The Reynolds stresses are closed with the standard k ε turbulence model. The model solves two additional transport equations: one for the turbulent kinetic energy k and the other for its dissipation rate ε . With k and ε , the turbulent viscosity can be determined by the following relation:
μ t = ρ ¯ c μ k 2 ϵ ,
where c μ is a model constant.
In order to evaluate the scavenging process, several parameters are used. They can be implemented in CFD code since the air mass flow over the inlet scavenging ports can be integrated. Moreover, it can be distinguished between the fresh air entered to the cylinder and the combustion products remaining from the previous combustion phase. These parameters are as follows: the scavenging efficiency, a direct measure of the ratio of fresh air to mixture in the cylinder at the moment of the closure of the exhaust valve,
η s c a v = mass   of   delivered   air   retained mass   of   trapped   cylinder   charge ,
the charging efficiency, which is the measure of the amount of scavenging air delivered, and the theoretical mass of air needed to fill the cylinder at ambient pressure and temperature, or in the case of turbocharged engines such as the large marine two stroke engine, at the conditions in the scavenging receiver,
η c h = mass   of   delivered   air   retained swept   volume   ·   ambient   density ,
the trapping efficiency, which is the measure of the fresh air that escapes to the exhaust port, the ratio of delivered air retained and the total mass of delivered air,
η t r a p = mass   of   delivered   air   retained mass   of   delivered   air ,
and the delivery ratio, which is the measure of total delivered air and the theoretical air mass needed to fill the cylinder at ambient conditions,
DR = mass   of   delivered   air   swept   volume   ·   ambient   density .
Furthermore, the average momentum of air in the cylinder can give a picture of the engine process during the combustion gas replacement. The angular momentum is computed in the code as:
M Φ = V r · ρ · v Φ d V ,
while the axial momentum is computed as
M z = V ρ · v z d V .

2.2. Engine Description

The engine studied in this paper is the MAN 6S50MC, a 6-cylinder, uniflow scavenged, two-stroke diesel engine aimed for ship propulsion. Its main characteristics are presented in Table 1, while a section drawing is presented in Figure 1. This engine was chosen in the present study since some measurement data, the geometry, and some working parameters were available to the authors. Each cylinder has a centrally mounted, hydraulically operated exhaust valve on the top. On the bottom of the liner, there are 30 scavenging ports that are oriented with an angle of 20° with respect to the radial direction, in order to induce a swirling motion of the fresh air. The engine is turbocharged, and the pressure in the inlet manifold varies with load. The pressure difference between the inlet and exhaust manifold is the driving force that promotes scavenging air flow through the cylinder.
The engine process is described in the following paragraph and represented in Figure 2. It starts around the top dead center (TDC) about 0° CA (crank angle) when after the fuel injection, the fuel is mixed with air and the combustion process starts. This is a very important and complex part of the process, and it is the core of the energy conversion from the chemical energy in the fuel to the mechanical energy of the crankshaft. It is directly responsible for pollutants formation, but it is usually analyzed separately from the scavenging part of the process. Combustion happens during the expansion, when the piston moves toward the bottom dead center (BDC). After the combustion is over, the exhaust valve opens (EVO—exhaust valve open). The pressure in the cylinder is higher than that in the exhaust port, and the combustion products flow due to the pressure difference to the exhaust during the blow down phase. The piston proceeds to the BDC, and the pressure decreases. The piston uncovers the inlet ports (IPO—inlet ports open) and the fresh air enters from the scavenging receiver to the cylinder through the angled ports, pushes the remaining exhaust gases to the exhaust port, and cools the liner. At the end of the scavenging, the piston covers the ports (IPC—inlet ports closed) and pushes the mixture of air and the remaining combustion gases to the top of the cylinder during the push-out phase. After the closing of the exhaust valve (EVC—exhaust valve closed), the new compression begins.

2.3. The Computational Mesh and Simulation Details

The mesh was built with Gmsh, the open source, 3D mesh generator, which can use parametric, text-style input. This allowed building different meshes in short time in order to have different valve lift and to test different mesh densities. There is an OpenFOAM utility, gmshToFoam, that translates Gmsh meshes to OpenFoam format. In order to save computing time, only a 12-degree sector was modeled, with cyclic boundaries, since the same pattern of the inlet scavenging port is repeated 30 times. A 3D hybrid mesh was used, which means that most of the parts are modeled with structured polyhedral elements. Some regions, such as the piston bowl, are modeled with tetrahedral elements. The domain is subject to a great deformation during the whole engine cycle; however, only the lower part of the piston run is simulated. Hence, only the deformation of the mesh is applied without topological changes. The push-out and the blow-down phases are modeled with several meshes, with different valve lift, and the results are mapped from mesh to mesh. The scavenging phase is modeled with a constant valve lift. The height of the inlet boundary changes as the piston moves. The “pressure directed inlet velocity” type of inlet boundary condition is used in order to specify the pressure on the inlet and the direction of the velocity that results from the pressure difference. This strategy was used instead of modeling the scavenging ports with the more complex sliding interfaces. The mesh, with enlarged valve and piston bowl details, is shown in Figure 3.
In order to check the independence of the results on mesh density, a mesh density sensitivity analysis was performed. Three meshes were used for the scavenging process. The first mesh had 9030 cells, the second had 13,195 cells, and the third had 21,280 cells. The differences among the cases between the results are within 5% along the scavenging process as regards cylinder pressure, fresh air fraction, and axial and tangential momentum. Hence, in order to save computational time and preserve precision, the intermediate mesh was used for the further simulations. This resulted with an average cell size of about 0.015 m. The duration of the simulation was about 150 min on a 3.6 GHz processor. The diagram of the total fresh air fraction in the cylinder (fresh air mass [kg]/total mass in cylinder [kg]) for the meshes with different cell numbers is presented in Figure 4. The Euler numerical scheme was used to solve the time derivative, while the gradient and divergence terms were solved with Gauss linear numerical schemes. The species transport was solved with a Gauss upwind numerical scheme. Table 2 brings the main information about boundary conditions. Pressure is set to zeroGradient on all the boundaries except for presout and inlet. The values for these boundaries can be seen in Table 3.

2.4. Validation

The experimental measurements of the scavenging process of large marine 2-stroke engines are complex and scarce. For a complete validation, the tracking of fluid speeds or flows at inlet ports and outlet valve should be applied. Hult et al. [34] used a Particle Image Velocimetry (PIV) setup to obtain the quantified data on the in-cylinder velocity during the scavenging process in large two-stroke marine engines. In the lack of such detailed experimental results, cylinder pressure history is used to validate to some extent the simulation data. Usual pressure history diagrams are made in order to evaluate the closed part of the engine process that includes combustion with maximum pressures well over 100 bar. Hence, the resolution and precision in the low-pressure (scavenging) part of the process is limited. A comparison of the cylinder pressure for the scavenging interval for the different engine load cases is reported in Figure 5. It can be seen that the pressure is, as expected, between that of the scavenging and exhaust receiver, as shown in Table 3, while the typical pressure oscillations are not reproduced by the simulation. It is clear that such a comparison of average domain pressure of the simulation to the measured pressure in a sensor spot is not hard evidence of the validity of the scavenging performance results, but it is often the best that can be done. This, in combination with the fact that the results obtained are similar to those obtained in other published works is retained as sufficient to proceed with the analysis.

3. Simulation Results and Discussion

3.1. Influence of Engine Load on the Scavenging Process

Some of the main initial and boundary conditions for the simulated loads are reported in Table 3. CFD simulations can track single chemical species and since the concentration of CO2 and O2 are of great importance in the engine combustion process, the concentration of these species is calculated and tracked in the present work. The initial values of the concentrations in the cylinder after the previous combustion process and the values of the concentrations in the scavenging air are reported in Table 4.
In the current section, the simulations for different engine loads are performed based on the initial and boundary conditions from Table 3. The cases are 25%, 50%, 75%, and 100% of the specified maximum continuous rating. To match the propeller curve for the appropriate ship speed, by varying the fuel injected, all engine parameters change: the engine speed (RPM), the cylinder pressures and temperatures, turbocharger speed, scavenge air, and exhaust gases temperature and pressure, and after a certain period, the engine part temperatures. All these boundary conditions influence the scavenging performances, which are presented as follows. In Figure 6, a longitudinal section of the cylinder is shown for the moment CA = 200°, with scavenging air represented in blue and exhaust gases in shades of green to red. Fresh air propagation is presented for the different loads from the left-hand side to the right: 25%, 50%, 75% and 100%. It can be seen that for the lower engine loads, the cylinder volume is efficiently filled with fresh air (dark blue area). Only the region at the cylinder center under the exhaust valve retains some remainder of the exhaust gases. For the higher loads, the exhaust gas region is wider, and higher concentrations of exhaust gas remain under the exhaust valve. It can be explained by the slower engine speed at lower loads, so the fresh air has more time at disposition to push the exhaust gas from the cylinder through the exhaust valve. Even if the pressure difference between the scavenging and exhaust receiver, and hence the driving force for the scavenging process, is greater for bigger loads, the longer period at disposition for the process is the dominant factor.
In Figure 7, the variation of concentration of O2 and CO2, the main species responsible for the combustion process, is presented. This kind of analysis is possible with CFD simulations, since they can track single species. It can be seen that the concentration of O2 has a faster rise for the low load cases. Consequently, also the concentration of CO2 decreases faster for the lower load cases.
The axial momentum of the working media through the cylinder is shown in Figure 8. The results do not show a clear influence of the load, as it was the case for the oxygen and carbon dioxide concentrations. For the 25% and 100% cases, there is negative momentum just after the opening of the scavenging ports, while for the other cases, there is a positive peak in this period. This can be explained by the fact that there are different driving forces that influence the fluid flow motion in the cylinder that interfere with each other: (1) there is the downward motion of the piston which induces a downward flow until the bottom dead center; (2) after the opening of the exhaust valve, there is an important pressure difference between the exhaust gases in the cylinder and the gases in the exhaust port, which induces a series of pressure–velocity oscillations along the axial direction of the cylinder; and (3) the pressure difference between the exhaust port and the scavenging port. The superposition of these driving forces can explain the chaotic influence of engine load on axial momentum. Nevertheless, in the later phase of the scavenging process, when the influence of the pressure difference between scavenging and exhaust port becomes prevalent over other driving forces, the higher load cases show higher axial flow.
The same theory is used to explain the chaotic behavior of the angular momentum presented in Figure 9. The momentum is positive for all the cases, since the scavenging ports are drilled with an angle of 20° with respect to the radial direction. This gives a rotational (swirl) motion to the scavenging air, which promotes a better washing of the exhaust gases, better air-to-fuel mixing, and liner cooling. However, the higher engine load does not result in a more intense swirling motion. In the first part of the scavenging process, the lower load case results in higher angular momentum, and the highest load results in the lowest angular momentum. In the second part of the process, the intermediate loads of 50% and 75% result in higher angular momentum. It is not intuitive, but it could be explained by the shorter time at disposition to develop the swirling flow pattern for the higher load cases or by a stronger influence of turbulent dissipation.
The scavenging parameters for different engine loads are presented in Table 5. In the first row, the delivered air mass is reported, which increases with engine load. The scavenging efficiency and the scavenging efficiency at the moment of the scavenging port closure are reported in the second and third row. It decreases with engine load mostly because of the shorter period for the process at higher RPM. The scavenging efficiency reflects the situation seen in Figure 6 and Figure 7. The charging efficiency reported in the next row shows a maximum value for the load of 50%, after which it decreases until 0.84 at 100% load. The delivery ratio, presented in the following row, decreases with the load increase. The trapping efficiency, presented at the bottom of Table 5, increases with the engine load.

3.2. Influence of the Pressure Difference on the Scavenging Process

At higher engine loads, the pressure difference between the scavenging and the exhaust port is higher, as can be calculated from Table 3. At lower loads, the pressure difference is lower, but then there is more time at disposition for the process, so scavenging is more efficient. Nevertheless, on the lowest loads, an electric motor-powered blower is used to supply a sufficient pressure difference. A more efficient turbocharger could supply fresh air at a higher pressure. In the present section, the influence of the variation of scavenging pressure separated from all other influences is analyzed. All the initial and boundary conditions are set as in the 100% load case from the previous section except for the inlet and outlet pressure, which are set as in Table 6.
The influence of the pressure difference on the scavenging process can be seen in Figure 10, where a longitudinal section of the cylinder is shown for the moment CA = 200°, with scavenging air represented in blue and exhaust gases in shades of green to red. It can be seen that an increased pressure difference promotes a faster propagation of fresh air and clearly smaller areas of burned gas under the exhaust valve.
The same trend is reflected by the increase in oxygen concentration and decrease in carbon dioxide concentration over time, as shown in Figure 11. The oxygen concentrations are higher, and the carbon dioxide concentrations are lower for the cases with greater pressure difference.
Figure 12 shows the variation over time of the axial momentum in the cylinder. As expected, it is more intense for the cases with bigger pressure difference over the whole analyzed period. For all the cases, the axial flow increases after the scavenging port opening, stays intense during the maximum port opening, and decreases gradually before the port closing. The angular momentum, as shown in Figure 13, is also more intense for the cases with a greater pressure difference between the scavenge and exhaust receivers. The swirl motion develops gradually after the port opening and reaches its maximum only after 50° CA.
Table 7 summarizes the influence of the pressure difference between the scavenging and exhaust port on the scavenging process. In the first row, the mass of fresh air that flows over the inlet boundary is integrated over time during the opening of the port. The increase in the pressure difference of 40% (from 0.25 to 0.35) results in the increase in mass flow of 19.3%. This results in a scavenging efficiency increase of 1.4% (from 0.928 to 0.942) at the moment of exhaust valve closure. At the moment of scavenging port closure, the scavenging efficiency increase is 3.8%. The charging efficiency is increased by 4.4%. The delivery ratio is increased by 16%. The trapping efficiency decreases with a bigger pressure difference, in this case by 7.6%.

3.3. Influence of the Scavenging Port Angles on the Scavenging Process

In this section, the influence of the scavenging port angle against the normal direction is analyzed, as shown in Figure 14.
The industry standard is 20°. However, it is supposed that smaller angles could decrease the swirl motion and the centrifugal force that is responsible for pushing fresh air toward the liner walls. This would decrease the walls’ cooling effect and air mixing with fuel. On the other hand, it could enhance the expelling of the burning products that remain in the central region under the exhaust valve. The cylinders with scavenging port angles of 0°, 10°, 20°, and 30° were simulated. This was achieved by specifying the inlet port velocity direction vector, as specified in Table 8. In Figure 15, the spread of the fresh scavenging air into the cylinder for different scavenging port angles is presented. It can be clearly seen that for lower port inclination, a greater portion of the cylinder is scavenged, and the quantity of remaining combustion products is lower. The fresh air that enters the cylinder has a greater density than the hot combustion products. Hence, the swirl motion that is a consequence of tangentially drilled ports generates a centrifugal force. This force influences more the higher density air, which is pushed toward the walls, while the hot gas remains in the central region. The hot gases remain trapped under the exhaust valve. Moreover, for the 20° and 30° port angle cases, a portion of combustion products remains trapped at the bottom of the cylinder.
Figure 16 shows the variation of CO2 and O2 concentration during the scavenging process. The graph summarizes what can be seen in Figure 14: the replacement of combustion gases with fresh air is more efficient for scavenging ports with smaller angles to the normal direction. It can be seen that the concentration of O2 rises fastest for the case with radial ports (0° inclination) and slowest for the 30° ports.
Figure 17 shows the axial momentum for different scavenging port angles. It can be seen that the lower angles develop a greater axial momentum. In other words, the average velocity of the fluid in the cylinder is greater in the positive z-direction, toward the exhaust valve. This is consistent with Figure 15 and Figure 16, since this momentum is responsible for the gas exchange process.
The angular momentum, or swirl intensity, is presented in Figure 18. The graph shows that for greater inclination angles, the angular momentum rises faster and reaches higher values, as expected. The swirl intensity rises until the moment CA = 190°, after which it remains almost constant or decreases slightly. It is unclear why even the 0° angle port case gets a small angular momentum in the same direction, and it continues to increase even after CA = 190°. The more intense swirl motion for greater port angles can explain the smaller intensity of the axial momentum. The velocity of the scavenging air is directed so that it supports the swirling motion, and the energy is consumed to maintain the swirl. Less energy is used to push the fluid to the exhaust port, which results in smaller axial momentum.
The influence of the scavenging port angle on the scavenging performance is summarized in Table 8. With a greater angle, the delivered mass of air through the ports decreases slightly because of the rising of the flow resistance. This adds to the smaller axial momentum and results in a decrease in scavenging efficiency for bigger angles. The charging efficiency decreases from 0.9203 to 0.7842 and the delivery ratio decreases from 1.4452 to 1.2176. The trapping efficiency, on the other hand, increases by a small amount with the increase in the port angle. The results indicate that the industry standard of 20° scavenging port inclination could be decreased as far as scavenging efficiency is concerned. The result is also supported to some extent by other papers [9]. However, the swirling motion is important also for air–fuel mixing and cylinder liner cooling.

4. Conclusions

A CFD model of a slow speed, large marine diesel engine was built with the use of an OpenFOAM software package. The engine uniflow scavenging process was analyzed using a 12-degree sector mesh. The mesh density sensitivity was analyzed, and the cylinder pressure was compared to the experimental measurement results. The following were found:
-
The open-source, free software package offers enough power and flexibility to allow the simulation of such a complex flow problem. The complexity consists of a large calculation domain with moving boundaries.
-
The problem of the size of the domain was attenuated by the use of cyclic boundaries and the simulation of just a 12-degree sector that embraces one of the 30 scavenging ports. The “pressure directed inlet velocity” type of inlet boundary condition is used instead of modeling the scavenging ports with sliding interfaces. Furthermore, a moderate mesh density proved to be adequate for the problem. It reduced the simulation domain and calculation time and allowed simulating many different cases.
-
The scavenging efficiency decreases with engine load but remains high enough for an efficient combustion. It is explained mostly by the shorter time available for the process because of the higher RPM. On the other hand, the driving forces responsible for the scavenging process, similarly to the pressure difference and the axial momentum, increase with load, but the effect is attenuated by the shorter time available.
-
The increased pressure difference between the inlet and exhaust improves all the scavenging parameters. Only the trapping efficiency is decreased, since more air is delivered. However, in practice, this method would require a more efficient turbocharger or more energy to power it.
-
The increase in the angle to the radial direction of the scavenging ports increases the angular momentum of the fluid in the cylinder at the expense of the axial momentum that drives the fluid exchange. As a consequence, the scavenging performances decrease. It can be concluded that the industry standard of 20° scavenging port inclination could be decreased as far as scavenging efficiency.
-
A pocket with remaining combustion gases is always found in the central region just under the exhaust valve. The region is bigger for higher loads, lower pressure difference, and greater scavenging port angle. In the worst cases, a pocket is found also in the cylinder center at the top of the piston.

Author Contributions

Conceptualization, T.S.; methodology, T.S. and V.M.; software, T.S. and I.W.; formal analysis, I.W.; data curation, T.S. and V.M.; writing—original draft preparation, T.S.; writing—review and editing, V.M., V.M.-V. and I.W.; visualization, V.M.-V.; supervision, I.W. All authors have read and agreed to the published version of the manuscript.

Funding

This research received no external funding.

Acknowledgments

Many details about the engine geometry, working parameters and measured values are made available by the staff of the shipyard “Brodosplit”.

Conflicts of Interest

The authors declare no conflict of interest.

References

  1. Skjølsvik, K.O.; Andersen, A.B.; Corbett, J.J.; Skjelvik, J.M. Study of Greenhouse Gas Emissions from Ships, Report to International Maritime Organization on the Outcome of the IMO Study on Greenhouse Gas Emissions from Ships; MARINTEK Sintef Group, Carnegie Mellon University, Center for Economic Analysis, and Det Norske Veritas: Trondheim, Norway, 2000. [Google Scholar]
  2. Heywood, J.B. Internal Combustion Engine Fundamentals; McGraw-Hill, Inc.: New York, NY, USA, 1988; pp. 235–245. [Google Scholar]
  3. OpenFOAM Software Page. 2021. Available online: https://www.openfoam.com/ (accessed on 18 June 2021).
  4. Jasak, H.; Weller, H.; Nordin, N. In-Cylinder CFD Simulation Using a C++ Object-Oriented Toolkit; SAE Technical Paper 2004-01-0110; SAE Mobilus: Washington, DC, USA, 2004. [Google Scholar] [CrossRef] [Green Version]
  5. Lucchini, T.; D’Errico, G.; Jasak, H.; Tuković, Ž. Automatic Mesh Motion with Topological Changes for Engine Simulation; SAE Technical Paper; No. 2007-01-0170; SAE International: Warrendale, PA, USA, 2007. [Google Scholar] [CrossRef]
  6. Lamas, M.I.; Rodríguez, C.G. Computational Fluid Dynamics Analysis of the Scavenging Process in the MAN B&W 7S50MC Two-Stroke Marine Diesel Engine. J. Ship Res. 2012, 56, 154–161. [Google Scholar] [CrossRef]
  7. Lamas, M.I.; Rodríguez, C.G.; Rodríguez, J.D.; Telmo, J. Numerical analysis of several port configurations in the Fairbanks-Morse 38D8-1/8 opposed piston marine engine. Brodogr. Teor. Praksa Brodogr. Pomor. Teh. 2015, 66, 1–11. [Google Scholar]
  8. Sigurdsson, E.; Ingvorsen, K.M.; Jensen, M.V.; Mayer, S.; Matlok, S.; Walther, J.H. Numerical analysis of the scavenge flow and convective heat transfer in large two-stroke marine diesel engines. Appl. Energy 2014, 123, 37–46. [Google Scholar] [CrossRef]
  9. Andersen, F.H. Integrated Analysis of the Scavenging Process in Marine Two-Stroke Diesel Engines. Ph.D. Thesis, Technical University of Denmark, Lyngby, Denmark, August 2015. [Google Scholar]
  10. Andersen, F.; Hult, J.; Nogenmyr, K.; Mayer, S. Numerical Investigation of the Scavenging Process in Marine Two-Stroke Diesel Engines; SAE Technical Paper 2013-01-2647; SAE Mobilus: Washington, DC, USA, 2013. [Google Scholar] [CrossRef]
  11. Andersen, F.; Hult, J.; Nogenmyr, K.; Mayer, S. CFD analysis of the scavenging process in marine two-stroke diesel engines. In Proceedings of the ASME 2014 Internal Combustion Engine Division Fall Technical Conference (ICEF2014), Columbus, IN, USA, 19–22 October 2014. [Google Scholar]
  12. Andersen, F.; Mayer, S. Parametric study of the scavenging process in marine two-stroke diesel engines. In Proceedings of the ASME 2015 Internal Combustion Engine Division Fall Technical Conference (ICEF2015), Houston, TX, USA, 8–11 November 2015. [Google Scholar]
  13. Jönsson, M. Stratified Scavenging Computations in Two-Stroke Engines Using OpenFOAM. Master’s Thesis, Chalmers University of Technology, Göteborg, Sweden, 2010. [Google Scholar]
  14. Xu, Z.; Ji, F.; Ding, F.; Zhao, Y.; Zhou, Y.; Zhang, Q.; Du, F. Effect of scavenge port angles on flow distribution and performance of swirl-loop scavenging in 2-stroke aircraft diesel engine. Chin. J. Aeronaut. 2021, 34, 105–117. [Google Scholar] [CrossRef]
  15. Ghazikhani, M.; Hatami, M.; Safari, B.; Ganji, D.D. Experimental investigation of performance improving and emissions reducing in a two stroke SI engine by using ethanol additives. Propuls. Power Res. 2013, 2, 276–283. [Google Scholar] [CrossRef] [Green Version]
  16. Foteinos, M.I.; Kyrtatos, A.P.N.; Stamatelos, A.; Zogou, O.; Stamatellou, A.M. A Three-Zone Scavenging Model for Large Two-Stroke Uniflow Marine Engines Using Results from CFD Scavenging Simulations. Energies 2019, 12, 1719. [Google Scholar] [CrossRef] [Green Version]
  17. Ma, F.; Zhao, C.; Zhang, F.; Zhao, Z.; Zhang, S. Effects of Scavenging System Configuration on In-Cylinder Air Flow Organization of an Opposed-Piston Two-Stroke Engine. Energies 2015, 8, 5866–5884. [Google Scholar] [CrossRef] [Green Version]
  18. Ma, F.; Zhao, Z.; Zhang, Y.; Wang, J.; Feng, Y.; Su, T.; Zhang, Y.; Liu, Y. Simulation Modeling Method and Experimental Investigation on the Uniflow Scavenging System of an Opposed-Piston Folded-Cranktrain Diesel Engine. Energies 2017, 10, 727. [Google Scholar] [CrossRef] [Green Version]
  19. Ma, F.; Zhang, L.; Su, T. Simulation Modeling and Optimization of Uniflow Scavenging System Parameters on Opposed-Piston Two-Stroke Engines. Energies 2018, 11, 940. [Google Scholar] [CrossRef] [Green Version]
  20. Wu, Y.; Wang, Y.; Zhen, X.; Guan, S.; Wang, J. Three-dimensional CFD (computational fluid dynamics) analysis of scavenging process in a two-stroke free-piston engine. Energy 2014, 68, 167–173. [Google Scholar] [CrossRef]
  21. Jia, B.; Wang, Y.; Smallbone, A.; Roskilly, A.P. Analysis of the Scavenging Process of a Two-Stroke Free-Piston Engine Based on the Selection of Scavenging Ports or Valves. Energies 2018, 11, 324. [Google Scholar] [CrossRef] [Green Version]
  22. Reuter, D. 2-Stroke Scavenging in Conventional and Minimally-Modified 4-Stroke Engines for Heavy Duty Applications at Low to Medium Speeds. Inventions 2019, 4, 44. [Google Scholar] [CrossRef] [Green Version]
  23. Ciampolini, M.; Bigalli, S.; Balduzzi, F.; Bianchini, A.; Romani, L.; Ferrara, G. CFD Analysis of the Fuel–Air Mixture Formation Process in Passive Prechambers for Use in a High-Pressure Direct Injection (HPDI) Two-Stroke Engine. Energies 2020, 13, 2846. [Google Scholar] [CrossRef]
  24. Qiao, Y.; Duan, X.; Huang, K.; Song, Y.; Qian, J. Scavenging Ports’ Optimal Design of a Two-Stroke Small Aeroengine Based on the Benson/Bradham Model. Energies 2018, 11, 2739. [Google Scholar] [CrossRef] [Green Version]
  25. Grljušić, M.; Tolj, I.; Radica, G. An Investigation of the Composition of the Flow in and out of a Two-Stroke Diesel Engine and Air Consumption Ratio. Energies 2017, 10, 805. [Google Scholar] [CrossRef] [Green Version]
  26. Thornber, B.; Starr, M.; Drikakis, D. Implicit large eddy simulation of ship airwakes. Aeronaut. J. 2010, 1162, 715–736. [Google Scholar] [CrossRef] [Green Version]
  27. Jasak, H.; Vukčević, V.; Gatin, I.; Lalović, I. CFD validation and greed sensitivity studies of full scale ship self propulsion. Int. J. Nav. Arch. Ocean Eng. 2019, 11, 33–43. [Google Scholar] [CrossRef]
  28. Viola, I.M.; Flay, E.G.; Ponzini, R. CFD analysis of the hydrodynamic performance of two candidate America’s Cup AC33 hulls. Trans. R. Inst. Nav. Archit. Part B Int. J. Small Craft Technol. 2012, 154, B1–B12. [Google Scholar]
  29. Guillard, H.; Murrone, A. On the behaviour of upwind schemes in the low Mach number limit: II. Godunov type schemes. Comput. Fluids 2004, 33, 655–675. [Google Scholar] [CrossRef] [Green Version]
  30. Thornber, B.J.R.; Drikakis, D. Numerical dissipation of upwind schemes in low Mach flow. Int. J. Numer. Methods Fluids 2008, 56, 1535–1541. [Google Scholar] [CrossRef]
  31. Salinas-Vázquez, M.; Vicente, W.; Barrios, E.; Martínez, E.; Palacio, A.; Rodríguez, A. A low-Mach number method for the numerical simulation of complex flows. Appl. Math. Model. 2013, 22, 9132–9146. [Google Scholar] [CrossRef]
  32. Versteeg, H.K.; Malalasekera, W. An Introduction to Computational Fluid Dynamics: The Finite Volume Method; Longman Group Ltd.: Essex, UK, 1995. [Google Scholar]
  33. El Abbassi, M.; Lahaye, D.J.P.; Vuik, C. Modelling turbulent combustion coupled with conjugate heat transfer in Open Foam. In Proceedings of the 10th Mediterranean Combustion Symposium, Naples, Italy, 17–21 September 2017. [Google Scholar]
  34. Hult, J.; Matlok, S.; Mayer, S. Particle Image Velocimetry Measurements of Swirl and Scavenging in a Large Marine Two-Stroke Diesel Engine; SAE Techincal Paper 2014-01-1173; SAE Mobilus: Washington, DC, USA, 2014. [Google Scholar] [CrossRef]
Figure 1. A section drawing of the low speed, two-stroke marine diesel engine MAN 6S50MC.
Processes 10 00141 g001
Figure 2. The uniflow scavenged two-stroke engine process.
Processes 10 00141 g002
Figure 3. The computational mesh with schematic insertions of the components, the exhaust port, and piston bowl zones enlarged and the bottom view of the mesh.
Processes 10 00141 g003
Figure 4. Influence of mesh density (number of cells) on the total fresh air concentration (fresh air mass [kg]/total mass [kg]) in the cylinder.
Processes 10 00141 g004
Figure 5. Cylinder pressure comparison for the scavenging interval.
Processes 10 00141 g005
Figure 6. Fresh air propagation for the moment CA = 200° for the loads of 25%, 50%, 75%, and 100%, from left to right. The depicted contours represent fresh air concentration (fresh air mass [kg]/total mass [kg]).
Processes 10 00141 g006
Figure 7. The variation of the concentration of O2 and CO2 over time for different engine loads.
Processes 10 00141 g007
Figure 8. The variation of axial momentum over time for different engine loads.
Processes 10 00141 g008
Figure 9. The variation of angular momentum over time for different engine loads.
Processes 10 00141 g009
Figure 10. Fresh air propagation for the moment CA = 200° for the cases with pressure difference 0.25, 0.3, and 0.35 bar respectively, from left to right. The depicted contours represent fresh air concentration (fresh air mass [kg]/total mass [kg]).
Processes 10 00141 g010
Figure 11. The variation of the concentration of O2 and CO2 over time for different pressure differences.
Processes 10 00141 g011
Figure 12. The variation of axial momentum over time for different pressure differences.
Processes 10 00141 g012
Figure 13. The variation of angular momentum over time for different pressure differences.
Processes 10 00141 g013
Figure 14. The scavenging port angle against the normal direction.
Processes 10 00141 g014
Figure 15. Fresh air propagation for the moment CA = 200° for the cases with scavenging port angles of 0°, 10°, 20°, and 30° respectively, from left to right. The depicted contours represent fresh air concentration (fresh air mass [kg]/total mass [kg]).
Processes 10 00141 g015
Figure 16. The variation of the concentration of O2 and CO2 over time for different scavenging port angles.
Processes 10 00141 g016
Figure 17. The variation of axial momentum over time for different scavenging port angles.
Processes 10 00141 g017
Figure 18. The variation of angular momentum over time for different scavenging port angles.
Processes 10 00141 g018
Table 1. Technical data of the engine MAN 6S50MC.
EngineMAN 6S50MC
Bore500 mm
Stroke1910 mm
Number of cylinders6
Power8656 kW
Rotational speed121 min−1
BMEP 118 bar
BSFC 2171 g/kWh
Compression ratio17.2
1 Brake Mean Effective Pressure; 2 Brake-Specific Fuel Consumption.
Table 2. Boundaries specifications for the simulation.
BoundaryTypeT (K)
pistonmovingWallVelocity575
linerfixedValue475
cylinderHeadfixedValue550
exhaustPortfixedValue475
presoutfixedValuecase dependent
valveStemfixedValue475
inletpressureDirectedInletVelocitycase dependent
valvefixedValue475
frontAndBackcyclic-
axissymmetryPlane-
Table 3. Simulation boundary conditions and initial settings.
Engine Load25%50%75%100%
RPM (min−1)7696110121
Scavenge air pressure (bar)1.392.032.763.55
Scavenging receiver temperature (°C)26293441
Exhaust receiver pressure (bar)1.31.862.513.26
Turbine inlet temperature (°C)308327346404
Initial cylinder pressure (bar)8888
Initial cylinder temperature (°C)400400400400
Table 4. Typical compositions of inlet air and exhaust gases.
Inlet Air (%)Diesel Exhaust (%)
N276.667
O223.410
CO2012
H2O011
Table 5. Scavenging parameters for different engine loads.
Engine Load25%50%75%100%
mdel (kg)0.03090.03980.05040.05456
ηscav0.9970.9790.9680.931
ηscav,IPC0.9968530.9776210.9660.917707
ηch0.8830.9240.9010.840
DR2.0311.6791.5631.315
ηtrap0.5440.6880.7210.798
Table 6. The pressure difference resulting from pressure in the scavenging and in the exhaust receiver.
Pressure Difference (bar)0.250.30.35
Inlet pressure (bar)3.53.553.6
Exhaust pressure (bar)3.253.253.25
Table 7. Scavenging parameters for different pressure differences.
Pressure Difference (bar)0.250.300.35
mdel (kg)0.05060.05570.0604
ηscav0.9280.9310.942
ηscav,IPC0.90160.92180.9369
ηch0.8210.8440.865
DR1.2371.3421.435
ηtrap0.8300.7870.754
Table 8. Scavenging parameters for different scavenging port angles.
Port Angle10°20°30°
Inlet velocity components−1, 0, 0−0.98, 0.17, 0−0.94, 0.34, 0−0.87, 0.5, 0
mdel (kg)0.059960.058130.054560.05051
ηscav0.9710.9720.9310.912
ηscav,IPC0.9670.9530.9180.879
ηch0.92030.89650.83970.7842
DR1.44521.40131.314991.2176
ηtrap0.79600.79970.79820.8051
Publisher’s Note: MDPI stays neutral with regard to jurisdictional claims in published maps and institutional affiliations.

