Article

Types of Major League Baseball Broadcast Information and Their Impacts on Audience Experience

Department of Industrial Design, National Taipei University of Technology, Taipei 10608, Taiwan
*
Author to whom correspondence should be addressed.
Informatics 2022, 9(4), 82; https://doi.org/10.3390/informatics9040082
Submission received: 1 September 2022 / Revised: 27 September 2022 / Accepted: 28 September 2022 / Published: 10 October 2022

Abstract

:
Baseball is a sport that involves a large number of statistics, which are often displayed during broadcast events to show the players’ performance levels. With the advent of big data, the amount and types of data used in broadcasts have increased yearly. However, the use of complex information challenges the audience’s ability to process it. This study considered data types used during broadcasts as the basis for an in-depth exploration of audiences’ experience resulting from the application of visualization. The study also examined the relationship between the contents of broadcast information and audiences’ sports participation, entertainment experience, and cognitive load. Baseball fans with varying levels of experience with handling different types of information were surveyed to understand the variations in their entertainment experiences and cognitive load levels when they watched a baseball game. The results indicated that fans with low participation levels had insufficient viewing experience, such that the use of visualized statistical information did not facilitate their understanding of the game, nor did they gain more pleasure or meaning from the game through the visualized information. Fans with high participation levels already possessed a wealth of baseball knowledge and experience, so providing visualized information did not significantly elevate their viewing experiences either. Moreover, the visualized information caused them to experience varying amounts of additional cognitive load. These results provide a reference that can be used to design sports broadcasts tailored to different information types and fan characteristics, thus improving fans’ viewing experience of sports broadcasts.

1. Introduction

Data are pervasive during sports broadcasts, with most television (TV) sports broadcasts displaying various statistics and information on the players and teams during a game. The increase in the amount of sports data being presented is related to the need to satisfy audiences’ social and economic needs [1,2]. Concerning the economic aspect, some sports spectators participate in sports wagering and need to delve deeply into sports data to make better bets; other sports fans compare data on sports players and teams to better predict game outcomes [3]. They do so in the hope of winning prizes offered by sports wagering [4]. Regarding the social aspect, viewers use sports data to share insights into sports events on social media and express their excitement after watching sports broadcasts [5,6]. Experienced sports fans take pride in their wealth of sports knowledge and treat it as a second language when communicating with fellow fans [7]. Many sports fans are also motivated to seek relevant information before a game and expect to search for additional information after it [8,9].
Fantasy sports enthusiasts similarly need to pay attention to statistics and are eager to learn about the achievements and records of individual sports players because the better a player’s performance is in real-world competitions, the better are the statistics of the virtual team to which the player belongs. This information helps fantasy sports enthusiasts build their ideal virtual teams [10]. Playing fantasy sports also gives non-fans the opportunity to become fans [11]. With the continuous growth of fantasy sports and sports betting, fantasy sports enthusiasts and sports betters tend to pay more attention to sports data to meet their statistical needs. This has resulted in the ever-growing need for sports data analysis in today’s sports broadcasts.
The types of statistical data presented during sports broadcasts have increased substantially every year due to innovations in broadcasting technologies, with additional reference material displayed on screens in the form of graphical data [1,12]. Broadcast graphics provide audiences with multifaceted information that allows them to clearly understand real-time information on the status of each game, such as the scores of competing teams. Those who miss critical moments of the match can learn about what happened simply by perusing the TV graphic information. TV broadcasts are often enriched with the information presented in various graphic formats [13]. TV broadcast technologies also create a unique experience that cannot be replicated at sports venues [13,14]. For example, audiences watching a classic National Association for Stock Car Auto Racing (NASCAR) event on TV can learn about various related details through visualized elements of the broadcast, including the speed, position, and even drag coefficient of the racing vehicles and the racers’ past achievements [15]. The wealth of visualized elements during a broadcast enhances the audiences’ experience of a game. Visual graphics are helpful for viewers to see more information during the replay, gain more insight through thinking, and facilitate analysis and discussion among viewers [16]. It helps to attract audiences from younger age groups [17].
Statistics on players and teams are shown during sports broadcasts to satisfy the motivations and needs of sports audiences. Statistical information describes players’ performance levels and helps audiences enjoy the game. The use of statistical data in sports media not only increases sports fans’ levels of enjoyment but can also be enjoyed by non-sports fans [18]. Innovations in media technologies have allowed new types of data to be displayed during sports broadcasts. Rogers [19] noted that physiological data provided during broadcasts indicate players’ nervousness or anger levels, which then evokes the audience’s empathy and elevates their sense of entertainment. Although the information provided in broadcast graphics promotes audience understanding and entertainment, its impact on individual audience members varies. Those with a greater interest in sports or the knowledge needed to understand the graphic contents will spend more time viewing the information [13].
Seasoned sports fans and audiences new to sports have different levels of receptiveness to information. The understanding of a game among the less experienced remains basically the same regardless of the number of statistics they are provided with. However, experienced sports fans can interpret a game better even with a small amount of statistical information because they can use their existing knowledge to supplement any information not provided in the data to gain an enhanced understanding of the game [20]. Less-experienced sports fans often do not entirely understand the game’s rules or the players’ decisions. Feeling confused when watching games, they tend to feel frustrated and lose interest [21]. Statistics are often used during broadcast events to present the players’ level of performance. The more abstract the concept being presented by the statistics, the less useful it is to the general audience. Sports data and information may lead to gaps in audiences’ experience, making it difficult for different groups to enjoy watching sports together [6].
Due to the popularization of Internet media and mobile phones, fans can watch sports events without relying on traditional TV media. They can search for contests based on their interests and preferences, and use social media to share their passion for sports with other audiences. Consequently, watching games on TV is no longer very important to fans, and audiences can turn their attention away from traditional TV at any time [6]. Traditional media should take into account the needs of sports fans in order to stem the continuous loss in traditional media viewership while preventing non-fans from losing interest in viewing traditional media.
Improving audiences’ understanding of a game is the most important factor affecting their enjoyment during a broadcast [21]. According to uses and gratification theory, one of the motivations behind using a particular medium is acquiring information, knowledge, and understanding [22]. However, providing statistics is of little value if the audience does not know how to interpret them properly. The purpose of broadcast graphics is to convey information clearly and directly. Graphical information is not displayed for long, meaning audiences do not have the luxury of time when making detailed analyses. Therefore, the presentation of graphics must be well-arranged and organized to facilitate the audiences’ easy knowledge of the contents [23].
Data visualization, which is a broad field, can be denoted using various terms, such as “statistical graphics”, “information visualization”, and “infographics.” It is designed for mass consumption and usually employs simple data representations that facilitate an easy understanding of the data by the audience [24]. Sports visualization techniques employ graphics or charts to collate data on sports players and teams and convey them to audiences clearly and effectively. This increases audience participation/viewership and triggers emotional responses. Sports visualization offers an audience a different perspective on the game experience [25]. The general public’s interest in sports data has grown, with TV broadcasts increasingly providing visualized analyses of sports events, as well as statistics and graphics used to evaluate and make predictions about them [26]. Contents created through data visualization can deepen sports fans’ level of engagement, and using charts is more conducive to audiences’ understanding and quick viewing than merely showing numbers [27]. Statistics and data analysis are employed in many sports. However, baseball has always been and remains a leader in sports analysis. Billy Beane famously used statistics and Sabermetrics (empirical analysis of baseball) to assist Oakland Athletics in breaking a 100 game losing streak record in Major League Baseball (MLB), which revolutionized sports analysis and statistics in baseball [28]. The development of multifaceted statistical analysis in baseball has enabled fans to compare players’ performance levels through statistical data frequently. Experts also use statistical models to analyze and predict players’ performance [29]. As Sabermetrics made baseball a data-driven sport, the vast amounts of available data make the sport a suitable subject for studies and applications in the field of data visualization [30,31,32]. Advanced technologies allow everything that happens on the baseball field to be presented using data. The MLB has also introduced Statcast technology, which tracks both the baseball and all the players in real-time. It also displays various data on TV broadcasts and other media, including the players’ reaction times and speeds, which enhance the fan experience [33].
An increasing number of studies has examined novel visualization effects and explored the application scope of visualization tools. By contrast, studies have yet to examine how audiences view and comprehend the statistical information provided during broadcasts and how the presence of such information impacts the audience experience. Excessive information can negatively affect an audience’s attention to the game because visual elements can distract them and cause them to miss key events, thereby adding to their cognitive load [16]. According to Arth and Billings [34], 48 different types of statistics are used by the MLB in its broadcasts, with an average of 359 statistics displayed per game and 4.3 statistics shown each time. The current trend is to decrease the dimensions of the graphics while providing more data and information concomitantly, which exacerbates the situation [2]. Excessive information hinders an audience’s ability to recall and identify information. When information appears on the screen concurrently with the game broadcast, the audience may see the information, but they will tend to overlook it or be unable to discern it [35]. Although presenting information on the screen can attract an audience’s attention, the available screen space is limited, and adding too much information creates competition for space and interferes with viewing. Moreover, the contents of the graphics may be complicated and distract the audience because visually complex information challenges the audience’s ability to process the message being conveyed [36].
Human beings have an innate response to visual stimulation, whereas our understanding of textual messages results from acquired learning. Moreover, our ability to remember figures and images far exceeds our ability to remember words [37]. We voluntarily allocate our attention to attractive information, and the more attractive the information, the stronger is our storage and memory of it. However, when information contents require a larger allocation of attention, the memory effect of that attention is correspondingly reduced [38]. Complex media processing limits the audience’s enjoyment of entertainment. Their ability to identify information decreases when too many informational elements appear on the screen. Visual complexity also reduces the audience’s efficiency in allocating their limited attention resources [39]. Furthermore, sports broadcasting inherently contains vast amounts of informational elements, such as scenes of the ongoing game, scoreboards, sports graphics, and news tickers. Multiple types of statistics are often presented together in baseball broadcasts. Audiences may not be able to view the information effectively when too many statistics are displayed on screen simultaneously, causing them to focus on only one type of information [40].
Audiences have limited cognitive resources with which to process audiovisual information presented on TV [41]. Information processing is thorough when sufficient resources are available for allocation but will be negatively affected when the allocated resources are insufficient [41]. Visually complex messages challenge the audience’s ability to process the large volume of information they are presented with. The contents being broadcast also consume a significant amount of cognitive resources. Audiences may not have sufficient resources with which to store the encoded information, especially when it requires extensive recall of previously stored information [41]. Thus, how do audiences deal with such complex sports contents, and do they enjoy the experience of watching sports broadcasts on TV? Therefore, this study aims to determine whether providing visual information during sports broadcasting will entertain viewers. On the other hand, providing visual information during sports broadcasting increases cognitive load. We want to understand the potential impact of sports broadcast information on the enjoyment and load of different sports audiences.
The following hypotheses and research questions were proposed given the potential impacts of sports broadcast information on the enjoyment levels and cognitive loads of different categories of sports audiences:
i.
The provision of visualized information during sports broadcasts increases the audience’s entertainment level.
ii.
The provision of visualized information during sports broadcasts increases the audience’s cognitive load.

2. Materials and Methods
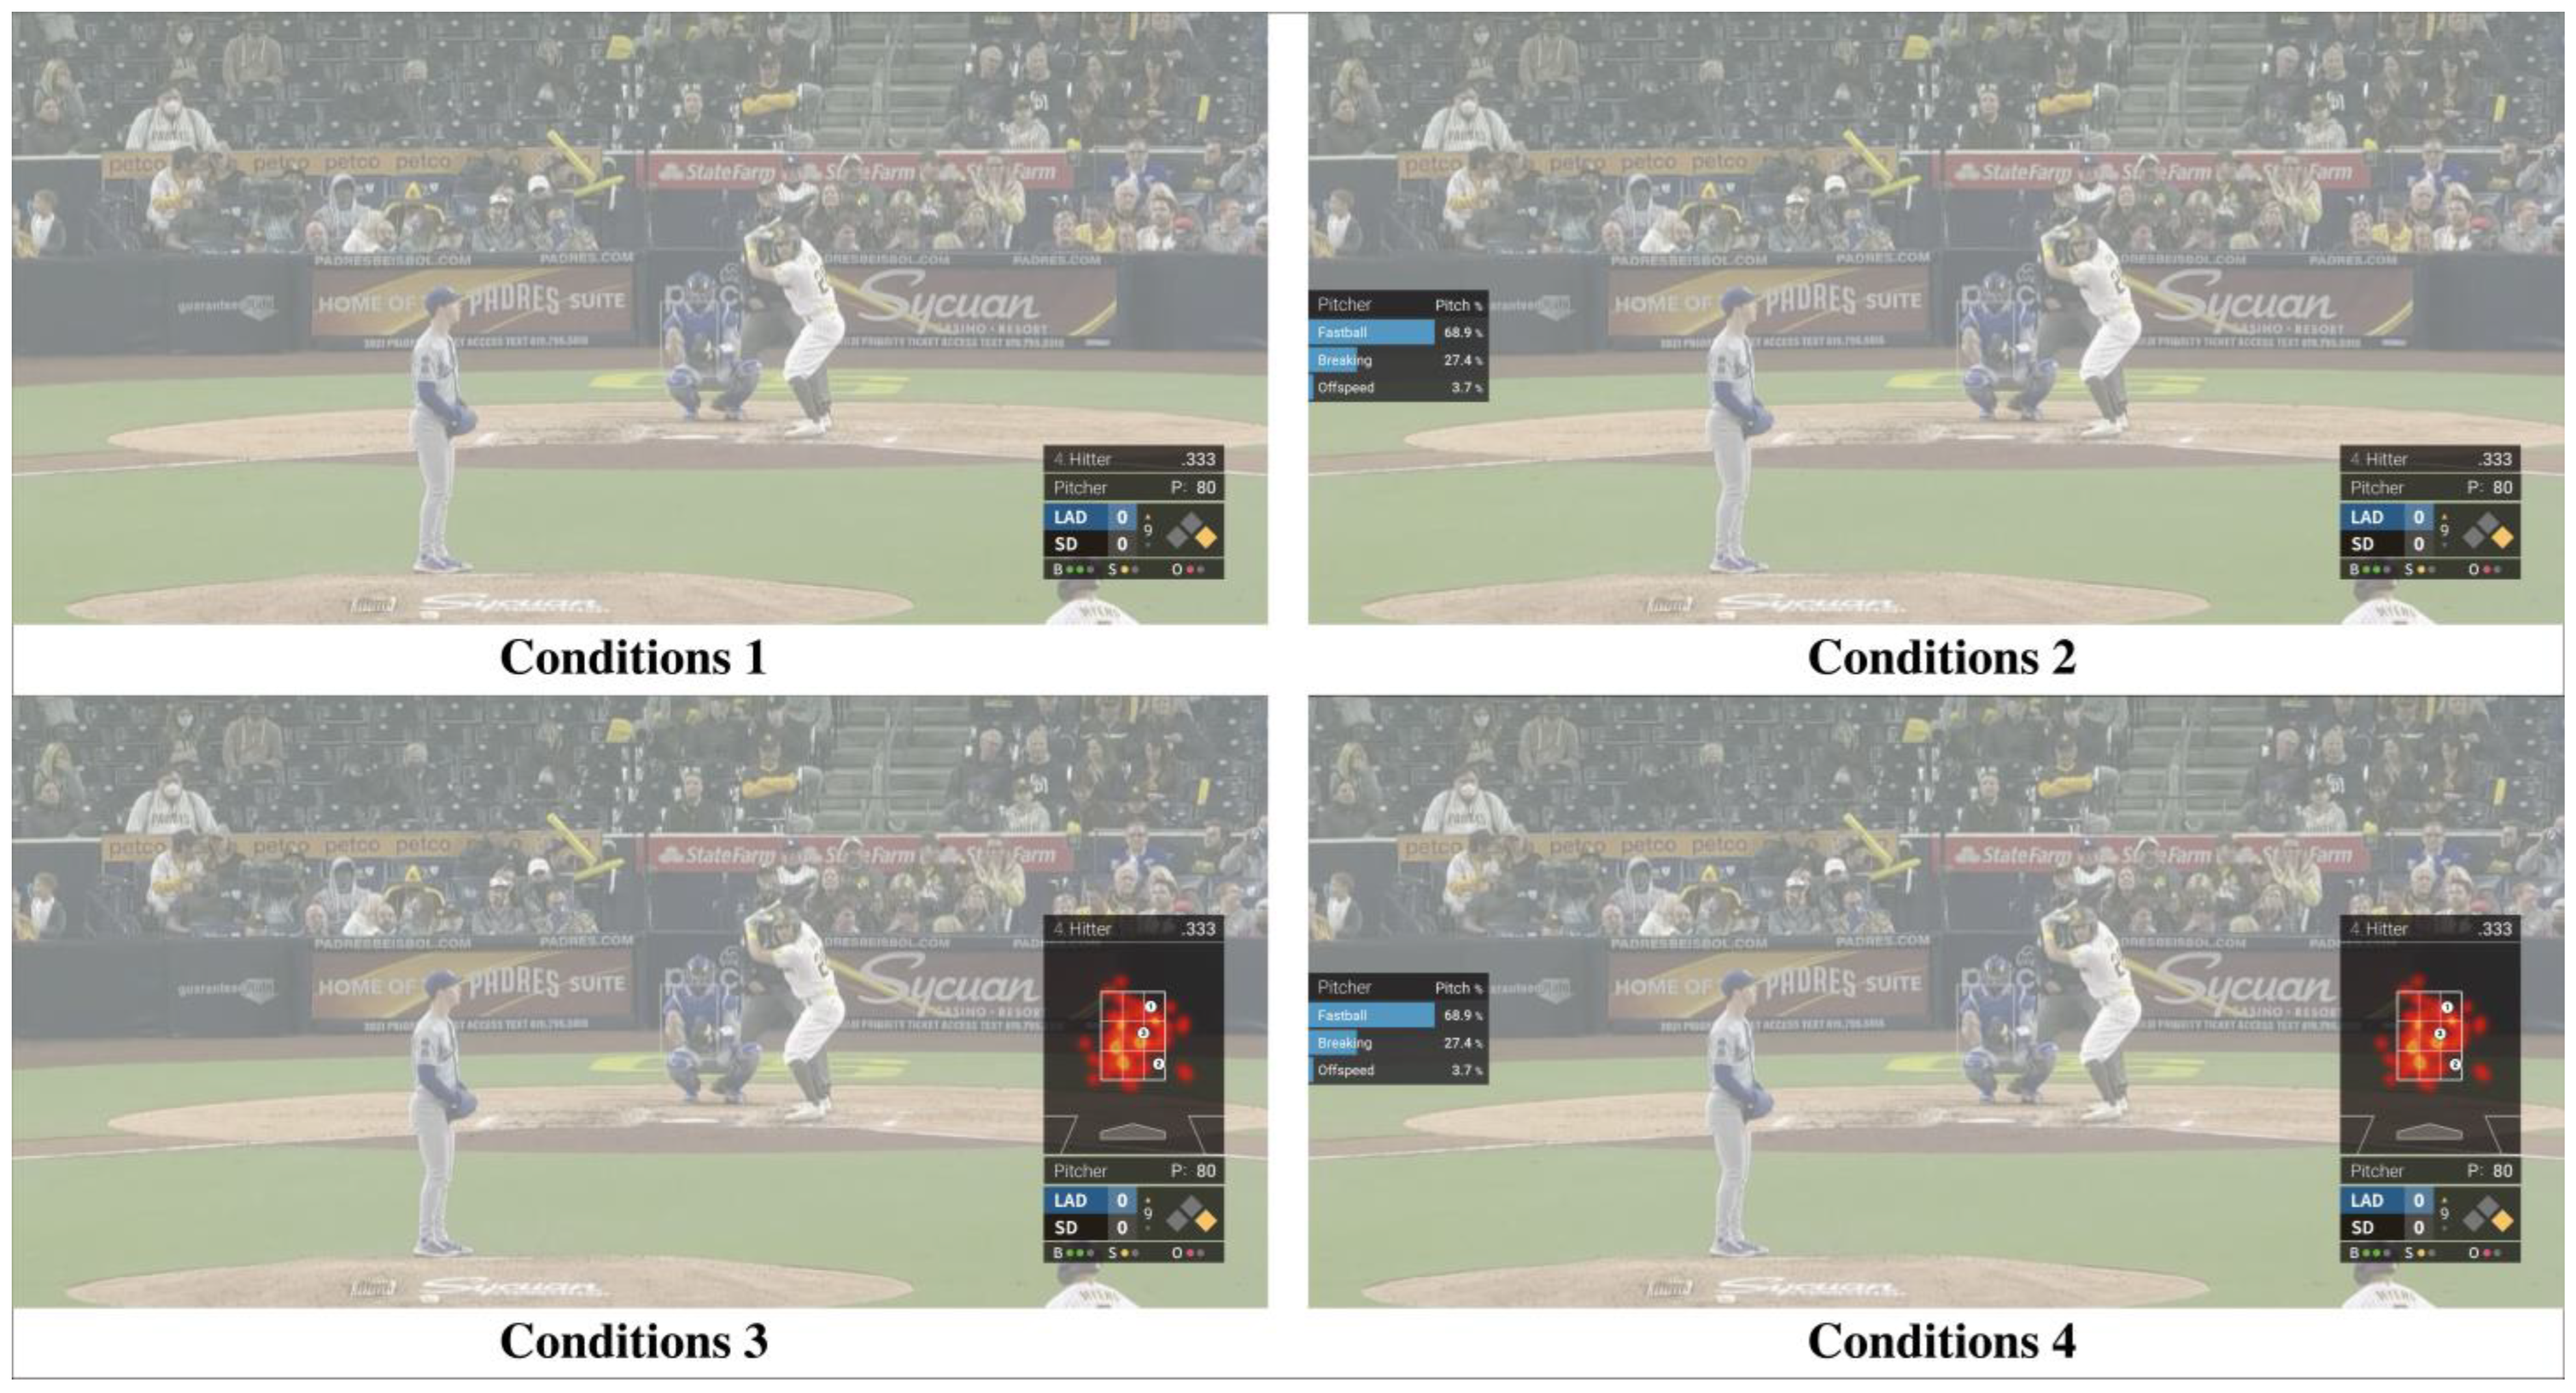
The study used a two-way mixed-design (2MD) ANOVA in an experiment with a 2 × 4 mixed design. The participants were categorized according to the degree of their familiarity with baseball (high or low), and the types of graphical information displayed during a baseball broadcast was divided into four conditions. Condition 1 served as the control state without any visualized information provided. The other three conditions presented various types of player information. Information on the pitcher and batter was provided under Conditions 2 and 3, respectively, and information on both the pitcher and batter was provided under Condition 4 (Figure 1). The objective of the experiment was to gain an understanding of the audience’s feelings, views, and comments on the visualized information. This part of the experiment involved 132 fans from various baseball discussion forums, who were invited to participate in the online simulation experiment. They all watched the same game, but different types of graphical information were presented each time. They then evaluated their perception of the information using the gratification and task load scales.

2.1. Stimuli

Studies investigating audiences’ expectations about data presentation have concluded that graphics can reveal meaning quickly. Audiences have indicated that they would like more data on pitchers and hitters, such as the virtual strike zone and the ratio of pitcher-to-batter utilization [42]. The visualizations used in this study were based on the scheme provided on the MLB website (baseballsavant.mlb.com). This study’s experiment used pitch type and heatmaps of the batters’ hit distribution, which are types of visualized information on pitchers and batters that are commonly used in broadcasting. For Condition 2, in which the pitcher’s pitch was visualized, the graphics displayed the pitch in percentage form prior to each pitch. The actual pitch used was shown afterward. For Condition 3, the surface area and shades of colors were used to indicate the likely swing position and frequency on the hit distribution heatmap, and the pitcher’s pitching position was marked on the strike zone.
After Effects software was used for video editing, specifically for the addition of dynamic graphics onto the same baseball game video. The video was presented in the same manner, except for the imposed conditions. The graphics displayed information and statistics on the players and game, including a normal display of the scores and game status and the previous scores of the hitters. Each type of visual information was displayed for three seconds and was displayed three seconds before the pitcher threw the ball. After a ball count was completed, the result was displayed again for 3 s. To reduce the influence of aural and other factors, the versions all had similar visual effects except for the information and style design presented by the graphics on the simulation screen. During the viewing process, the broadcaster’s commentary and noises made by the spectators were muted to prevent the broadcaster’s style and the spectators’ cheers from affecting the participants’ mood [43,44].

2.2. Procedure

At the beginning of the experiment, the participants were given a link to access a questionnaire containing videos of baseball games shown in random order. Each participant was required to watch the four simulated games with different conditions. The contents of the games were not repeated (walks, strikeouts, hits, and home runs), and the orders of the baseball videos and experimental conditions were randomly assigned. The experiment commenced after the participants had given their consent. The duration of the experiment was approximately 15 min. After watching the videos assigned to them, the participants were asked to respond to a short entertainment experience scale to measure their level of enjoyment, significance, and understanding when watching the videos. They then completed a task load scale to assess their cognitive load while watching the videos. After the participants had completed all four conditions of the experiment sequentially, they were asked to state how they felt about the graphics used for the four conditions.

2.3. Evaluation Measures

2.3.1. Evaluation of the Media Entertainment Experience

Oliver and Bartsch [45] presented and validated a scale for measuring enjoyment and meaningful entertainment that evaluates an audience’s experience of appreciation after viewing media entertainment. Ryan Rogers studied the effects of adding physiological data to games being broadcasted, and adapted the enjoyment and meaningfulness scale by adding an item for the single dimension of knowledge. He then conducted experiments to measure participants’ levels of knowledge after watching videos [19]. Seven items were used to measure the level at which a video was enjoyed, meaningful, and comprehensible. Scoring was based on a seven-point Likert scale, with 1 and 7 indicating “strongly disagree” and “strongly agree”, respectively.

2.3.2. National Aeronautics and Space Administration’s Task Load Index (NASA-TLX)

The thinking process and memory demands affect people’s overall satisfaction and performance after completing a task. The NASA-TLX, developed by NASA, is an indicator used to measure tasks that involve searching. Complex and difficult graphical information imposes a greater cognitive load on users’ memory [46], so the goal of NASA-TLX is to improve the user experience and reduce their cognitive load. It comprises a set of subjective tools for evaluating participants’ psychological workload and understanding its source. The scale contains six items: mental demand, physical demand, temporal demand, performance, effort, and frustration. Each item is scored from 0 to 100; the higher the score, the greater the cognitive load. The average score for psychological workload is calculated based on the scores for the various items. It was used to assess the participants’ cognitive load after they had viewed the game graphics.

2.4. Participants

The experiment participants were baseball fans recruited by distributing the research questionnaire on the baseball board of the PTT Bulletin Board System and the MLB Facebook group. A total of 132 valid questionnaires were retrieved. There were 100 male and 32 female participants, accounting for 75% and 24% of the samples, respectively. Most of them (73% or 54.7%) were in the 18–25-year-old age range; 35 (26.3%) were in the 26–35 range, 14 (10.5%) were in the 46–55 range, three (2.3%) were in the 46–55 range, and two (1.5%) were under the age of 18. In terms of experience of baseball, 76 participants had watched baseball games for more than 10 years, followed by 26 with 7–9 years of experience, 18 with 4–6 years of experience, 9 with 1–3 years of experience, and 3 with less than 1 year of experience.
The sports participation scale devised by C. Mo Bahk was used to measure the participants’ experience of participating in and/or viewing baseball games. This scale examined their general participation in sports, the emotional fluctuations they experienced when watching sports events, and the time they spent watching and discussing sports events and related phenomena. These variables measured the level at which the participants oriented their lives toward the enjoyment of sports events [47]. The sport selected was a specific baseball game, which was used to measure the participants’ emotional, cognitive, and behavioral engagement as an audience. The participants’ mean score for the baseball participation scale was used to divide them into two groups. A seven-point Likert scale was used for scoring, so no extreme values were generated. The mean of 5.16 was used as the criterion for distinguishing between participants with high participation levels (HPLs) and low participation levels (LPLs). The former group consisted of 62 participants with an average score of 5.97; the latter group had 70 participants with an average score of 4.43.

3. Results

An ex ante comparison of the experimental data was performed at this stage. Specifically, the original image (Condition 1) was compared with the images that contained additional visualized information (Conditions 2, 3, and 4). The responses of the two groups with different participation levels were analyzed. The results are shown in Table 1.

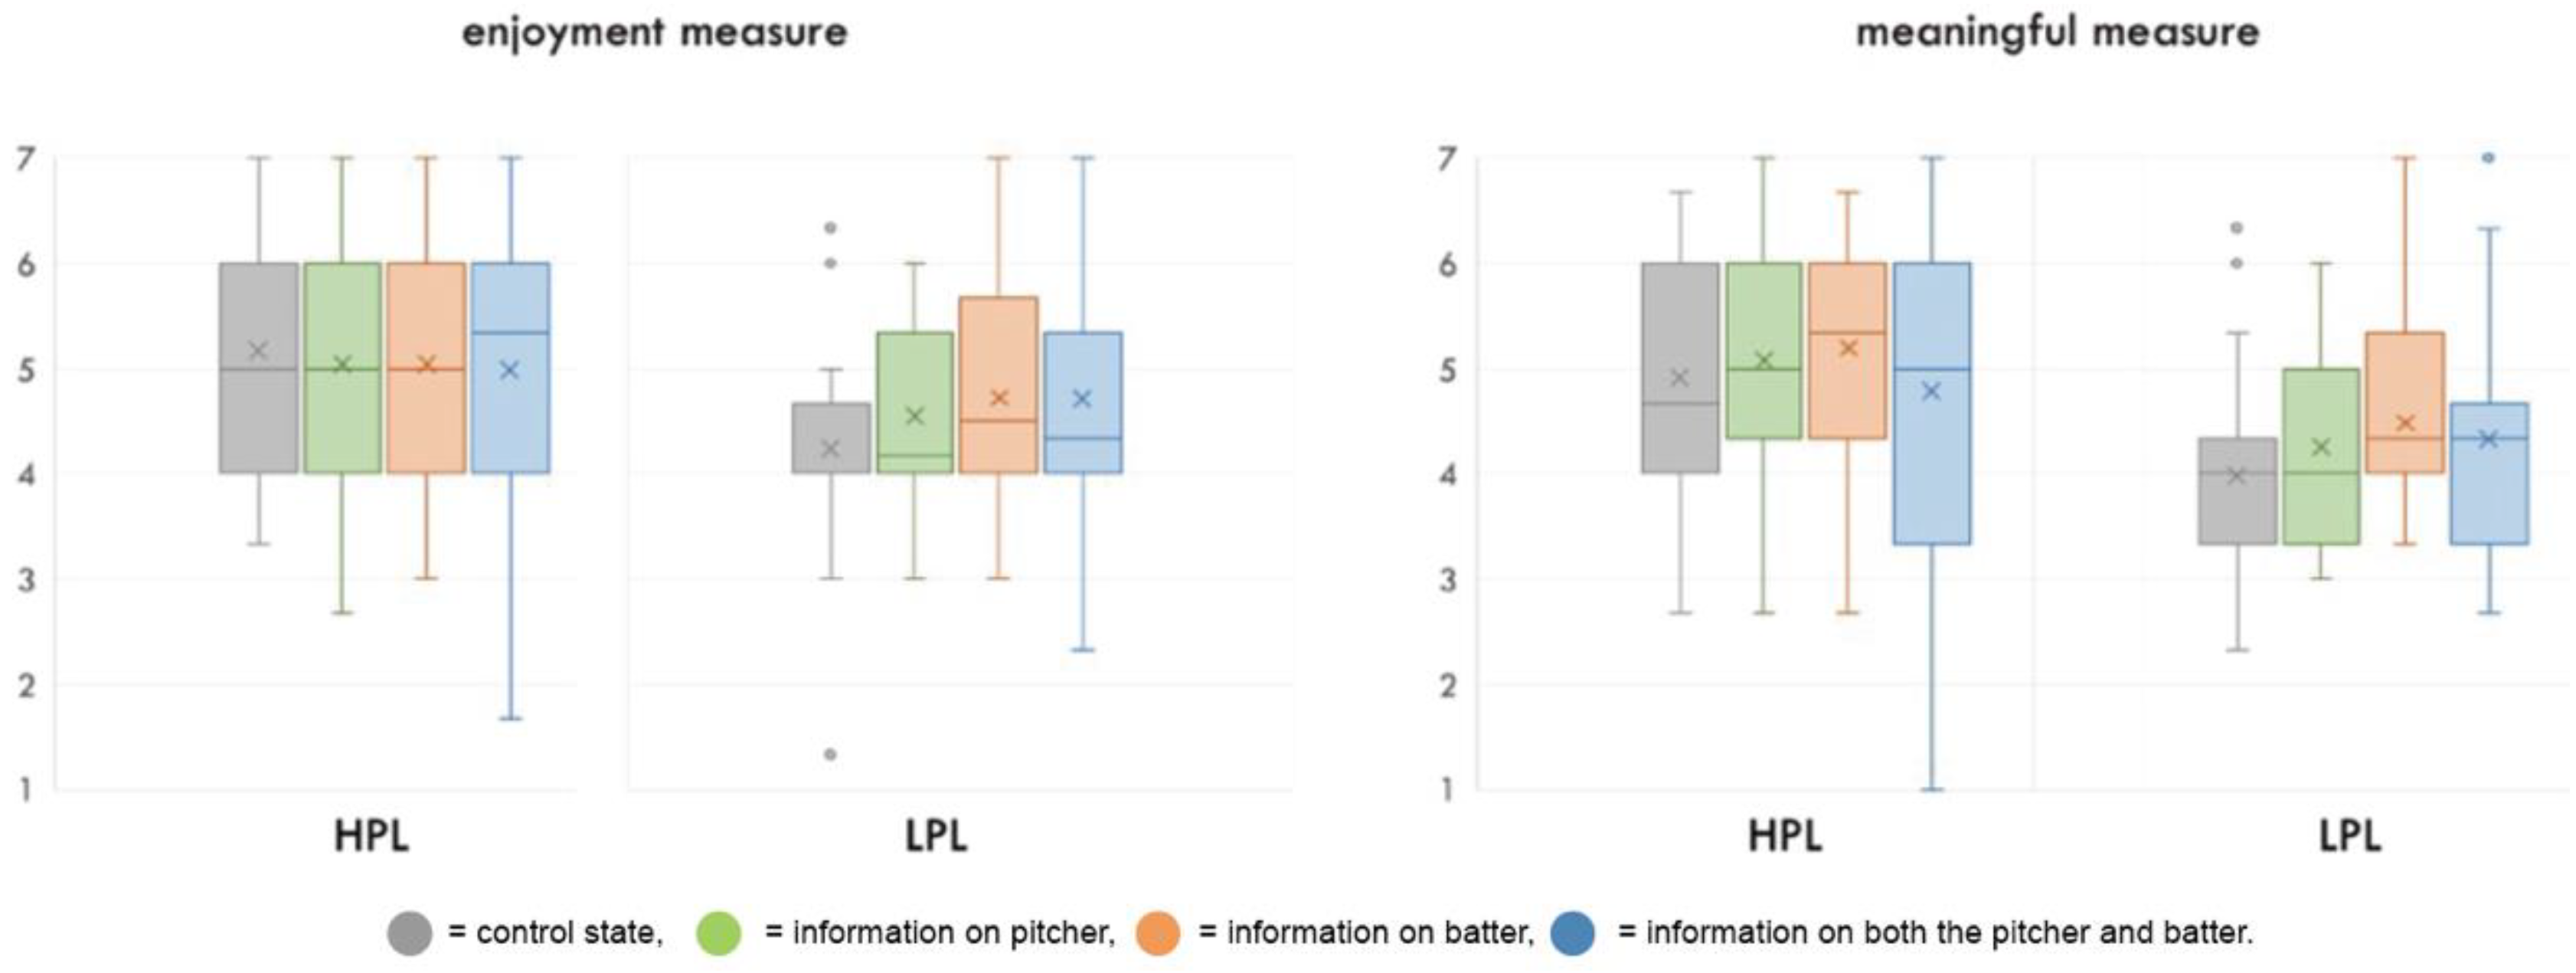
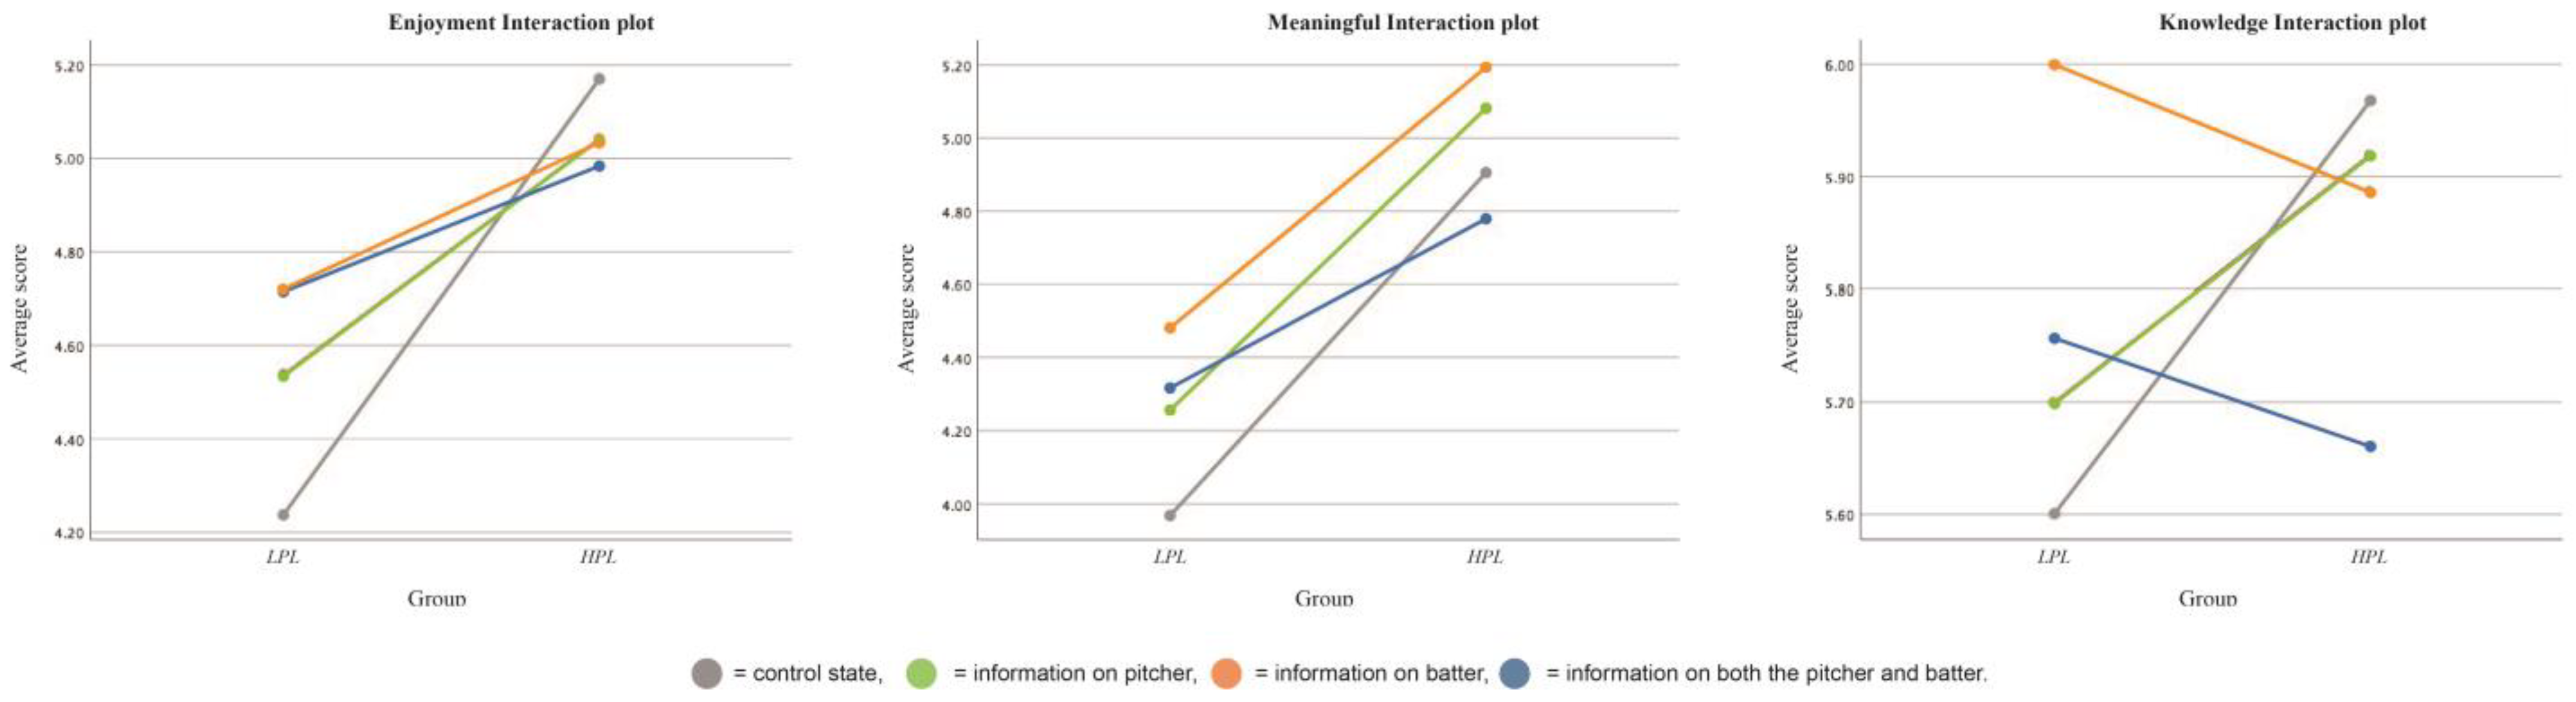
3.1. Providing Visual Information during Sports Broadcasts Increases the Audience’s Pleasure Level

For the LPL group, adding visualized information had a significant impact on the enjoyable and meaningful items but not on knowledge. For the enjoyment aspect, the provision of visualized information during broadcast events made a significant difference, t (116.98) = −3.054, p = 0.003. This group of participants found it more enjoyable when visualized graphics were provided during their viewing of the TV broadcast of a baseball game (M = 4.66, SD = 0.98) than when there was no information (M = 4.24, SD = 0.99). This showed that providing visualized information during baseball broadcasts made the viewing experience more enjoyment for this group. For the meaningful aspect, there was also a significant difference due to the provision of visualized information during the broadcast, t (129.92) = −3.121, p = 0.002; it was more meaningful to the participants when such information was provided (M = 4.35, SD = 0.94) than when it was absent (M = 3.97, SD = 0.86). Overall, the LPL group found baseball telecasts with visualized information to be more meaningful. By contrast, there was no statistical significance for the three items (enjoyment, meaningful, and knowledge) for the HPL group with the provision of visualized information during the broadcast (Figure 2).

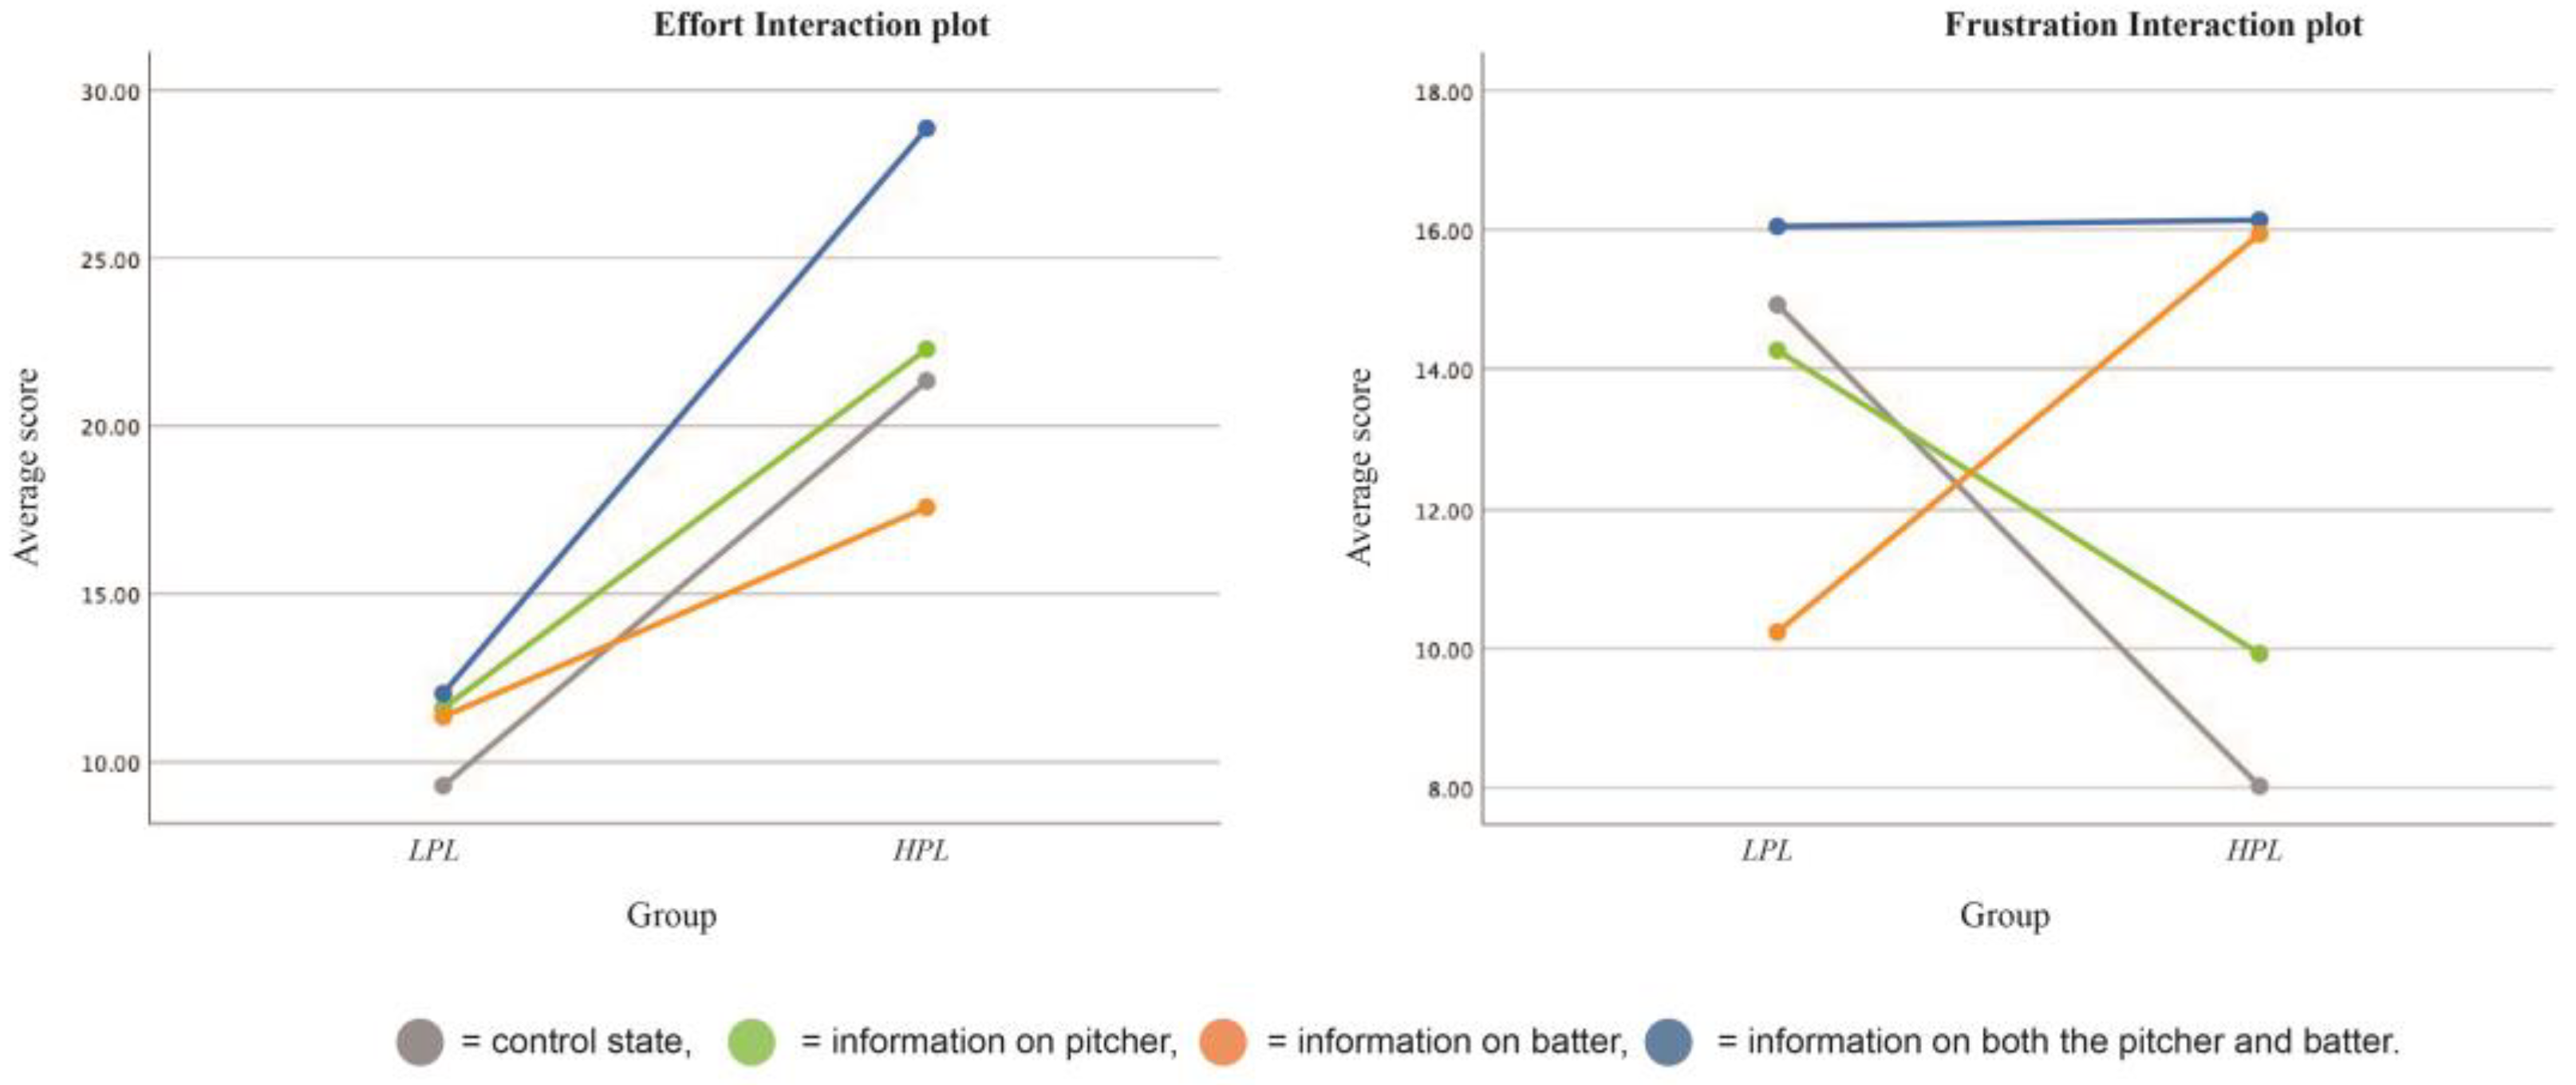
3.2. Providing Visual Information during Sports Broadcasts Increases the Audience’s Cognitive Load

Out of the six NASA-TLX items, mental demand reached a significant level for the LPL group; the remaining items did not reach statistical significance. Providing visualized information during the broadcast event reached significance for mental demand, t (276) = −2.091, p = 0.037. Doing so was more mentally demanding (M = 37.65, SD = 27.46) than not doing so (M = 29.74, SD = 27.04). Overall, broadcasts providing visualized information increased the mental demand of the LPL group.
For the HPL group, four out of the six NASA-TLX items reached significance, namely mental demand, temporal demand, effort, and frustration. Providing visualized information during the broadcast event was significant for mental demand, t (102.438) = −3.508, p = 0.001. Doing so created a higher cognitive load (M = 42.29, SD = 28.36) than not doing so (M = 27.34, SD = 29.31). Therefore, providing visualized information during baseball telecasts increased the mental demand for the HPL group. Providing visualized information had a significant impact on temporal demand, t (122.08) = −2.224, p = 0.028, with its provision creating a higher temporal demand (M = 28.94, SD = 30.40) than its non-provision (M = 20.13, SD = 25.76). Thus, there was temporal pressure for the HPL group when visualized information was provided.
Visualized information had a significant impact on effort, t (244) = −2.253, p = 0.025. Participants who were provided with visualized information had to exert more effort (M = 47.72, SD = 27.92) than those who were not (M = 38.29, SD = 30.27). For the HPL group, providing visualized information during the broadcast required them to exert more effort when watching the game. Such information also significantly affected frustration during the broadcast, t (183.712) = −2.47, p = 0.014. The participants experienced greater frustration when the information was provided (M = 14.00, SD = 23.33) than they did when it was not (M = 8.03, SD = 13.27). Therefore, the provision of visualized information during broadcasts caused participants in the HPL group to feel more frustrated.
The aim of this experiment was to gain an understanding of the interaction effects between the four types of baseball information on a broadcast interface and the two groups of participants with different participation levels in baseball. The impacts (i) of various types of information on different participation levels and (ii) of different participation levels on various types of information are discussed below.

3.3. Evaluation of Media Entertainment Experience

An analysis of the enjoyment effects of participation level and information type was conducted using 2MD ANOVA (Figure 3); participation level and information type were the independent and dependent variables, respectively. The results indicated that participation level and information type had a significant interaction effect on pleasure, F (2.32,301.66) = 4.9, p = 0.005. A test for main effects alone was conducted. When no information was provided, participation level had significant main effects, F (1,520) = 22.22, p = 0.001. For the LPL group, F (1.64,240.61) = 6.52, p = 0.003, with provision of the following information having greater effects than non-provision (M = 4.24, SD = 1): pitcher (M = 4.54, SD = 0.89), batter (M = 4.72, SD = 1.03), and pitcher versus batter (M = 4.71, SD = 1.03). For the HPL group, the main effects of not providing information and providing information on the pitcher, batter, and pitcher versus batter were not significant.
The 2MD ANOVA was used to analyze the meaningful effects of participation level and information type, in which the former and latter were the independent and dependent variables, respectively. The results revealed a significant interaction effect between the two variables on finding the broadcast meaningful, F (2.59,336.76) = 3.17, p = 0.031. Next, separate main effects tests were conducted on the individual sub-variables. There was a significant main effect on participation level when no information was provided, F (1,520) = 25.31, p < 0.001. Providing no information and information on the pitcher and batter were significantly more meaningful for the HPL group than for the LPL group.
The knowledge effect of participation level and information type was also analyzed using 2MD ANOVA; participation level was the independent variable, and information type was the dependent variable. The results revealed a significant interaction effect between participation level and information type on knowledge, F (2.14,337.94) = 2.9, p = 0.042. Further main effects testing indicated that providing no information and information on the pitcher, batter, and pitcher versus batter did not have any significant main effect on participation level.
The study then compared the effects of different information types on participants of the same participation level. The main effects test showed that being in the LPL group had a significant impact on knowledge of the various information types, F (1.6,2.67) = 4.15, p = 0.024. A post hoc comparison indicated that, for this group, providing batter information enabled them to better comprehend the game relative to the provision of no information (p = 0.01), information on pitcher (p = 0.001), and information on pitcher versus batter (p = 0.001). The different information types had no significant effect on the HPL group in terms of their knowledge of the game.

3.4. NASA-TLX

The 2MD ANOVA was used to analyze the effects of participation level and information type on effort (Figure 4), in which the former and latter were the independent and dependent variables, respectively. The different information types resulted in significant differences between the various participation levels, F (1,130) = 5.132, p < 0.025. With the exception of the non-provision of information, more effort was required by the HPL group when watching the game with information provided. For participants of the same participation level, there was a significant interaction effect between their group and the information types, F (2.3,330.7) = 9.83, p = 0.001. The HPL group required varying amounts of effort to process the different information types. A post hoc comparison showed that this group felt that more effort had to be exerted when information was provided—on the pitcher (p = 0.029), batter (p = 0.001), and pitcher versus batter (p = 0.001)—than in the non-provision case. For the LPL group, the information type made no significant difference to their effort.
The frustration effect of participation level and information type was also analyzed using 2MD ANOVA, with participation level as the independent variable and information type as the dependent variable. The various information types had no significant impact on the frustration of participants from the two groups. For participants from the same group, there was a significant interaction effect between their group and information type, F (3,267.1) = 4.347, p = 0.006. The difference was with the HPL group, where information type caused a significant difference in their level of frustration, F (2.36,289.34) = 3.98, p = 0.009. A post hoc comparison showed that this group felt that the provision of information—on the batter (p = 0.001), and pitcher versus batter (p = 0.02)—made them feel more frustrated than when no information was provided.
For the LDL group, information type made no significant difference to the level of frustration among the participants.

4. Discussion

The impact on audiences of providing visualized information during broadcasts was examined in this study through ex-ante comparisons. The enjoyment, meaning, and mental demand of the LPL group were significantly affected by such information. Although it required a greater mental demand from them to think about the information, it made their viewing of the baseball game more enjoyable, and they found the game to be more meaningful. For the HPL group, visualized information had significant impacts on their mental and temporal demands, effort, and frustration. They used more mental capacity to think, felt greater time pressure, exerted more effort, and felt more frustrated.
To test the impact of the visualized information on the participants, a mixed-design analytical test was applied to examine whether there was any significant difference between the HPL and LPL groups in response to each information type. Participants from the same group were asked to evaluate the four information types. As Table 1 shows, the provision of different information types led to varying feelings for the various items. This was true for both the HPL and LPL groups. However, providing information on the hitter was the item with the greatest variation. Thus, providing visualized information during broadcasts led to different feelings depending on the participant’s participation level.
For the intra-group analysis, group LPL scores on media experience with visualized information were better than those without visualized information. In the HPL group, no infographics were better than infographics in two measures (Figure 5). Although it was not possible to directly compare the weighting of items across the various scales based on the overall results, it was evident that the LPL group benefitted the most from the provision of visualized information. Among the information types, that on the batter had more positive impacts on this group when they watched the broadcast. For the HPL group, the contents of the visualized information generated more cognitive load. They felt additional time pressure, needed to exert more effort, and experienced greater levels of frustration. Although the benefit of visualized information to the HPL group could not be denied, the information provided during the experiment might have been too simplistic and distracting. This would be frustrating to the participants because they were fans who already possessed abundant baseball knowledge and experience.
All the participants were invited to provide feedback and suggestions at the end of the experimental questionnaire, and 23 of them did so. Four comments from HPL group members discussed the significance of providing visual information. The comments included “We already discerned the information contained in the visualization simply by looking at the video itself”, “It was not meaningful to keep displaying the visualizations; it is more important to provide the information when the first ball is pitched and the last pitch that leads to the win”, and “The information was clear but it was less enjoyment than simply watching the game”.
The distribution of the enjoyment, meaningfulness, and knowledge ratings shows that the HPL group consistently gave ratings that were between “neutral” and “agree” regardless of the information type provided. This suggests that the contents of the visualized information constituted knowledge that they already possessed. This reinforced the previous finding that the HPL group was able to tap into their abundant baseball experience and knowledge to make up for any information that was not provided [20].

5. Conclusions

Graphical information is provided during broadcasts to help the audience understand the ongoing game situation and enhance their viewing experience. The data also serve as a medium for post-game communication among fans. However, the complexity of the graphics that appear during the game affects the audience’s cognitive load, especially in broadcasts of baseball games, which involve multiple types of statistics. Presenting these makes it difficult for LPL fans to enjoy the game. The amount of data used to explain the game are increasing. Although such on-screen information can attract the audience’s attention, the screen space available for showing the actual game is reduced and interrupted by all the information. Moreover, given the increasing complexity of the screen elements, having large amounts of data interferes with, rather than enhances, the HPL fans’ enjoyment of the game. This runs counter to the original purpose of data visualization, which is to help audiences quickly understand and master the game for their full enjoyment.
The research subject of this study was MLB broadcast graphics. The graphical contents most commonly seen convey data on the performance of the game players and teams. Test-based studies have shown that participants rarely use statistics to gauge the players and their performance, and rarely describe past games using data. The pace of sports competitions is relatively fast, and visualized information usually flashes quickly on the TV screen before disappearing. Hence, the challenge regarding broadcast graphics is whether the audience within a short time can understand them. Statistical information only helps LPL fans with sufficient experience understand the game of baseball. Most information is presented in textual form. Because less-experienced fans have limited knowledge of baseball, they are unable to interpret most of the data or gain full knowledge of the game from them. This causes them to give up attempting to read the data.
This study found that visually appealing graphics enhanced the audience’s experience, which is consistent with the findings of previous experiments [17,48,49]. Although it is thought that adding visualized information helps less-experienced fans better enjoy a game and makes their viewing more meaningful, this did not significantly affect the study participants’ knowledge of the game when they watched it. Data visualization can facilitate the easy interpretation of complex data and comparisons between data; however, presenting too many statistics makes it difficult for audiences to quickly understand whether the numbers affect the teams or the game and, if so, in what ways [50]. This study demonstrated the importance of fans’ possession of pre-existing knowledge. Broadcast elements are designed to keep audiences informed of the game’s progress and ensure that anyone watching it at any stage can understand the information at a glance rather than lose interest due to confusion because they lack an understanding of the game [51].
The crux of the issue is that audiences have varying amounts of knowledge of the game, making it impossible to provide consistent information that meets everyone’s preferences. Thus, personalization may be the best solution for dealing with the variations in audience experience levels [52]. New interactive media allow audiences to customize their games and watch only the players or teams they are interested in or support [53]. While visualized information may appeal to less-experienced fans and will not significantly damage the viewing experience for the general audience, it is still necessary to ensure that the information can be intuitively understood by the LPL group to maintain their focus on the game.
This study divided baseball fans into those with HPLs and LPLs. Past studies on broadcast messages found that audiences with varying experience and participation levels had different needs for information, all of which should be duly considered. When the type of information displayed, method of presentation, and time of display all cater to the preferences of different fans, their experiences of the live broadcast will be affected to varying degrees. We will continue to explore other ways of differentiating the fans’ needs for broadcast information based on different types of game, audience, and stadium section. The need to display personalized game information should be further explored, and the details and types of visualized information being provided should be continuously optimized from the audience’s perspective. This will ensure that all fans watching sports events enjoy themselves and have a meaningful experience.

6. Limitations and Future Research

The contribution of this study to the broadcasting of sports events is that we know that visual information, as distinct from traditional textual statistics (e.g., SLG, OPS, wOBA, wRAA, and FPI), should be able to support the understanding of games by less experienced viewers. Graphics with the same content affect viewers with different levels of experience. Television content used to be about what the audience had to accept. In a future of customized information, if we can provide the LHL audience with entry-level information, we should be able to promote the game to a wider audience than just loyal fans. As a result, broadcasters or producers need to rethink how they use data in sports programming, not just as a tool to display numbers. Future research could include more user interviews to explain how these infographics contribute to a good experience and to design infographics that are helpful to newcomers.
In this study, we evaluated only two types of infographics (Pitcher’s Pitch was visualized and Hitters’ heatmap), and we adopted the effect of a relatively simple visual style. Baseball broadcasts more data than either of these types (Pitch Arsenal, Home Run Derby, Sprint Speed Scroller), so future work needs to explore other data types and visual presentation styles. In addition, in this study, the anchor’s voice and the audience were excluded from the experiment to avoid interference caused by the sound to the subjects. In the actual broadcast environment, the anchor’s voice will explain the game at the appropriate time, which is also part of the fun of watching. Future research could explore how infographics can help anchors broadcast matches.

Author Contributions

M.-C.Z. contributed to the original ideas of the paper and designed the experiments. C.-Y.C. performed the experiments and analyzed the experimental data under the supervision of M.-C.Z. C.-Y.C. wrote the first draft of the manuscript; M.-C.Z. revised and edited it. All authors have read and agreed to the published version of the manuscript.

Funding

This research received no external funding.

Institutional Review Board Statement

Not applicable.

Informed Consent Statement

Informed consent was obtained from all subjects involved in the study.

Data Availability Statement

Not applicable.

Acknowledgments

Special thanks for all participants who generously shared their time and experience, for the purposes of this study sections.

Conflicts of Interest

The authors declare no conflict of interest.

References

  1. Hahn, D.A.; VanDyke, M.S.; Cummins, R.G. It’sa numbers game: Change in the frequency, type, and presentation form of statistics used in NFL broadcasts. Int. J. Sport Commun. 2018, 11, 482–502. [Google Scholar] [CrossRef]
  2. Hesse, B. Evolution and Utility of Graphics Containing Statistics in NCAA Championship Broadcasts (1986–2016). Indianapolis, IN 2018. Available online: https://cardinalscholar.bsu.edu/handle/123456789/201587 (accessed on 10 September 2022).
  3. Miljković, D.; Gajić, L.; Kovačević, A.; Konjović, Z. The use of data mining for basketball matches outcomes prediction. In Proceedings of the IEEE 8th International Symposium on Intelligent Systems and Informatics, Subotica, Serbia, 10–11 September 2010; IEEE: Piscataway, NJ, USA, 2010. [Google Scholar] [CrossRef]
  4. Holden, J.T.; Brandon-Lai, S. Advertised Incentives for Participation in Daily Fantasy Sports Contest in 2015 and 2016: Legal Classification and Consumer Implications. ESLJ 2017, 15, 1. [Google Scholar]
  5. Aden, R.C.; Armfield, G.G.; Beard, D.E.; Berg, K.; Billings, A.C.; Boone, J.; Bowman, N.D.; Brady, K.; Chidester, P.J.; Fingerhut, D.; et al. Sports Fans, Identity, and Socialization: Exploring the Fandemonium; Lexington Books: Lanham, MD, USA, 2011; Available online: https://www.tandfonline.com/doi/abs/10.1080/11745398.2014.850665?journalCode=ranz20 (accessed on 10 September 2022).
  6. Gantz, W.; Lewis, N. Sports on traditional and newer digital media: Is there really a fight for fans? Telev. New Media 2014, 15, 760–768. [Google Scholar] [CrossRef]
  7. Melnick, M.J. Searching for sociability in the stands: A theory of sports spectating. J. Sport Manag. 1993, 7, 44–60. [Google Scholar] [CrossRef]
  8. Gantz, W.; Wang, Z.; Paul, B.; Potter, R.F. Sports versus all comers: Comparing TV sports fans with fans of other programming genres. J. Broadcast. Electron. Media 2006, 50, 95–118. [Google Scholar] [CrossRef]
  9. Gantz, W.; Wenner, L.A. Fanship and the television sports viewing experience. Sociol. Sport J. 1995, 12, 56–74. [Google Scholar] [CrossRef]
  10. Billings, A.C.; Ruihley, B.J. Why we watch, why we play: The relationship between fantasy sport and fanship motivations. Mass Commun. Soc. 2013, 16, 5–25. [Google Scholar] [CrossRef]
  11. Goldsmith, A.L.; Walker, M. The NASCAR experience: Examining the influence of fantasy sport participation on ‘non-fans’. Sport Manag. Rev. 2015, 18, 231–243. [Google Scholar] [CrossRef]
  12. Stropnik, V.; Babuder, K.; Črmelj, V.; Vižintin, R.P.; Pogačnik, M. A look into the future of sports: A study of the actual state of the art-The Microsoft HoloLens and Augmented Reality. In Proceedings of the 2018 International Conference on Broadband Communications for Next Generation Networks and Multimedia Applications (CoBCom), Graz, Austria, 11–13 July 2018; 2018. [Google Scholar] [CrossRef]
  13. Cummins, R.G.; Gong, Z.; Kim, H.-S. Individual differences in selective attention to information graphics in televised sports. Commun. Sport 2016, 4, 102–120. [Google Scholar] [CrossRef]
  14. Lo, W.H.; Zollmann, S.; Regenbrecht, H. Who kicked the ball? situated visualization in on-site sports spectating. In Proceedings of the 2021 IEEE Conference on Virtual Reality and 3D User Interfaces Abstracts and Workshops (VRW), Lisbon, Portugal, 27 March–1 April 2021; 2021. [Google Scholar] [CrossRef]
  15. Cummins, R.G.; Keene, J.R.; Nutting, B.H. The impact of subjective camera in sports on arousal and enjoyment. Mass Commun. Soc. 2012, 15, 74–97. [Google Scholar] [CrossRef]
  16. Charleer, S.; Gerling, K.; Gutiérrez, F.; Cauwenbergh, H.; Luycx, B.; Verbert, K. Real-time dashboards to support esports spectating. In Proceedings of the 2018 Annual Symposium on Computer-Human Interaction in Play, Melbourne, Australia, 28–31 October 2018. [Google Scholar] [CrossRef]
  17. Arndt, S.; Räty, V.P.; Nieuwenhuis, T.; Keimel, C.; Ibáñez, F.; Perkis, A. Enhancing use of social media in TV broadcasting. In Proceedings of the Adjunct Publication of the 2017 ACM International Conference on Interactive Experiences for TV and Online Video, Hilversum, The Netherlands, 14–16 June 2017. [Google Scholar] [CrossRef]
  18. Hahn, D. The Effect of Statistics on Enjoyment and Perceived Credibility in Sports Media. Commun. Sport 2021, 2167479521998395. [Google Scholar] [CrossRef]
  19. Rogers, R. The Impact of Presenting Physiological Data During Sporting Events on Audiences’ Entertainment. J. Sport. Media 2019, 14, 155–170. [Google Scholar] [CrossRef]
  20. Gin, A. Analytics in Baseball: Retention of Sport Specific Analytic Information Based on Various Presentation Methods. Ph.D. Thesis, Arizona State University, Tempe, AZ, USA, 2020. Available online: https://www.proquest.com/dissertations-theses/analytics-baseball-retention-sport-specific/docview/2476806552/se-2?accountid=14227 (accessed on 10 September 2022).
  21. Hertzog, C.; Sakurai, S.; Hirota, K.; Nojima, T. Toward augmented reality displays for sports spectators: A preliminary study. Multidiscip. Digit. Publ. Inst. Proc. 2020, 49, 129. [Google Scholar]
  22. West, R.L.; Turner, L.H.; Zhao, G. Introducing Communication Theory: Analysis and Application; McGraw-Hill: New York, NY, USA, 2010; Volume 2. [Google Scholar]
  23. Millerson, G.; Owens, J. Television Production; Routledge: London, UK, 2012. [Google Scholar] [CrossRef]
  24. Cook, D.; Lee, E.-K.; Majumder, M. Data visualization and statistical graphics in big data analysis. Annu. Rev. Stat. Its Appl. 2016, 3, 133–159. [Google Scholar] [CrossRef]
  25. Block, F.; Hodge, V.; Hobson, S.; Sephton, N.; Devlin, S.; Ursu, M.F.; Drachen, A.; Cowling, P.I. Narrative bytes: Data-driven content production in esports. In Proceedings of the 2018 ACM International Conference on Interactive Experiences for TV and Online Video, Seoul, Korea, 26–28 June 2018. [Google Scholar] [CrossRef] [Green Version]
  26. Perin, C.; Vuillemot, R.; Stolper, C.D.; Stasko, J.T.; Wood, J.; Carpendale, S. State of the art of sports data visualization. In Computer Graphics Forum; Wiley Online Library: New York, NY, USA, 2018. [Google Scholar] [CrossRef]
  27. Liu, A.; Mahapatra, R.P.; Mayuri, A. Hybrid design for sports data visualization using AI and big data analytics. Complex Intell. Syst. 2021, 1–12. [Google Scholar] [CrossRef]
  28. Wolf, G.H. The sabermetric revolution: Assessing the growth of analytics in baseball by Benjamin Baumer and Andrew Zimbalist. J. Sport Hist. 2015, 42, 239–241. [Google Scholar]
  29. Howard, H. The Sabermetric Revolution: Assessing the Growth of Analytics in Baseball. J. Am. Cult. 2016, 39, 129. [Google Scholar] [CrossRef]
  30. Du, M.; Yuan, X. A survey of competitive sports data visualization and visual analysis. J. Vis. 2021, 24, 47–67. [Google Scholar] [CrossRef]
  31. Huang, J.-H.; Hsu, Y.-C. A Multidisciplinary Perspective on Publicly Available Sports Data in the Era of Big Data: A Scoping Review of the Literature on Major League Baseball. SAGE Open 2021, 11, 21582440211061566. [Google Scholar] [CrossRef]
  32. Lage, M.; Ono, J.P.; Cervone, D.; Chiang, J.; Dietrich, C.; Silva, C.T. Statcast dashboard: Exploration of spatiotemporal baseball data. IEEE Comput. Graph. Appl. 2016, 36, 28–37. [Google Scholar] [CrossRef]
  33. Mizels, J.; Erickson, B.; Chalmers, P. Current state of data and analytics research in baseball. Curr. Rev. Musculoskelet. Med. 2022, 1–8. [Google Scholar] [CrossRef]
  34. Arth, Z.W.; Billings, A.C. Batting average and beyond: The framing of statistics within regional Major League Baseball broadcasts. Int. J. Sport Commun. 2021, 14, 212–232. [Google Scholar] [CrossRef]
  35. Rock, I.; Linnett, C.M.; Grant, P.; Mack, A. Perception without attention: Results of a new method. Cogn. Psychol. 1992, 24, 502–534. [Google Scholar] [CrossRef]
  36. Vatavu, R.-D.; Mancas, M. Evaluating visual attention for multi-screen television: Measures, toolkit, and experimental findings. Pers. Ubiquitous Comput. 2015, 19, 781–801. [Google Scholar] [CrossRef]
  37. Ashcraft, M.H. Human Memory and Cognition; Scott, Foresman & Co.: Washington, DC, USA, 1989. [Google Scholar]
  38. Lang, A.; Bolls, P.; Potter, R.F.; Kawahara, K. The effects of production pacing and arousing content on the information processing of television messages. J. Broadcast. Electron. Media 1999, 43, 451–475. [Google Scholar] [CrossRef]
  39. Jeong, S.-H.; Fishbein, M. Predictors of multitasking with media: Media factors and audience factors. Media Psychol. 2007, 10, 364–384. [Google Scholar] [CrossRef]
  40. Arth, Z.W. Framing the Game Through a Sabermetric Lens: Major League Baseball Broadcasts and the Delineation of Traditional and New Fact Metrics; The University of Alabama: Tuscaloosa, AL, USA, 2019. [Google Scholar] [CrossRef]
  41. Lang, A. The limited capacity model of mediated message processing. J. Commun. 2000, 50, 46–70. [Google Scholar] [CrossRef]
  42. Chen, C.-Y.; Zheng, M.-C. Optimizing the Information of Sport Graphics in the Major League Baseball. In International Conference on Human-Computer Interaction; Springer: Berlin/Heidelberg, Germany, 2021. [Google Scholar]
  43. Cummins, R.G.; Gong, Z. Mediated intra-audience effects in the appreciation of broadcast sports. Commun. Sport 2017, 5, 27–48. [Google Scholar] [CrossRef]
  44. Henneberry, S. Baseball broadcasting in the digital age: The role of narrative storytelling. 2016. Available online: https://conservancy.umn.edu/bitstream/handle/11299/181493/Henneberry,%20Steven%20-%20CAPSTONE_FINAL.pdf?sequence=1 (accessed on 10 September 2022).
  45. Oliver, M.B.; Bartsch, A. Appreciation of entertainment: The importance of meaningfulness via virtue and wisdom. J. Media Psychol. Theor. Methods Appl. 2011, 23, 29. [Google Scholar] [CrossRef]
  46. Schmutz, P.; Heinz, S.; Métrailler, Y.; Opwis, K. Cognitive load in eCommerce applications—Measurement and effects on user satisfaction. Adv. Hum.-Comput. Interact. 2009, 2009, 121494. [Google Scholar] [CrossRef] [Green Version]
  47. Bahk, C.M. Sex differences in sport spectator involvement. Percept. Mot. Ski. 2000, 91, 79–83. [Google Scholar] [CrossRef] [PubMed]
  48. Cummins, R.G.; Hahn, D. Re-presenting sport: How instant replay and perceived violence impact enjoyment of mediated sports. Mass Commun. Soc. 2013, 16, 787–807. [Google Scholar] [CrossRef]
  49. Greer, J.D.; Hardin, M.; Homan, C. “Naturally” less exciting? Visual production of men’s and women’s track and field coverage during the 2004 Olympics. J. Broadcast. Electron. Media 2009, 53, 173–189. [Google Scholar] [CrossRef]
  50. Horky, T.; Pelka, P. Data Visualisation in Sports Journalism: Opportunities and challenges of data-driven journalism in German football. Digit. J. 2017, 5, 587–606. [Google Scholar] [CrossRef]
  51. Horton, M.; Read, J.C.; Willitts, C. InCuDe: Heuristics for Enhancing Spectator Experience in Streamed Games. In Proceedings of the International Conference on Human-Computer Interaction, Copenhagen, Denmark, 19–24 July 2020; Springer: Berlin/Heidelberg, Germany, 2020. [Google Scholar] [CrossRef]
  52. Chuang, M.; Narasimhan, P. Automated viewer-centric personalized sports broadcast. Procedia Eng. 2010, 2, 3397–3403. [Google Scholar] [CrossRef] [Green Version]
  53. Verstockt, S.; Mannens, E.; de Bock, J. Data-driven Summarization and Synchronized Second-screen Enrichment of Cycling Races: Using Live and Historical Sports Data to Reinvent Traditional Reporting. In Proceedings of the 1st International Workshop on AI for Smart TV Content Production, Access and Delivery, Nice, France, 21 October 2019. [Google Scholar] [CrossRef]
Figure 1. Contents of baseball graphical information displayed under the four conditions. “1 = control state”, “2 = information on pitcher”, “3 = information on batter”, “4 = information on both the pitcher and batter”.
Informatics 09 00082 g001
Figure 2. Visual information had no substantial effect on HPL, while the presence or absence of visual information affected the effect of the LPL group in different scales.
Informatics 09 00082 g002
Figure 3. Evaluation of media entertainment experience’s Interaction plot.
Informatics 09 00082 g003
Figure 4. NASA-TLX e’s Interaction plot.
Informatics 09 00082 g004
Figure 5. The use of visualized information is very different for different ethnic groups, and the use of visualized information is more positive on LPL.
Informatics 09 00082 g005
Table 1. Results of ex ante comparison between the two scales with and without the provision of visualized information (Statistical significance).
GroupVariablesErrorTDegree of Freedomp
LPLEnjoyment0.412−3.054116.980.003 **
Meaningful0.366−3.121129.920.002 **
knowledge0.616−1.066105.8430.289
Mental demand11.245−2.110119.8970.037 *
Temporal demand9.021−1.325112.5170.188
Performance14.540−1.053109.1310.295
Effort13.6860.355111.0760.723
Frustration10.1010.41699.5820.678
HPLEnjoyment0.5320.858115.6960.393
Meaningful0.542−0.63099.5470.530
knowledge0.4770.912120.1650.364
Mental demand−12.782−3.508102.4380.001 **
Temporal demand−11.882−2.224122.0800.028 *
Performance12.842−0.09399.9230.926
Effort12.551−2.2532440.025 *
Frustration7.249−2.470183.7120.014 *
* p < 0.05; ** p < 0.01.
Publisher’s Note: MDPI stays neutral with regard to jurisdictional claims in published maps and institutional affiliations.

