Article

Proposal of a Method for the Analysis of Sentiments in Social Networks with the Use of R

by
William Villegas-Ch.
1,*,
Sofía Molina
1,
Víctor De Janón
1,
Estevan Montalvo
1 and
Aracely Mera-Navarrete
2
1
Escuela de Ingeniería en Tecnologías de la Información, FICA, Universidad de Las Américas, Quito 170125, Ecuador
2
Departamento de Sistemas, Universidad Internacional del Ecuador, Quito 170411, Ecuador
*
Author to whom correspondence should be addressed.
Informatics 2022, 9(3), 63; https://doi.org/10.3390/informatics9030063
Submission received: 28 July 2022 / Revised: 15 August 2022 / Accepted: 16 August 2022 / Published: 24 August 2022
(This article belongs to the Special Issue Information Analysis and Retrieval in Social Media)

Abstract

:
Decision making is vital for the management of all organizations. For this reason, data analysis has become one of the fastest-growing technologies when it comes to generating information and knowledge about data generated by organizations. However, data generation is not limited to traditional sources. On the contrary, emerging technologies and social networks have become non-traditional sources that provide large volumes of data that can be exploited using different data analysis methods. Here, the objective is to determine the feelings of the population toward a brand, a product, or a service and to even identify the reactions of people to events and trends generated in their environment. Sentiment analysis, for organizations and social groups, has become a necessity that must be covered to identify the acceptance of an idea or its management. Therefore, this work proposes a method for the analysis of sentiment in social networks in such a way that it adapts to the needs of organizations or sectors, and the acceptance or rejection of the population can be efficiently identified from what is exposed in a social network.

1. Introduction

Recently, social networks have become sources of a large volume of data. These data reveal the feelings of a population on a specific topic or on a trend that sparks the interest of society. It is for this reason that many companies or organizations have some interest in generating knowledge about data from social networks [1]. This strategy, also known as sentiment analysis, has the primary objective of identifying trends in user opinions, as well as evaluating their emotions, studying their behavior, and determining existing attitudes based on their reactions. Sentiment analysis in organizations highlights the importance of data analysis in obtaining a competitive advantage in different market sectors [2]. By collecting direct information on users’ feelings about a product, a brand, or a service, it is possible to generate strategies for the decision making and positioning of the organization.
The interest in sentiment analysis is not new, and different organizations aiming to capture the sentiment of users have made multiple comparisons using traditional data sources, such as surveys, interviews, or forms. These instruments are applied to an objective population of consumers, especially users of the brand, product, or service [3]. Recently, the methodology has changed, and what is sought is to take advantage of the digital footprint that people leave on social networks with the use of an Internet connection. This process has allowed the evolution of techniques to identify the feelings of users, and new tools are applied that allow capturing the feelings of people in an agile, timely manner with existing data in a social network [4]. Another factor that determines the importance of sentiment analysis today is cost reduction since traditional methods and instruments require considerable investments that must be incurred by organizations if they wish to acquire the opinions of their clients or a population of interest. On the other hand, current techniques allow establishing processes at a low cost, considering that the information already exists in social networks.
According to the works reviewed, it is established that sentiment analysis is part of the development of digital culture, currently being the most used communication tool between society and organizations. However, its penetration is not limited to organizations, since the opinions and sentiments expressed by users can go further and represent the opinion of the population toward a government or its policies [5,6]. For data processing, a group of the works reviewed started from an algorithm methodology based on supervised learning. This methodology facilitates the calculation of the semantic orientation of the texts, which reveals the polarity of the terms in the text, and in this way, a positive or negative semantic orientation is generated.
Another group of works is focused on the application of opinion mining techniques that seek to identify trends in the data of a social network. These trends can be analyzed in past, present, and future periods with the data available in social networks [7]. The analysis process is mainly focused on the evolution of multiple techniques and tools that encompass the extraction of opinions from keywords to develop concepts. In addition, there is another group of works that evaluate the opinions of users through natural language processing techniques with the use of polarity and syntactic dependency dictionaries that apply rules based on the semantics of the texts.
Regarding the programming languages used for sentiment analysis, several of the reviewed works carried out an in-depth analysis of different options. Among these, R stands out as an ideal language for data analysis in general. R enables sentiment analysis in a very broad ecosystem, which is why it is among the most widely used languages in scientific applications [8]. The R programming language has a wide range of libraries that enable comprehensive statistical analysis. In addition, it is important to consider that R is open-source software, which is presented as a competitive advantage for its use in data analysis.
The R libraries used in this proposal are packages that allow a sentiment analysis that guarantees the results. One of the most important libraries in parsing is tidytext; this library contains the necessary tools for text manipulation. Among the features of tidytext is that it helps convert freeform text into a neat table, which makes it easy to visualize data and use statistical techniques. Information in an ordered text format makes it easy to apply filters, calculate sums, and generate plots. To do this, one of the functions that are of great value when using tidytext is unnest_tokens(), which allows one to automate the process of tokenization and storage in the preferred format in a single step.
The use of the tidytext library and its importance are expanded upon in the method in [9]. However, for the complementation and validation of the use of different libraries, it is important to highlight that other reviewed works refer to the fact that the packages available in R are created to cover different needs in sentiment analysis. For this reason, it is important to highlight that libraries such as SentimentAnalysis, sentimentr, and syuzhet were excluded from the proposed method when it was verified that, in the case of SentimentAnalysis, it does not accept languages other than English; this work was carried out in a Spanish-speaking country, so using this library would be a disadvantage. The sentometrics library studies time series of text data and can extend the polarity scoring function to handle complicated linguistic edge cases; therefore, its processing is slower than other libraries that do not attempt this functionality. This is the case for tidytext, which does not have an explicit sentiment calculation function, but its toolset can be used to create one. The main reason for discarding the mentioned libraries is that none of them, including syuzhet, explicitly document the procedures that are applied with algorithms and formulas. Therefore, the results of the analysis are not interpretable from the perspective of this work. This means that there is no transparency in the definition of the methodology, even when it is possible to see the original code.
In addition to these libraries, similar works made use of the FiGASR package, which allows taking advantage of natural language processing (NLP) techniques to easily perform sentiment analysis. This package is a wrapper for the SentiBigNomics Python package; given a list of texts as input and a list of tokens of interest (ToI), the algorithm parses the texts and calculates the sentiment associated with each ToI. Two key features characterize this approach. First, it is fine-grained, as words are assigned a polarity score ranging from [−1,1] according to a dictionary. Second, the algorithm selects the piece of text that relates to the ToI based on a set of semantic rules and calculates sentiment from that text only, rather than the entire dataset. The package includes some additional features, such as automatic negation handling, verb tense detection, location filtering, and the exclusion of some words from the sentiment calculation. However, FiGASR only supports the English language, as it is based on the Python version 3.10.4 module’s en_core_web_lgspaCy language model. It is for this reason that its use is ruled out in our proposal.
As success stories, several works highlighted the importance of sentiment analysis in advertising campaigns, as well as in political campaigns. These campaigns, by using information from social networks effectively, have managed to create marketing strategies that have led to the triumph of ideas or political candidates, such as the case of former United States President Barack Obama, whose team gave great importance to the use of data mining [10,11]. This technique can detect opinions expressed on social networks, which facilitates the execution of an emotional effect analysis of speeches, considerably improving the acceptance of ideas in the population.
Sentiment analysis is considered a competitive advantage among organizations. However, its application in certain sectors has not had the expected penetration. The factors that determine the use of sentiment analysis are varied; among the main ones is the lack of technical training on the application of a model that allows the extraction, transformation, and analysis of data. Another factor is the lack of marketing resources that allow establishing processes that improve decision making through the feelings and trends exposed on social networks by the organization’s clients or its target population [12]. This work presents a method for sentiment analysis in a social network that can be used by medium-sized companies that seek to identify the sentiment of their customers regarding the products, brands, or services they offer. To evaluate the proposed method, its application was tested in a marketing environment to identify the sentiment of the population on political trends in the country where this work was carried out [13].

2. Materials and Methods

To describe the development of the method, it is necessary to cover several concepts that make up the operating basis of the proposal. In addition, it is important to establish the prerequisites, as well as the necessary tools, for the implementation of a scalable and adaptable sentiment analysis method.

2.1. Identification of Requirements

The requirement that is considered most relevant in this proposal is the handling of data from non-traditional sources since the datasets are extracted directly from social networks. The validity of these sources lies mainly in the veracity of the data compared to data obtained from instruments such as surveys. In these instruments, the design and subsequent analysis are important in determining the validity of the survey and the incidence values of each question to respond to a phenomenon [14]. On the other hand, in a social network environment, it is important to establish which platforms are the most used by the target population. This segmentation is important considering the great penetration of social networks in society. According to data identified in similar works, 4.62 million people in the world use social networks, which represents an annual growth rate of 12% since 2012. In 2021, the use of social networks grew at an average rate of 13.5 new users per second. In addition, worldwide, it has been estimated that people spend an average of 2 h 27 min a day on social networks. These data are important in establishing social networks as a current data source, with a high importance index for identifying trends and patterns in users [15].
There are other important data to consider in social networks, such as the statistics on advertising on these platforms. For example, the projected advertising spending in 2022 could reach more than USD 173 million, this being a primary factor for organizations. For its part, video advertising spending on social networks will grow this year by 20.1% to reach the figure of USD 24.35 billion. Next, the most used social networks are presented according to their specific targets and orientations and the most relevant data [16].
  • Instagram:
  • It has more than 1.5 billion users;
  • Instagram ads reach nearly 30% of internet users;
  • Instagram is the fourth most popular social network in the world;
  • Users aged 25–34 make up the largest cohort of Instagram users;
  • 91% of active users say they watch videos on the platform weekly;
  • 50% of users have clicked through to a brand’s website after seeing it in Stories;
  • 92% of users say they have acted on the spot after seeing a product on Instagram;
  • Ads are more likely to reach men and women ages 18–34.
  • Facebook:
  • The number of active Facebook users is close to 3 billion people, that is, 36% of the world’s population;
  • 58.8% of Internet users in the world use Facebook every month;
  • About 66% of users connect to the site every day;
  • 20% of Facebook users in the world are men between the ages of 25–34;
  • Women aged 13–17 are the smallest demographic of Facebook users in the world;
  • Facebook is the most used social media platform in the world;
  • 66% of Facebook users visit a local business page at least once a week;
  • In 2021, a third of Facebook users made purchases on the platform;
  • Almost 50% of Facebook users also use Twitter.
  • Twitter:
  • Users spend, on average, 5.1 h per month on Twitter;
  • 22% of Americans use Twitter;
  • Twitter will have 76.5 million users in Latin America in 2022;
  • 38.5% of Twitter users are between 25 and 34 years old;
  • Only 6.6% of Twitter users are 13–17;
  • Twitter’s audience is predominantly male: 70.4% of the platform’s demographic identifies with that gender, leaving only a 29.6% female audience on Twitter;
  • People spend about 5 h a month browsing Twitter;
  • Almost 55% of Twitter users also use TikTok;
  • The total number of Twitter users globally is expected to reach 340 million by 2024;
  • People spent 6 min a day on Twitter in 2022;
  • 52% of users check Twitter daily, 84% check it weekly, and 96% check it monthly;
  • Twitter is the social network most frequently used for the generation of political comments and content.
  • YouTube:
  • People spend, on average, 23.7 h a month on YouTube;
  • YouTube is the second most used social media platform in the world, with more than 14 billion total views;
  • People spend, on average, 19 min a day on YouTube;
  • Around 694,000 h of video is streamed on YouTube every minute of the day;
  • Mobile users visit twice as many pages on YouTube than desktop users;
  • 70% of viewers bought from a brand after seeing it on YouTube;
  • Ads targeted to users by intent (and not by demographics) achieved a 100× higher increase in purchase intent;
  • Advertising on YouTube has the potential to reach 2.56 billion users.
Among the social networks described, Twitter is the social network selected for the design of the method. It was selected because this social network is used more frequently to post relevant content or comments on a topic, turning it into a social network of opinion [17]. This has given way to political groups taking advantage of their potential to transmit ideas for or against a political idea or a trending issue, for example, education, security, employment, and unemployment rates. Its characteristic of short comments on a topic allows for establishing this social network as an optimal data source for the application of the method [18].
With the use of Twitter, political sectors find a dedicated, digital, and political space, since, with its use, they can establish spaces for media coverage, where the organization of social groups is one of their objectives. In addition, the use of this platform can achieve various objectives, such as suggesting the dissemination of news, images, or links that show an ideology or political tendency [19]. Once the potential of the social network and its penetration in the target population have been established, it is important to define the tools for the implementation of the sentiment analysis model.

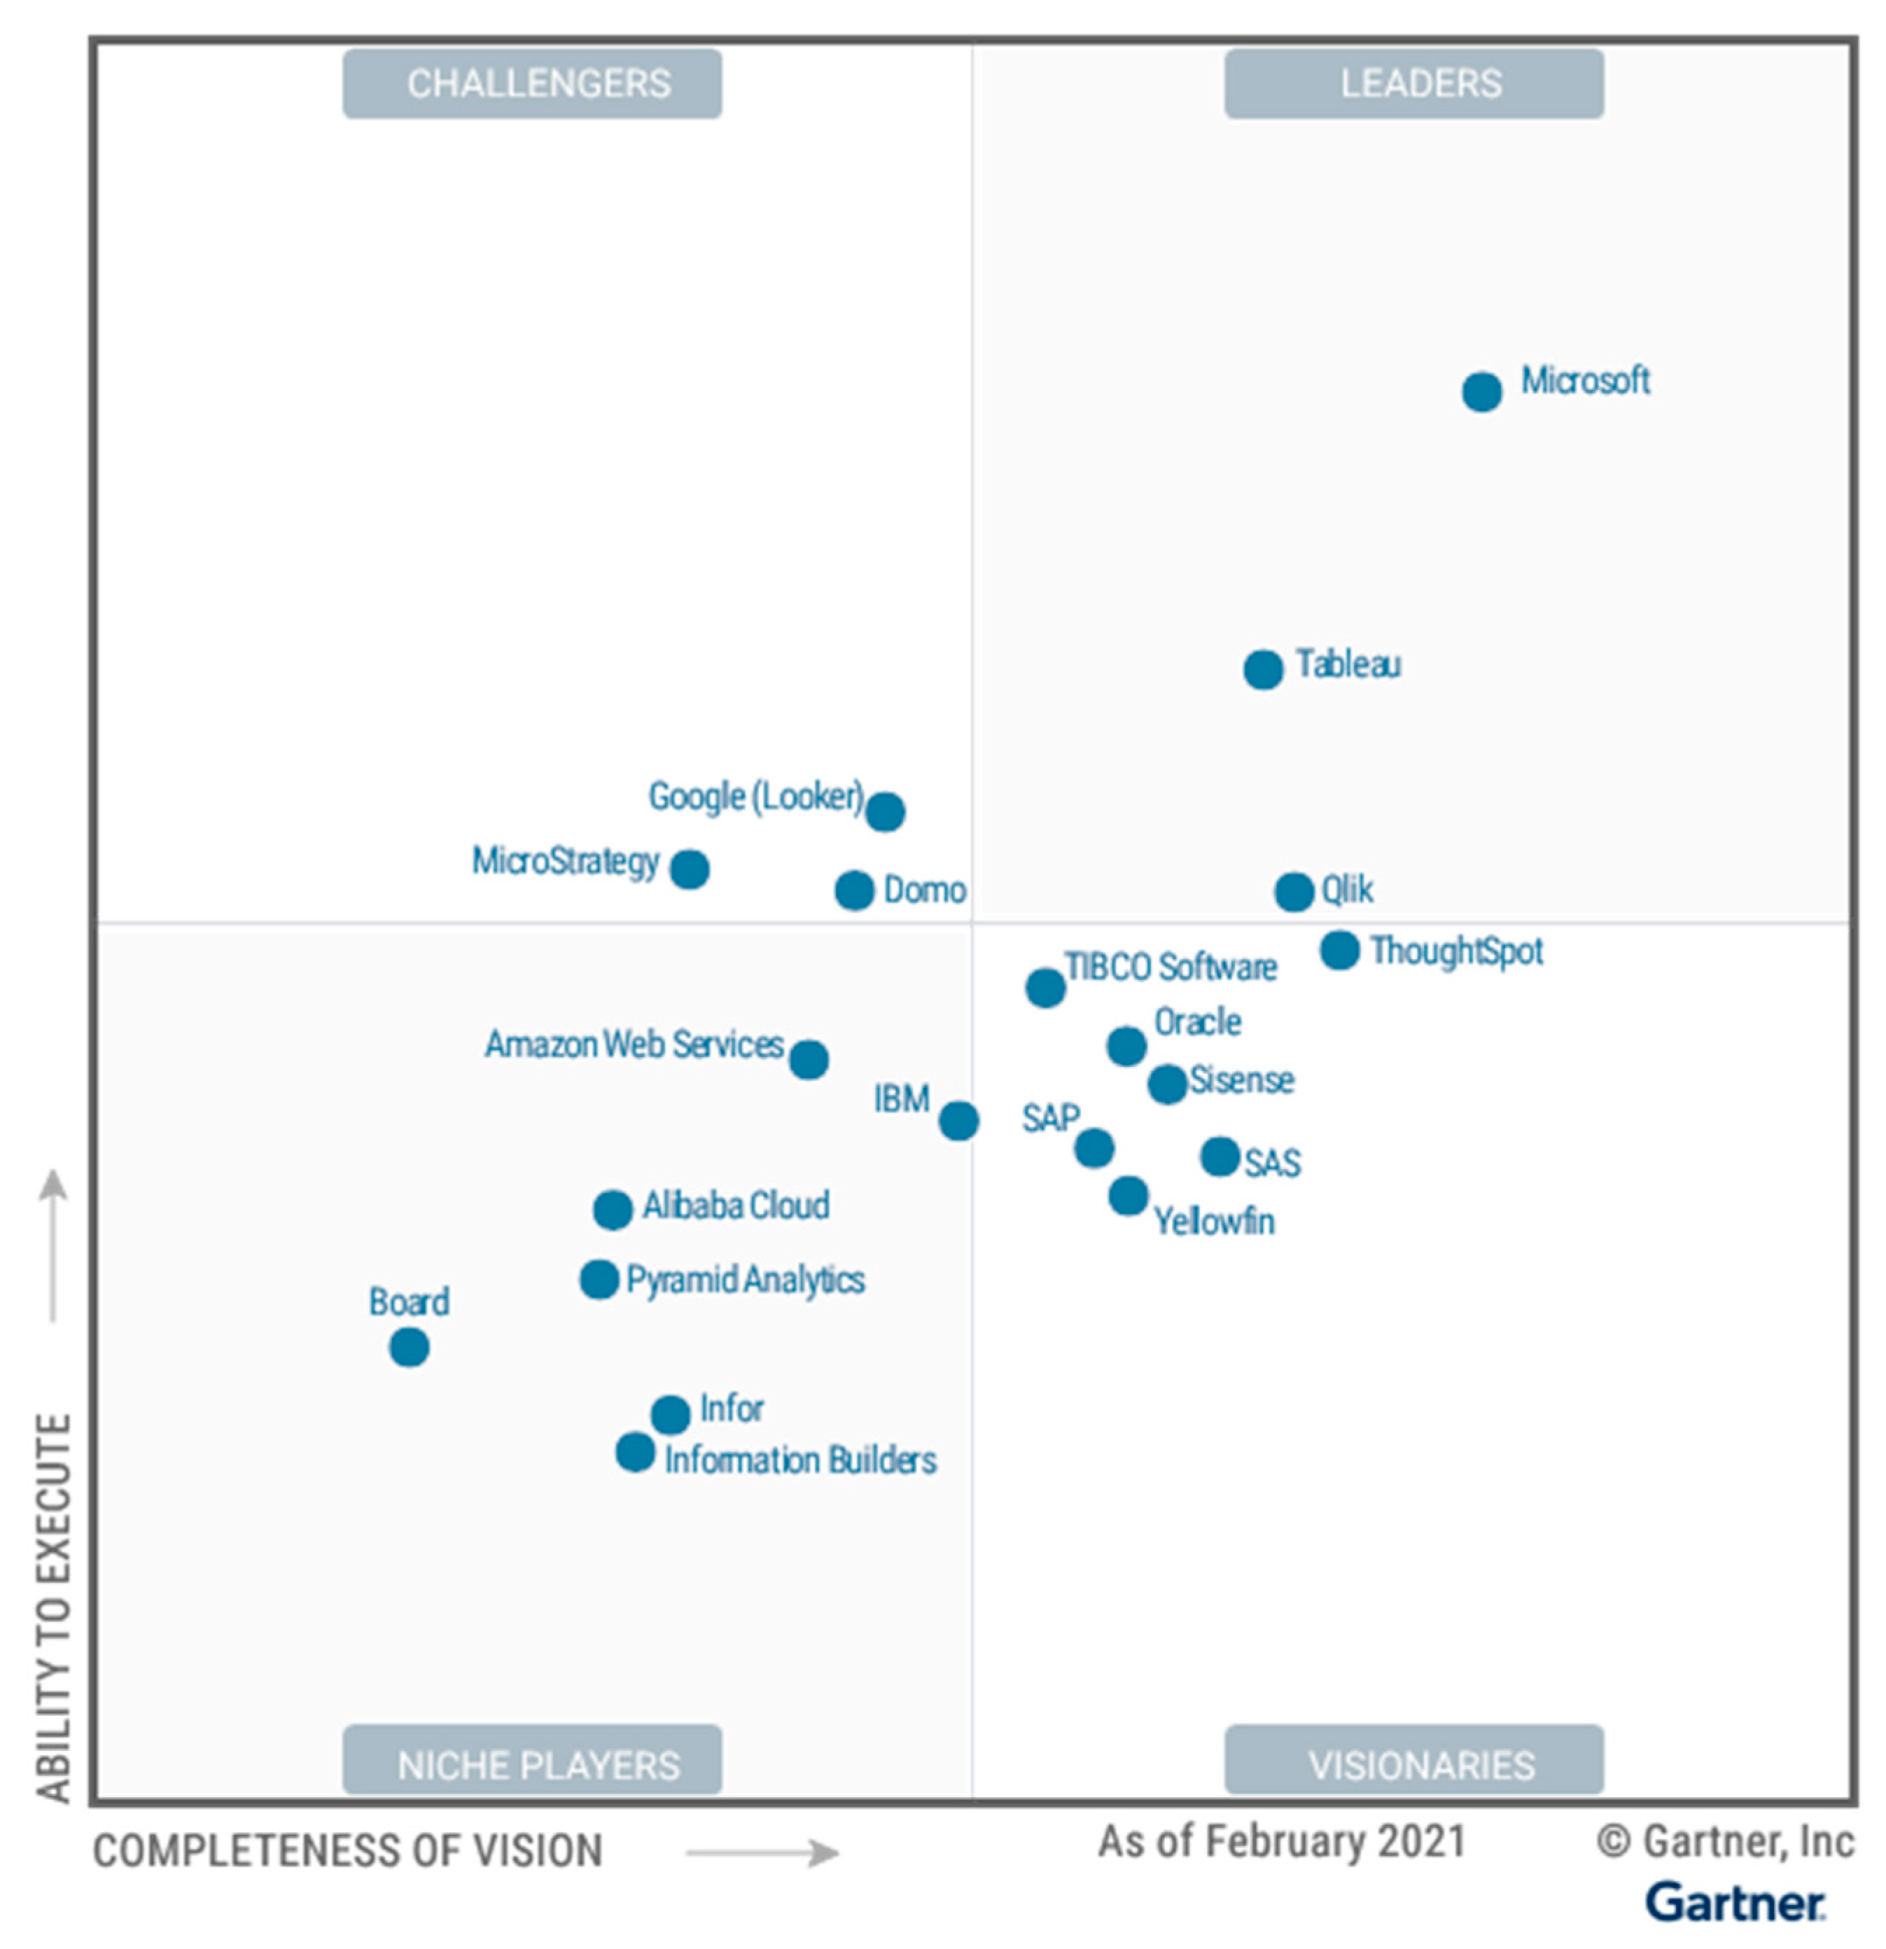
2.2. Selection of Tools for Sentiment Analysis

For the selection of tools for the analysis of sentiments in the tweets of the target population, it is necessary to consider certain parameters, such as costs, technical functionality, statistical tools, etc. In addition, one of the important points is that the method can be replicated in other areas that need an analytical tool to establish the sentiment of their customers [20,21]. From this perspective, the preselection of two tools that allow the download of tweets and the analysis of sentiments was made. These tools are Python and R Studio, both of which can manage data from non-traditional sources and deliver meaningful analytical results. Both Python and R have features that allow them to manage a high component in natural language processing. However, when considering the R programming language in statistical packages, this tool has greater strength than Python. This is what makes several researchers in the scientific field prefer the use of R over Python to perform analytical tasks [22].
Therefore, for the development of this work, R Studio was used as a programming language tool. In addition, several reviewed works highlight that R is a tool with greater potential for tasks such as web scraping, data cleaning, and treatment, as well as the analytics it offers. Once the Twitter dataset was downloaded, it was loaded into a database that operates as a repository of said information. MySQL Enterprise Edition open-source version 8.0.29 was used to create the repository. This selection was made due to the advantages that this engine presents, such as its high speed and good performance and the low probability of data corruption [23].
In the visualization phase, tools that are used in business intelligence and that are leaders according to the Gartner quadrant were considered, as presented in Figure 1. According to the data presented for 2021, in the graph, among the main tools, Microsoft Power BI, Tableau public 2021.3 and Qlik sense stand out, these tools use the corporate license of the university that participates in this study in Quito, Ecuador [24,25,26].
Considering the tools in the Gartner graph, an analysis of the main characteristics of the three tools found in the leaders’ quadrant was carried out. Table 1 presents a comparison of the selected platforms.
According to the most relevant data on the tools, it was identified that they have a similar methodology for use. The three tools offer an intuitive interface that favors the construction of data panels in a simple way that enables the interpretation and visualization of information. However, with its revised features, the use of Power BI appears to the best option [27,28]. This tool integrates directly and easily with MySQL and R, which is an advantage of the use of these tools. In addition, it provides dashboard executions that allow interaction with the end user, and it can modify or obtain dashboards that suit the user’s needs [29,30].

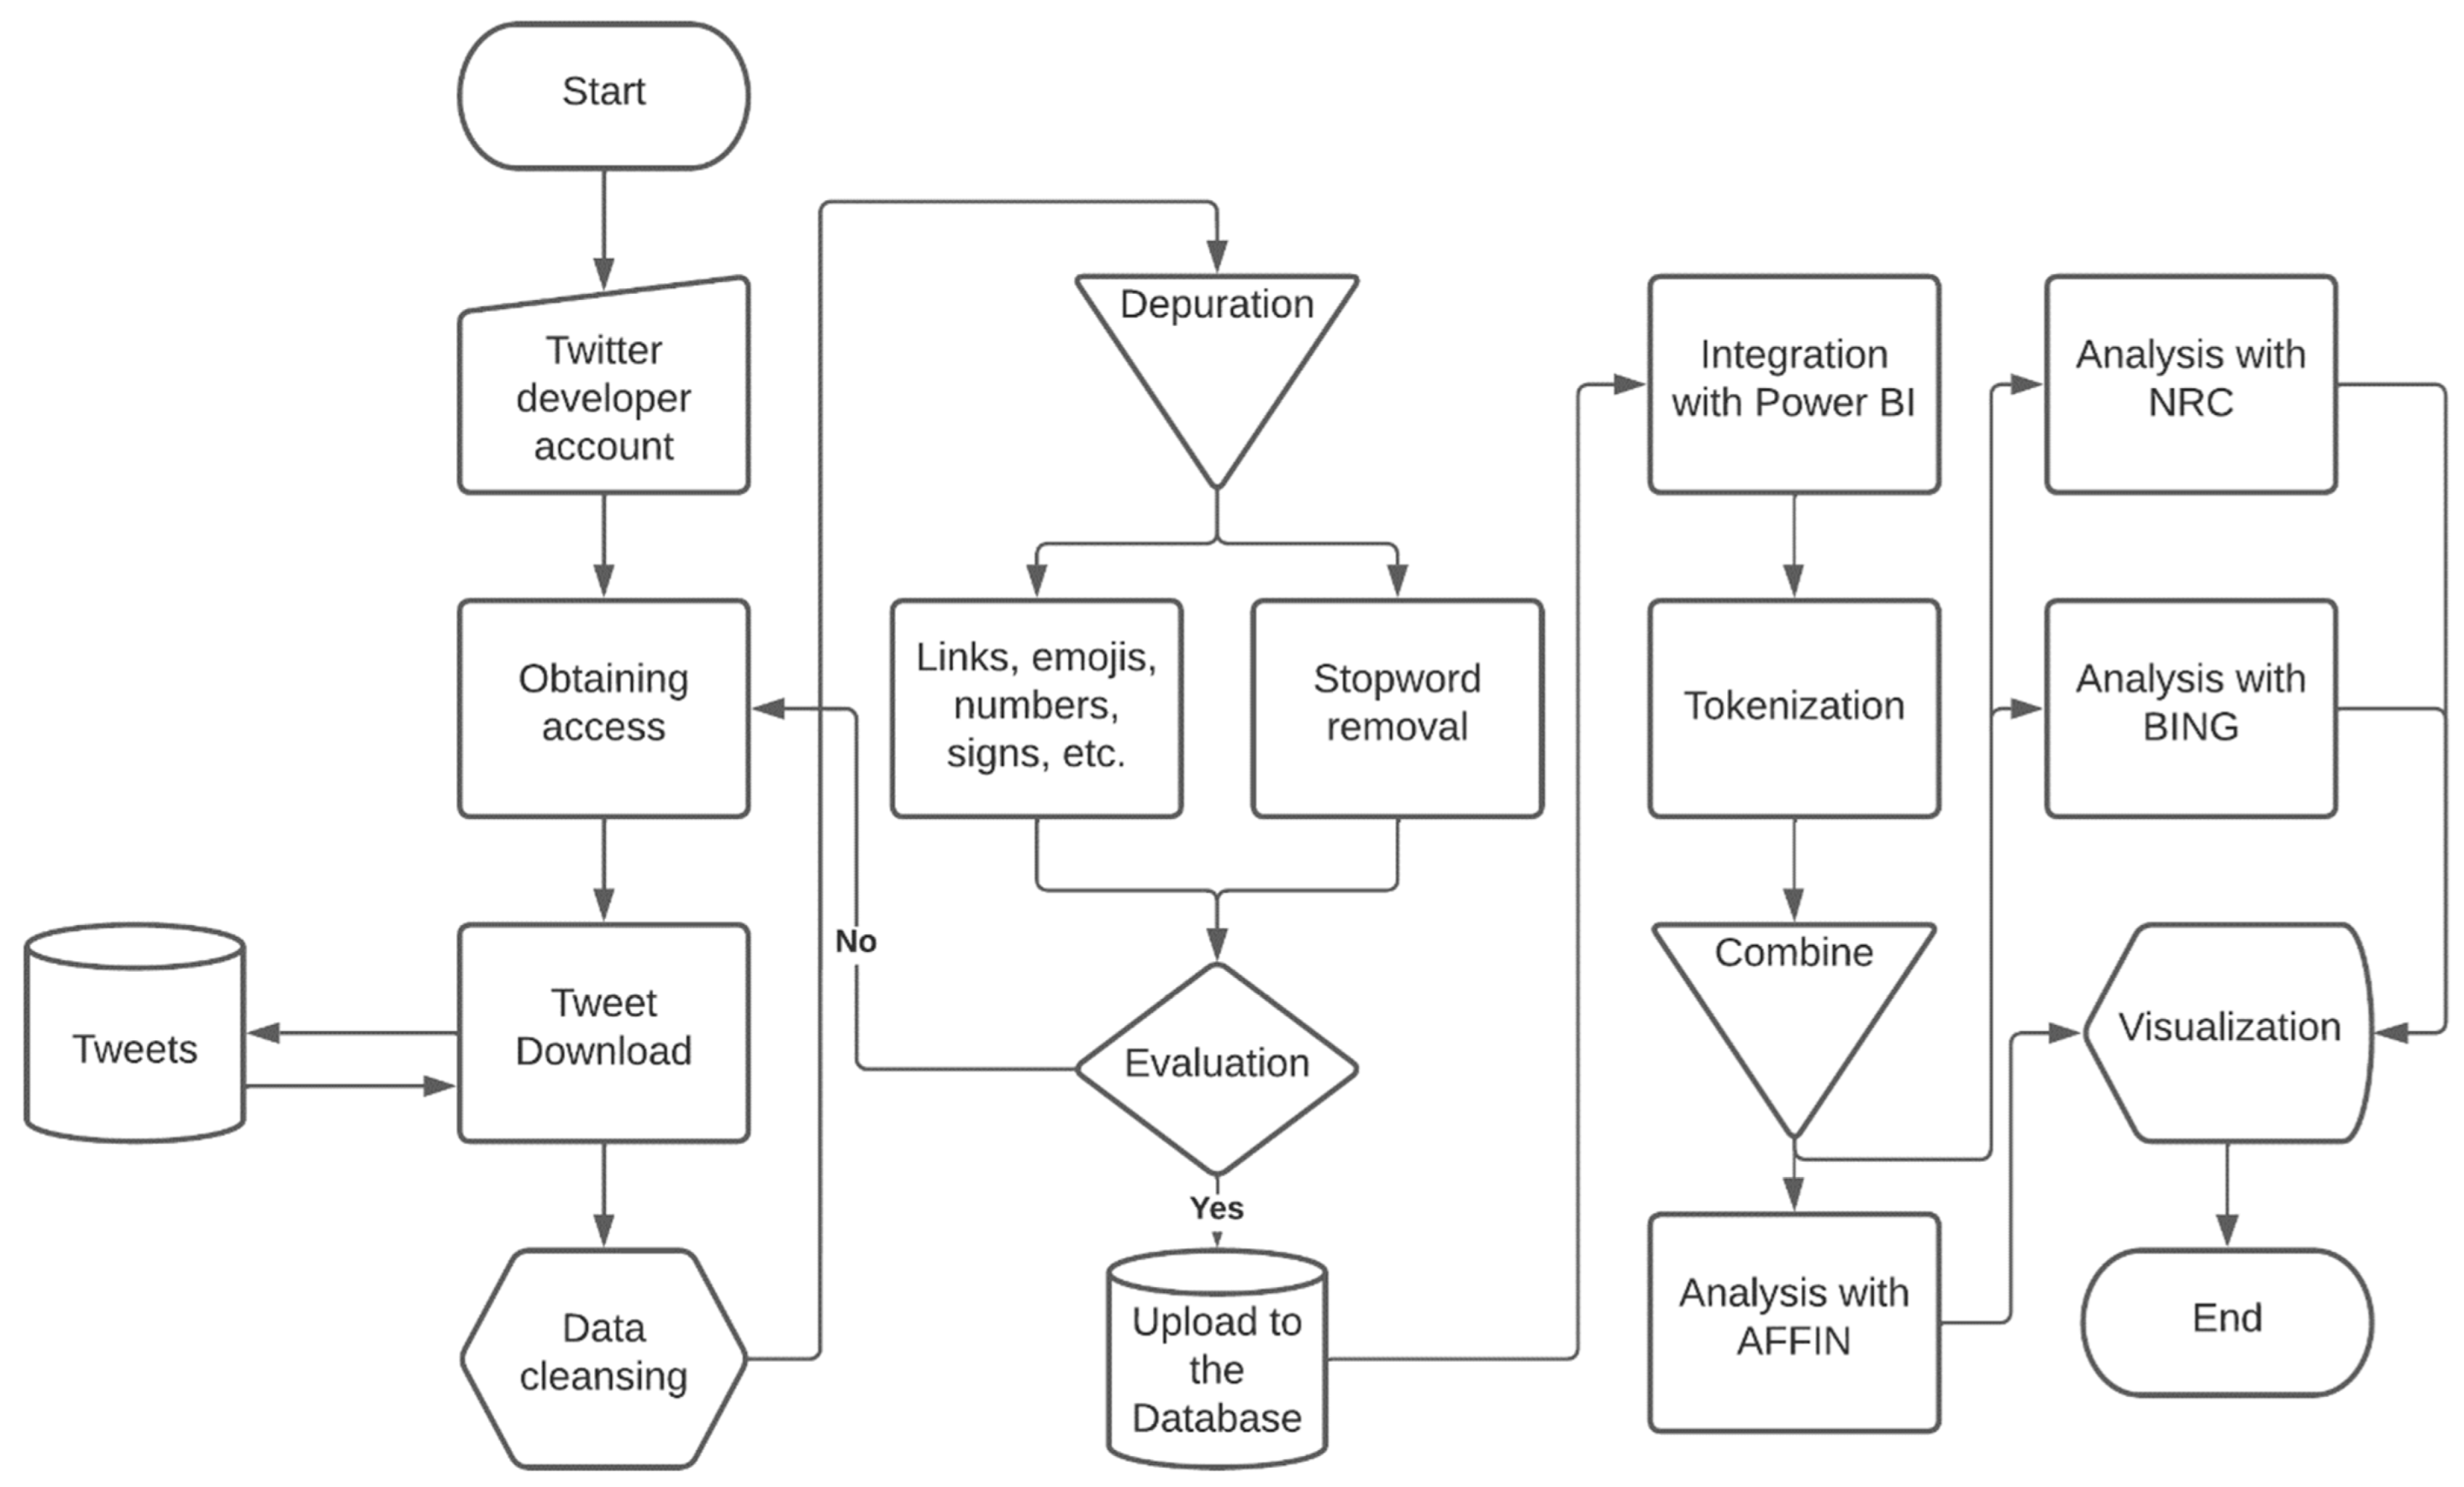
2.3. Method for Sentiment Analysis of Social Networks

For the proposed method, the phases necessary for the extraction of data and the storage, transformation, and presentation of information are taken as a reference. Figure 2 presents the method and its components, in addition to the tools that were previously analyzed and selected, guaranteeing the veracity of the results. In the first phase, the need to access the data is indicated, that is, the tweets; for this, it is necessary to create an account on the Twitter Developers platform. This is a portal that offers various resources to people and organizations that need to access data [31]. Resources include tools, data, and application programming interface (API) products that can integrate different solutions. Twitter Developers has three main products. The first product is the Ads API, which allows users to create, manage, and schedule ad campaigns and extract ad analytics. The second product is Twitter for Websites, which allows the integration of content from the social network in real time into the product from the source. The third product is the Twitter API, which was used in this work to perform sentiment analysis [32].
The Twitter API used in the sentiment analysis method allows the user to retrieve, create, and search for different elements of tweets, such as spaces, users, direct messages, trends, media, places, etc. These elements are crucial in sentiment analysis and become the source of data that allows us to identify current trends and issues. Another characteristic of the API is that its application generates the API Key; this is necessary for authentication and integration with the developer products of this social network [33]. During the development, it is necessary to specify the title and the description of the application. In this way, Twitter provides the access keys and identification tokens to access the data and extract those that are necessary for the analysis. Next, an example of the generation of access keys generated by the API is presented. For security, the first and last segments of the keys have been omitted and have been replaced by the letter “X”.
  • consumerKey<-“XXXXXXXXgEVum0pkpXXXXXXXX”
  • consumerSecret<-“XXXXXXXX7oip3jzH5zmaAD2LJ6fw8xpC5MrajfgeXXXXXXXX”
  • accessToken<-“XXXXXXXX77787523073-zZUX7Ai9br7mCoCxpCNyPSXXXXXXXX”
  • accessSecret<-“XXXXXXXXfVRvMTbUcx2aJyk4whfQYS3coFMhXXXXXXXX”
  • option(httr_oauth_cache=TRUE)
  • twitter_token<-create_token(consumer_key = consumerkey, consumer_secret = consumerSecret, access_token = accessToken, access_secret = accessSecret)

2.3.1. Downloading of Information

Once authentication has been carried out and the platform assigns the corresponding access keys, the next phase is to download the information. For this, the Rtweet library was used, which makes it possible to download the information. In previous works, other libraries were reviewed that, in theory, fulfill the same objective, which is to download the necessary information [34,35]. However, when applying the libraries, they do not allow the complete download of the tweet, directly affecting sentiment analysis [36,37]. In the code presented below, a “search_tweets()” function is generated, in which specific parameters are set, such as the date on which the search for tweets will be carried out, for which it needs the data (from-to). The established period is very important in downloading data, since, in this way, the importance and optimization of resources such as time and storage of unnecessary downloads are guaranteed [38]. In the search for tweets, as this is an example, the search name is set to (XXXXX XXXXX): in this space, the search name must be input, which, in the results, will take the name of the study characters.
  • nt<-500
  • until<-Sys.Date()
  • since<-“2022-06-05”
  • health-1<- search_tweets(“XXXXX XXXXX, health”,n, since = since, until = until)
  • economy-1<- search_tweets(“XXXXX XXXXX, economy”,n, since = since, until = until)
  • security-1<- search_tweets(“XXXXX XXXXX, security”,n, since = since, until = until)
  • education-1<- search_tweets(“XXXXX XXXXX, education”,n, since = since, until = until)

2.3.2. Cleanup of Tweets

The cleaning of tweets is important in the analysis, since, in this phase, the results are guaranteed. To comply with this process, the “dplyr” library was used, which facilitates the handling of data files in R Studio and provides a simple grammar for the handling of verbs [39]. In addition, it can manipulate and operate data frames. The used function of the dplyr library is gsub; with this function, it is possible to delete mentions, links, emojis, numbers, and punctuation marks. In the second process, the existing spaces and line breaks in the tweets are eliminated [40]. In this process, it is necessary to carry out a review of the elements that make up the tweet in such a way that all elements that do not contribute to the sentiment analysis are eliminated.
For natural language processing, the “tm” library was used, which allows stop words or empty words to be eliminated. These correspond to a list of words that include articles, connectors, pronouns, and prepositions that do not contribute to the identification of the feeling. An example of the configuration is presented below:
  • text <- gsub(“@\\w+”, text)
  • text <- gsub(“https?://.+”, “”, text)
  • text <- gsub(\\d+\\w*\\d*, “”, text)
  • text <- gsub(“#\\w+”, “”, text)
  • text <- gsub(“[^\x01-\x7F]”, “”, text)
  • text <- gsub(“[[:punct:]]”, “”, text)
  • text <- gsub(“\n”, “”, text)
  • text <- gsub(“^\\s+”, “”, text)
  • text <- gsub(“\\s+$”, “”, text)
  • text <- gsub(“[ |\t]+”, “”, text)
  • text <- gsub(“[[:cntrl:]]”, “”, text)

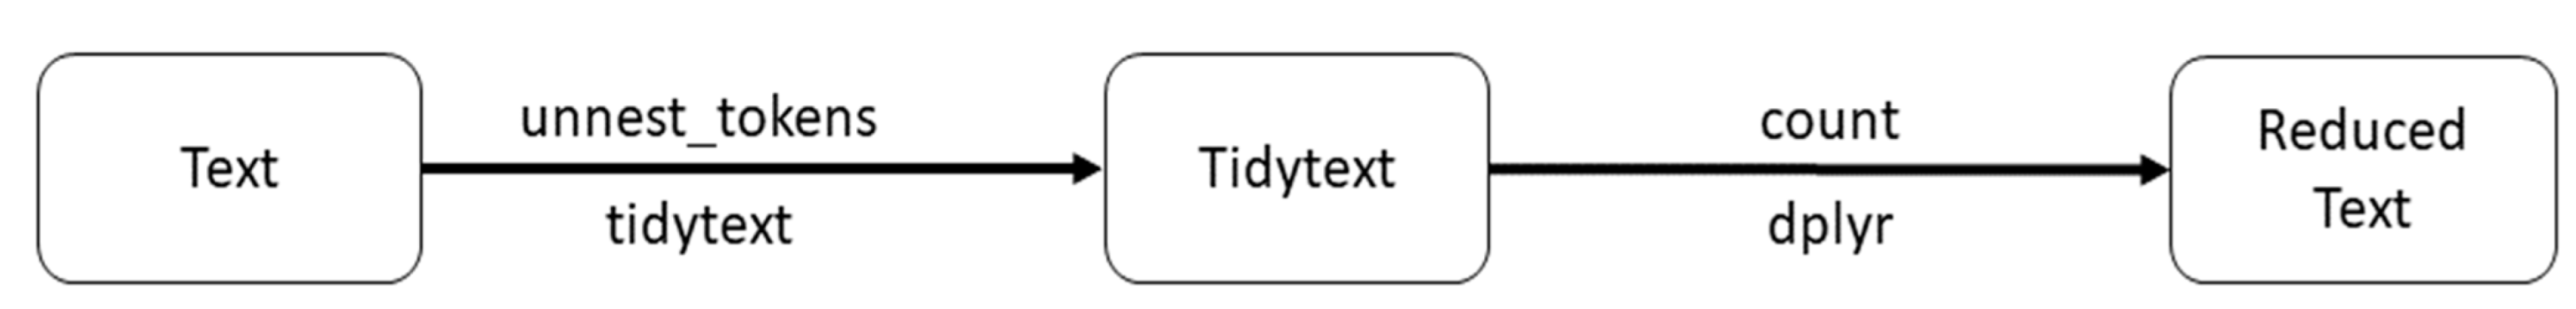
2.3.3. Sentiment Analysis

For the analysis of sentiments in the refined information, the tidytext library is used. This library has a tokenizing functionality, which means that it takes the text and converts it into a token format per row through the unnest_tokens function [41,42]. A token represents a word, a sentence, or a paragraph. The process is represented in Figure 3, and it is based on the principle of ordered data with the use of the dplyr library. The necessary argument for the use of the unnet_tokens function is the names of the columns that are created and run-in words [43]. In the next step, the input column is established, that is, the column from which the clean text comes, and the token to be used (words) is obtained, for example:
  • Tweets_token <- unnets_tokens(tbl = tweets,
  • output = “word”,
  • input = “cleantext”
  • Token = “words”)
For data and sentiment lexicon analysis and the evaluation of emotions in text, within the tidytext package, there are three sets of lexicons that can be used: BING, AFINN, and NRC [44]. These are based on unigrams or individual words, where the NRC lexicon classifies words into categories such as negative, positive, sadness, fear, anger, disgust, surprise, anticipation, joy, and confidence. BING, on the other hand, performs the classification only into positive and negative categories [41,42]. AFINN, for its part, assigns a score to each word, which is in a range between (−5 and 5), with −5 being the score for the most negative feelings and 5 being the most positive score.
In the method, the use of the three lexicons has relevance in the identification of the feelings of the population; in addition, the characteristics of each of the lexicons pose an ideal scenario for the analysis of feelings. For the use of AFINN, it was considered that this lexicon handles a list of 2477 words, including 15 phrases, which allows determining in which contexts the different terms are used. AFFIN assigns words with scores ranging from −5 to 5, establishing negative scores as unfavorable feelings and positive scores as favorable feelings. When applying the BING lexicon in the method, it was considered that it is a summary of opinions based on aspects that contain 6787 words. These are classified in a binary way, either positive or negative. To define the opinion in the text, three subcategories are made. First, adjective words that are normally used to express opinions are established using an NPL method. In the second subtask, each opinion word determines its semantic orientation, and a technique to perform this task has been proposed using the WordNet database. Finally, the third subtask decides the orientation of the opinion in each sentence [45]. With the NRC lexicon, it is possible to work with 14,182 words associated with eight basic emotions (anger, fear, anticipation, confidence, surprise, sadness, joy, and disgust), and the categorization is generated according to their connotations [44]. Unlike previous lexicons, NRC includes a broader set of words that are associated with or connote an emotion, and this lexicon is available in multiple languages, including Spanish.

3. Results

The proposed method was designed for application to any subject of sentiment analysis. However, for its evaluation, it was applied in the political sector. In Figure 4, the stages of the method, adjusted to the application area, are presented using a flowchart.

3.1. Identification of the Problem

The case study to evaluate the method was carried out in Ecuador, where the government has been in office for one year. In this period, the president of Ecuador, Guillermo Lasso, has had to face the pandemic, insecurity, education, and a country that urgently needs the economic reactivation of its society. Therefore, this is considered an ideal scenario, where the government has Twitter accounts that are followed by supporters and retractors, guaranteeing an adequate volume of data to obtain information. One consideration that was made in the analysis is that Ecuador is a country where the Spanish language is spoken; therefore, the tweets obtained in the extraction process were kept in this language so as not to negatively affect the volume of data or their importance.

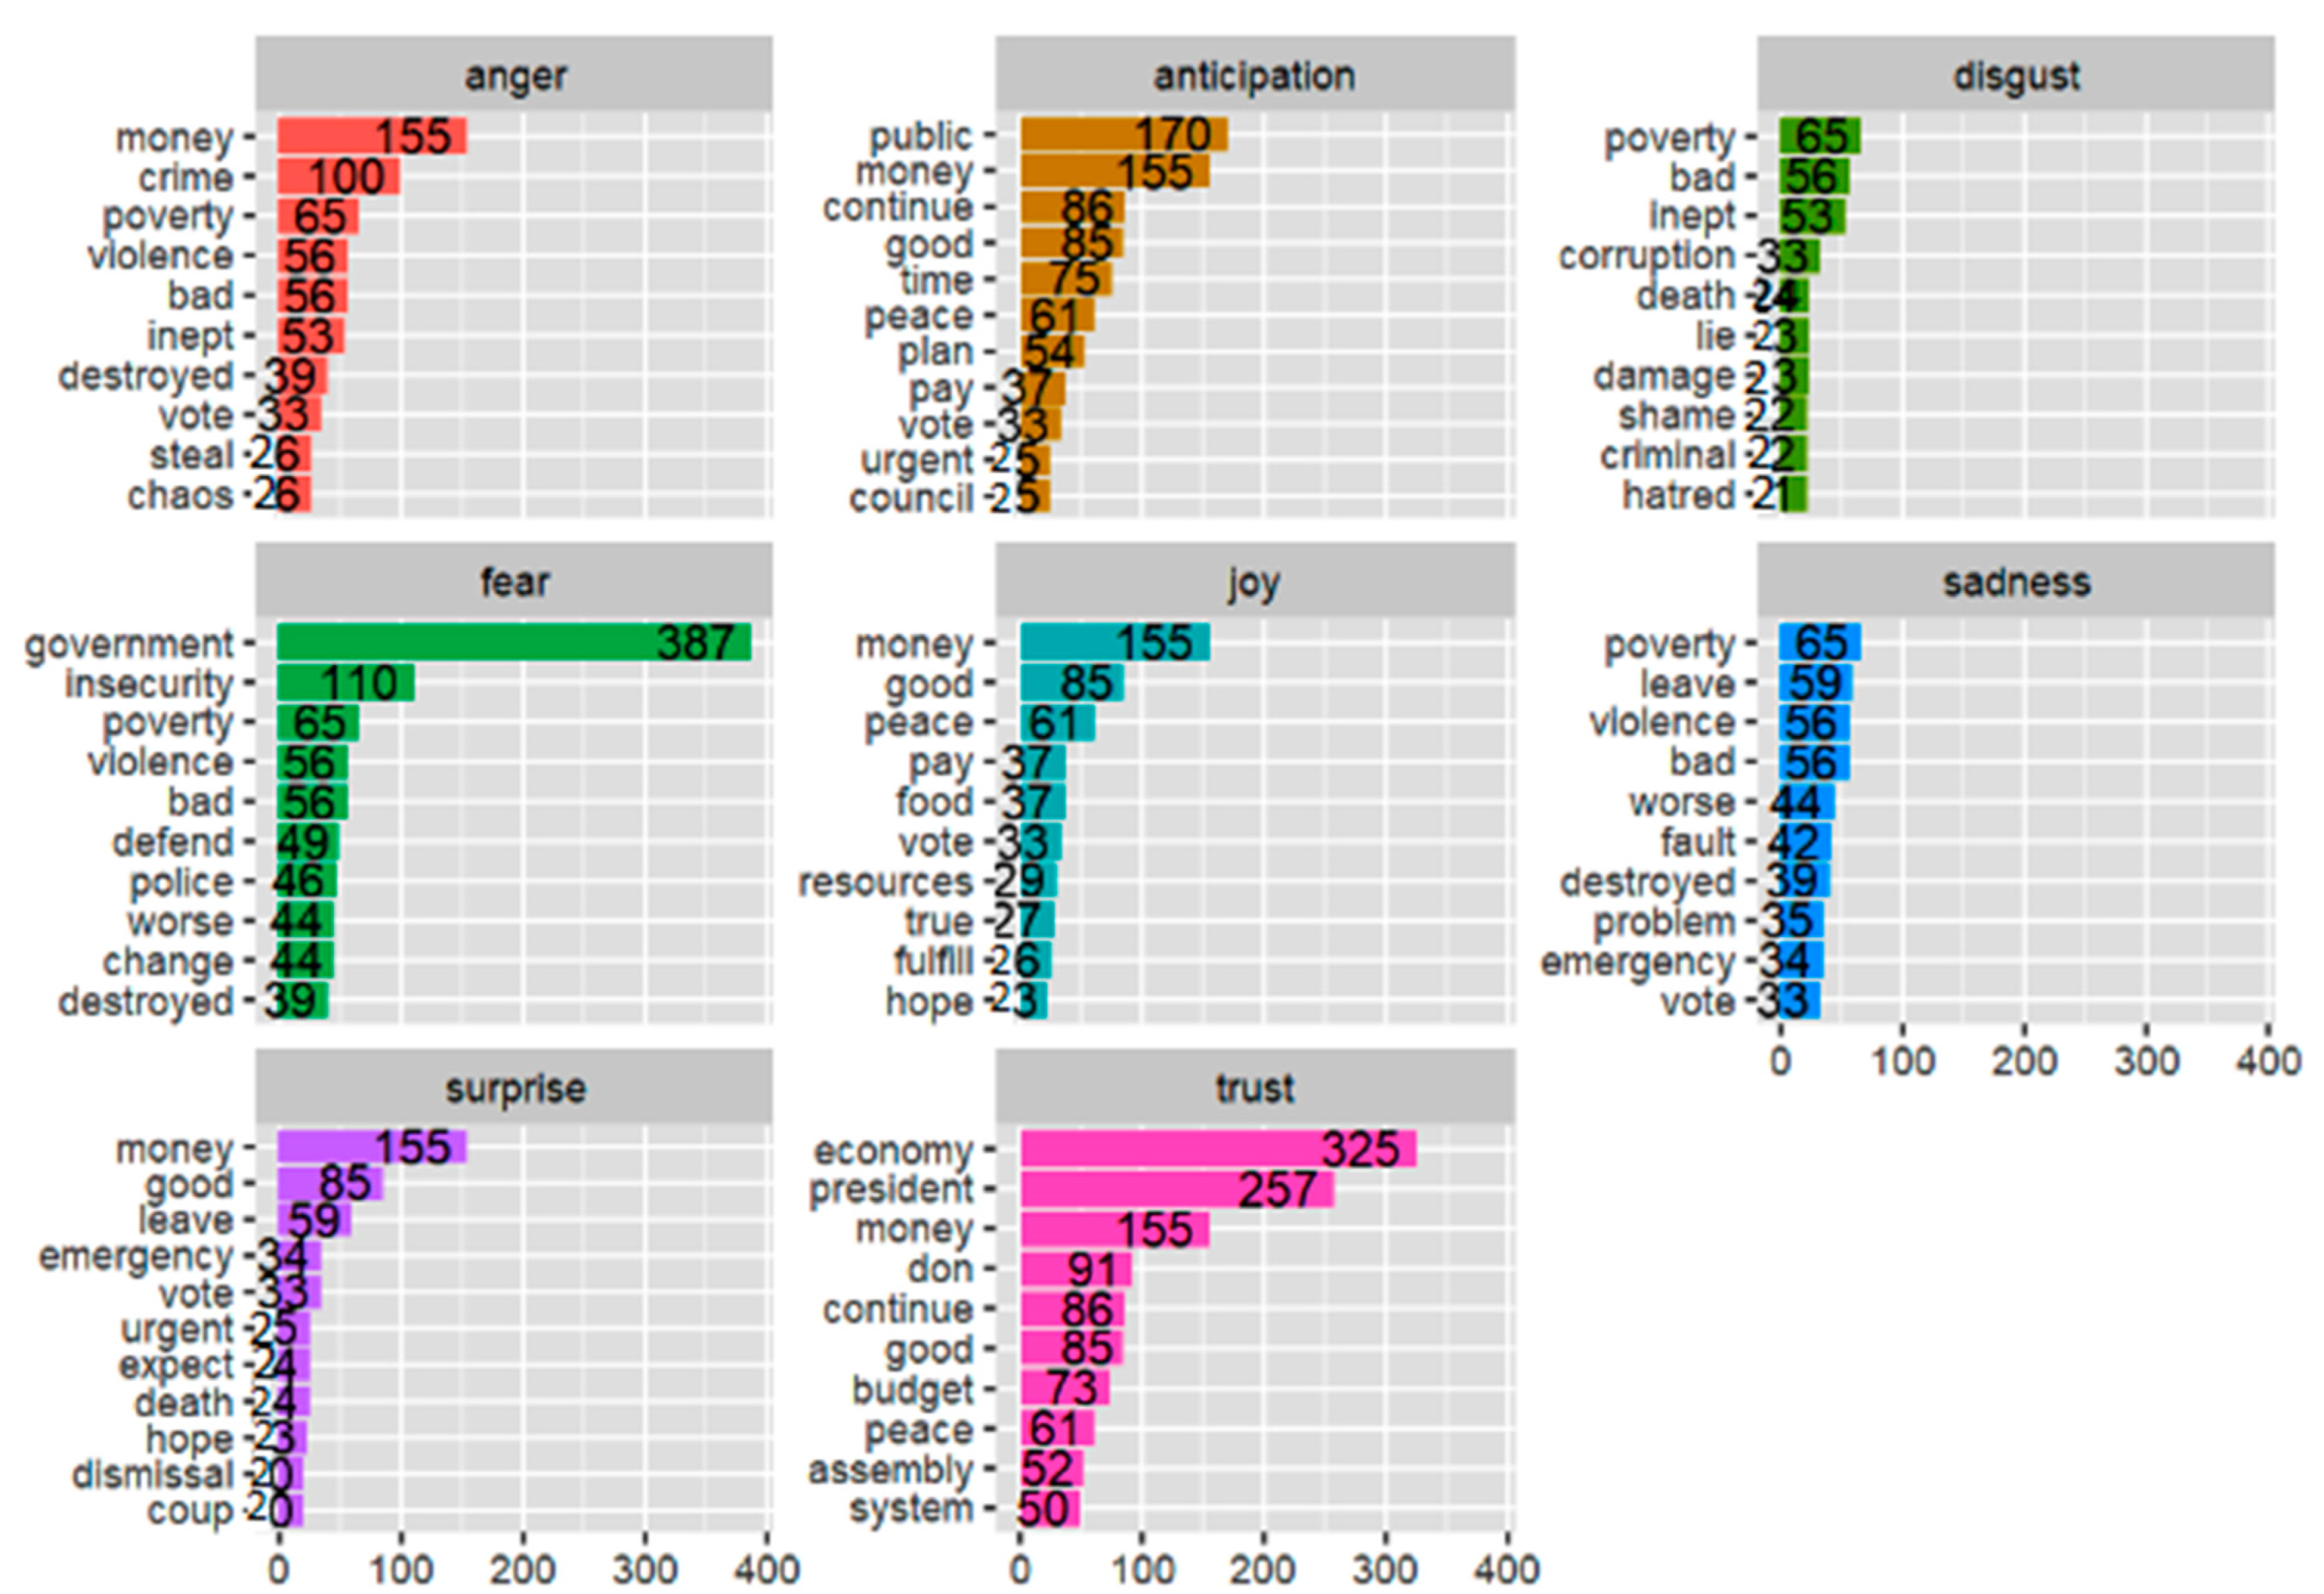
3.2. Sentiment Processing and Analysis

Once the accounts required for the use of the analytics features were created through Twitter Developer and the relevant access and permissions were assigned, the next phase was to obtain data from a source considered non-traditional. The information search was carried out with the following keywords:
  • Guillermo Lasso, health;
  • Guillermo Lasso, economy;
  • Guillermo Lasso, security;
  • Guillermo Lasso, education.
In the debugging and tokenization stage, the tweets were divided into individual words or text units to effectively obtain the sentiment. By applying this process, the results presented in Table 2 were obtained. In these results, priority has been given to identifying the location of the tweet based on the search parameters. As observed in this table, unexpected results were obtained, and it was necessary to improve the filter process, specifically for the location. As can be seen, certain tweets are identified by the city to which the user belongs. However, when it is accompanied by the country or province, the method takes this location as a new one. In the data, a greater number of tweets was expected; however, fewer results were obtained because the application collected the data for five days. In addition, these data coincided with a week of protest that was carried out by certain social groups. This event affected two specific issues, the economy and security. It should be mentioned that the results are related to what happened since the protest sought changes in the economic aspect of the country, and on the other hand, as the days went by, the protest developed violent overtones that affected safety, affecting the results obtained.
For sentiment analysis, the data are represented in different graphs in Power BI to present accurate information that contributes to efficient decision making. For example, Figure 5 presents the results of the sentiment of tweets classified by search content. These results mark the feelings classified as negative in light blue, neutral in dark blue, and positive in yellow. Negative sentiment is indicated in all search factors, especially in safety and health, where negative sentiment is more representative. On the other hand, neutral sentiments have similar behavior in all of the factors. These percentages correspond to the year 2022 during the protest in June.
Figure 6 shows the terms with the highest repetition in the classified tweets according to several sentiment classification criteria. For example, among the TOP terms are anger, anticipation, disgust, fear, happiness, sadness, surprise, and confidence. Within each category, the TOP 10 words with the highest repetition in tweets are considered; these vary according to the identified sentiment. The words are sorted from highest to lowest. In addition, with this information, it is possible to identify categories that have the greatest incidence of the sentiment of users. For example, according to the TOP words, it is found that for anger, there are 155 tweets where this feeling is recorded; in relation to money, as anticipated, the word public is found among the TOP words, mentioned in 170 tweets, and the word money is present in 155. The category of fear is the one that registers the most tweets, with the government having the greatest impact, mentioned in 387, and insecurity mentioned in 110. In the categories of joy and surprise, the word money remains the TOP word; this can be established as a generalized feeling before the economic factor hit the Ecuadorian population. This is reaffirmed by the trust category, in which the economy is mentioned in 325 tweets, which shows the population’s concern about this situation.

4. Discussion

According to the results obtained, it is possible to conclude that the method adapts to the search needs, and analysis of the data results in the identification of the feelings of social network users. The proposed method, which enables the design of a method for data analysis, allows searching for other trends without deficiencies in its performance [46,47]. Concerning other works in this proposal, a database is used for the storage of information. Once these data are obtained, what is sought is to store them and be able to present them in projections and establish the development of a trend in a certain period.
In the reviewed works, several investigations of political communication were found in which tools such as SentiStrength were used, which evaluates the sentiment of Twitter messages. An important feature of the tool is that the analysis is performed on tweets that are in Spanish. This can be seen as an advantage or disadvantage; everything will depend on the location where the analysis is carried out. With the use of SentiStrength, it is possible to characterize the emotions transmitted and measure the intensity of the feeling associated with a text [48]. As in this work, the classification can be executed on varied topics, among which are politics and economics [49]. One deficiency that is identified in the use of this tool and similar ones to this proposal is the handling of emoticons, which is common in tweets today. These tools do not manage them properly since they are only handled when the emoticons are written with punctuation marks. This is currently not common since their use is generally graphical. Therefore, the cleaning and filtering of tweets may be poor or cause problems in identifying the sentiment [50].
This work presents a method that can be used in several thematic areas; however, according to the results obtained, it was not possible to validate the hypotheses derived from the analysis. Reference is made to the influencing factors that affect the phenomenon of study. These factors can be organizational, institutional, or environmental [51]. For example, if employment is considered a factor, communication tones can be considered. This does not imply that the hypothesis is ruled out, but it is necessary to deepen the analysis of the study and explore the effect that different variables have. It is also necessary to integrate the training of the people in charge on the use of social networks, the study population, and the average age of this population.
Regarding the use of the different libraries, a comparison was made in the initial stages of this work. In this way, it was established that, in the extraction phase of the tweets, the use of Rtweet allows the adequate downloading of the data according to the needs of this work. However, it is necessary to consider certain library characteristics that can be treated as advantages or disadvantages in similar works. Therefore, for Rtweet, a Twitter account is needed so that Rtweet can authorize the credentials of specific accounts. This is because the number of tweets that can be downloaded in 15 min through this library is limited. In addition, even though it is possible to receive up to 18,000 tweets in 15 min, there is a major limitation to using this API when searching for words or phrases, which is that search results can only be returned for six to nine days. Rtweet also allows the user to eliminate retweets, an option that can be activated when the message is the same and does not provide new information. With another criterion, tweets can be filtered so that the function only returns those written in Spanish [9].
Other sentiment analysis models use libraries such as TwitteR, which is a very handy library for downloading data. This library, like the one outlined above, requires registration in the Twitter API, and it is necessary to associate it with a developer account to obtain access credentials. Once this process is complete, it is possible to access several types of functions; for example, it is possible to access a search API endpoint that retrieves tweets that contain terms that are set as arguments [8]. The results of the TwitteR search contain relative information about the object. Among the tweet data that are obtained are when it was written, who wrote it, the time, etc. In addition to these features, it is possible to use functions that allow the user to interact with information without having to search through a list of data.
The use of libraries for collecting tweets depends on the needs of each organization or individual performing sentiment analysis [24]. In this work, the use of Rtweet is proposed, considering that the event that was analyzed did not require the continuous collection of tweets. Therefore, the application of both Rtweet and TwitteR is aligned with the needs of this study. On the contrary, if the continuous collection of tweets is required and they are in real time, it will be necessary to use another package, such as streamR. In addition, in the analysis of the use of libraries, it will also be necessary to include the functions that each of these includes since data visualization is a key component in the analysis, and the ability to create graphs and maps of tweets will be significant for the use of one or another library.

5. Conclusions

This work proposes a method for the analysis of sentiments in social networks to communicate massive data on any topic of interest. To evaluate the method, a case study that seeks to identify the existing sentiment of the population concerning the management of the government of Ecuador was implemented. On the one hand, it is part of the line of studies aimed at the management and understanding of the behavior of citizens in their interaction with the presidency of the republic. On the other hand, it seeks to take advantage of an innovative approach that is based on measuring feelings expressed through technologies by organizations and their communication processes.
The method developed for sentiment analysis is adaptable and can be applied to any brand, product, or service, making it a valuable strategy for any organization. In addition, today, social networks have become the main means to expose ideas or thoughts about an aspect that may or may not become a trend. The large volume of data on social networks allows implementing various analysis processes and contributes to the decision making of organizations. This is based on the opinions of society that are continuously manifested. In this case, the use of Twitter allowed identifying the opinions of a population that is active on this social network.
For the design of the method, in addition to the characteristics of the social network, the particularities found in the data were considered. Therefore, data processing is considered important; by applying a robust method to the corpus of tweets, it is possible to identify sentiments adequately. To achieve this, robust tools such as R Studio and Power BI were used to visualize the results. The flexibility that these tools have allows the data to be processed and loaded into a data warehouse quickly and without data corruption. This occurs through a fast and economic flow of information that allows an agile and adaptable reaction to changes.
In future work, it is proposed to improve the process of classification and the management of word dictionaries that allow the creation of a data corpus in Spanish. For this, it is necessary to create a database of comments, each with its equivalent score. In this way, both positive and negative tags can be effectively managed and pinned, allowing comments to be classified into their respective category. In addition, it is proposed to work on creating comment lists with terms that are not relevant to sentiment analysis. By managing the word lists of the texts, stop words can be eliminated more effectively to facilitate obtaining the most important information for subsequent analysis.

Author Contributions

W.V.-C. contributed to the following: the conception and design of the study, acquisition of data, analysis, and interpretation of data, drafting the article, and approval of the submitted version. The authors S.M. and V.D.J. contributed to the study by design, conception, interpretation of data, and critical revision. E.M. and A.M.-N. made the following contributions to the study: analysis and interpretation of data, approval of the submitted version. All authors have read and agreed to the published version of the manuscript.

Funding

This research received no external funding.

Informed Consent Statement

Not applicable.

Data Availability Statement

Not applicable.

Conflicts of Interest

The authors declare no conflict of interest.

References

  1. Hussein, D.M.E.-D.M. A survey on sentiment analysis challenges. J. King Saud Univ. Eng. Sci. 2018, 30, 330–338. [Google Scholar] [CrossRef]
  2. Dang, N.C.; Moreno-García, M.N.; De La Prieta, F. Sentiment Analysis Based on Deep Learning: A Comparative Study. Electronics 2020, 9, 483. [Google Scholar] [CrossRef] [Green Version]
  3. Ligthart, A.; Catal, C.; Tekinerdogan, B. Systematic reviews in sentiment analysis: A tertiary study. Artif. Intell. Rev. 2021, 54, 4997–5053. [Google Scholar] [CrossRef]
  4. Birjali, M.; Kasri, M.; Beni-Hssane, A. A comprehensive survey on sentiment analysis: Approaches, challenges and trends. Knowl. -Based Syst. 2021, 266, 107134. [Google Scholar] [CrossRef]
  5. Hidalgo, O.; Jaimes, R.; Gomez, E.; Lujan-Mora, S. Sentiment Analysis Applied to the Popularity Level of the Ecuadorian Political Leader Rafael Correa. In Proceedings of the 2017 International Conference on Information Systems and Computer Science (INCISCOS), Quito, Ecuador, 23–25 November 2017; Volume 2, pp. 340–346. [Google Scholar]
  6. Barbaglia, L.; Consoli, S.; Manzan, S. Forecasting with Economic News. J. Bus. Econ. Stat. 2022. [Google Scholar] [CrossRef]
  7. Kontopoulos, E.; Berberidis, C.; Dergiades, T.; Bassiliades, N. Ontology-based sentiment analysis of twitter posts. Expert Syst. Appl. 2013, 40, 4065–4074. [Google Scholar] [CrossRef]
  8. Ardia, D.; Bluteau, K.; Borms, S.; Boudt, K. The R Package sentometrics to Compute, Aggregate, and Predict with Textual Sentiment. J. Stat. Softw. 2021, 99, 1–40. [Google Scholar] [CrossRef]
  9. Silge, J.; Robinson, D. tidytext: Text Mining and Analysis Using Tidy Data Principles in R. J. Open Source Softw. 2016, 1, 37. [Google Scholar] [CrossRef] [Green Version]
  10. Arun, K.; Srinagesh, A. Multilingual twitter sentiment analysis using machine learning. Int. J. Electr. Comput. Eng. 2020, 10, 5992–6000. [Google Scholar] [CrossRef]
  11. Rai, S.; Goyal, S.B.; Kumar, J. Sentiment Analysis of Twitter Data. Int. Res. J. Adv. Sci. Hub 2021, 2, 56–61. [Google Scholar] [CrossRef]
  12. Chen, T.; Xu, R.; He, Y.; Wang, X. Improving sentiment analysis via sentence type classification using BiLSTM-CRF and CNN. Expert Syst. Appl. 2017, 72, 221–230. [Google Scholar] [CrossRef] [Green Version]
  13. Zhang, Y.; Rong, L.; Song, D.; Zhang, P. A Survey on Multimodal Sentiment Analysis. Moshi Shibie Yu Rengong Zhineng/Pattern Recognit. Artif. Intell. 2020, 33, 3–14. [Google Scholar] [CrossRef]
  14. Adwan, O.Y.; Al-Tawil, M.; Huneiti, A.; Shahin, R.; Abu Zayed, A.; Al-Dibsi, R. Twitter Sentiment Analysis Approaches: A Survey. Int. J. Emerg. Technol. Learn. 2020, 15, 79–93. [Google Scholar] [CrossRef]
  15. Vimali, J.S.; Murugan, S. Sentiment Analysis on Twitter Social Media Product Reviews. Indian J. Comput. Sci. Eng. 2021, 12, 551–560. [Google Scholar] [CrossRef]
  16. Kharde, A.V.; Sonawane, S. Sentiment Analysis of Twitter Data: A Survey of Techniques. Int. J. Comput. Appl. 2016, 139, 5–15. [Google Scholar] [CrossRef]
  17. Obiedat, R.; Al-Darras, D.; Alzaghoul, E.; Harfoushi, O. Arabic Aspect-Based Sentiment Analysis: A Systematic Literature Review. IEEE Access 2021, 9, 152628–152645. [Google Scholar] [CrossRef]
  18. Abdullah, N.A.S.; Rusli, N.I.A. Multilingual Sentiment Analysis: A Systematic Literature Review. Pertanika J. Sci. Technol. 2021, 29, 445–470. [Google Scholar] [CrossRef]
  19. Torres, J.; Baquerizo, G.; Vaca, C.; Pelaez, E. Characterizing Influential Leaders of Ecuador on Twitter Using Computational Intelligence. In Proceedings of the 2016 3rd International Conference on eDemocracy and eGovernment (ICEDEG), Sangolqui, Ecuador, 30 March–1 April 2016. [Google Scholar] [CrossRef]
  20. Murdaca, A.M.; Oliva, P.; Costa, S. Evaluating the perception of disability and the inclusive education of teachers: The Italian validation of the Sacie-R (Sentiments, Attitudes, and Concerns about Inclusive Education—Revised Scale). Eur. J. Spec. Needs Educ. 2018, 33, 148–156. [Google Scholar] [CrossRef]
  21. Zhao, Y. R and Data Mining: Examples and Case Studies; Elsevier: Amsterdam, The Netherlands, 2012. [Google Scholar]
  22. Kumar, A.; Garg, G. Sentiment analysis of multimodal twitter data. Multimed. Tools Appl. 2019, 78, 24103–24119. [Google Scholar] [CrossRef]
  23. Flores, B.E.H. Processing of the Opinions of a Public Person in Ecuador. RISTI Rev. Iber. Sist. Tecnol. De Inf. 2019, E17, 1094–1102. [Google Scholar]
  24. Dutta, P.; Lodh, A. Scraping of Social Media Data Using Python-3 and Performing Data Analytics Using Microsoft Power BI. Int. J. Eng. Sci. Res. Technol. 2020, 9, 66–79. [Google Scholar] [CrossRef]
  25. Toujani, R.; Chaabani, Y.; Dhouioui, Z.; Bouali, H. The Next Generation of Disaster Management and Relief Planning: Immersive Analytics Based Approach. In Communications in Computer and Information Science, Proceedings of the Immersive Learning Research Network, Missoula, MT, USA, 24–29 June 2018; Springer: Cham, Switzerland, 2018; Volume 840, pp. 80–93. [Google Scholar] [CrossRef]
  26. Scott, T. Power BI vs Tableau: A Data Analytics Duel; TechnologyAdvice: Nashville, TN, USA, 14 September 2019. [Google Scholar]
  27. Kapenieks, J. A Web-Based Fast and Reliable Text Classification Tool. In Proceedings of the International Scientific Conference, Society, Technology, Solutions, Valmiera, Latvia, 25–26 April 2019; Volume 1. [Google Scholar] [CrossRef]
  28. Murthy, J.S.; Siddesh, G.M.; Srinivasa, K.G. A Distributed Framework for Real-Time Twitter Sentiment Analysis and Visualization. In Advances in Intelligent Systems and Computing; Springer: Cham, Switzerland, 2018; Volume 709, pp. 55–61. [Google Scholar] [CrossRef]
  29. Dwimarcahyani, D.; Badriyah, T.; Karlita, T. Classification on Category of Public Responses on Television Program Using Naive Bayes Method. In Proceedings of the IES 2019—International Electronics Symposium: The Role of Techno-Intelligence in Creating an Open Energy System Towards Energy Democracy, Surabaya, Indonesia, 27–28 September 2019. [Google Scholar]
  30. Shahanur Alam, M.; Abdullah-Al-Jubair, M.; Ashikur Rahman, M.; Supti, T.I.; Tabassum, R.; Ara, T.; Weng, N.G. Electronic Opinion Analysis System for Library (E-OASL). In Proceedings of the International Conference on Computing Advancements, Dhaka, Bangladesh, 10–12 January 2020. [Google Scholar]
  31. Abayomi-Alli, A.; Abayomi-Alli, O.; Misra, S.; Fernandez-Sanz, L. Study of the Yahoo-Yahoo Hash-Tag Tweets Using Sentiment Analysis and Opinion Mining Algorithms. Information 2022, 13, 152. [Google Scholar] [CrossRef]
  32. Jaichandran, R.; Bagath Basha, C.; Shunmuganathan, K.L.; Rajaprakash, S.; Kanagasuba Raja, S. Sentiment Analysis of Movies on Social Media using R Studio. Int. J. Eng. Adv. Technol. 2019, 8, 2171–2175. [Google Scholar] [CrossRef]
  33. Tiezzi, J.; Tyler, R.; Sharma, S. Lessons Learned: A Case Study in Creating a Data Pipeline Using Twitter’s API. In Proceedings of the 2020 Systems and Information Engineering Design Symposium (SIEDS), Charlottesville, VA, USA, 24 April 2020. [Google Scholar]
  34. Villegas-Ch, W.; Luján-Mora, S.; Buenaño-Fernandez, D.; Román-Cañizares, M. Analysis of Web-Based Learning Systems by Data Mining. In Proceedings of the 2017 IEEE Second Ecuador Technical Chapters Meeting (ETCM), Salinas, Ecuador, 16–20 October 2017; pp. 1–5. [Google Scholar]
  35. Villegas-Ch, W.; García-Ortiz, J.; Sánchez-Viteri, S. Identification of the Factors That Influence University Learning with Low-Code/No-Code Artificial Intelligence Techniques. Electronics 2021, 10, 1192. [Google Scholar] [CrossRef]
  36. Shetty, S.D. Sentiment Analysis, Tweet Analysis and Visualization on Big Data Using Apache Spark and Hadoop. IOP Conf. Ser. Mater. Sci. Eng. 2021, 1099, 012002. [Google Scholar] [CrossRef]
  37. Lyu, J.C.; Le Han, E.; Luli, G.K. COVID-19 Vaccine–Related Discussion on Twitter: Topic Modeling and Sentiment Analysis. J. Med. Internet Res. 2021, 23, e24435. [Google Scholar] [CrossRef]
  38. Mu, R.; Zheng, Y.; Zhang, K.; Zhang, Y. Research on Customer Satisfaction Based on Multidimensional Analysis. Int. J. Comput. Intell. Syst. 2021, 14, 605. [Google Scholar] [CrossRef]
  39. Zhang, L.; Wang, S.; Liu, B. Deep learning for sentiment analysis: A survey. WIREs Data Min. Knowl. Discov. 2018, 8, e1253. [Google Scholar] [CrossRef] [Green Version]
  40. Trivedi, S.K.; Singh, A. Twitter sentiment analysis of app based online food delivery companies. Glob. Knowl. Mem. Commun. 2021, 70, 891–910. [Google Scholar] [CrossRef]
  41. Eugenio, V.P.A.; Raúl, C.C.A.; Alejandro, P.I.K. Perception and Image: Study through Time Series Analysis. Rev. Venez. De Gerenc. 2020, 25, 327–339. [Google Scholar] [CrossRef]
  42. Srivastava, A.; Singh, V.; Drall, G.S. Sentiment Analysis of Twitter Data. Int. J. Healthc. Inf. Syst. Inform. 2019, 14, 1–16. [Google Scholar] [CrossRef]
  43. Smetanin, S. The Applications of Sentiment Analysis for Russian Language Texts: Current Challenges and Future Perspectives. IEEE Access 2020, 8, 110693–110719. [Google Scholar] [CrossRef]
  44. Mohammad, S. NRC Emotion Lexicon; National Research Council: Ottawa, ON, Canada, 15 July 2015; Volume 2, p. 234. [Google Scholar]
  45. Consoli, S.; Barbaglia, L.; Manzan, S. Fine-grained, aspect-based sentiment analysis on economic and financial lexicon. Knowl. -Based Syst. 2022, 247, 108781. [Google Scholar] [CrossRef]
  46. Kumar, A.; Jaiswal, A. Systematic literature review of sentiment analysis on Twitter using soft computing techniques. Concurr. Comput. Pract. Exp. 2020, 32, e5107. [Google Scholar] [CrossRef]
  47. Wagh, R.; Punde, P. Survey on Sentiment Analysis Using Twitter Dataset. In Proceedings of the 2018 2nd International Conference on Electronics, Communication and Aerospace Technology (ICECA), Coimbatore, India, 29–31 March 2018. [Google Scholar]
  48. Ruz, G.A.; Henríquez, P.A.; Mascareño, A. Sentiment analysis of Twitter data during critical events through Bayesian networks classifiers. Future Gener. Comput. Syst. 2020, 106, 92–104. [Google Scholar] [CrossRef]
  49. Saif, H.; He, Y.; Fernandez, M.; Alani, H. Contextual semantics for sentiment analysis of Twitter. Inf. Process. Manag. 2016, 52, 5–19. [Google Scholar] [CrossRef] [Green Version]
  50. Alsaeedi, A.; Zubair, M. A Study on Sentiment Analysis Techniques of Twitter Data. Int. J. Adv. Comput. Sci. Appl. 2019, 10, 361–374. [Google Scholar] [CrossRef] [Green Version]
  51. Giachanou, A.; Crestani, F. Like It or Not: A Survey of Twitter Sentiment Analysis Methods. ACM Comput. Surv. 2016, 49, 1–41. [Google Scholar] [CrossRef]
Figure 1. Gartner quadrant with the visualization tools considered as leaders in 2021.
Informatics 09 00063 g001
Figure 2. Method for sentiment analysis of a social network with integration with a database and information visualization tools.
Informatics 09 00063 g002
Figure 3. Applied process for Twitter sentiment analysis.
Informatics 09 00063 g003
Figure 4. Flowchart for the application of sentiment analysis method to Twitter.
Informatics 09 00063 g004
Figure 5. Identification of feelings in the search categories in relation to the government of Ecuador.
Informatics 09 00063 g005
Figure 6. Identification of feelings with the TOP words with the highest repetition on Twitter.
Informatics 09 00063 g006
Table 1. Analysis of the leading tools in visualization based on the characteristics necessary in sentiment analysis.
Power BITableauQlik
FocusWide range of analysis workflow capabilities, with a high executive levelAnalysis with deep searchExploring data without employing a long learning curve
Connections and data integrationHighLower than Power BIHigh
Visualization and type of analysisWideWideImprovements to be made
AdvantageEasy to use
Includes Python- and R-based visualizations, including predictive analytics
Low cost, includes free versions
Intuitive and easy to use.
Support for Python and R with predictive analytics
Simple for users
Scripting for prior data processing
Less dependency on IT for system maintenance
DisadvantagesThe project must be uploaded to the cloud to share the visualizationsIt additionally requires an ETL (extract, transform, and load) tool
For advanced users, there is disapproval of the tool for advanced and sophisticated capabilities, such as embedded BI, metadata management, and data preparation
Needs a lot of RAM
Table 2. Results obtained from the extraction of tweets in each search category.
Retweet_LocationEconomyEducationHealthSecurity
Guayaquil19322385383481
Quito176713813832039
Guayaquil, Ecuador22160211981
Sangolquí441871514572
Manta176241424953
Quito-Ecuador-Sudamérica896539593401
Guayas, Ecuador20914773712091
Cuenca9845623961093
Pichincha, Ecuador2091131021183
Total81214097533212,794
Publisher’s Note: MDPI stays neutral with regard to jurisdictional claims in published maps and institutional affiliations.

