Article

How Age and Gender Affect the Opinions of Computing Students Regarding Computer Usage and Design Needs

by
Jean D. Hallewell Haslwanter
1,*,
Christiane Takacs
1 and
Martina Gaisch
2
1
School of Engineering, University of Applied Sciences Upper Austria, 4600 Wels, Austria
2
School of Informatics, Communications and Media, University of Applied Sciences Upper Austria, 4232 Hagenberg, Austria
*
Author to whom correspondence should be addressed.
Informatics 2022, 9(3), 52; https://doi.org/10.3390/informatics9030052
Submission received: 9 June 2022 / Revised: 5 July 2022 / Accepted: 7 July 2022 / Published: 14 July 2022

Abstract

:
This study aimed to understand the perceptions of young computing science students about women and older people with regard to their computer literacy and how this may affect the design of computer-based systems. Based on photos, participants were asked how likely they thought the person depicted would be to use desktop computers, laptops and smartphones, and how much expertise they thought they would have with each technology. Furthermore, in order to see what impact this could have on systems being developed, we asked what design aspects would be important for the depicted person and whether they thought an adapted technology would be required. This study is based on an existing questionnaire, which was translated into German and extended to explore what impact this may have on system design. The results draw on 200 questionnaires from students in the first year of their Information and Communications Technology (ICT) studies at an Austrian university of applied sciences. Quantitative methods were used to determine if the perceptions varied significantly based on the age and gender of the people depicted. Qualitative analysis was used to evaluate the design aspects mentioned. The results show that there are biases against both older people and women with respect to their perceived expertise with computers. This is also reflected in the design aspects thought to be important for the different cohorts. This is crucial as future systems will be designed by the participants, and these biases may influence whether future systems meet the needs and wishes of all groups or increase the digital divide.

1. Introduction

Over the past thirty years a number of studies have looked at gender differences with respect to the use of Information and Communications Technology (ICT) [1,2], and significant gender effects in access, motivation, and user behavior have been described [3,4,5]. More recent sources still find “(e)stablished power structures in most societies reinforce masculine advantages” [6] (p. 33). There is also bias against older people in technology design [7,8,9].
Discrimination and societal stereotypes against specific groups are still affecting a large number of people today. These may be unconscious and situated in practices that act to exclude the “others” based on gender, age, disability, cultural background and more [6]. Generally, technological differences between males and females are still profound in terms of computer literacy, interest, self-competence, self-efficacy, probability to choose computer science as a career, and having positive attitudes towards programming [3,10]. Persistent arguments that older people tend to only reluctantly use and adopt new technologies were found to be partially wrong [11,12] and can deepen the existing situation through information exclusion. These stereotypes have very complex social roots. It is argued that there is more to the male dominance of technology than power [13,14], which requires a sound understanding of the context within which gender and age constructs appear. In this regard, technology is understood as a masculine culture [15,16]. For these purposes, it is vital to reflect on implicit bias related to social prejudice, be they gender stereotypes [17] or racial and age evaluations [18,19]. By exposing implicit stereotypes, it may be possible to identify ways to counter them and promote equitable treatment.
The digital divide, the gap that exists between different populations with regard to access to and usage of technology, is still a reality today and is thought to further reinforce social inequalities [20,21]. Even in the same country, there may be stratification based on education, gender and age group, among other factors. In view of the global knowledge economy where concepts such as lifelong learning, active (digital) citizenship, social cohesion and participation are of major relevance, ICT skills have become a necessity rather than luxury, especially in transforming social-economic and political aspects of people’s lives [22].
Based on the changing dynamics of the knowledge society, the purpose of this study is to investigate the extent to which gender- and age-related biases still persist among ICT students in this “woke” age with regard to the use of technological devices and how this might also affect the design of systems for these demographic groups in the years to come.

1.1. Our Motivation

In the media, there is much discussion about increasing digitization. It has paved ways for many new technologies and more data complexities but it has also led to an ever-growing number of users that had previously been excluded from digital participation. At the same time, it appears that entrenched stereotypes about groups that tend not to use technological devices on a regular and proficient basis are hard to discard. This is complicated by the fact that older people may reject “gerontechnologies”, technical devices specifically aimed at older people, as they feel they are stigmatizing [23,24].
As educators we hear computing students claiming that people over forty have trouble using computers, even though it is people from this age group that are teaching them about computing. Similarly, during user analysis surprisingly sexist stereotypes sometimes emerge. Since ICT students will have an impact on the devices that will be available in the future, we were interested in how they really view the abilities of women and also older people and whether these views have an impact on how they would design for these demographic groups.
This study is inspired by a previous investigation conducted in the United Kingdom, where students were asked about the perceived abilities of depicted people [25]. The persons depicted included either an older or younger woman or man. The results showed that computer science students perceived older people as less likely to use technologies such as desktop computers and less expert in using them. Furthermore although women were thought to be likely to use devices, they were perceived to have significantly less expertise. This research aimed to repeat the study in another country to see how the results compare (research question 1 below), to do additional quantitative analysis to gain more insight, and to extend it with questions to investigate how this might affect the design of these technologies.
The research questions guiding our study were:
1.
What are the differences in the perceived likelihood of use and expertise for common technological devices based on age or gender? How do these compare to the results of the previous study in another country?
2.
How do the perceptions for the different devices compare? Can expertise be predicted by perceived likelihood of use? Are there differences based on age and gender in this respect?
3.
How might the perceived abilities of a user group affect the design choices: Is adaptation thought to be necessary for certain groups? What design aspects are thought to be important for the different cohorts?

1.2. Theoretical Background

Even today, females are still negatively affected by existing gender stereotypes and prescribed gender identities despite relatively equal access and use of computer technology [26]. This may be due to the fact that from its beginning the computer was socially constructed as a male domain [27,28] and that the use, liking and competence of computer technology was associated with being male [29]. The bias can be subtle, with men referred to as “computer programmer”, but this is often prefaced with “female” for women, which emphasizes that it is not the norm [30]. Arguably, societal expectations on females as well as gender stereotypes have generally led to different socialization processes where women are expected to take on idealized gendered identities.
Unsurprisingly, the digital gender divide harms women’s self-image given that they have to fight societal norms to succeed at information technology [31,32]. Such a gender bias has greatly contributed to the software design process, to girls’ lack of computer confidence and to their computer anxiety [33]. Additionally, the lack of encouragement from educators and parents has negatively impacted girls’ enrollment rate in computer science [34].
What is more, there is also a bias against older people, termed as “ageism”, i.e., the assumption that older adults tend to be both incapable of learning how to use new media and technological devices and disinterested in learning how to use them [35,36,37]. Popular media have reported that even organizations focused on older adults have been found to use images of technology-limited older people [38]. Some researchers have shown that these stereotypes of older people with respect to technology are not accurate [9,12]. These biases can have an impact in practice, as communities may not welcome older people, fearing that they will be a burden, when in reality older people can make contributions, e.g., through spending and working as volunteers [39]. Certainly, some skills they have gained may no longer be relevant or valued; for example, being able to use a slide rule is less valued now that calculators are included on most smartphones. It is vital to adopt an intersectional approach towards digital ageism. In doing so, different aspects and demographical dimensions are analyzed not in a single axis of oppression but rather with regard to multiple axes and with different identities that flow into each other [40,41].
Looking at the history of computers [42], all but the very old could have used computers in their work, depending in part on their education and profession. In practice, in western countries the majority of old people have used a computer, e.g., for e-mail [43]. Perhaps one problem is that although studies show people experience bias based on age, many people are not aware of their own prejudices based on age [44]. Another difficulty is that usage of technologies by older people, including smartphones and the internet, have increased rapidly in the past ten years, though the level of adoption depends on age and educational attainment [45,46]. The goal is not to eliminate bias, but to reflect on these biases and work with diverse end users to understand the impact of the devices being designed [6].
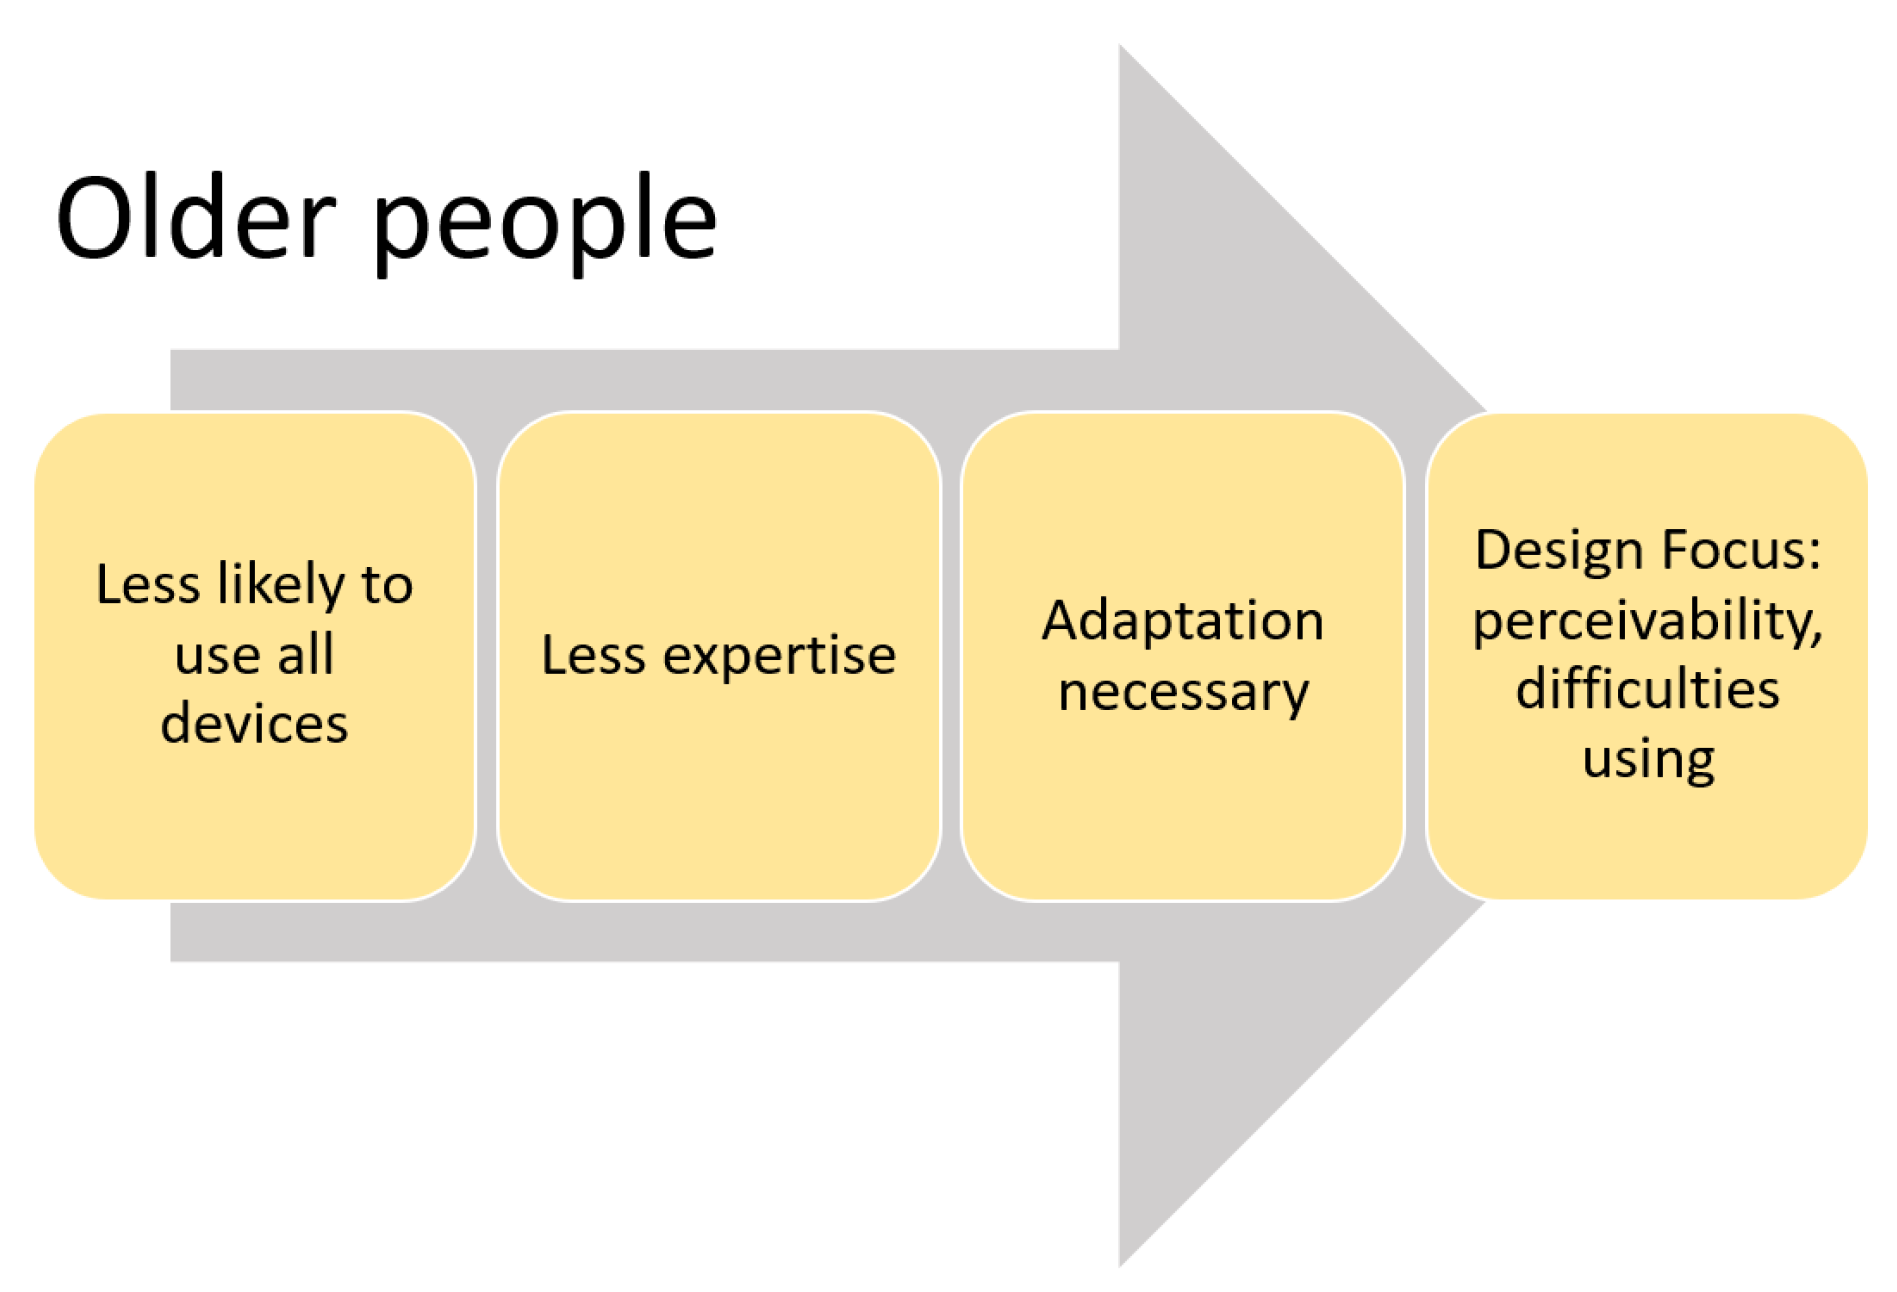
For older people wanting to use computers, there are additional challenges. Some of the challenges they report in using computers are cognition, physical ability and perception [47]. At the same time, many older people experience some sort of additional limitations [48,49] that relate to these challenges. Presbyopia (age-related vision problems) [50], already starts in the 40s which makes it hard to focus on things that are close. Furthermore, 17% of people over 60 have have hearing problems [51] (p. 30). Physiological changes in the brain, including shrinking and reduced blood flow, can affect the ease of organizing activities, eye-hand coordination and forming new memories [52,53]. Arthritis can limit physical abilities as it makes joints stiffer. In fact, 20% of people between 55 and 64 in Austria report problems with their arms or hands [54]. However, with age there is increasing variability of physical, sensory and mental function between people [48,55], so that some older people may have few or no limitations.
When thinking of older people, the focus is frequently placed on their limitations [56,57] even though older people are capable of using systems effectively [7]. Consequently, designing predominantly for limitations may result in technologies that are stigmatizing [7,58], and might even prevent adoption [23,59].
Regardless of what group a system is intended for, design is essential, both for its usability and the user-experience [60,61]. When designing for people of different interests and abilities, there is a tension between a universal design, i.e., one suited for all user groups, and adapting for specific needs. When making adjustments for one specific group, the developers’ hidden stereotypes may have a negative impact on the design [62]. However, in practice, “it isn’t that hard to address accessibility considerations”, if these are considered up-front [63] (p. 24).
Computer-based systems are becoming increasingly important. Given that today’s computing students will be involved in designing the next generation of systems, their views will also impact the systems people will have in the future. For these reasons, the authors of this study set out to see what preconceptions the students had about certain groups of people, and how they thought the design should be adapted for them.
It was expected that in the Austrian context the results for the questions taken from Petrie would have similar results [25], since both countries can be considered industrialised western European nations [64]. We sought to analyze the results in more detail, for example, to investigate the differences between the devices, and to analyze the implicit target group. We expected that the bias towards women would, if anything, be greater based both on our experience and the differences between the countries described elsewhere, e.g., Hofstede’s dimension concerning how masculine a culture is [65] or the GLOBE study that determines the level of assertiveness and performance orientation [66]. Lastly, we hoped to investigate the impact of any biases, i.e., how these opinions may affect the designs produced.

2. Materials and Methods

In this study, a combination of quantitative and qualitative methods was used.
Each questionnaire shows one picture of a person reading a book, followed by eleven questions: eight of which were closed and three were open-ended (see Appendix A). The questions were to be answered based on the image-the questions were the same for all pictures. The first nine questions relating to stereotypes and all of the pictures are the same as in the previous questionnaire [25]. Both of the new questions were related to design. The questions from the original questionnaire were translated into German by a coauthor with professional translation experience. The result was then compared to the original by another person, and piloted to check if the results roughly match expectations.
The questions covered:
  • Age in general (3 questions);
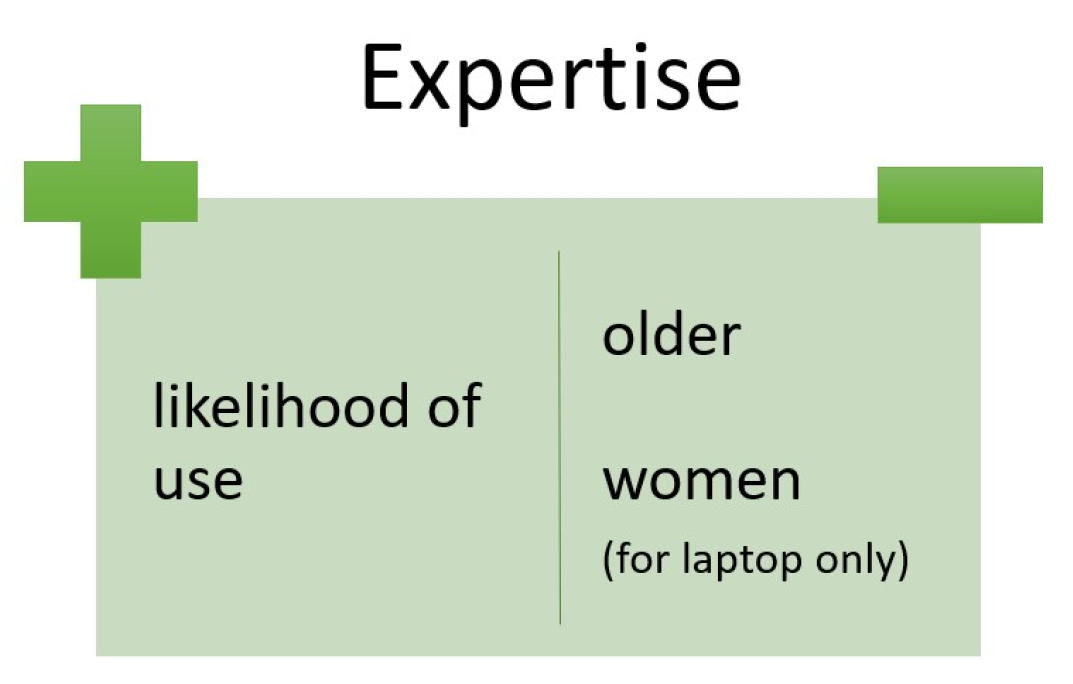
  • Likelihood of use, i.e., whether they were of the opinion that this person uses a desktop, laptop and smartphone regularly (rated from 1 = definitely not to 7 = definitely for each device);
  • Expertise, i.e., how versed they thought the person was with these devices (rated from 1 = not at all to 7 = very for each device);
  • Which design aspects would be particularly important for this person with regard to use (open question), and;
  • Whether adapted technology should be developed for this person.
In addition, demographic data concerning age, gender, degree programme and year in studies was collected.
Eight different pictures were used: two of younger men, two of older men, two of younger women and two of older women (see Figure 1), all of the same racial profile. The pictures were kept the same as the original study to support the comparability of the results. The people and clothing depicted are not obviously from a different country. The questionnaire was formatted so that the picture was at the top and all questions were on the same side of the paper. This ensured that the picture could be seen while answering all questions.
Since most of the questions were taken from the previous study, a full validation of the questionnaire was not deemed necessary. To test the translations and new questions the questionnaire was piloted with a convenience sample of 200 students at the same university at which the study was conducted. The results from the new questions indicated that only the question related to design aspects required a minor modification to be understood correctly.
For the study, the hard-copy questionnaires were distributed to students in first semester courses of selected bachelor degree studies in ICT at the University of Applied Sciences Upper Austria. The university offers a variety of computing degrees. The sample was chosen to be representative of computing students in the country. The questionnaires were distributed shortly before COVID-19 restrictions started.
A total of 216 questionnaires were returned. Of these, 16 were discarded as they were incomplete or invalid. The remaining 200 questionnaires formed the basis of our analyses. The invalid questionnaires were distributed randomly in the sample and, therefore, representativity was not affected by removing them. See the description of the sample in Section 3.1 for more details.
The statistical analysis allowed for a detailed assessment of patterns of responses regarding the perception of the participants concerning the likelihood of use, the extent of expertise of potential ICT users and need for adaptation. Using qualitative analysis for the design aspects, themes emerged that allowed the investigators to assess what these students, i.e., our participants, think about the design of technology with respect to age and gender. In this regard, different layers of information were combined and contextualized [67].
A more detailed description of the methods used for the quantitative and qualitative analysis is given below.

2.1. Quantitative Analysis for Likelihood of Use and Expertise

The goal was to analyse the perceptions of first-year ICT students concerning different categories of potential ICT users and different devices used. Moreover, an in-depth analysis was performed to determine which types of people were thought to be able to use these devices without the need for developing an adapted technology.
Initially several statistical methods were used to analyse the data. In this context the usual significance level of 0.05 was applied. First the method of a multivariate analysis of variance (ANOVA) was used for two response variables in terms of the entries at the seven point scale:
  • Likelihood of use
    perceived likelihood of regular use of the device in question by the person in question and;
  • Expertise
    inferred expertise in the use of the device in question of the person in question.
Each of the two analyses investigates the effects of the possible explanatory variables:
  • Device
    devices for use: desktop computer (short PC), laptop (LT), smartphone (SP);
  • Age
    age of potential users: younger, older;
  • Gender
    gender of potential users: men, women;
  • Adapt
    inferred need of potential users for adaption of technology: yes, no, don’t know;
  • Partgender
    gender of the participant: male, female, not specified;
  • Partstudies
    anonymized study program of the participant: A, B, C, D, E.
The model uses the possible explanatory variables alone to see, for example, whether the mean ratings for each of the three devices are statistically equal or not. However, it also uses combinations of two or three variables such as, e.g., device*gender or device*age*gender. Through this, one can see whether the mean ratings within the 3*2*2 categories (older men with laptop, younger women with smartphone,...) are statistically equal or not. Comparing the mean ratings within the different categories the ANOVA also gives qualitative information concerning students’ perceptions.
Note that when considering only the effects of device, age and gender, this analysis repeats the one performed in the previous study [25]. The additional tests which are described below give more detailed information concerning differences between devices and the relationship of likelihood of use and expertise, and also correlations between the different factors.
Since, as expected, the device was found to be a significant explanatory variable, which also appeared in combinations significantly, the ANOVA was redone for each of the devices separately. This allowed the inferred likelihood of use, as well as, the inferred expertise with the considered device, to be analysed in more detail.
Since the statistical findings for inferred likelihood of use and inferred expertise were similar, a multivariate regression model for each of the devices was introduced to determine whether inferred likelihood of use could explain expertise as a response variable. Possible additional explanatory variables included age, gender and inferred need for adaption of technology adapt.
In addition, several correlations were calculated.
Finally, further analysis was performed to characterize the group which, according to the opinion of the participants, does not need adaption of technology. This group is referred to as the implicit target group.

2.2. Qualitative Analysis for Design Aspects

Due to the nature of the questions, qualitative analysis was considered appropriate only for the new question asking for specific design aspects. For this purpose, three slots were provided. These were transcribed to a spreadsheet with the other data.
The analysis of the design aspects was informed by thematic analysis [68], a flexible method which supports reporting detailed results using themes, codes or patterns. The analysis starts by familiarizing oneself with the data and then developing initial codes to unify the answers and make these easier to compare. After this, more overarching themes are developed, reviewed and finally consolidated. Thematic analysis goes beyond a pure description of the themes as if they were passively emerging but rather encourages active discovery and continuous organization. Due to the nature of the data from the questionnaires, a deep thematic analysis was not possible. Hence, the analysis was performed at the semantic level, meaning an attempt was made to try not to interpret beyond what was written [68] (p. 14). An inductive approach was chosen, meaning that the codes were close to the data, and not based on literature related to the topic of study. Please see Appendix C for a more detailed description.

3. Results

This section is organized as follows. We start off with a description of the sample. We then present detailed results from the ANOVAs, the linear regression model, the correlation analysis and the analysis of the implicit target group. After that, we summarize the key findings concerning age, gender and combinations derived from these results (starting in Section 3.7). Finally, the qualitative results with respect to the design aspects are presented (in Section 3.10). The statistical results are described in more detail in Appendix B.

3.1. Sample

The questionnaires were returned by 216 students. Due to the focus of the study, those completed by students in higher semesters were discarded, as were those that were incomplete. Moreover, only questionnaires where the photos intended to depict older people were judged by participants to be old were included in the analysis.
The final sample contained 200 questionnaires, all completed by first-year students, referred to as participants in the rest of the paper. Of these, 62 (31%) were female and 121 (60.5%) were male and 17 persons (8.5%) answered with “not specified". They ranged from 18 to 34 years of age with an average of 21.3.
In this final sample, 101 questionnaires depict women and 99 men. More precisely, we have 55 with images of younger women, 46 with older women, 45 with younger men and 54 with older men.

3.2. Variance Analyses for Perceived Likelihood of Use and for Expertise

In the following, we present the results of the multi-variate ANOVAs used to investigate the perceived differences based on age and gender.
The responses to the question concerning likelihood of use of the different devices with an overall mean rating of 4.08 vary significantly according to the following explanatory variables, listed with the smallest p-value to the largest (see Table A1):
  • Age, with older less likely (p-value 1 × 10 106 );
  • Device, with PC least likely (p-value 4 × 10 20 );
  • Age*device, with older people with LT least likely (p-value 2 × 10 7 );
  • Partstudies (p-value 0.01 );
  • Device*gender, with women with PC least likely (p-value 0.04 ), and;
  • Gender, with men less likely (p-value 0.05 ).
For the response variable likelihood of use, the possible explanatory variables adapt and partgender and all other two-way and three-way combinations do not show statistical significant differences between the mean ratings.
At first glance, most differences concerning likelihood of use are explained by age, followed by device and age combined with device. Gender, though a significant explanatory variable, has only minor effect. We also observe the explanatory variable partstudies.
The responses to the question expertise with an overall mean of 3.74 vary significantly according to the explanatory variables, again ordered by p-values (see Table A2):
  • Age, with less expertise for older (p-value 1 × 10 117 );
  • Device, with least expertise for PC (p-value 4 × 10 8 );
  • Gender,with less expertise for women (p-value 8 × 10 5 );
  • Partstudies (p-value 0.002 );
  • Age*device, with least expertise for older people with LT (p-value 0.01 ), and;
  • Adapt with least expertise for yes (p-value 0.04 ).
For the response variable expertise, the possible explanatory variable partgender and all other two-way and three-way combinations do not show statistical significant differences between the mean ratings. The combination device*gender (p-value 0.07 ) is just not significant for expertise.
The results concerning expertise are quite similar to the results concerning likelihood of use with one remarkable difference. Here, gender shows up at the third position, i.e., the explaining power of gender is markedly greater for expertise than for likelihood of use. For expertise there is also some explaining potential in adapt.
Figure 2 shows the plane of responses to the variables likelihood of use and expertise with the most important groups located at the points with coordinates corresponding to mean ratings of the group. One can observe that the differences concerning age are much greater than the differences concerning gender. Note that, compared to age, the devices are also quite close. It can also be seen that the inferred expertise is lower for women than for men, with the exception of the smartphone where women are ahead.

3.3. Variance Analyses for the Different Devices

Then, the ANOVA was applied for each device separately. In the following we present the results. Since the mean ratings do not change when the devices are separated, the corresponding bubbles of Figure 2 also apply to these analyses. Here the p-values are of most interest.

3.3.1. Analyses for the Desktop Computer

The responses to the question for likelihood of use with a desktop computer with an overall mean of 3.53 vary significantly only according to the explanatory variables, here in order of p-values (see Table A3):
  • Age, with older less likely (p-value 7 × 10 19 ), and;
  • Gender, with women less likely (p-value 0.01 ).
For the response variable likelihood of use of a desktop computer, the other possible explanatory variables and combinations do not show statistically significant differences between the mean ratings. This is different from the combined analysis, where partstudies showed significant and gender was less important.
The responses to the question expertise with the desktop computer with an overall mean of 3.51 vary significantly only according to the explanatory variables, here in order of p-values (see Table A4):
  • age, with less expertise for older (p-value 8 × 10 31 ), and
  • gender, with less expertise for women (p-value 0.002 ).
For the response variable expertise with a desktop computer, the other possible explanatory variables and combinations do not show statistically significant differences between the mean ratings. The variable partstudies (p-value 0.051 ) is just not significant. Here, the significant explanatory variables are also reduced compared to the combined analysis. Adapt and partstudies do not show significant differences.

3.3.2. Analyses for the Laptop

The responses to the question likelihood of use with a laptop with an overall mean of 3.91 vary significantly only according to one explanatory variable (see Table A5):
  • Age, with older less likely (p-value 3 × 10 50 ).
For the response variable likelihood of use of a laptop, the other possible explanatory variables and combinations do not show statistical significant differences between the mean ratings. The variable adapt (p-value 0.10 ) is just not significant. If we consider only the variables age and gender we find the statistically significant variable age (p-value 3 × 10 50 ) and the combination age*gender (p-value 0.05 ) and mean ratings from 1.91 for older women to 5.78 for younger women. Compared to the desktop computer, for the likelihood of use of a laptop, gender is a less important explanatory variable.
The responses to the question expertise with the laptop with an overall mean of 3.58 vary significantly according to the explanatory variables, here in order of p-values (see Table A6):
  • Age, with less expertise for older (p-value 5 × 10 45 );
  • Gender, with less expertise for women (p-value 0.002 ), and;
  • Adapt, with least expertise for yes (p-value 0.04 ).
For the response variable expertise with a laptop, the other possible explanatory variables and combinations do not show statistical significant differences between the mean ratings. Concerning the combination age*gender we find a similar pattern as for the response variable likelihood of use of a laptop, but it is just not significant (p-value 0.10 ) for the response variable expertise with a laptop (mean ratings from 1.61 for older women to 5.24 for younger men). This is the only analysis where adapt is significant.

3.3.3. Analyses for the Smartphone

The responses to the question likelihood of use with the smartphone with an overall mean of 4.81 vary significantly only according to the one explanatory variable (see Table A7):
  • Age, with older less likely (p-value 4 × 10 44 ).
The responses to the question expertise with the smartphone with an overall mean of 4.15 show a similar pattern. They vary significantly only according to the one explanatory variable (see Table A8):
  • Age, with less expertise for older (p-value 1 × 10 44 ).
Concerning a smartphone the likelihood of use and expertise are only a matter of age.
From the analyses in this section one can see that the devices are evaluated differently, from the desktop computer, where both age and gender play a role, to the smartphone, where only age is important, and the laptop somewhere in between.

3.4. Linear Regression Model for the Different Devices

In this section we present the linear regression model to see if the variable expertise can be explained by likelihood of use and perhaps age, gender and adapt. To this end, we code adapt no by 1 , don’t know by 0 and yes by 1. Concerning age, we code younger by 0 and older by 1. With gender, we code men by 0 and women by 1. The linear model
expertise = c o n s t . + α 1 × likelihood of use + α 2 × age + α 3 × gender + α 4 × adapt + e r r o r
is considered for each of the devices separately.
We see that for all devices, likelihood of use and age, are significant, and for the laptop gender is (see Figure 3). A table with all coefficients α 1 , α 2 , α 3 and α 4 is provided in the appendix (see Table A9).
For the desktop computer, expertise only depends on:
  • Likelihood of use (p-value 4 × 10 20 ) and;
  • Age (p-value 3 × 10 8 ).
The coefficient α 1 of likelihood of use is positive and the coefficient α 2 of age is negative. This means that older people with the same likelihood of use are inferred to have less expertise ( α 2 = 1.21 ). The variables gender and adapt are just not significant (p-values 0.09 and 0.06 ) with negative coefficients α 3 and α 4 . The adjusted R 2 equals 0.68 . Removing gender from the analysis makes adapt significant but not vice versa.
For the laptop, expertise depends on:
  • Likelihood of use (p-value 6 × 10 26 );
  • Age (p-value 0.001 ) and;
  • gender (p-value 0.0004 ).
The coefficient α 1 of likelihood of use is positive, and the coefficients α 2 of age and α 3 of gender are negative. This means that older people with the same likelihood of use and gender are inferred to have less expertise ( α 2 = 0.76 ) and also women are inferred to have less expertise ( α 3 = 0.45 ) compared to men with the same likelihood of use and age. The variable adapt is just not significant (p-value 0.1 ) with negative coefficient α 4 . The adjusted R 2 equals 0.80 . For the laptop the age-bias α 2 is smaller than for the desktop computer.
For the smartphone, expertise only depends on:
  • Likelihood of use (p-value 3 × 10 22 ) and;
  • Age (p-value 7 × 10 8 ).
The coefficient α 1 of likelihood of use is positive and the coefficient α 2 of age is negative. This means that older people with the same likelihood of use are inferred to have less expertise ( α 2 = 1.30 ). The variables gender and adapt are not at all significant (p-values 0.45 and 0.48 ) with small coefficients α 3 and α 4 . The adjusted R 2 equals 0.78 . For the smartphone we observe an age-bias that is between that of the laptop and desktop computer.

3.5. Correlation Analysis for the Need to Adapt

In this section we analyse whether the explanatory variable adapt correlates with age or gender. Correlation would explain why the variables are to a certain extent exchangeable. In this analysis, the numerical coding of the variables is the same as for the regression model.
As a result we see that adapt is positively correlated to age with a correlation 0.61 (p-value 1 × 10 21 , Spearman Rank test), respectively, a correlation 0.57 (p-value 1 × 10 17 , Kendall Tau test).
Since both tests give correlations near 0 ( 0.0040 , respectively, 0.0037 ) for adapt and gender we conclude that adapt and gender are not correlated.

3.6. Implicit Target Group Analysis

In this section, we characterize the group of people which, according to the opinion of the participants, does not need adaption of technology. The table (see Table 1) gives the characteristics of this group of 80 questionnaires.
According to the results in the table, the implicit target group is primarily young (80%) and gender balanced. We observe that it includes more older men than older women (not significant in Fisher’s exact test resp. chi-squared test). A different opinion between male and female participants could not be determined. However, male participants were more likely to think adaptation was not necessary (43% no vs. 28% yes) than female participants (36% no vs. 37% yes). The “don’t know” answers are almost the same percentage (29% for male participants vs. 27% for female participants). The percentages refer to a sample with equal frequencies for younger women, older women, younger men and older men.

3.7. Opinions on How Age Affects Likelihood of Use and Expertise

In the following, we summarize the key findings with respect to age.
The average of the age at which participants felt that people would be considered old is 57.3 years (Range: 30 to 77, SD: 9.7).
The rest of the results is based on the analyses presented above. The ANOVA analyses in Section 3.2 showed that age significantly influences perceived likelihood of use and expertise. This replicates the results of the previous study [25].
When analyzing the individual devices separately (see Section 3.3) and comparing the mean ratings (see Figure 2), we observe that, for younger people, both the perceived likelihood of use and expertise are highest with the smartphone, followed by laptop and desktop computer, whereas with older people the order of the final two, i.e., desktop and laptop, is reversed. Thus, in the opinion of the participants, older people are more likely to use a desktop than a laptop. Moreover, in each analysis, the mean ratings for older people are less than for younger people. Thus, older people were judged to be less likely to use each type of device regularly and also to have less expertise. Although always significant, the effect is strongest (in terms of p-values) with respect to the laptop, followed by the smartphone and lastly the desktop. Thus, through the additional analyses performed in this study we can see that participants thought the difference between old and young is greatest with the laptop and smallest with the desktop.
Since the correlation analysis in Section 3.5 yielded a positive correlation between age and adapt, we conclude that in the opinion of the participants the need to adapt the technology is more important for older people.

3.8. Opinions on How Gender Affects Likelihood of Use and Expertise

Unlike the previous paper [25], in this study gender did significantly influence perceived likelihood of use and expertise, though to a lesser degree than device and age (see also Section 3.2). It is interesting to see that, concerning likelihood of use, the mean rating for men is lower than for women, whereas for expertise the mean rating for men is higher (see Figure 2).
On closer analysis (see Section 3.3), gender did not significantly influence perceived likelihood of use of the smartphone or laptop: the hypothesis that men and women were thought to be equally likely to use these devices regularly could not be rejected even though the mean ratings for women are somewhat higher than for men. However, women were thought to be significantly less likely to use a desktop regularly.
In contrast, women were judged to be less expert in the use of both laptops and desktop computers compared to men. With the smartphone, the inferred expertise is not significantly different between genders.
As expected, participants do not see the need to adapt the technology dependent on the gender of the person depicted (see correlation analysis in Section 3.5).

3.9. Combined Analyses

Through comparing devices and looking at the mean ratings, we see that the likelihood of using a desktop computer is generally thought to be lower in comparison to either the laptop or smartphone, see Section 3.2. Regarding expertise, with the desktop and smartphone it can be inferred by likelihood of use and age, for the laptop, however, gender is also a factor (see Section 3.4) with the interpretation that, for the laptop, women are thought to have less expertise compared to men with the same likelihood of use and age.
When looking at the effect of age and gender combined, the result for both likelihood of use and expertise is not significant, see Section 3.2. However, for likelihood of use of a laptop, see Section 3.3, the combination is significant with the highest mean rating for younger women and lowest for older women. The implicit target group (see Section 3.6) is primarily young (80%) and gender balanced.

3.10. Design Aspects

As can be seen from the word clouds in Figure 4, the design aspects mentioned by participants for the four user categories considered are different, but have certain overlaps.
Looking at the frequencies/extensiveness of the codes, easy to use and simple are among the most commonly mentioned for all user categories.
Based on the design aspects mentioned and their extensiveness, some differences between design aspects for younger and older people can be seen. Perhaps not surprisingly, normal appears more with images of younger people, and aspects such as large fonts are more common for older. For younger people, easy to transport is also mentioned more often, whereas for older, reduced functionality is more common. Aesthetic design is mainly for images of younger people, as is brand name. Design for dumbest is mentioned for both younger and older.
There are also differences between the design aspects mentioned for men (of all ages) and women. All but one mention of colors is for women, where all but one mention of efficient is for men. Although aesthetic design is mentioned often for women, stylish and elegant are only mentioned for men. Small size is also more common for men.
Looking at the themes for the user categories used makes it clearer when similar issues are mentioned.
With regard to older men, three themes were identified:
  • Making things able to be seen and used, related to codes such as large fonts, large symbols, large buttons and contrast.
  • Making a device error tolerant, e.g., the codes robust, errors prevented, child mode, unequivocal language.
  • Being familiar with older and less complex technology, e.g., design like 60–70s, easy to obtain overview and explanations rather than tutorials.
For older women, four themes were identified:
  • Making things able to be seen and used (as for older men).
  • Making the device simple and easy to use.
  • Having the right functions, practical and important ones, also because it was mentioned that they already have everything.
  • Support for using the technology, with participants mentioning tutorials, even trained elder care to support.
For younger men, three themes were identified:
  • Having lots of functionality, as illustrated by codes such as functionality, flexible device, cool extras, multi-function device.
  • Incorporating the latest technology, e.g., high resolution, modern, blue light.
  • Being fast and efficient.
For younger women, three themes were identified:
  • Aesthetic design, including aspects such as attractive, classy and colors.
  • Having little functionality, e.g., minimalistic and concise and not functionality.
  • External qualities, based on aspects such as sleek design, high status, quiet and hardware design.

4. Discussion

In this research, we aimed to explore how both the age and gender of people impact the perceived use of computers and expertise with these, and also how these opinions effect the aspects considered important in the design of technologies for them. Although the present research was inspired by the work of Petrie (2018), it sought to extend that study not only by repeating the investigation in a different country, but also by doing more detailed analysis and by adding questions relating to the design aspects thought to be important for the cohort depicted. The additional analyses included the ANOVAs for different devices separately, and regression analysis. This allowed a more detailed investigation if any double effect of being older and female exists. The two questions that were added about design investigate the potential impact of any biases, i.e., how systems might be designed differently due to them. Note that these questions were also used in the correlation analysis and in the implicit target group analysis.
The results indicate biases both with respect to older people and women. The design aspects mentioned illustrate these, e.g., the colors suggested for young women and the larger fonts for older people.
Given that the participants were first year students, these results generally represent the natural bias of people interested in computer science. Since participants did not know anything about the people depicted, the answers reflect their implicit biases. The study included more male than female participants, which is an accordance with a rather low rate of females in STEM (Science, Technology, Engineering, Mathematics) fields.
In the following, we discuss the aspects related to age and gender, the impact these factors could have on the designs these students produce, and finally, what could be done to counteract these.

4.1. Age

It is surprising that these students start to see people old on average at the age of 57.3 (+−9.7), where the current age of retirement for men is 65. With the average age of participants just 21.3, this is on average older than their parents, but younger than their grandparents.
As expected and as found in the previous study [25], results show that based on an image alone, older people are thought to be less likely to use or have experience with all types of devices. Through the new questions, we see how this affects the designs proposed (see Figure 5).
The design aspects mentioned and themes developed through qualitative analysis reflect a similar trend as the quantitative data. For older people, these are primarily related to needing more support (e.g., tutorials and explanations), error tolerant systems and aspects related to accessibility (e.g., large text). For younger people, aspects such as aesthetic design and efficient to use are more likely to be mentioned. This also fits with the result that the perceived need to adapt the technology correlated with age, and gives richer detail about what is meant. Usability is deemed important for users of all age groups.
The implicit target group further highlights the differences. Still, the participants were not all sure if adaptation was needed. There is a large number of “don’t know” answers to the question regarding adaptation. The number of “don’t know” results is always between “yes” and “no” for the same group, and much higher for older than younger. As such, it does not affect the implicit target group. We think these represent those on the fence, i.e., maybe yes and maybe no, rather than people not understanding the question.
As described earlier, older people are more likely to have some sort of physical limitations. In fact, the aspects large font and clear organization suggested by participants for older people are also more generally recommended for making pages accessible for older people [69]. On the one hand, it is encouraging that the participants are aware of the limitations older people may have. On the other, it is disconcerting that these aspects are thought of first and almost to the exclusion of other aspects. It could have unintended negative consequences if this narrow focus is reflected in future systems.
At the same time, the focus on ease of use for younger people may not be ideal. In practice, learnability, which is related to usability, was found to be less important for younger people [70].

4.2. Gender

The bias between the genders is smaller. There is, however, still a significant difference between genders for both perceived likelihood of use and expertise. In the previous study [
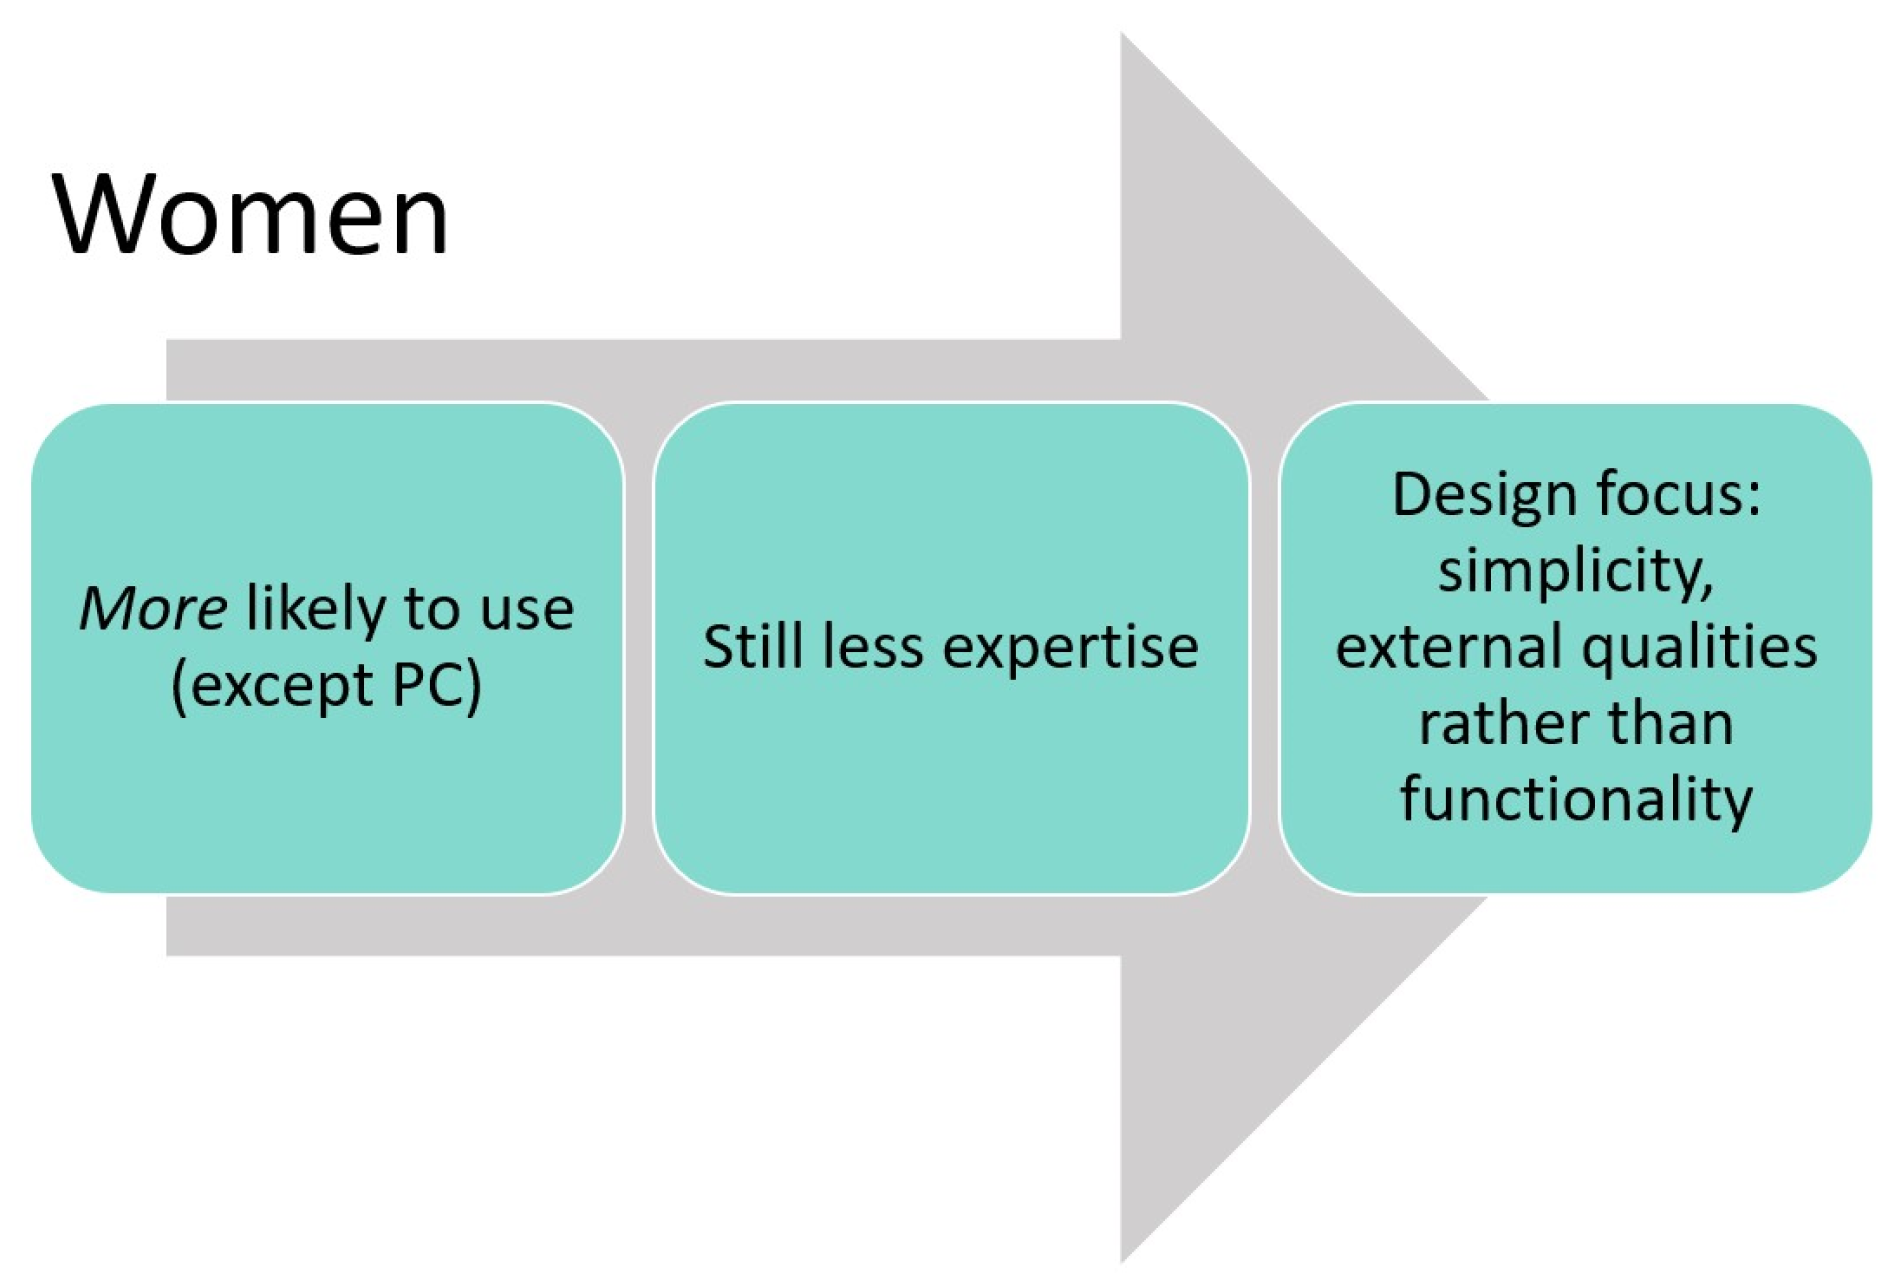
25], only the perceived expertise was significantly different. This indicates that, as expected, the bias towards women in Austria may indeed be greater than in the UK, where the previous study was conducted.
The more detailed analysis performed in this study allows us to see that in terms of likelihood of use, it is only the desktop computer that women are thought to be less likely to use. Women were judged by participants to have less expertise for both the laptop and desktop computer. For the smartphone, the perceived expertise did not differ between genders.
Combining these results, we can see that the desktop computer seems to be perceived as a device that is old fashioned and more associated with expertise. There is the least difference between older and younger people with this device, and the perceived expertise correlates only on the likelihood of use and age. Women, who generally are thought to have less expertise, are thought to be significantly less expert with this device. In fact, the operating system and software for desktops and laptops are often the same, e.g., Windows 10, MacOS.
The laptop is the only device for which the perceived likelihood of use is correlated with gender. Furthermore, for the laptop, even though women are thought to have a similar likelihood of using it, they were thought to have lower expertise with this device compared to men. This matches studies that found that men in computing are ordinary, where women in computing are considered exceptional [71,72].
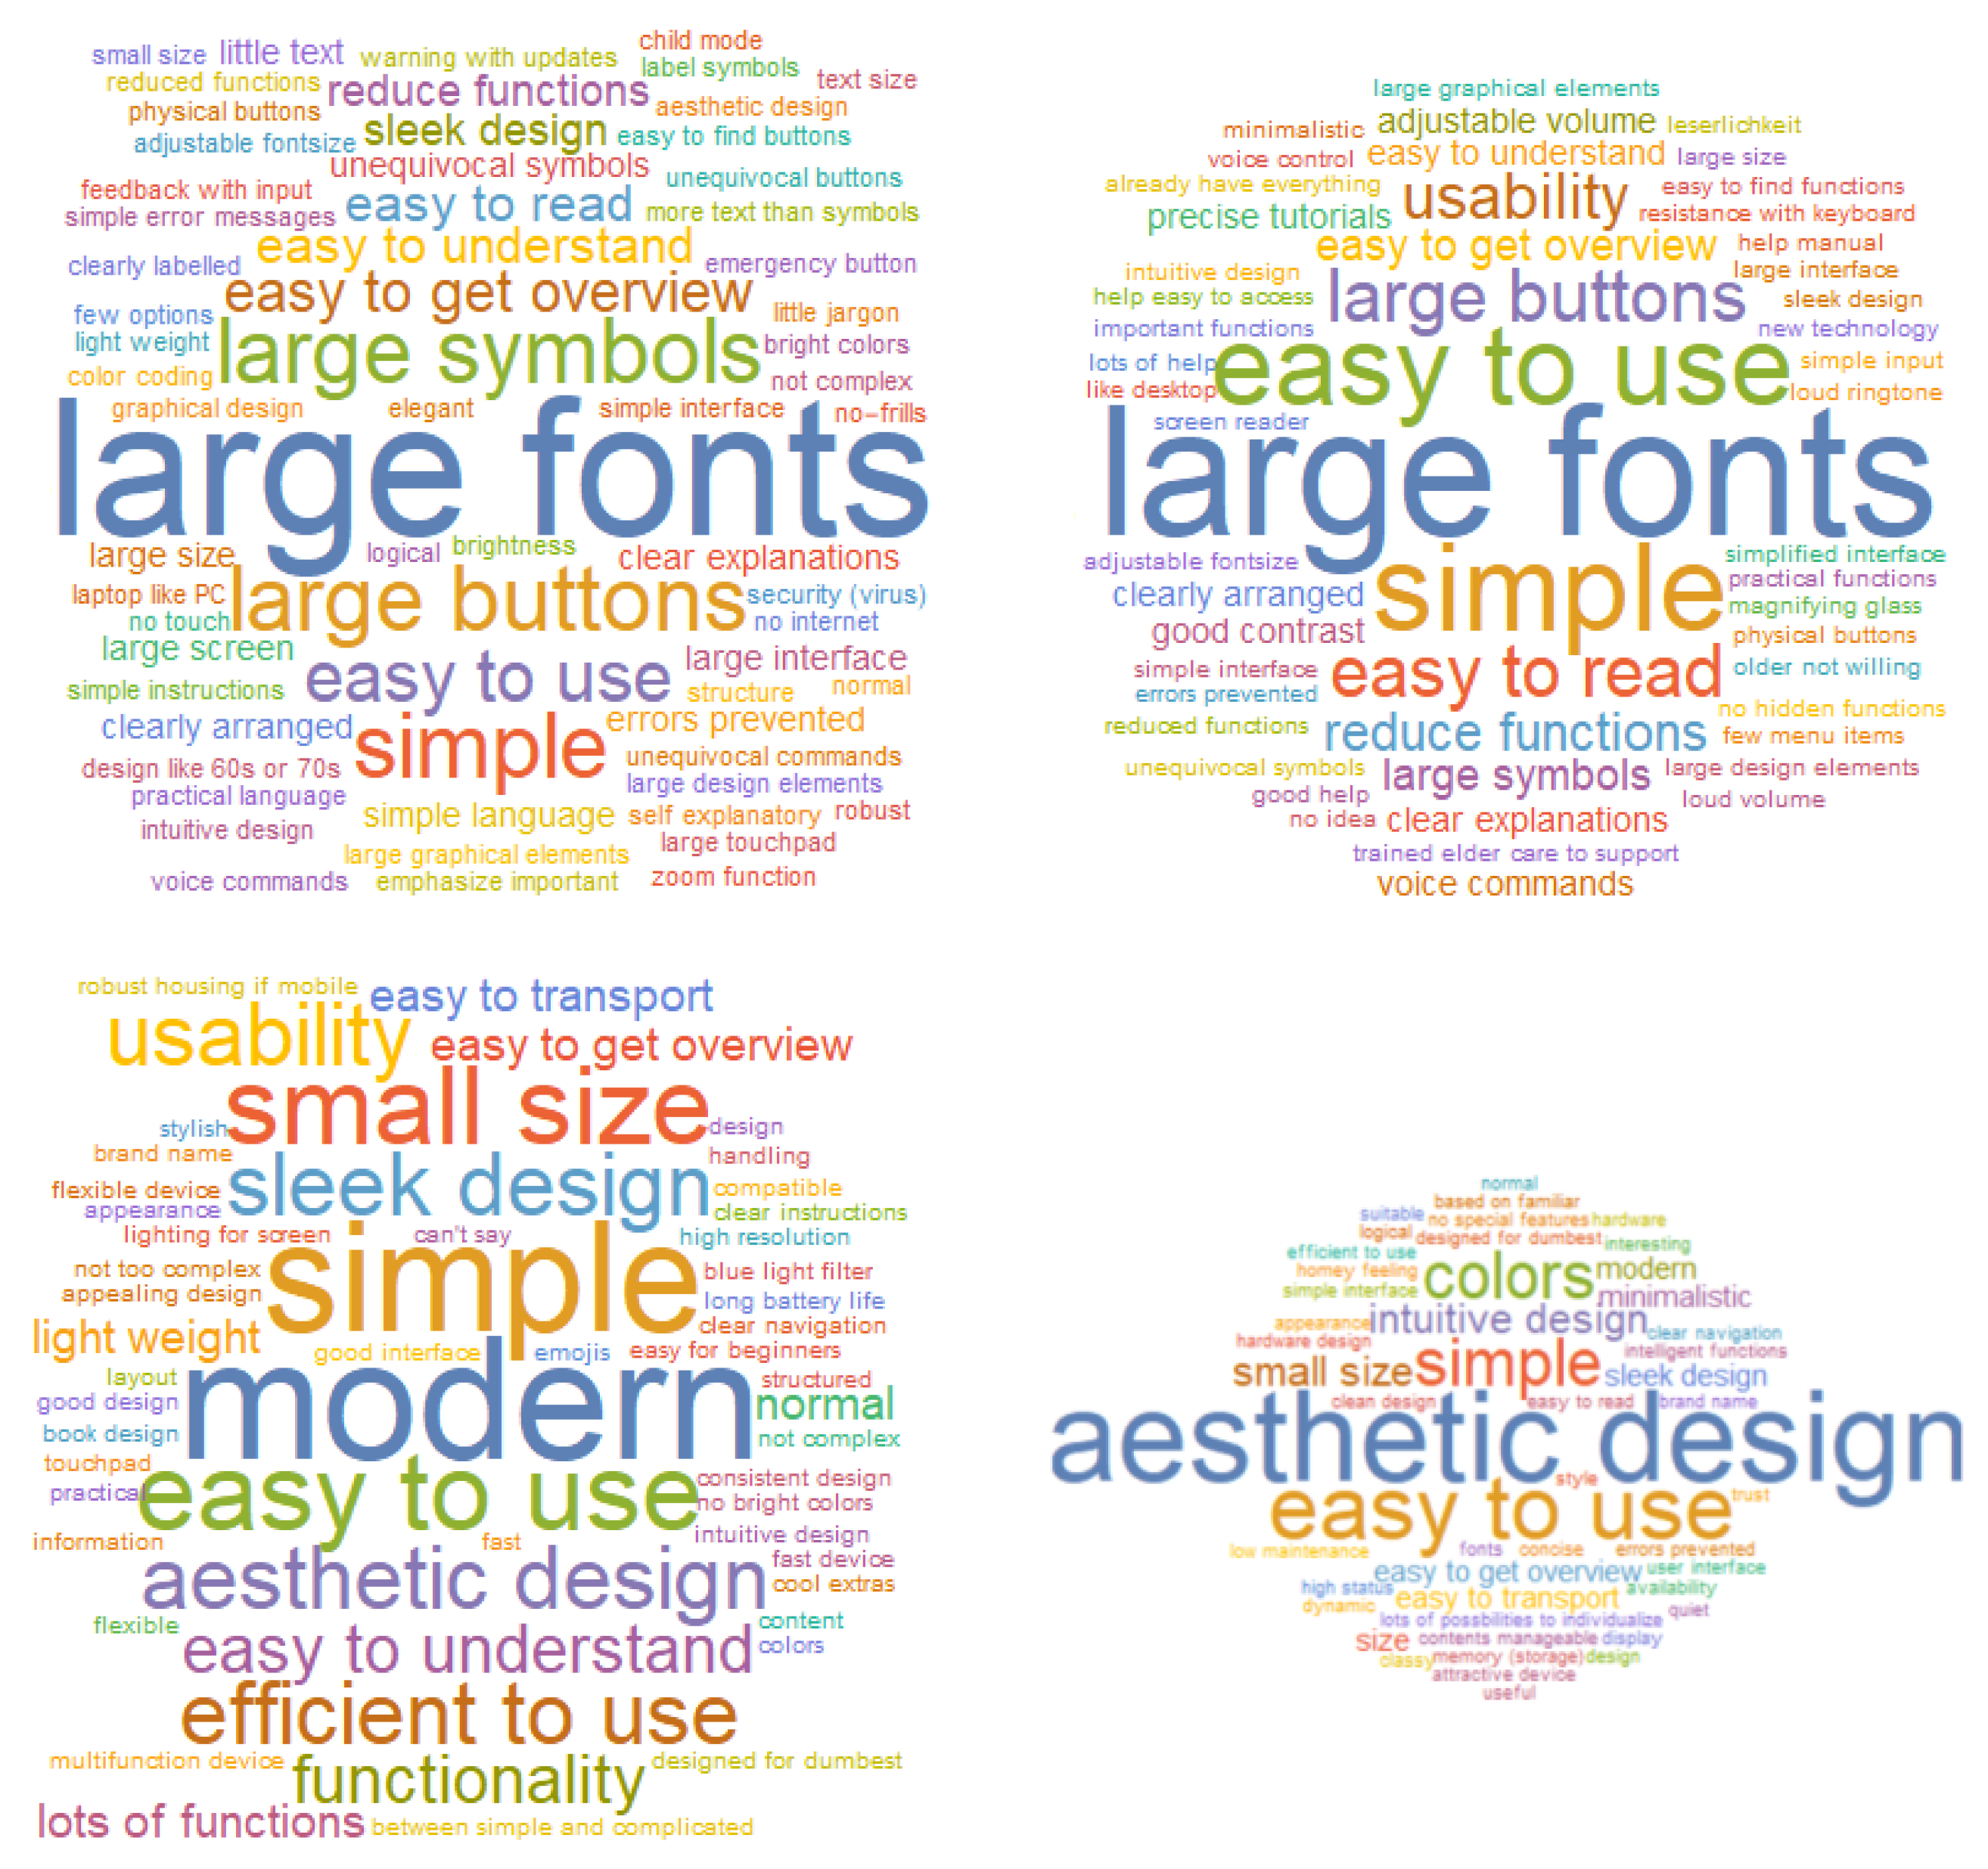
The qualitative results mirror the quantitative results (see also Figure 6), and give richer details with regard to what is meant. Aspects mentioned for men related to working with (proper) computers, such as the efficiency, are more common, and for women more superficial aspects such as color are mentioned.
Petrie (2018) reported there was not an additional effect in being both older and female. Through the more detailed analysis performed here, it is possible to see that in this study the effect of being a woman is exacerbated by being older, as with the laptop, older women are thought to be even less likely to have expertise.
The perceptions of female students with regard to gender did not differ significantly to those of males. However, computer science students may differ in their perceptions from other students the same age. Many computer science students in Austria graduate from technical schools with a low proportion of female students. The low number of women in STEM could contribute to a bias based on sex. In addition, the faculty of technical schools is largely composed of males that tend to reproduce and reinforce gender biases. Hence, they may have already been socialized in traditional male roles where technology is produced, used and generated by men rather than women. Reasons for this disparity are manifold and may be due to a range of factors including traditional societal expectations, lacking encouragement from family and school environments, insufficient confidence and doubts on the part of young females.
There was a difference between the perceptions of participants from different degree programmes with regard to gender, but with closer analysis there was no clear trend, e.g., that it was more pronounced in more technical computing programs. Thus, this was thought to be incidental.

4.3. Impact on Design of Systems

The differences in perception of different groups of people by computer students were thought to be of particular interest, as they will be the ones designing future computer technologies.
There is some indication that the perceptions that lead students to evaluate things in this way could also effect their design choices in the future. Widespread models of human information processing indicate that long-term memory, i.e., the experience and knowledge we gain, is used both in how we perceive things, but also in the responses we select [73,74]. Thus, the participants used their existing knowledge to interpret the images. That same knowledge will be used again, when they make decisions, including design decisions.
If people are thought less likely to use computers, computers may be designed to better suit those who are thought to use them. Furthermore, the attributes used for computers aimed at older people may not suit their real wishes. Moreover, although older people may be less likely to use these computer-based devices than younger ones [43,75], this does not necessarily apply to every individual.
In fact, devices obviously meant (only) for older people or those with disabilities may be perceived as stigmatizing. Many older people are concerned about using devices that are stigmatizing [76], and so may not want devices with large buttons and fonts and not all older people need additional tutorials. This can also have a societal impact, as designs that are stigmatizing have the potential to reproduce biases towards older people [7,77].
Studies show that older people actually put large emphasis on the aesthetics of devices [78,79] and are more willing to adopt devices their grandchildren like [80]. Thus, the biases of the participating ICT students could later lead to devices being developed that older people do not want, and hence, may not be used by them, even if they could support them in their everyday lives. It is also important to go beyond guidelines such as font sizes, to understand the use-cases of the different user groups [63].
In addition to the aesthetics, other aspects were identified to be crucial for older people. The effort to learn a device is an important factor for older people [81]. Effort to learn a system is associated with usability, which was often mentioned by the participants. However, usefulness is also considered to be a key factor for the acceptance of technologies by older people [82], and functionality was not often mentioned by the participants on questionnaires depicting older people. Producing systems that are not useful for older people may perpetuate any differences in the actual usage that exist.
With regard to young women, their usage seems to be associated with less expertise, with aspects such as colors and design more important than performance or functionality. If young girls are given pink devices with little functionality, and young boys high performance devices, this can not only impact their respective computer skills later, but also their perceived level of computer literacy.

4.4. What Can Be Done

Since these participants are still early in their computing careers, there is still potential to effect their views.
Studies indicate that the use of language is important with respect to gender issues. Certainly, with artificial intelligence systems, “if that data is laden with stereotypical concepts of gender, the resulting application of the technology will perpetuate this bias” and “could quietly undo decades of advances in gender equality” [83] (p. 14). Even studies looking at human-generated content in Wikipedia, found clear male biases in both English and German [84] (p. 33).
With respect to older people, “(T)he narrow focus on accessibility concerns harms older adults by excluding them from wider benefits of technologies” [85] (p. 67). It is important that systems are also useful and acceptable for them.
One step to do away with implicit bias is to uncover hidden prejudice so people can reflect on it [6]. By realizing one’s own often unconscious prejudices, such as those regarding gender and age described here, it is hoped that deeply entrenched societal patterns may gradually be influenced, changed and unlearned. Thus, educators need to make students aware of their biases and encourage them to reflect on these in their work. More importantly still, they need to question their own hidden prejudices and mitigate against them.
There are methods that have been shown to be successful in combating gender bias in software systems in particular. Working with the a diverse group of users can help to understand the individual and societal impact for different groups [6]. There are also specific methods, such as the GenderMag [86]. Using the method, it was found that the bias could be removed from the product. Moreover, it was identified that men also benefited—they too had a higher success rate with the resulting software and in practice, many accessibility features can make products better for all users [63].
Hence, educators, such as the authors themselves, have the opportunity to act against this by using gender-neutral formulations, raising awareness about women and older people with regard to their computer literacy, helping students discover their stereotypes and by teaching students methods to counteract implicit biases.
In a similar way, companies producing software can introduce methods that combat bias, but also check for bias in the resulting systems. Some also feel that it is key that more women be involved in software development to help resolve gender bias in technical systems [83].

4.4.1. Limitations

Due to the format of the study, only beliefs of students were collected. These may not correspond to their actions later in design teams. Since the participants are only in their first year, their biases may change or be mitigated against in the course of their studies and work experience.
Furthermore, due to the questionnaire the data about design aspects is not very rich, and limited the depth of analysis possible. This is particularly relevant for the design aspects for older people. Given more space and time, participants may have come up with additional aspects and not concentrated so heavily on accessibility for this cohort.

4.4.2. Future Work

We see a few interesting points to follow up. Firstly, it would be important to compare the results of first year students with final year students to see if these results also hold for those entering the workforce, i.e., those developing the systems of tomorrow. Secondly, it would be interesting to replicate the study in further countries, and do an analysis of societal differences. It might also be interesting to see if there are any changes after COVID-19. Finally, further studies could be conducted to gain richer data about the design aspects perceived to be essential for different categories of users and to see what impact these have on actual designs produced.

5. Conclusions

This study investigated how people studying ICT perceive the experience and expertise of people of different ages and genders with respect to different technical devices. Furthermore, students were asked what design aspects were particularly important for these persons.
The results show that there are significant differences in the perceived usage and abilities. Older people are thought less likely to use desktops, laptops and smartphones regularly and to have expertise with them. Women, both young and old, are thought to have some experience with devices, but less expertise with devices such as desktop computers that may be associated with more computer literacy. Moreover, when considering women, aspects related to appearance, e.g., color, are considered important, where for men, performance is mentioned more frequently. For older people, a focus is put on aspects related to accessibility, e.g., large font; for younger, aspects such as aesthetic design and being easy to transport are thought to be more important.
Left unchallenged, these perceptions could have an important impact, as these students are the designers of the future computer systems. If systems aimed at specific groups are designed this way, it could decide whether these populations find the technologies attractive and also impact their respective computer skills. Thus, long term, if students focus on the design aspects named, it could potentially deepen the digital divide between women and men, as well as older and younger persons.
The findings have implications for both educators and practitioners. Educators need to encourage students to question their biases with respect to age and gender. As practitioners, we need to be aware of our own biases and try to overcome these to develop designs that are attractive and acceptable to all people.

Author Contributions

Conceptualization and project administration, J.D.H.H.; Methodology, data curation, formal analysis and visualization, J.D.H.H. & C.T.; Investigation, M.G.; Validation, C.T.; Writing, all. All authors have read and agreed to the published version of the manuscript.

Funding

This research received no external funding.

Institutional Review Board Statement

Not applicable.

Informed Consent Statement

Participants were informed of the purpose of the questionnaire and participation was optional.

Data Availability Statement

The data presented in this study is available on request from the corresponding author.

Acknowledgments

We thank Jana Zaludova and Theresa Wöß for entering data. We also thank the students who participated in the pilot and the study. Open Access Funding from the University of Applied Sciences Upper Austria.

Conflicts of Interest

The authors declare no conflict of interest.

Abbreviations

The following abbreviations are used in this manuscript:
ANOVAMultivariate analysis of variance (statistical method)
ICTInformation and communications technology
LTLaptop computer
partgenderVariable for gender of participant
partstudiesVariable for degree programme of participant
PCPersonal or desktop computer
SPSmartphone

Appendix A. Questionnaire

Each questionnaire included one picture of a person, as described above, followed by the questions. The questions were as follows.
About age in general:
  • How old do you estimate this person is? (open)
  • Would you call this person old? (yes / no)
  • From which age do you think of someone as old? (open)
About likelihood of use (all rated from 1 = definitely not to 7 = definitely):
  • In your opinion, does this person use a desktop computer regularly?
  • In your opinion, does this person use a laptop computer regularly?
  • In your opinion, does this person use a smartphone regularly?
About expertise with the devices (all rated from 1 = not at all to 7 = very):
  • In your opinion, how versed is this person using a desktop computer?
  • In your opinion, how versed is this person using a laptop computer?
  • In your opinion, how versed is this person using a smartphone?
Questions added about design:
  • In your opinion, which design aspects would be particularly important for this person with regard to use? (open question with three boxes for answers)
  • In your opinion, should adapted technology be developed for this person? (yes / no / don’t know)

Appendix B. Statistical Results

The following tables give detailed results (p-values and mean ratings) of the variance analyses for perceived likelihood of use, expertise and the different devices. The results are included for all explanatory variables in question and for those combinations that showed significant differences, i.e., p-values less than 0.05 . The descriptions of the variables are given in Section 2.1. The mean ratings are arranged from the lowest to the highest.
The final table lists the coefficients from the regression analyses.
Table A1. Likelihood of use, p-value from ANOVA with associated mean ratings.
Variablep-ValueMean RatingLowest Highest
device 4 × 10 20 PC 3.54 LT 3.91 SP 4.81
age 1 × 10 106 older 2.59 younger 5.57
gender 0.05 men 4.06 women 4.11
adapt 0.23 yes2.68don’t know4.27no5.06
partgender 0.38 female 3.81 male 4.15 not specified 4.59
partstudies 0.01 C 3.72 ......D 4.33
age*device 2 × 10 7 older*LT 2.15 ......younger*SP 6.45
device*gender 0.04 women*PC 3.34 ......women*SP 4.97
Table A2. Expertise, p-value from ANOVA with associated mean ratings.
Variablep-ValueMean RatingLowest Highest
device 4 × 10 8 PC 3.51 LT 3.58 SP 4.15
age 1 × 10 117 older 2.30 younger 5.18
gender 8 × 10 5 women 3.68 men 3.80
adapt 0.04 yes 2.38 don’t know 3.85 no 4.74
partgender 0.70 female 3.59 male 3.79 not specified 3.96
partstudies 2 × 10 3 C 3.53 ......B 3.97
age*device 0.01 older*LT 2.04 ......younger*SP 5.69
Table A3. Likelihood of use for Desktop computer (PC), p-value from ANOVA with associated mean ratings.
Variablep-ValueMean RatingLowest Highest
age 7 × 10 19 older 2.47 younger 4.60
gender 0.01 women 3.34 men 3.74
adapt 0.78 yes 2.60 don’t know 3.54 no 4.26
partgender 1.00 female 3.40 male 3.57 not specified 3.76
partstudies 0.33 A 3.21 ......B 3.73
Table A4. Expertise with Desktop computer (PC), p-value from ANOVA with associated mean ratings.
Variablep-ValueMean RatingLowest Highest
age 8 × 10 31 older 2.27 younger 4.74
gender 2 × 10 3 women 3.34 men 3.68
adapt 0.14 yes 2.32 don’t know 3.49 no 4.45
partgender 0.55 female 3.48 male 3.50 not specified 3.65
partstudies 0.052 A 3.21 ......B 3.79
Table A5. Likelihood of use for Laptop computer (LT), p-value from ANOVA with associated mean ratings.
Variablep-ValueMean RatingLowest Highest
age 3 × 10 50 older 2.15 younger 5.67
gender 0.58 men 3.80 women 4.02
adapt 0.10 yes 2.16 don’t know 4.19 no 5.09
partgender 0.25 female 3.50 male 4.05 not specified 4.41
partstudies 0.11 C 3.44 ......E 4.24
Table A6. Expertise with Laptop computer (LT), p-value from ANOVA with associated mean ratings.
Variablep-ValueMean RatingLowest Highest
age 5 × 10 45 older 2.04 younger 5.11
gender 2 × 10 3 women 3.46 men 3.70
adapt 0.04 yes 2.02 don’t know 3.72 no 4.70
partgender 0.54 female 3.31 male 3.69 not specified 3.71
partstudies 0.12 C 3.30 ......B 3.81
Table A7. Likelihood of use for Smartphone (SP), p-value from ANOVA with associated mean ratings.
Variablep-ValueMean RatingLowest Highest
age 4 × 10 44 older 3.16 younger 6.45
gender 0.83 men 4.64 women 4.97
adapt 0.64 yes 3.27 don’t know 5.07 no 5.83
partgender 0.47 female 4.52 male 4.84 not specified 5.59
partstudies 0.10 C 4.14 ......E 5.04
Table A8. Expertise with Smartphone (SP), p-value from ANOVA with associated mean ratings.
Variablep-ValueMean RatingLowest Highest
age 1 × 10 44 older 2.60 younger 5.69
gender 0.67 men 4.04 women 4.25
adapt 0.99 yes 2.79 don’t know 4.35 no 5.06
partgender 0.96 female 3.98 male 4.17 not specified 4.53
partstudies 0.59 C 3.85 ......B 4.31
Table A9. Table of the coefficients in the regression analyses.
DeviceLikelihood of UseAgeGenderAdapt
Desktop computer 0.50 1.21 0.25 0.21
Laptop 0.62 0.76 0.45 0.16
Smartphone 0.57 1.30 0.10 0.07

Appendix C. Qualitative Analysis

To gain familiarity with the data, the data was first read several times. During this phase, the other answers were hidden and the data were not sorted or grouped in any way. Overall, 181 questionnaires included at least one answer. Some had compound answers (i.e., multiple answers in each slot) or even complete sentences. The answers ranged from general, e.g., size, to very specific, e.g., voice operated magnifying glass. Some answers included an explanation in addition, for example, since the person depicted is older, has glasses, is busy. One stated explicitly that just by seeing a picture of someone it was not possible to know what was needed. A couple of answers mentioned books, which could indicate that participants interpreted the question specifically to technology in the context of the images, which show someone reading.
For the initial coding, we started at the top with the answers from the first slot, and first coding all of the first answers before continuing to the next column. Here again, the other answers were hidden. Although most answers were in German, all codes were conducted in English. Excel supported unifying terminology, as it suggested answers that had already been used. During coding, the previous codes were reexamined to ensure codes were used consistently, and in some cases codes for previous answers were changed. After this step there were between one and eight terms per questionnaire, and a total of 455 terms. This included 168 different terms.
The following examples help to illustrate this process. For example, the answers large letters, large script, large numbers & letters, large text were coded as large fonts. Other answers, such as, text size (without large), easy to read, large symbols, etc. were given different codes. Similarly, simple, simplicity and simple interface were all coded as simple. Answer such as not too complex, sleek and simplified navigation were given different codes. Some answers and codes were ambiguous, for example, contents manageable, could mean designed so that the contents can be managed or so that there is only a manageable amount. In these cases, the original answer was used as a code.
There is a still a range of meaning that could be interpreted into the codes after this first phase of the analysis. For example, with regard to simple, the implication is different if it is combined with an answer device needs to be adapted or other answers such as easy to use versus aesthetic design. In keeping with the semantic level of analysis chosen, here no interpretation was made in this first phase. However, some differentiation emerged in some cases in the next phase of the analysis.
The next phase was to develop overarching themes from the codes and review these. To provide more context for this, in addition to the code itself, the other data was examined, including all of the original answers for the design aspects, the answer to the question about whether the technology should be adapted, whether they thought the person depicted was old, as well as, the gender and age category of the person depicted. Due to the goal of the study, the analysis was split into four categories based on the people depicted, called user categories in the paper: older men, older women, younger men and younger women. Braun & Clark suggest using visual representations to help this process [68] (p. 19). For this, word clouds were generated from the codes using Wolfram Mathematica, which display the size of the codes based on the number of times it occurs. With this type of data, the number of times the individual codes occur corresponds to extensiveness, i.e., how many different participants mentioned it [87] (p. 147). For the word clouds, no differentiation was made which slot the answers came from. The word clouds were also deemed to be a good way to visualize the coded answers for the paper. Before writing the paper, the themes identified were refined and re-named.

References

  1. König, R.; Seifert, A.; Doh, M. Internet use among older Europeans: An analysis based on SHARE data. Univers. Access Inf. Soc. 2018, 17, 621–633. [Google Scholar] [CrossRef]
  2. Lee, C.C.; Czaja, S.J.; Moxley, J.H.; Sharit, J.; Boot, W.R.; Charness, N.; Rogers, W.A. Attitudes toward computers across adulthood from 1994 to 2013. Gerontologist 2019, 59, 22–33. [Google Scholar] [CrossRef] [PubMed]
  3. Siddiq, F.; Scherer, R. Is there a gender gap? A meta-analysis of the gender differences in students’ ICT literacy. Educ. Res. Rev. 2019, 27, 205–217. [Google Scholar] [CrossRef]
  4. Women, C. The Mobile Gender Gap Report 2019; GSMA: London, UK, 2019; Available online: https://www.gsmaintelligence.com/research (accessed on 14 June 2022).
  5. Mariscal, J.; Mayne, G.; Aneja, U.; Sorgner, A. Bridging the gender digital gap. Economics 2019, 13, 1–12. [Google Scholar] [CrossRef] [Green Version]
  6. Fletcher-Watson, S.; De Jaegher, H.; van Dijk, J.; Frauenberger, C.; Magnée, M.; Ye, J. Diversity Computing. Interactions 2018, 25, 28–33. [Google Scholar] [CrossRef]
  7. Durick, J.; Robertson, T.; Brereton, M.; Vetere, F.; Nansen, B. Dispelling Ageing Myths in Technology Design. In Proceedings of the 25th Australian Computer-Human Interaction Conference: Augmentation, Application, Innovation, Collaboration, Adelaide, Australia, 25–29 November 2013; ACM: New York, NY, USA OzCHI ’13. , 2013; pp. 467–476. [Google Scholar] [CrossRef] [Green Version]
  8. Fischer, B.; Peine, A.; Östlund, B. The importance of user involvement: A systematic review of involving older users in technology design. Gerontologist 2020, 60, e513–e523. [Google Scholar] [CrossRef] [Green Version]
  9. Mannheim, I.; Schwartz, E.; Xi, W.; Buttigieg, S.C.; McDonnell-Naughton, M.; Wouters, E.J.; Van Zaalen, Y. Inclusion of older adults in the research and design of digital technology. Int. J. Environ. Res. Public Health 2019, 16, 3718. [Google Scholar] [CrossRef] [Green Version]
  10. Papavlasopoulou, S.; Giannakos, M.N.; Jaccheri, L. Creative programming experiences for teenagers: Attitudes, performance and gender differences. In Proceedings of the 15th International Conference on Interaction Design and Children, Manchester, UK, 21–24 June 2016; ACM: New York, NY, USA, 2016; pp. 565–570. [Google Scholar] [CrossRef]
  11. Van Dijk, J. The Digital Divide; John Wiley & Sons: Hoboken, NJ, USA, 2020. [Google Scholar]
  12. Beringer, R. Busting the Myth of Older Adults and Technology: An In-depth Examination of Three Outliers. In Proceedings of the Cross-Cultural Design; Rau, P.L.P., Ed.; Springer International Publishing: Cham, Switzerland, 2017; pp. 605–613. [Google Scholar] [CrossRef]
  13. Harding, S.G. The Science Question in Feminism; Cornell University Press: Ithaca, NY, USA, 1986. [Google Scholar]
  14. Kenny, E.J.; Donnelly, R. Navigating the gender structure in information technology: How does this affect the experiences and behaviours of women? Hum. Relations 2020, 73, 326–350. [Google Scholar] [CrossRef]
  15. Gill, R.; Grint, K. Introduction the Gender-Technology Relation: Contemporary Theory and Research. In The Gender-Technology Relation; Taylor & Francis: Abingdon, UK, 2018; pp. 1–28. [Google Scholar]
  16. Hardey, M. The Culture of Women in Tech: An Unsuitable Job for a Woman; Emerald Group Publishing: Bingley, UK, 2019. [Google Scholar]
  17. Elsbach, K.D.; Stigliani, I. New information technology and implicit bias. Acad. Manag. Perspect. 2019, 33, 185–206. [Google Scholar] [CrossRef] [Green Version]
  18. Dasgupta, N.; McGhee, D.E.; Greenwald, A.G.; Banaji, M.R. Automatic preference for White Americans: Eliminating the familiarity explanation. J. Exp. Soc. Psychol. 2000, 36, 316–328. [Google Scholar] [CrossRef] [Green Version]
  19. Lee, N.T. Detecting racial bias in algorithms and machine learning. J. Inf. Commun. Ethics Soc. 2018, 16, 252–260. [Google Scholar] [CrossRef]
  20. Schweitzer, E.J. Digital Divide. 2015. Available online: https://www.britannica.com/topic/digital-divide (accessed on 25 May 2022).
  21. Gilbert, M.R.; Masucci, M. Defining the geographic and policy dynamics of the digital divide. In Handbook of the Changing World Language Map; Springer: Berlin/Heidelberg, Germany, 2020; pp. 3653–3671. [Google Scholar] [CrossRef]
  22. Gaisch, M.; Rammer, V. Can the New COVID-19 Normal Help to Achieve Sustainable Development Goal 4. In Sustaining the Future of Higher Education; Brill: Leiden, The Netherlands, 2021; pp. 172–191. [Google Scholar] [CrossRef]
  23. Wu, Y.H.; Damnée, S.; Kerhervé, H.; Ware, C.; Rigaud, A.S. Bridging the digital divide in older adults: A study from an initiative to inform older adults about new technologies. Clin. Interv. Aging 2015, 10, 193–200. [Google Scholar] [CrossRef] [PubMed]
  24. Peine, A.; Neven, L. From intervention to co-constitution: New directions in theorizing about aging and technology. Gerontologist 2019, 59, 15–21. [Google Scholar] [CrossRef] [PubMed]
  25. Petrie, H. Ageism and Sexism Amongst Young Computer Scientists. In Proceedings of the Computers Helping People with Special Needs, Linz, Austria, 11–13 July 2018; Miesenberger, K., Kouroupetroglou, G., Eds.; Springer International Publishing: Cham, Switzerland, 2018; pp. 421–425. [Google Scholar] [CrossRef] [Green Version]
  26. Yücel, Y.; Rızvanoğlu, K. Battling gender stereotypes: A user study of a code-learning game, “Code Combat,” with middle school children. Comput. Hum. Behav. 2019, 99, 352–365. [Google Scholar] [CrossRef]
  27. Wong, B.; Kemp, P.E. Technical boys and creative girls: The career aspirations of digitally skilled youths. Camb. J. Educ. 2018, 48, 301–316. [Google Scholar] [CrossRef] [Green Version]
  28. Cooper, J.; Kugler, M.B. The digital divide: The role of gender in human–computer interaction. In Human-Computer Interaction; CRC Press: Boca Raton, FL, USA, 2009; pp. 21–34. [Google Scholar]
  29. Holman, L.; Stuart-Fox, D.; Hauser, C.E. The gender gap in science: How long until women are equally represented? Plos Biol. 2018, 16, e2004956. [Google Scholar] [CrossRef] [Green Version]
  30. Hannon, C. Avoiding Bias in Robot Speech. Interactions 2018, 25, 34–37. [Google Scholar] [CrossRef]
  31. Marzano, G.; Lubkina, V. The Digital Gender Divide: An Overview. In Proceedings of the Society Integration Education Proceedings of the International Scientific Conference; Rezekne, Latvia, 24–25 May 2019, Volume 5, pp. 413–421.
  32. Appel, M.; Kronberger, N.; Aronson, J. Stereotype threat impairs ability building: Effects on test preparation among women in science and technology. Eur. J. Soc. Psychol. 2011, 41, 904–913. [Google Scholar] [CrossRef]
  33. Borokhovski, E.; Tamim, R.M.; Pickup, D.; Rabah, J.; Obukhova, Y. Gender-based “digital divide”: The latest update from meta-analytical research. In Proceedings of the EdMedia+ Innovate Learning: Association for the Advancement of Computing in Education (AACE), Amsterdam, The Netherlands, 24 June 2019; pp. 1555–1561. [Google Scholar]
  34. Kelleher, C.; Pausch, R.; Kiesler, S. Storytelling Alice motivates middle school girls to learn computer programming. In Proceedings of the Proceedings of the SIGCHI Conference on Human Factors in Computing Systems, San Jose, CA, USA, 28 April–3 May 2007; ACM: New York, NY, USA, 2007; pp. 1455–1464. [Google Scholar] [CrossRef]
  35. Lampinen, M. Technologies Facilitating Elderly Autonomy: Ethical and Cybersecurity Dimensions. Master’s Thesis, Laurea University of Applied Sciences, Vantaa, Finland, 2022. [Google Scholar]
  36. Köttl, H.; Tatzer, V.C.; Ayalon, L. COVID-19 and everyday ICT use: The discursive construction of old age in German media. Gerontologist 2022, 62, 413–424. [Google Scholar] [CrossRef]
  37. Wanka, A. Disengagement as withdrawal from public space: Rethinking the relation between place attachment, place appropriation, and identity-building among older adults. Gerontologist 2018, 58, 130–139. [Google Scholar] [CrossRef] [Green Version]
  38. Hsu, T. Older People Are Ignored and Distorted in Ageist Marketing, Report Finds. New York Times, 5 August 2019. [Google Scholar]
  39. Mettenberger, T.; Küpper, P. Potential and impediments to senior citizens’ volunteering to maintain basic services in shrinking regions. Sociol. Rural. 2019, 59, 739–762. [Google Scholar] [CrossRef]
  40. Peine, A.; Marshall, B.L.; Martin, W.; Neven, L. Socio-gerontechnology: Key themes, future agendas. In Socio-Gerontechnology; Routledge: London, UK, 2021; pp. 1–23. [Google Scholar] [CrossRef]
  41. Charise, A.; Pang, C.; Khalfan, K.A. What is Intergenerational Storytelling? Defining the Critical Issues for Aging Research in the Humanities. J. Med. Humanit. 2022, 1–23. [Google Scholar] [CrossRef] [PubMed]
  42. Guzdial, M.; du Boulay, B. The History of Computing. In The Cambridge Handbook of Computing Education Research (2019); Cambridge University Press: Cambridge, UK, 2019; Volume 11. [Google Scholar] [CrossRef] [Green Version]
  43. United Nations Economic Commission for Europe. Computer Use by Age and Sex; United Nations Economic Commission for Europe: Geneva, Switzerland, 2017; Available online: http://w3.unece.org/ (accessed on 28 October 2021).
  44. Rosales, A.; Fernández-Ardèvol, M. Ageism in the era of digital platforms. Convergence 2020, 26, 1074–1087. [Google Scholar] [CrossRef] [PubMed]
  45. Anderson, M.; Perrin, A. Tech Adoption Climbs Among Older Adults; Pew Research Center: Washington, DC, USA, 2017. [Google Scholar]
  46. Mitzner, T.L.; Savla, J.; Boot, W.R.; Sharit, J.; Charness, N.; Czaja, S.J.; Rogers, W.A. Technology adoption by older adults: Findings from the PRISM trial. Gerontologist 2019, 59, 34–44. [Google Scholar] [CrossRef] [PubMed]
  47. Wildenbos, G.; Peute, L.; Jaspers, M. Aging barriers influencing mobile health usability for older adults: A literature based framework (MOLD-US). Int. J. Med. Inform. 2018, 114, 66–75. [Google Scholar] [CrossRef]
  48. Gregor, P.; Newell, A.F.; Zajicek, M. Designing for Dynamic Diversity: Interfaces for Older People. In Proceedings of the Fifth International ACM Conference on Assistive Technologies, Edinburgh, Scotland, 8–10 July 2002; ACM: New York, NY, USA, 2002. ASSETS ’02. pp. 151–156. [Google Scholar] [CrossRef]
  49. Yazdani-Darki, M.; Rahemi, Z.; Adib-Hajbaghery, M. Older adults’ barriers to use technology in daily life: A qualitative study. Nurs. Midwifery Stud. 2020, 9, 229–236. [Google Scholar] [CrossRef]
  50. MedlinePlus. Aging Changes in the Senses; National Library of Medicine: Bethesda, MD, USA, 2020. [Google Scholar]
  51. Leitner, B.; Baldaszti, E. Menschen mit Beeinträchtigungen: Ergebnisse der Mikrozensus-Zusatzfragen 4. Quartal 2007; Statistik Austria: Vienna, Austria, 2008. [Google Scholar]
  52. American Psychological Association. Memory and Aging; American Psychological Association: Washington, DC, USA, 2006. [Google Scholar]
  53. Ramos, M.D. Attitudes, perceived competence, and social limitation among older adults with hearing problems. Educ. Gerontol. 2020, 46, 431–438. [Google Scholar] [CrossRef]
  54. Statistik Austria. Personen mit Dauerhaften Gesundheitsbeschwerden nach Art der Beschwerden 2011; Statistik Austria: Vienna, Austria, 2011. [Google Scholar]
  55. Ferrucci, L.; Kuchel, G.A. Heterogeneity of Aging: Individual Risk Factors, Mechanisms, Patient Priorities, and Outcomes. J. Am. Geriatr. Soc. 2021, 69, 610–612. [Google Scholar] [CrossRef]
  56. Blythe, M.A.; Monk, A.F.; Doughty, K. Socially Dependable Design: The Challenge of Ageing Populations for HCI. Interact. Comput. 2005, 17, 672–689. [Google Scholar] [CrossRef]
  57. Choi, E.Y.; Kim, Y.; Chipalo, E.; Lee, H.Y. Does perceived ageism widen the digital divide? And does it vary by gender? Gerontologist 2020, 60, 1213–1223. [Google Scholar] [CrossRef] [PubMed]
  58. Saplacan, D.; Tørresen, J. Robots as Welfare Technologies to Reduce Falls Amongst Older Adults: An Explorative Study from Norway. In Proceedings of the International Conference on Human-Computer Interaction, Virtual Event, 26 June–1 July 2022; Springer: New York, NY, USA, 2022; pp. 88–106. [Google Scholar] [CrossRef]
  59. Astell, A.J.; McGrath, C.; Dove, E. ‘That’s for old so and so’s!’: Does identity influence older adults’ technology adoption decisions? Ageing Soc. 2020, 40, 1550–1576. [Google Scholar] [CrossRef]
  60. ISO 9241–210; Ergonomics of Human-System Interaction: Part 210 Human-Centred Design for Interactive Systems. ISO: Geneva, Switzerland, 2010.
  61. Curcio, K.; Santana, R.; Reinehr, S.; Malucelli, A. Usability in agile software development: A tertiary study. Comput. Stand. Interfaces 2019, 64, 61–77. [Google Scholar] [CrossRef]
  62. Hallewell Haslwanter, J.D.; Fitzpatrick, G. The Development of a Sensor-based System for Older People: A Case Study. In Proceedings of the 27th International BCS Human Computer Interaction Conference, British Computer Society, London, UK, 9–13 September 2013; BCS-HCI; pp. 11:1–11:10. [Google Scholar] [CrossRef] [Green Version]
  63. Churchill, E.F. Putting Accessibility First. Interactions 2018, 25, 24–25. [Google Scholar] [CrossRef]
  64. Wikipedia. EuroVoc. 2021. Available online: https://en.wikipedia.org/wiki/EuroVoc (accessed on 25 May 2022).
  65. Hofstede Insights. Compare Countries. Available online: https://www.hofstede-insights.com/product/compare-countries (accessed on 1 July 2022).
  66. House, R.J.; Hanges, P.J.; Javidan, M.; Dorfman, P.W.; Gupta, V. Culture, Leadership, and Organizations: The GLOBE Study of 62 Societies; Sage: Newcastle upon Tyne, UK, 2004. [Google Scholar]
  67. Plano Clark, V.L.; Creswell, J.W. The Mixed Methods Reader; Sage: Newcastle upon Tyne, UK, 2008. [Google Scholar]
  68. Braun, V.; Clarke, V. Successful Qualitative Research; Sage Publications Ltd.: London, UK, 2013. [Google Scholar]
  69. W3C. Developing Websites for Older People: How Web Content Accessibility Guidelines (WCAG) 2.0 Applies. 2010. Available online: https://www.w3.org/WAI/EO/Drafts/older-users (accessed on 25 May 2022).
  70. Wandke, H.; Sengpiel, M.; Sönksen, M. Myths About Older People’s Use of Information and Communication Technology. Gerontology 2012, 58, 564–570. [Google Scholar] [CrossRef] [PubMed] [Green Version]
  71. Payton, F.C.; Berki, E. Countering the Negative Image of Women in Computing. Commun. ACM 2019, 62, 56–63. [Google Scholar] [CrossRef]
  72. Singh, V.K.; Chayko, M.; Inamdar, R.; Floegel, D. Female librarians and male computer programmers? Gender bias in occupational images on digital media platforms. J. Assoc. Inf. Sci. Technol. 2020, 71, 1281–1294. [Google Scholar] [CrossRef] [Green Version]
  73. Wickens, C.D. Engineering Psychology and Human Performance; Harper Collins: New York, NY, USA, 1992. [Google Scholar]
  74. Kantowitz, B.H. Human Information Processing: Tutorials in Performance and Cognition; Routledge: London, UK, 2021. [Google Scholar]
  75. Anikeeva, O.A.; Sizikova, V.V.; Demidova, T.E.; Starovojtova, L.I.; Akhtyan, A.G.; Godzhieva, R.B.; Karpunina, A.V.; Maydangalieva, Z.A. IT and computer technologies for education of senior citizens and improving the quality of their life. Eurasia J. Math. Sci. Technol. 2019, 15, em1768. [Google Scholar] [CrossRef] [Green Version]
  76. Yusif, S.; Soar, J.; Hafeez-Baig, A. Older people, assistive technologies, and the barriers to adoption: A systematic review. Int. J. Med. Inform. 2016, 94, 112–116. [Google Scholar] [CrossRef] [Green Version]
  77. Li, C.; Lee, C.F.; Xu, S. Stigma Threat in Design for Older Adults: Exploring Design Factors that Induce Stigma Perception. Int. J. Des. 2020, 14, 51–64. [Google Scholar]
  78. Ghorayeb, A.; Comber, R.; Gooberman-Hill, R. Older adults’ perspectives of smart home technology: Are we developing the technology that older people want? Int. J. Human-Comput. Stud. 2021, 147, 102571. [Google Scholar] [CrossRef]
  79. Dahl, Y.; Farshchian, B.; Vilarinho, T.; Helbostad, J.L.; Nawaz, A.; Nygård, A.J.; Wik, P.B. Stakeholder Attitudes toward and Values Embedded in a Sensor-Enhanced Personal Emergency Response System. Interact. Comput. 2015, 28, 598–611. [Google Scholar] [CrossRef] [Green Version]
  80. Luijkx, K.; Peek, S.; Wouters, E. “Grandma, You Should Do It - It’s Cool” - Older Adults and the Role of Family Members in Their Acceptance of Technology. Int. J. Environ. Res. Public Health 2015, 12, 15470–15485. [Google Scholar] [CrossRef] [Green Version]
  81. Cimperman, M.; Brenčič, M.M.; Trkman, P. Analyzing older users’ home telehealth services acceptance behavior - applying an extended UTAUT model. Int. J. Med. Inform. 2016, 90, 22–31. [Google Scholar] [CrossRef] [PubMed] [Green Version]
  82. Peek, S.T.M.; Wouters, E.J.M.; vanHoof, J.; Luijkx, K.G.; Boeije, H.R.; Vrijhoef, H.J.M. Factors influencing acceptance of technology for aging in place: A systematic review. Int. J. Med. Inform. 2014, 83, 235–248. [Google Scholar] [CrossRef] [PubMed] [Green Version]
  83. Leavy, S. Gender Bias in Artificial Intelligence: The Need for Diversity and Gender Theory in Machine Learning. In Proceedings of the 1st International Workshop on Gender Equality in Software Engineering, Gothenburg, Sweden, 28 May 2018; Association for Computing Machinery: New York, NY, USA, 2018. GE ’18. pp. 14–16. [Google Scholar] [CrossRef]
  84. Chen, Y.; Mahoney, C.; Grasso, I.; Wali, E.; Matthews, A.; Middleton, T.; Njie, M.; Matthews, J. Gender Bias and Under-Representation in Natural Language Processing Across Human Languages. In Proceedings of the 2021 AAAI/ACM Conference on AI, Ethics, and Society, AIES ’21, Virtual, 19–21 May 2021; Association for Computing Machinery: New York, NY, USA, 2021; pp. 24–34. [Google Scholar] [CrossRef]
  85. Knowles, B.; Hanson, V.L.; Rogers, Y.; Piper, A.M.; Waycott, J.; Davies, N.; Ambe, A.H.; Brewer, R.N.; Chattopadhyay, D.; Dee, M.; et al. The Harm in Conflating Aging with Accessibility. Commun. ACM 2021, 64, 66–71. [Google Scholar] [CrossRef]
  86. Vorvoreanu, M.; Zhang, L.; Huang, Y.H.; Hilderbrand, C.; Steine-Hanson, Z.; Burnett, M. From Gender Biases to Gender-Inclusive Design: An Empirical Investigation. In Proceedings of the 2019 CHI Conference on Human Factors in Computing Systems, CHI ’19, Glasgow, UK, 4–9 May 2019; Association for Computing Machinery: New York, NY, USA, 2019; pp. 1–14. [Google Scholar] [CrossRef]
  87. Krueger, R.A.; Casey, M.A. Focus Groups: A Practical Guide for Applied Research; Sage Publications, Inc.: New York, NY, USA, 2014. [Google Scholar]
Figure 1. People depicted on the questionnaires (copyright free images taken from [25] with permission of the author), including older people (top four), younger people (bottom four), men (on left) and women (on right). Only one picture was included on each questionnaire.
Informatics 09 00052 g001
Figure 2. Overview of mean ratings from the ANOVA: for the groups (left); and individual ratings device_age and device_gender (right).
Informatics 09 00052 g002
Figure 3. Regression Model: What explains expertise?
Informatics 09 00052 g003
Figure 4. Design aspects mentioned: for older men (top left); older women (top right); younger men (lower left); and younger women (lower right).
Informatics 09 00052 g004
Figure 5. Overview of the opinions of computing students with regard to older people.
Informatics 09 00052 g005
Figure 6. Overview of the opinions of computing students with regard to women.
Informatics 09 00052 g006
Table 1. Implicit Target Group.
MenWomen Σ
young45.438.684.0
old5.310.716.0
Σ 50.749.3100
Publisher’s Note: MDPI stays neutral with regard to jurisdictional claims in published maps and institutional affiliations.

