2. Related Literature
Over the past two decades, educators and healthcare professionals have sought to implement lean tools in healthcare [
7,
8,
9]. Successful lean implementation depends on educating clinicians about continuous improvements in lean tools and making sure that they are part of the improvement team. Based on the revealed enablers and barriers, a comprehensive lean implementation framework was created and then used in conjunction with engineering tools in a large hospital. The results of the implementation showed a 60% reduction in cycle time, an 80% reduction in operational costs, and many other benefits [
10]. The most meaningful and, at the same time, the most counterintuitive idea is founded on the principle that it is possible to do more with less stress to the system [
11].
Hospital wards are recognized as complex systems [
12,
13]. A complex system can be defined as a set of connected components whose interactions, which are marked by circular and nonlinear causal relationships, are the main driver that generates the dynamic behavior of the system itself [
14]. The continuous evolution of events (i.e., dynamic complexity) is often characterized by different objectives and interests that, in different circumstances, may conflict with each other. In such situations, it is difficult to understand how, where, and when to operate, since most of the interventions could generate unexplained consequences [
15].
The characteristics and behavior of dynamic healthcare systems are typically generated by a large number of factors, such as the degree of connection of the relationships, the degree of nonlinearity of the relationships, the degree of system adaptability, the self-regenerative behaviors, and the complexity of the feedback structures, which show the system dependence on the previous states. It follows that in order to represent this complexity opportunely, there is need of an approach of the theory of the systems [
16]. The process of modeling and simulation is the instrument that is able to implement the “inductive” path allowing to face the complexity of the system without trivializing it.
Simulation is a particular kind of modeling of reality that allows situations or environments to be recreated for the purpose of practice, learning, evaluation, testing, or to gain understanding of human systems or actions [
17].
Hospital facilities design is among the oldest applications of simulation in healthcare [
18]. More recently, several simulation models have been proposed to address facilities’ problems. For example, Koizumi, Kuno, and Smith used a queuing model to analyze congestion processing in patient flows [
19].
An SD model was proposed to evaluate the performance of the testing center in a medical diagnostic laboratory. The aim of the research was to improve the service for patients, with the goal of reducing the average waiting time and its variability, providing a valuable contribution to the design of the testing center [
20].
The use of simulation has been widely used even by the World Health Organization, for example, in finding the best strategies to mitigate the effects of COVID-19 [
21].
Generally, increasing stakeholder engagement has a positive impact on projects, and simulation has proven to be an effective engagement tool. This suggests the value of introducing the use of facilitated workshops in hospitals [
22]. A notable gap in stakeholder engagement is the model coding phase, where a conceptual model is transformed into a simulation model [
23]. Considering the latter fact, Abdelghany and Eltawil reviewed different integrated simulation approaches used in healthcare, e.g., discrete event simulation (DES), agent-based simulation (ABS), and SD [
24]. Among these, the major advantage of using SD is that it allows for the consideration of systemic feedbacks; hence, it is particularly suitable for representing systems’ complex reinforcing dynamics. Simulation-based decision aids can often serve to produce visually clear information. This is a significant advantage given that medical and nursing staff are particularly prone to information overload [
25,
26]. Improving stakeholder health literacy can achieve positive feedback effects on a hospital’s ability to manage critical issues [
27]. For example, often physicians must decide whether to deny a needy patient access to a full ICU or create a vacancy by prematurely discharging a current occupant. In the medical literature, the influencing factors are identified, the whole patient discharge process has been described, and the consequences for the patient’s health have been analyzed. In 2020, Azcarate, Esparza, and Mallor provided a review of medical and mathematical literature on patient discharge decisions and proposed a simulation framework capable of modeling realistically the patient discharge process [
28].
In healthcare organizations, everything is affected by everything else. Therefore, there is a need to take into account both systemic complexity from a top-down point of view and detail complexity from a bottom-up point of view. The solution proposed by Brailsford, Desai, and Viana involves the construction of a hybrid model that exploits the peculiarities of the DES in order to detail the single parts of the hospital and, at the same time, using the features of the SD to build a glue substructure to represent both the environmental dynamics and the connecting relationships between the different subsystems [
29]. More specifically, the proposed model evaluated hospital performance by considering the dynamic behavior of the Chlamydia trachomatis pathogen.
Such hybrid approach between the DES and SD represents a notable first step towards the formulation of integrated modeling systems in healthcare.
Chahal, K. et al. [
30], after identifying the reasons why there is a need for hybrid simulation, defined a standard procedure for creating hybrid DES/SD simulation models in healthcare. Specifically, the proposed procedure is divided into three phases: the first one allows to identify the problem in order to understand if it is necessary to use a hybrid approach; the second phase is characterized by the separate development of DES and SD models with the purpose of identifying the interaction points between the models in order to formulate their mutual relationship; the third phase allows to investigate the interactions between the models according to the spatiotemporal coupling.
In the wake of a growing trend toward the hybridization of simulation approaches, the search for the perfect hybrid has undergone further developments with [
31], which made a comparison highlighting the main pros and cons between SD and DES in healthcare settings.
The year 2016 seems to have been a fruitful year for the effort toward hybrid models: Zulkepli and Eldabi conceptualized modeling by the use of a hybrid simulation, its advantages, and issues. That research work was focused on patient pathways within large healthcare systems and suggested when and how to implement hybrid solutions [
32]. In [
33], the hybrid approach has been used to generate cardiac ill population samples, thereby making hybrid models more and more important in healthcare; ref. [
34] provided a step-by-step simulation tutorial in real-world healthcare settings, with particular concern in privacy and security.
As the various studies and numerous applications point out, the well-established simulation philosophies that contrast the high-level holistic view of dynamically connected systems (typical of SD modelers) with the detailed “microscopic” view of individual systems (typical of DES modelers) show some clear points of contact that are progressively strengthened by the processes of “hybridization” and by the simultaneous evolution of simulation software. This evolution underlies an increasingly consolidated trend of simulation software vendors to develop DES platforms with continuous features and SD platforms with discrete features. The authors of [
35] reviewed and summarized publications related to various simulation tools in healthcare. Moreover, the paper finalized five main types of simulations, arguing that future studies should focus on developing a framework that supports a problem-based selection of simulation types.
The literature on hybrid models suggests that the integration of SD and DES is an effective and efficient solution as a decision support system. However, the framework implemented in the present work should not be intended as such a traditional approach. The discrete process is realized within the SD simulation environment itself. A previous attempt of such an approach can be traced back to [
36,
37,
38,
39,
40]. The idea, by now consolidated for the authors, is to follow the states’ evolution of the system, e.g., being time-driven, that is, recording the values of the state’s variable states at regular intervals of time. During these intervals, the events that follow are the results of dynamic relationships based on feedback control. With this paradigm, however, we are only able to control the transition from one state to the next, at each finite delta T, losing the information of the transition during one state to the next. Therefore, the state-to-state evolutionary path can be used to build differential equations in an infinitesimal dt; hence, the system’s evolution changes accordingly to the finite interval of the simulation.
Recently, the combined approach of SD and DES has been used to plan resources relative to the COVID-19 pandemic [
41], proving to be a useful and effective decisional support tool.
3. Materials and Methods
3.1. Types of Variables Used in SD
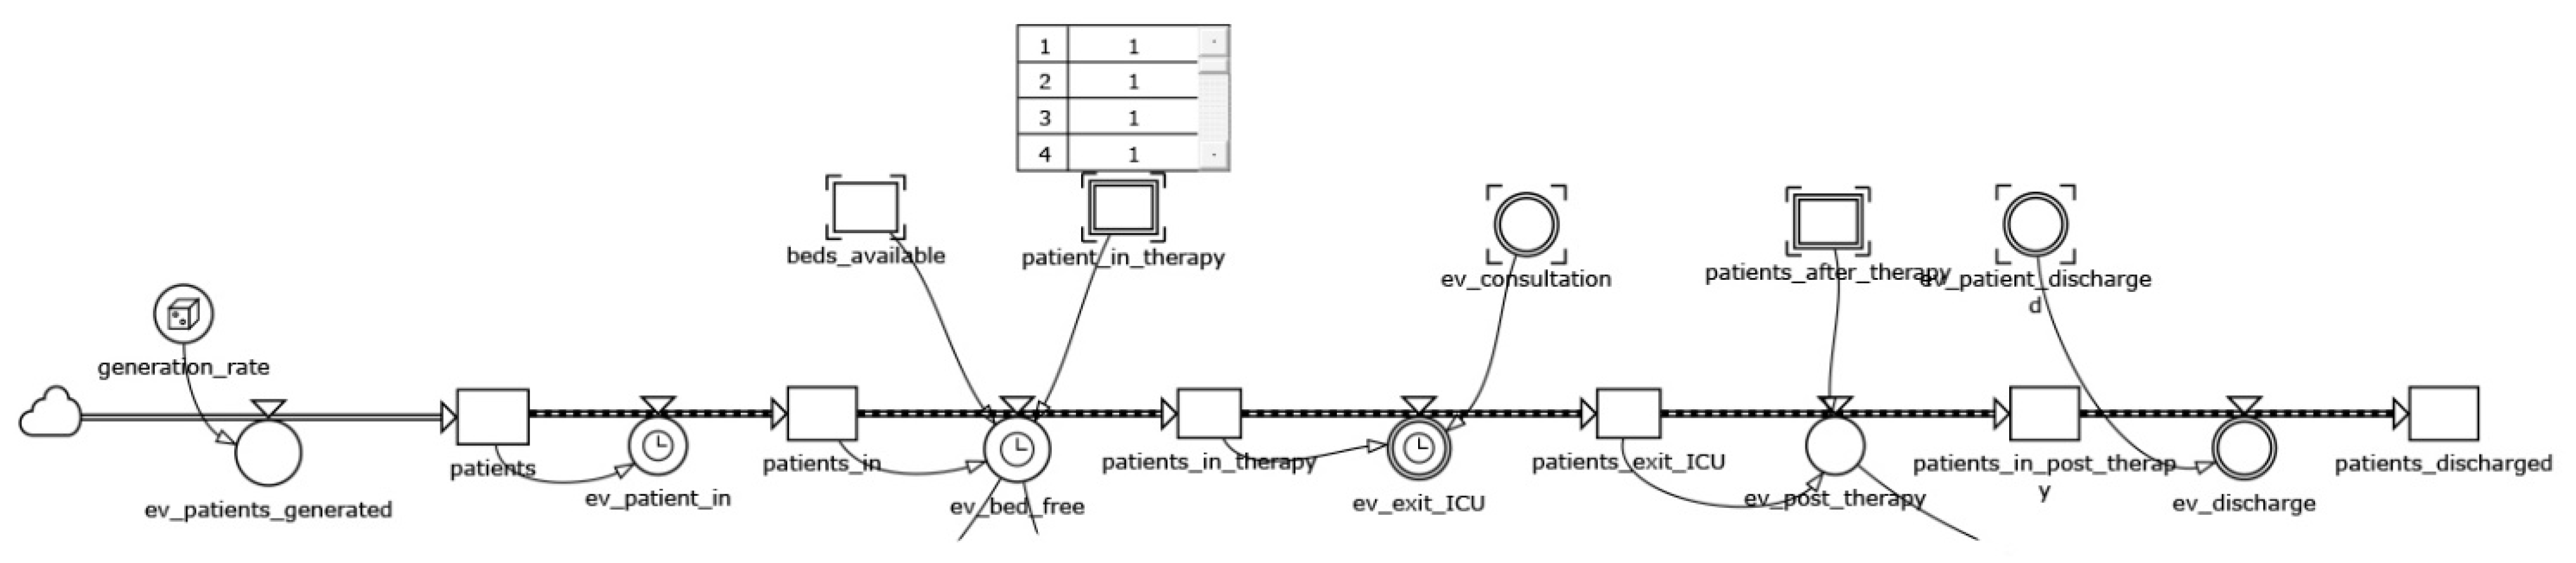
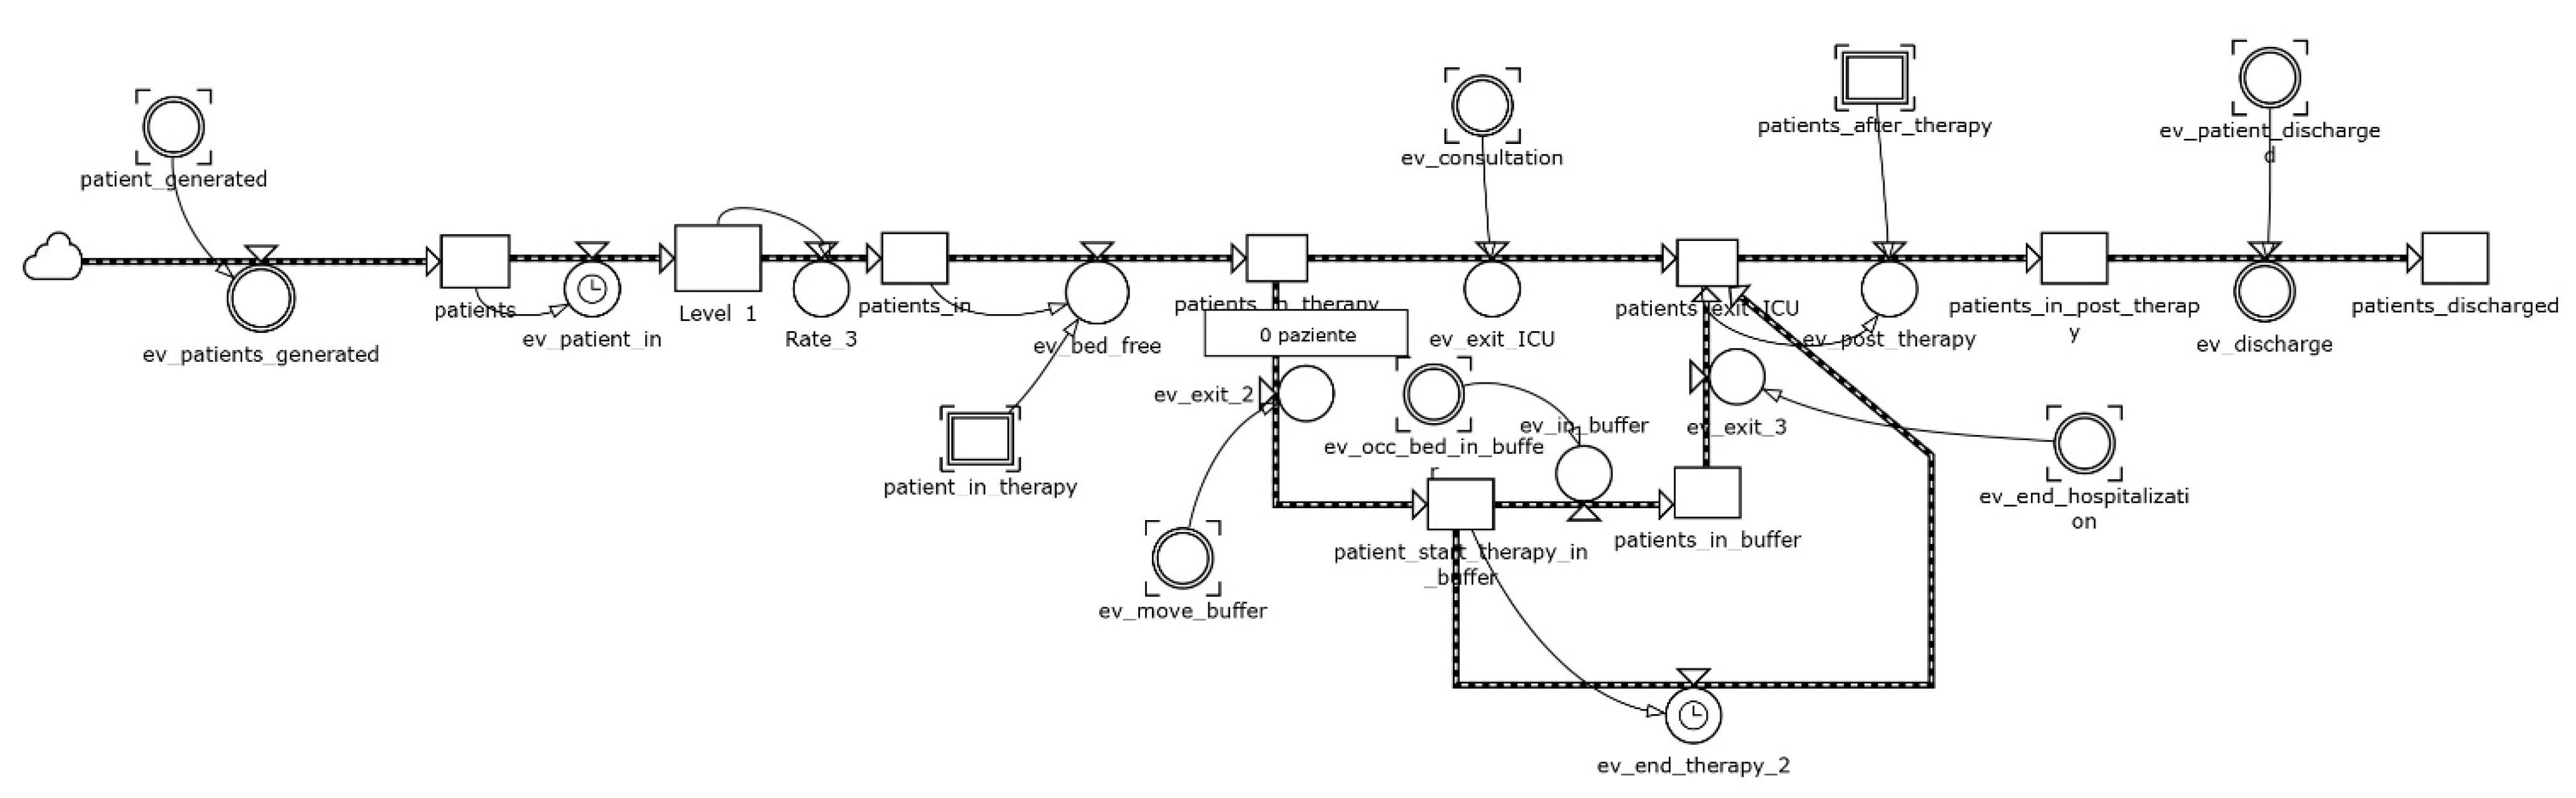
The main analogical formalism on which the SD is based is that of the bathtub. That is to say that the evolution of the states of a system can be modeled similarly to containers of finite capacity that can be filled and emptied, operating on the flow rates in input and output. A model in SD is constituted, therefore, by state variables (i.e., indicating the situation of the system in every instant) and by flow variables (i.e., concurring to modify the state of the system). Such formalism is known as the stock and flow (or level and rate) diagram, and constitutes the archetypal structure of whichever model of simulation in SD. The stocks (levels) are fundamental in order to generate the behavior in a system; the flows (rates) cause the change of the stocks. Such analogical formalism corresponds to a logical–mathematical formalism expressed in terms of differential equations.
There are three variable types used in SD: levels, which represent the system states changing over time; auxiliaries, which combine and reformulate information as it passes through the system; constants, which represent information unchanged by the simulation but that can be changed by the user through input controls.
Levels are variables with memory whose value is determined by the flow in and the flow out. At the time t, the level value is represented by the expression below, where dt is the time step of the simulation run. Levels conserve the matter that flows in and out of them.
Such a definition is used to calculate the initial value of the level variable: the value at start-up. In addition, a level contains a flow definition regarding how the flows accumulate in each time step. The flows are also controlled by other variables (one per flow) that work as flow rates. In the framework proposed below, we used a custom formalism. The level variables have been indicated with the caption in [variable_name]. In our framework, we used a custom formalism. The level variables have been indicated with the caption in [variable_name] while the flow variables are indicated with the ev [variable_name] one.
In general, there are three types of flows available in SD: continuous, discrete, and logical. If one or more flows regarding a level is continuous, the level data type must be either real or complex due to the nature of continuous flows. Otherwise, if the flow is discrete, the level can be an integer. For logical flows, both the flow rate and the level must be logical. The flows are controlled by flow rates, and when creating level-and-flow structures, it is important that the controlling flow rates and the levels match each other’s definitions (including units, data types, and dimensions). Specifically, to the proposed framework, the discrete formalism is in use. That happens since each patient outflow is implemented by associating a stochastically generated care path, hence it is discrete.
While continuous flows represent quantities being transported between levels, discrete flows represent transactions of given quantities at given times (i.e., the so-called tokens). While continuous flows are integrated over the time step (and is thus dependent of the length of the time step), discrete flows represent a quantity that is accumulated by the level of each time step (and is thus independent of the length of the time step). The expressions for continuous flows and discrete flows are shown below (as they appear in the flow expression for the connected level).
A flow is defined by two parts: the flow rate variable definition and the equation flow specified for the level variables connected to that flow. To create a discrete flow, the flow rate must use a “zero order integration setting”. The difference between “Zero Order” and “Zero Order Immediate” settings is shown in the expressions below, where L is the level and F the controlling flow rate:
The time at which the flow rate F is calculated and at which the flow is added to the level L is different.
In Zero Order, the integration is performed at the end of the time step. In Zero Order Immediate, the integration occurs at the beginning of the time step. As a consequence, the variable will only be evaluated upon the entry of the time step and stay constant for the remainder. The flow rate’s value, calculated in the current time step, is then immediately accumulated by the level, hence the name “immediate”.
When using immediate discrete flows, the value of the flow rate will remain constant over the time step. When using a zero order immediate flow, this allows us to create a structure immediately assigning a value to a level when the condition occurs.
3.3. Data Analisys and Model Validation
Data analysis was preliminary to both the construction of the simulation model, which uses stochastic functions built on the real data, and the model validation phase.
The data used were collected based on hospital reports recorded for approximately 3 years. In these reports, the access times to the ICU facilities, the types of pathologies, and, for each patient, the “exit” events from the ICU sections both towards other hospital departments and towards the exit were recorded.
In order to analyze the data, inference analyses were carried out to identify the mathematical functions that best approximate the successions of the data.
These functions make it possible to construct the phenomenon of arrivals and, for the different pathologies, the treatment services associated with the departments of the hospital structure.
The simulation model was validated by using real data collected in four ICUs (burns, neurosurgery, liver, and postoperative) of a large hospital located in South Italy. The reports analyzed referenced recorded admissions/discharges. This made it possible to identify the month in which the ICUs was most loaded, i.e., October. In addition, shared the demand rates by time slot and relative to an ordinary day of the same month, standardized operation times from intensive care protocols, and finally, the statistical distribution of length of stay based on a sample of 1563 registered admissions were collected and used to calibrate the model.
The demand rate for a typical October day was identified as a function of the hourly curve of admissions divided according to three time slots in order to obtain three Poisson generations with an appropriately summarized mean (
Table 2).
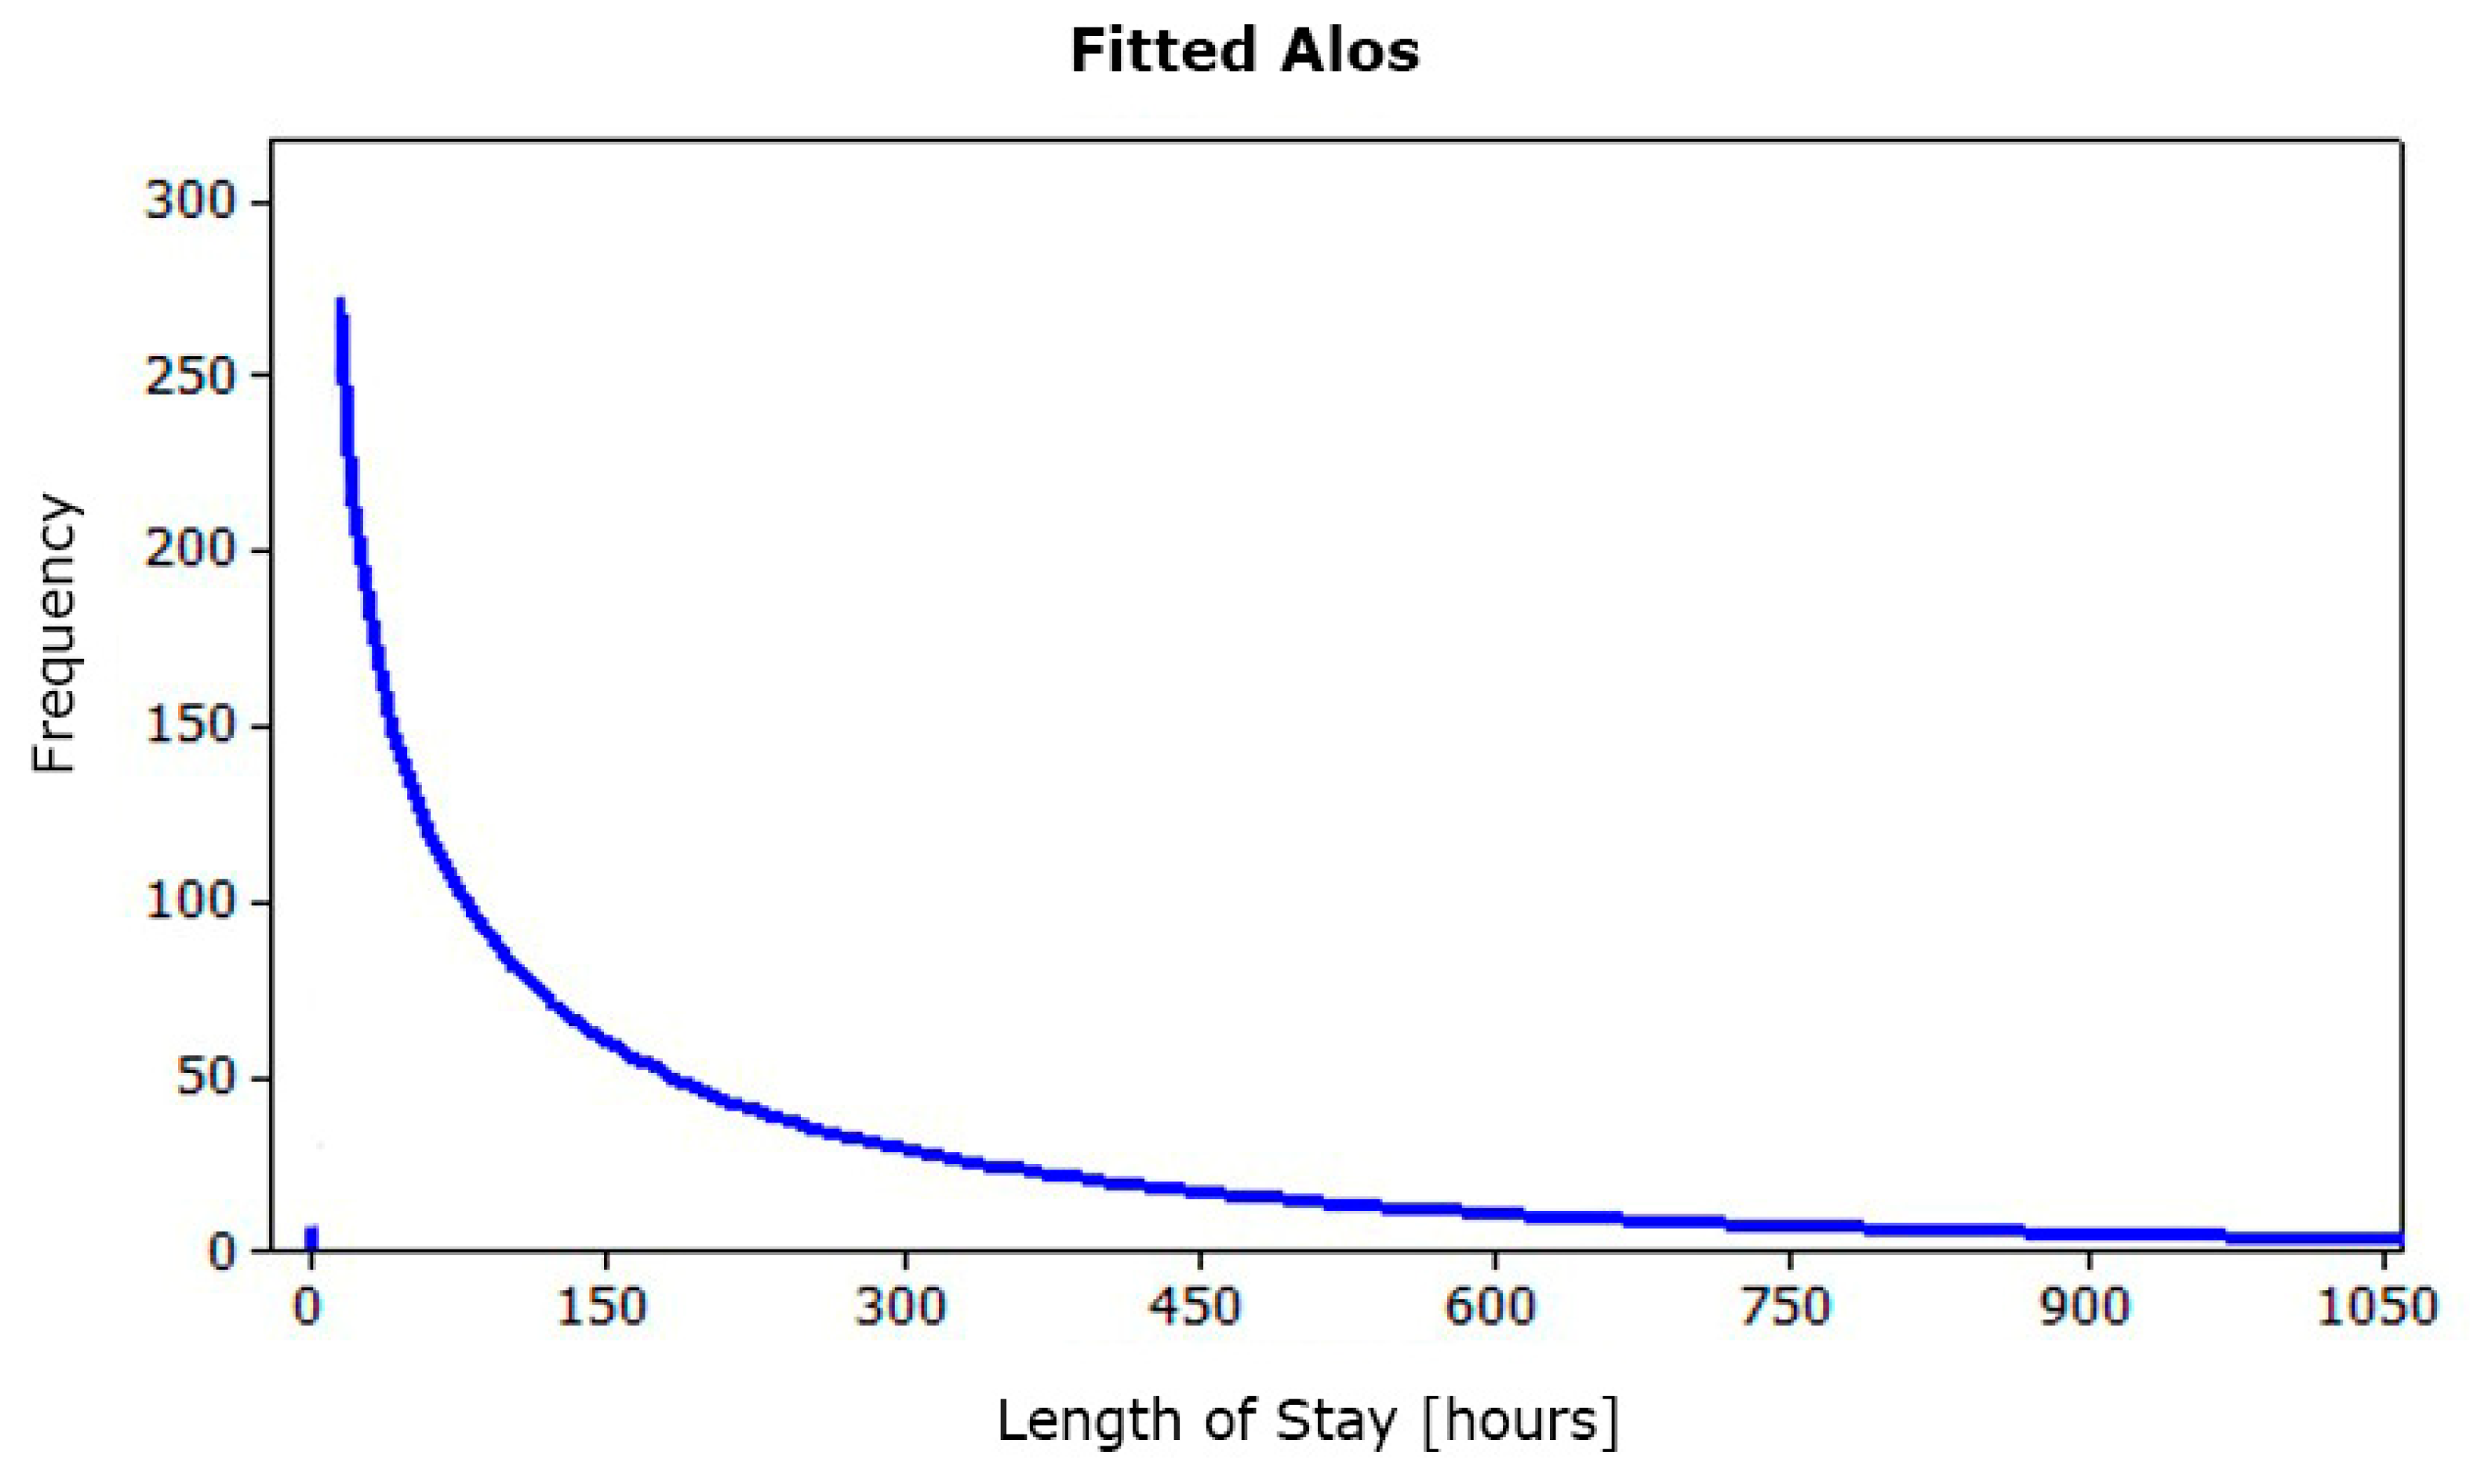
Further processing identified the statistical distribution of ALOS. The latter shows an exponential hourly trend of an average 242.85 h (
Figure 5).
Using Kelton’s formula [
42], the number of runs that allow to obtain an acceptable error with a probability of 99% is about 2870; therefore, it can be considered not affected by random input data.
Subsequently, the simulation runs have been carried out over a two-month period monitoring the output parameter inferred from the level variable patients_discharged. This result, compared with the admissions/discharge records obtained during the same time slot, totally confirms the simulation model’s validity: the simulated value (117 patients) is totally comparable to the theoretical one (122 patients) identified in the real data analysis stage.
4. Results
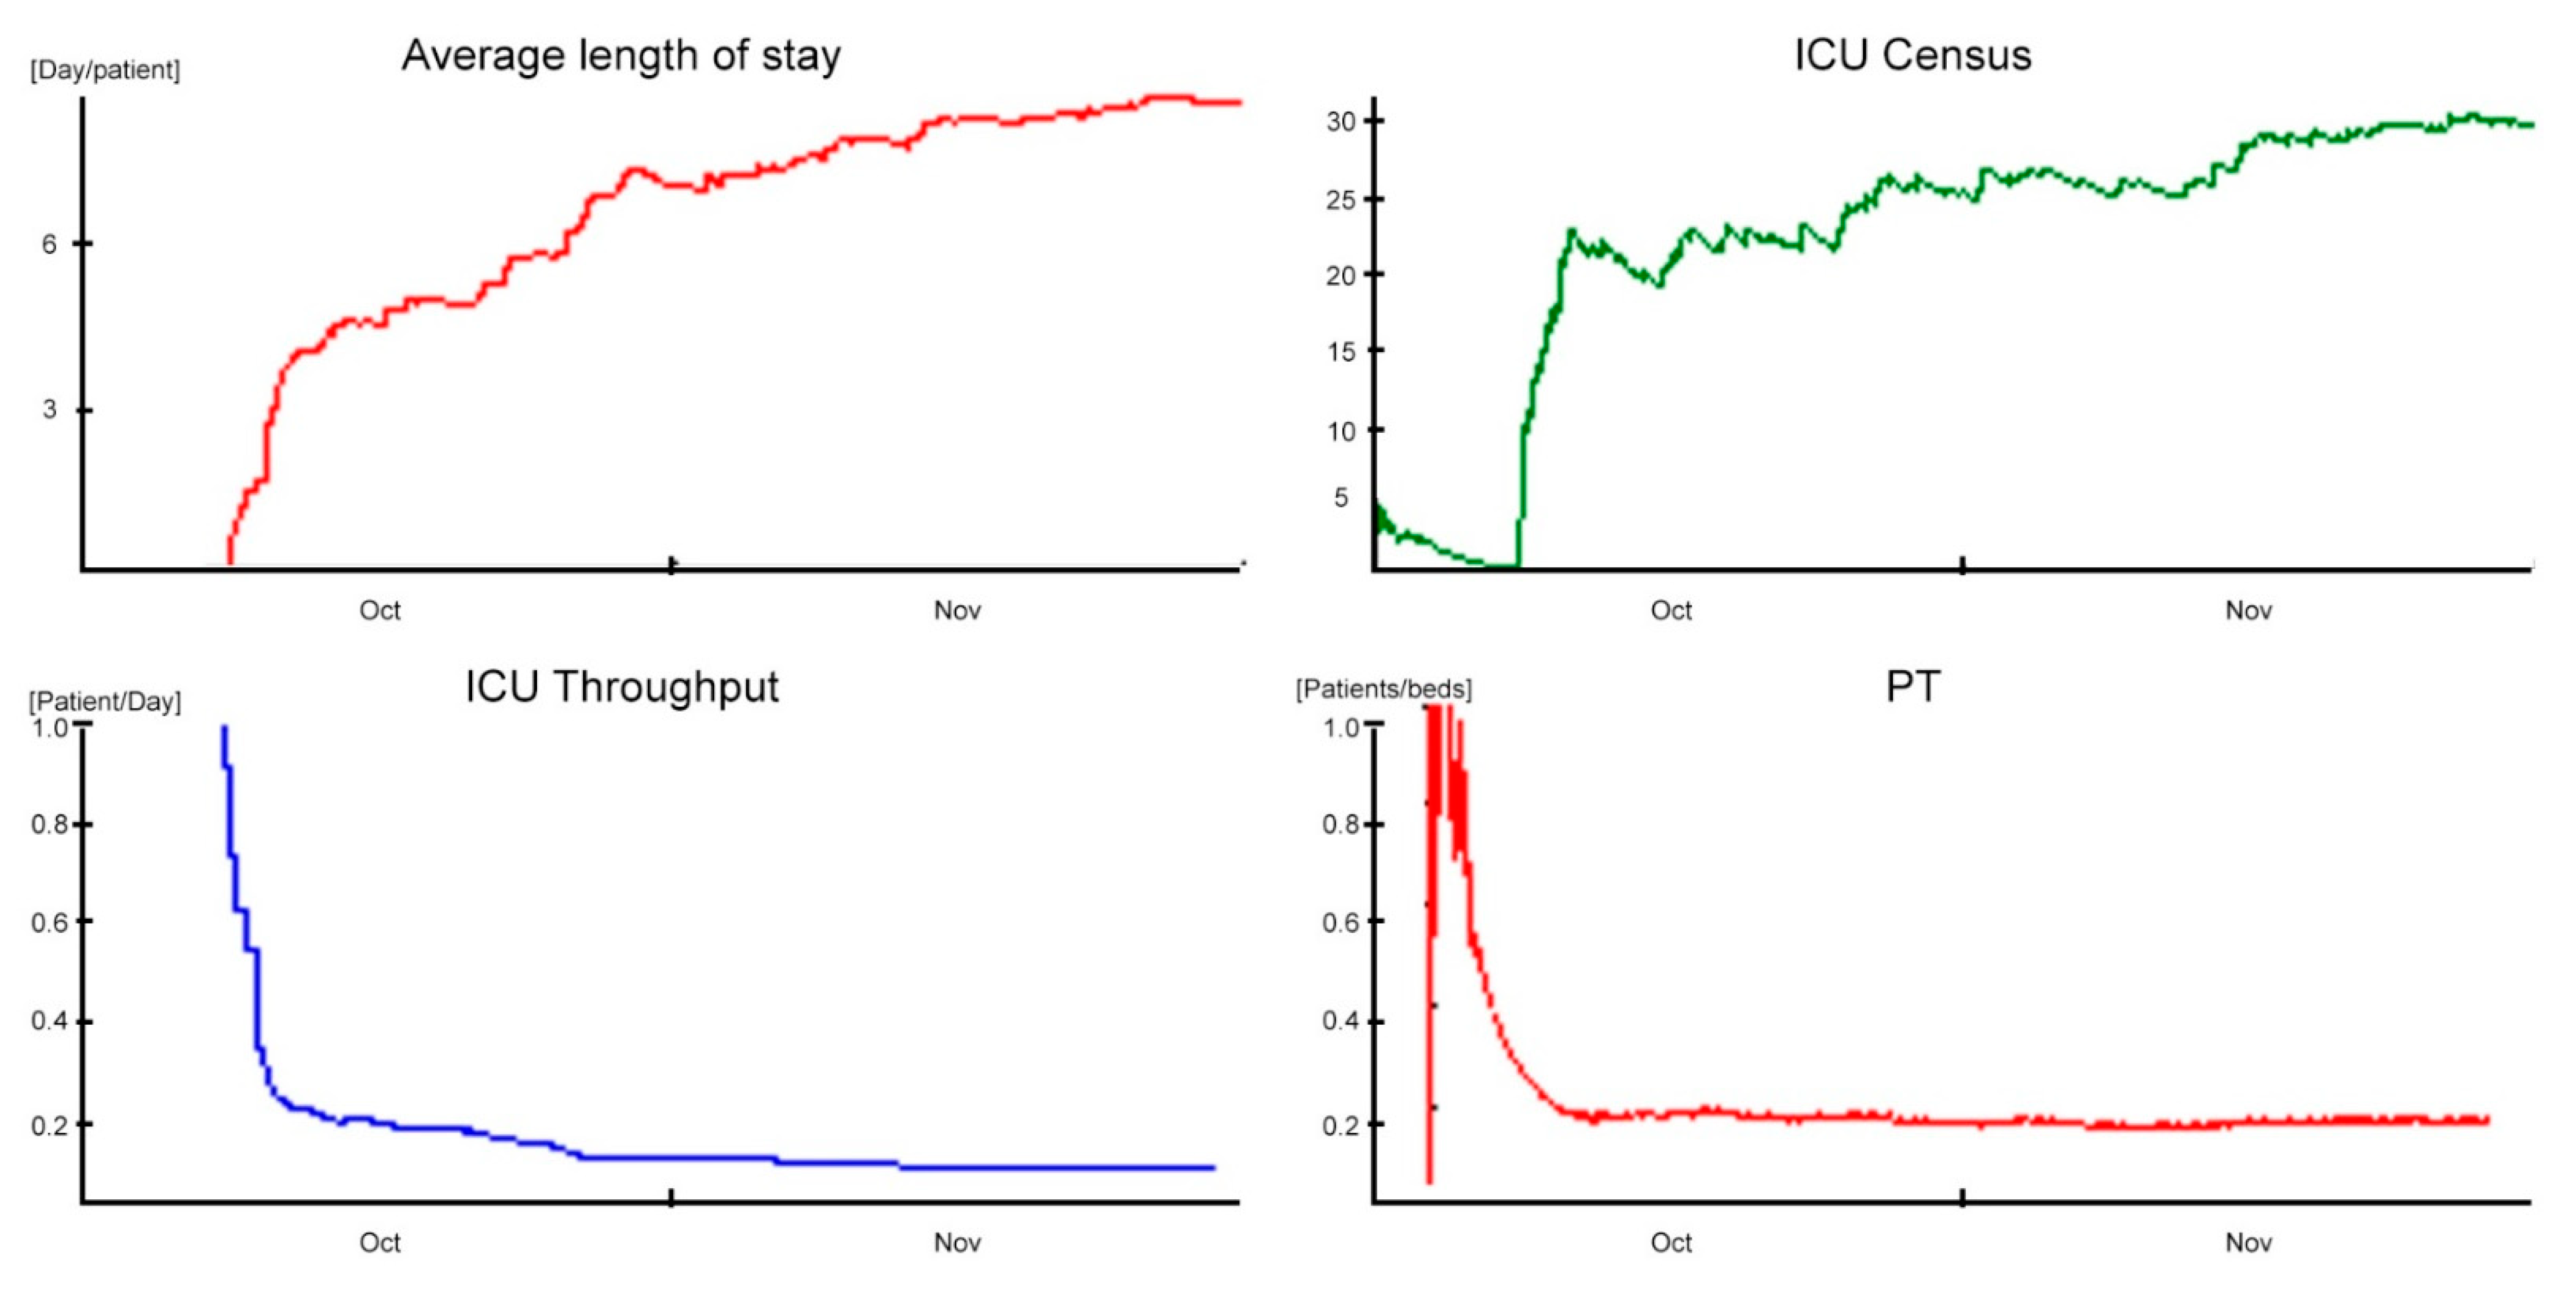
The obtained scenario of the validation phase represents the baseline of the analyzed ICU (
Figure 6). The department consists of 20 beds equally equipped to the highest level.
The one-month ALOS in simulation time stabilizes around a value of 8.5 days/patient (approximately 204 h), with a standard deviation of 7.5 days/patient (180 h).
Comparing the simulation data with those reported in the study [
43] (e.g., the ALOS equal to 7.5 patient-days and the standard deviation equal to 2.9), it shows a discrepancy of one day at the ALOS and standard deviation, respectively. In addition, the ADM equal to 2.23 patient-days and the ADD equal to 1.9 patient-days are summarized by the ICU Throughput performance indicator, which shows a decreasing trend in transient settling around a controlled value of 0.12 patient-days. The time differences and indicators just described clearly demonstrate that the ICU accepts incoming patients faster than it discharges them, consequently generating congestion problems.
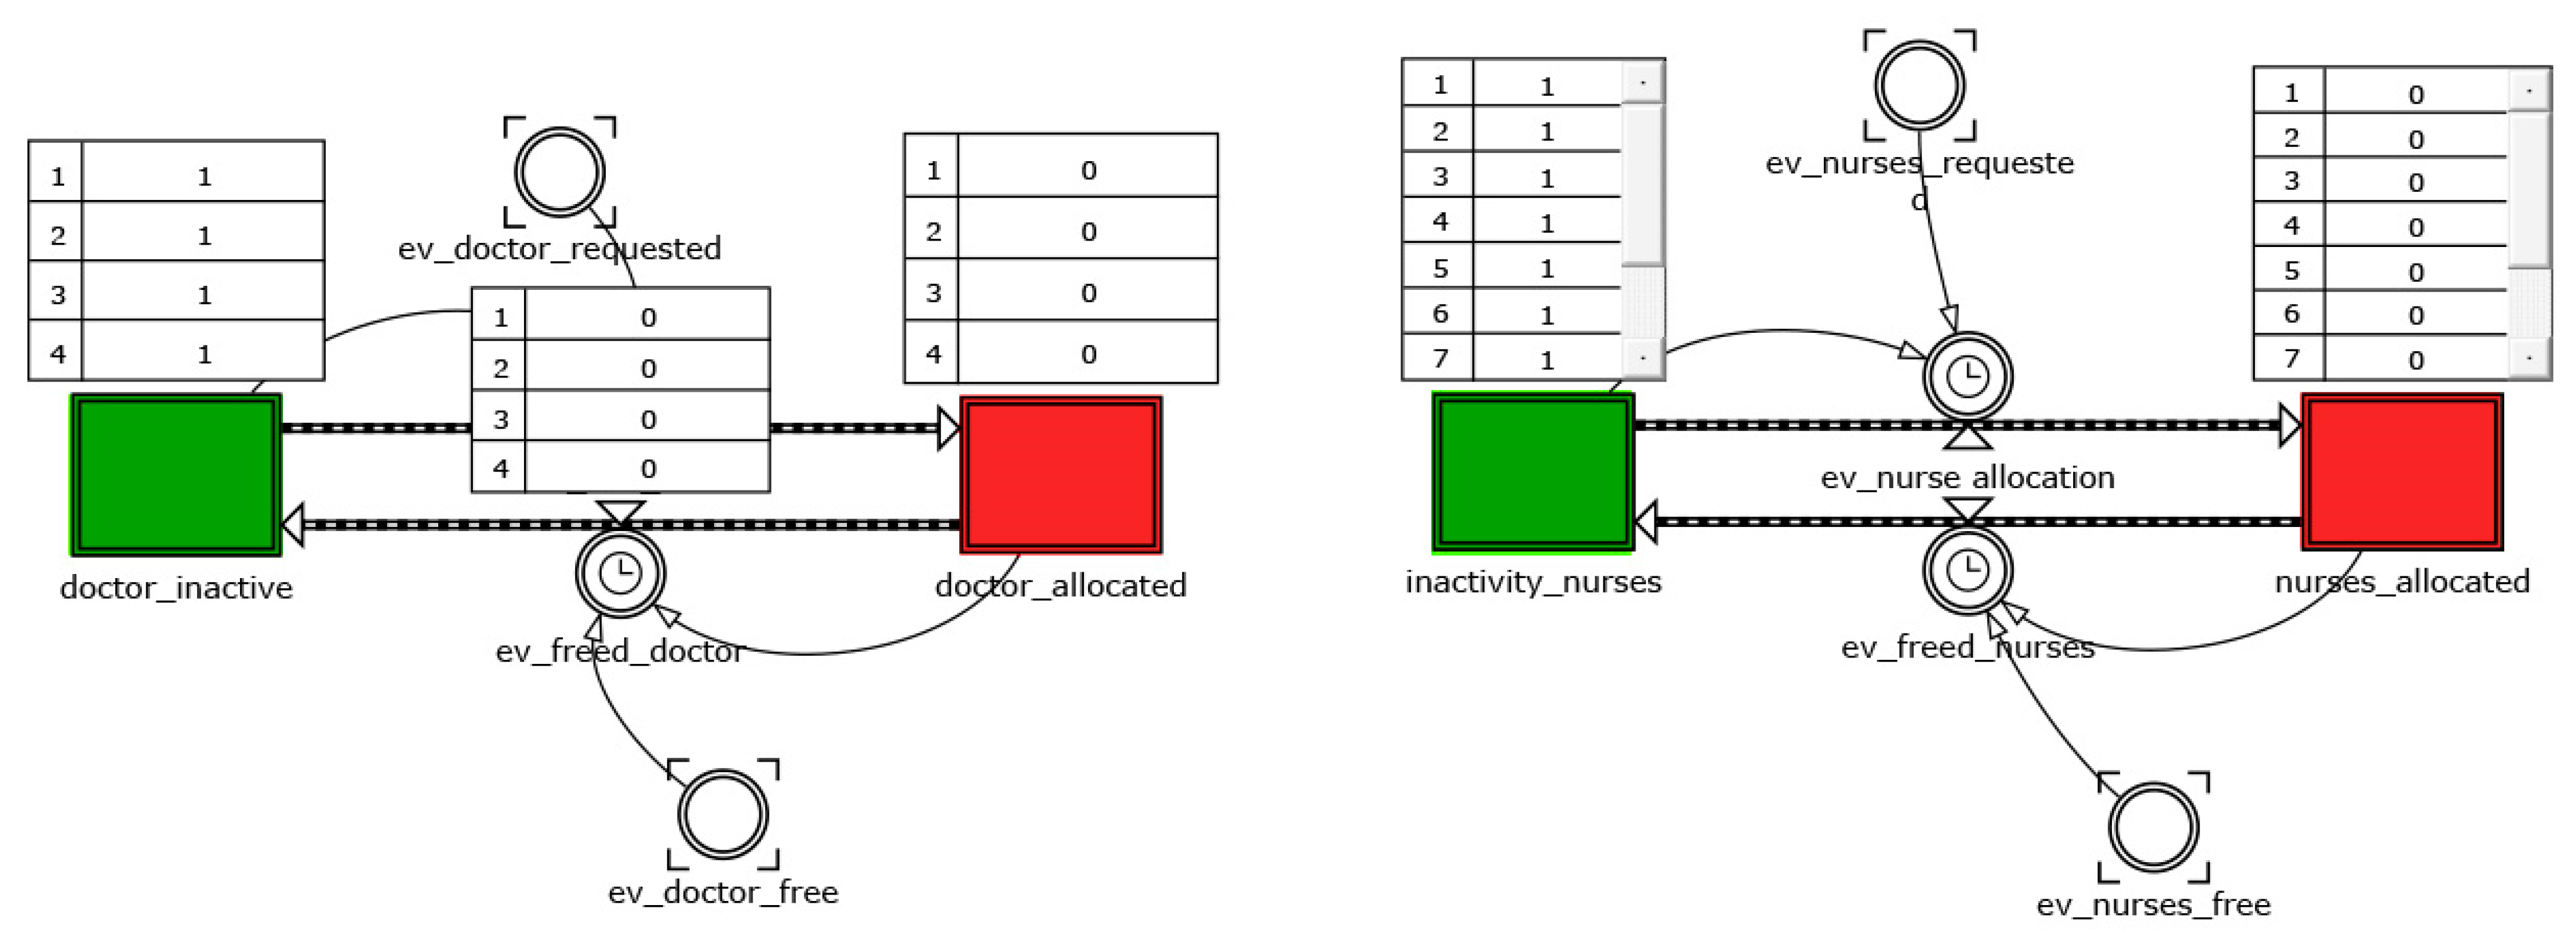
These phenomena are further justified by the low daily PT of 0.10 patients/bed and the high bed utilization (98%). The saturation sustained by the ICU was identified thanks to the ADC indicator, and influenced by the ADA and ALOS variables, is around a value of 18.9. This coefficient was used as a term of comparison between the performances in the different scenarios. Finally, with regard to staff utilization, in the time slot characterized by the highest demand for care (1:00 p.m. to 7:00 p.m.), medical and nursing staff utilization amounted to 78% and 75%, respectively, compared to ward congestion.
The simulation model fully confirms the critical problems of the department highlighted by both experts in the field and scientific publications. These problems, resulting from the combination of conflicting factors, such as the demand for intensive care and the limited availability of life support stations, can generate phenomena of congestion defined as “bed blocking” [
44].
The causes of the phenomenon are substantially two:
The delayed discharge, which occurs when patients, although clinically ready to be discharged from the ICU, cannot be transferred to inpatient wards due to bed unavailability;
The so-called nosocomial cross infection. Nosocomial or hospital infection means any disease with an infectious origin, with microbial or viral origin, clinically recognizable, lacking or incubating at the time of admission, which is acquired by patients during the hospital stay. This hazard strongly impacts hospital units from both an organizational and economic point of view. In particular, critically ill patients develop about 25% of all nosocomial infections that we can recognize in the hospital and about 90% of hospital epidemic events concern ICUs.
Both factors trigger a chain mechanism that deteriorates the ICU’s level of service, increasing the value of ALOS, decreasing the throughput of clinical activities, and, inevitably, increasing overall costs.
To reduce the aforementioned inefficiencies, the simulation model, validated on real data, has been used to build alternative scenarios with the aim of improving the system’s performances.
Below are the two, which were found to be the most effective, imagined following lean principles: the two solutions reschedule the activities and redesign in a viable way the layout, trying at the same time to minimize costs and reorganizational efforts.
4.2. Scenario 2: The “Cell Design” Infection’s Management
An additional configuration was designed to limit the effect of the bed blocking phenomena and, consequently, the extension of the recovery period. It is known to correlate with the risk of nosocomial cross-infection, which produces an increase in costs, human and economic, for people and hospital as well.
Pathogens need a vector to infect patients. The transmission vehicles most frequently involved in nosocomial infections are the hands of healthcare workers and air conditioning. It is not uncommon for antibiotic-resistant bacteria to find optimal conditions to reproduce on air conditioning filters. Consequently, in under-crowded ward conditions and a prolonged length of stay, the inpatients are exposed to a higher chance of being infected.
Taking for granted the accuracy in the execution of care practices, preventive hand cleaning and sterilization of instruments, the use of disposable equipment, and the timely detection of bacteria, a scenario has been identified in which the ICU is configured to limit the phenomena of cross-infection. The layout in this case consists of a distribution of beds that follows a cell logic: a “noninfected” cell consisting of twelve beds and an “infected” cell consisting of the remaining eight beds appropriately isolated.
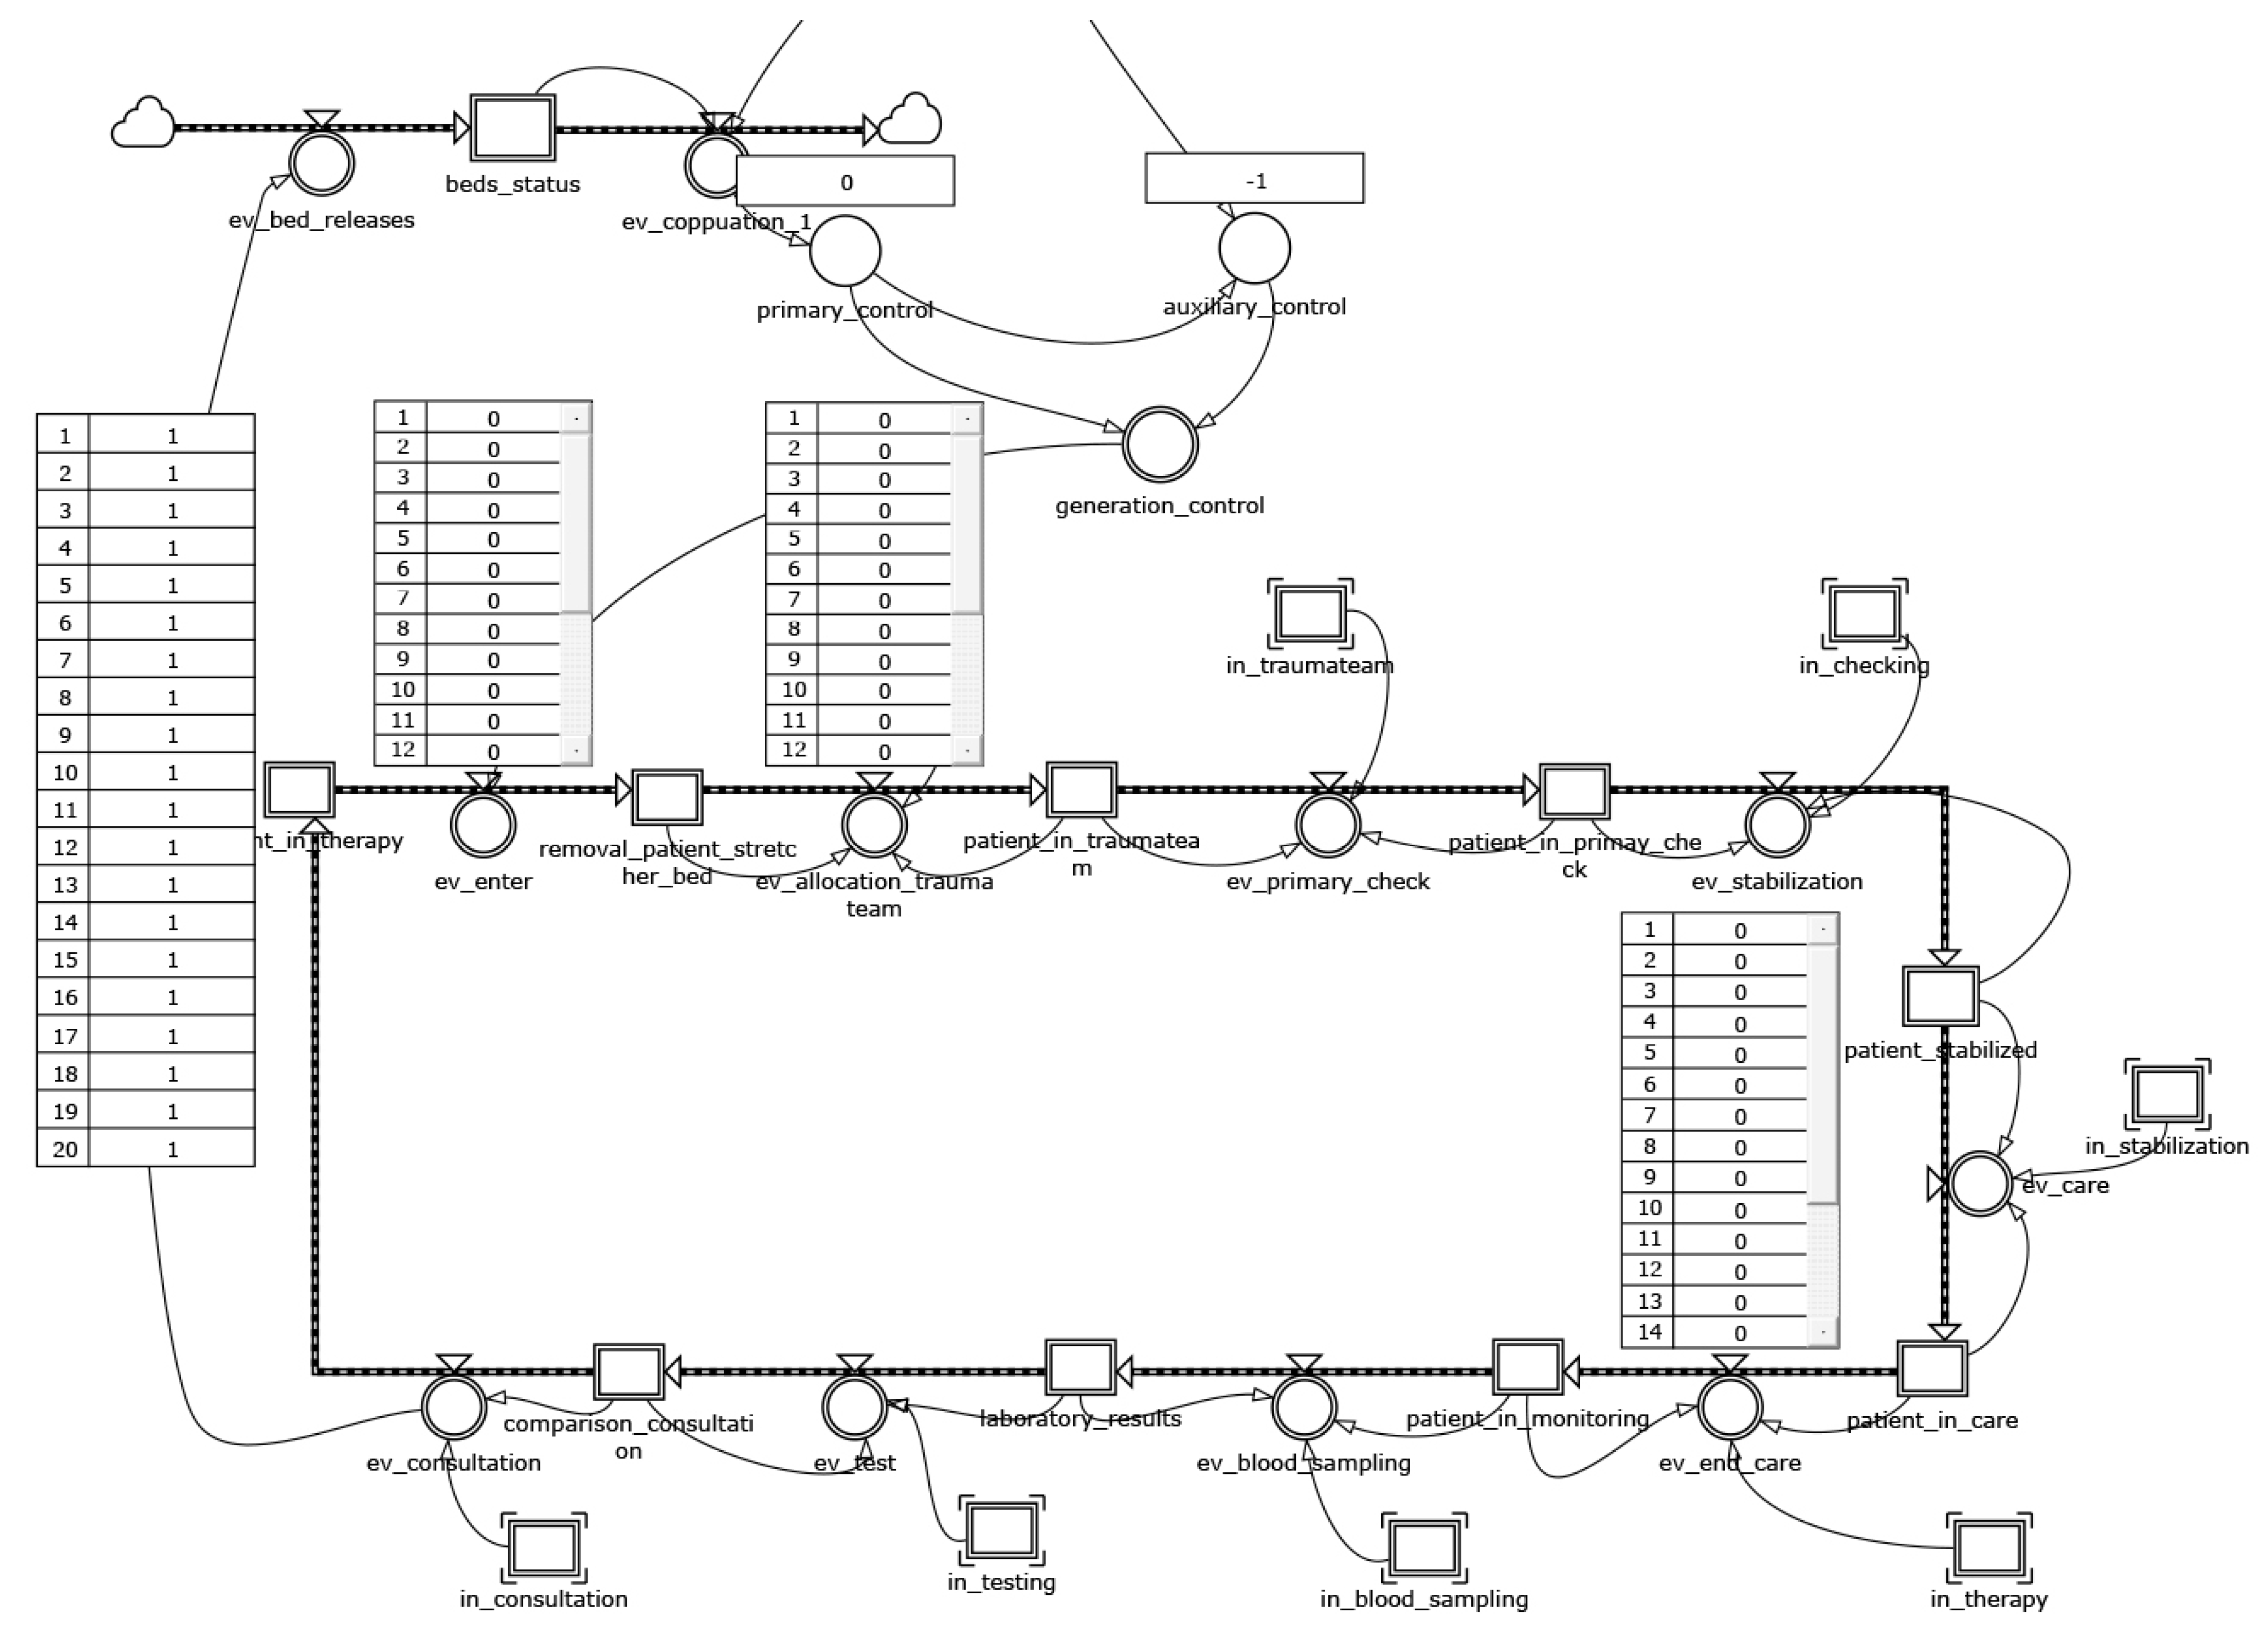
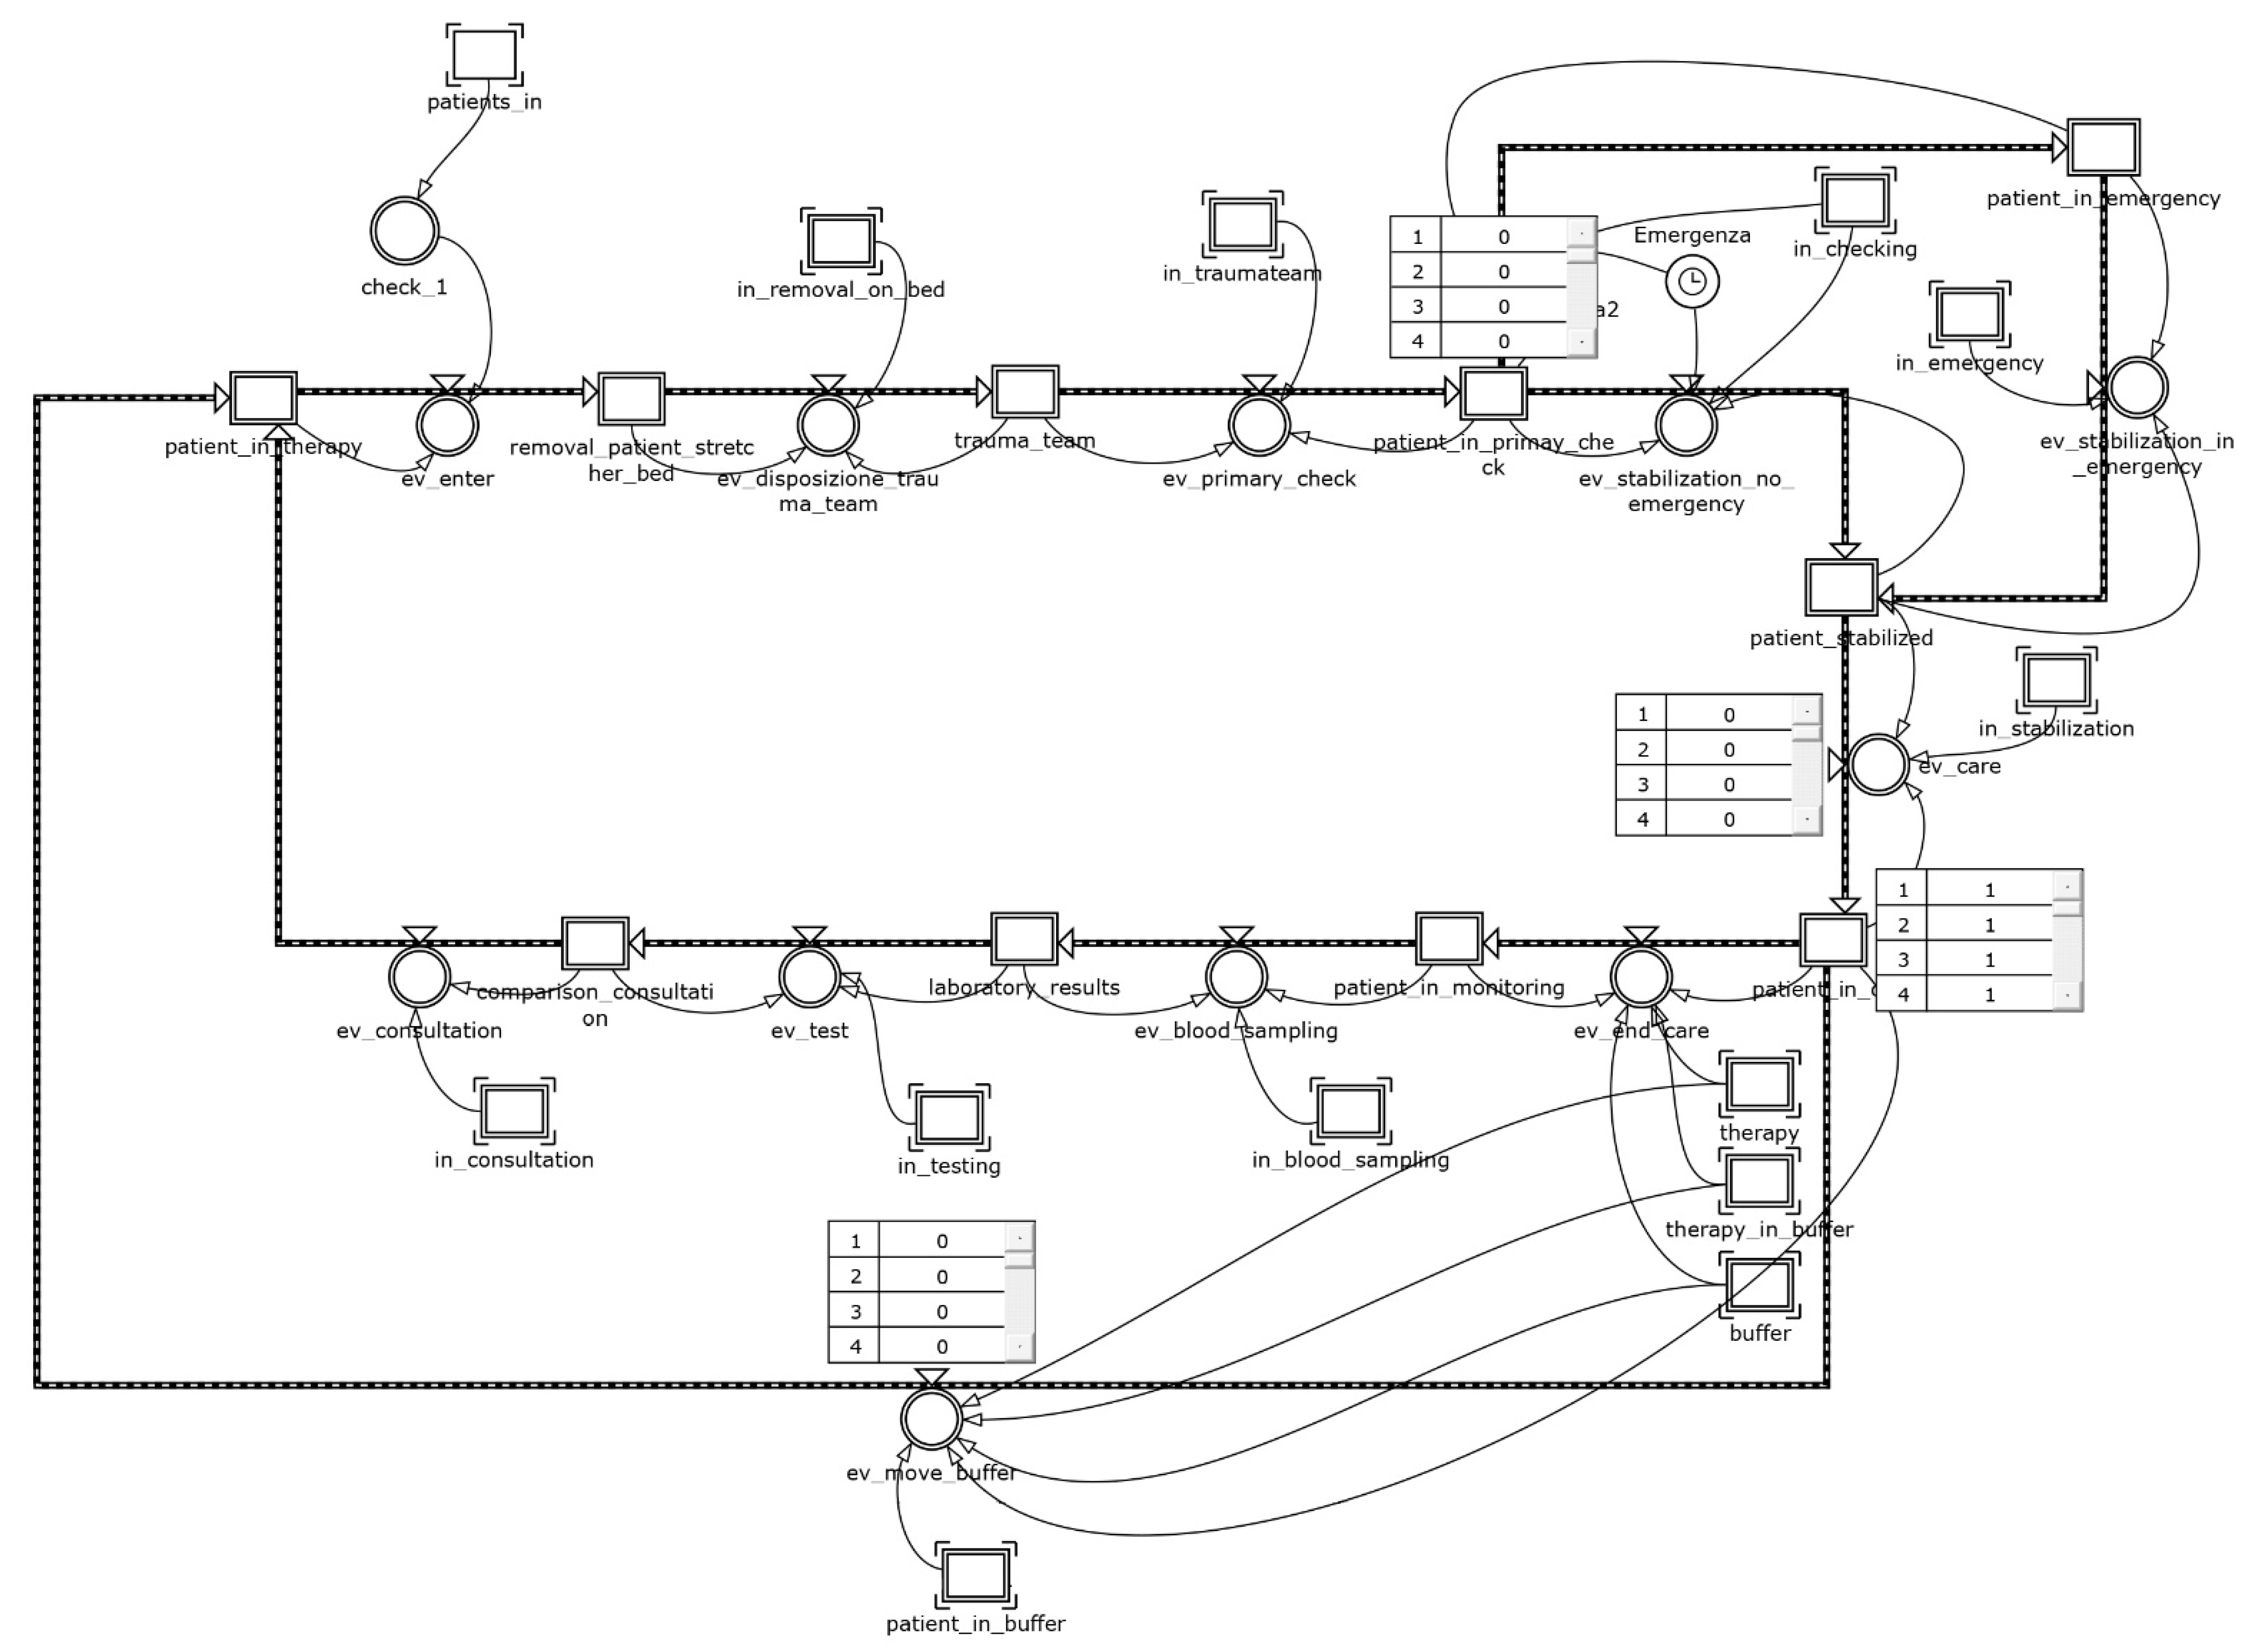
Figure 8 and
Figure 9 show, respectively, the patient and the chain of events modules for the present scenario.
The incidence referred to the inpatient stay of nosocomial cross-infected patients was obtained from data provided by the Italian Group for the Evaluation of Interventions in Intensive Care [
45], which conducted a continuous monitoring study on 133 ICUs (87.2% multifunctional, 4.5% neuro-surgical, 8.3% other) distributed on the national territory. Ten percent of patients develop at least one during hospitalization; specifically, 3% had infections on admission and during hospitalization; the remaining 7%, although not infected on admission, developed infections during recovery in the ICU. The latter fraction of patients represents the major cause of the spread of nosocomial infection in crowded conditions and is difficult to contain. Under this assumption, the condition in which patients develop infection during their inpatient stay is the most severe. With this idea in mind, it is possible to classify patients in descending order of nosocomial harm: infected patients receive greater nosocomial harm than uninfected patients; in addition, those who develop infection in the inpatient stay receive greater nosocomial harm than those who present on admission. The result of this classification gives us the incidence and mean range of ALOS by class (
Table 3).
From this, it follows that the proposed layout for the cell design scenario can efficiently manage the flow of patients. In particular, the timely isolation of the infected during admission or in the first hours of stay prevents the uncontrolled spread of nosocomial cross-infection, reducing the overall ALOS and the saturation of the department. As a result, not only does it decrease average hospitalization time, but it tends to safeguard long-term residents more. The results of the model are confirmed in research studies [
46,
47]. The implementation of preventive procedures for prompt detection of nosocomial cross-infection sentinel germs, together with the isolation of infected patients, allows to move from the baseline scenario with an exponential hospitalization with an average of 9–10 days (totally in accordance with the data) to a final scenario in which uninfected patients have an average hospitalization of 3 days and infected patients have an average hospitalization of 34 days. In detail, the patient module is realized using a 2 × 1 array, whose first row represents the infected cells and the second one the not-infected ones. A submodule was prepared to share a time slot generation according to a percentage of 10% on the first cell and of 90% on the second one; then, for the two cells, a treatment time of 34 and 3 days, respectively, was set. With this refinement, the results show further improvements for the ALOS (6.32 days/patient), with a reduction of 16% compared to the posthospitalization buffer scenario (
Figure 10).
ADM and ADD do not seem affected by such improvements, remaining quite unchanged (3.33 patients/day and 3 patients/day, respectively); the ICU throughput increases to 23% (0.16 patients/day). ADC indicator amounts to 21.04 and shows a lower value of saturation than the one obtained in the posthospitalization buffer scenario.
The improvements in the cell design scenario are even more evident when looking at the PT indicator, which reaches an average value equal to 0.14 patients/bed, and it shows an increase of 70% in comparison with the baseline.
Table 4 summarizes the performances in the different scenarios.
5. Conclusions
This research paper explored the use of SD in the evaluation and management of discrete systems by proposing a framework suitable for hospital departments. In particular, the framework modifies the classical model by introducing the zero order immediate approach. Moreover, both the macroscopic aspects (traditionally associated to the SD) and the microsimulative ones (usually faced with discrete-event techniques) have been integrated in the proposed framework. Concerning the model tailored to the case study and implemented on arrays pertaining to the care pathway, it faithfully reproduces the behavior of the real twin department, offering management decision support. The use of lean principles has been shown to produce improvement scenarios with immediate benefits at a low implementation cost, such as the dynamic reconfiguration through cell-based design for the management of patients who develop nosocomial cross-infection.
Unfortunately, SD offers few building blocks for the detailed description of systems; consequently, it is only possible to account for complex internal relationships at the price of elaborate micromodeling structures (e.g., arrays). The worst consequence is that you get models that are not immediately readable, especially for those not accustomed to such an approach. We believe that these shortcomings are abundantly counterbalanced by the advantageous possibility of implementing different feedback logics—thus, inherently systemic and possibly nonlinear—in the modeling.
The model has been implemented in Powersim, a choice that, in our opinion, allows a certain freedom of maneuver in the design of the models. This freedom of expression is paid for by an excessively large number of level and flow variables. However, the results of the analysis are well generalizable given the independence of the integration step at which the system is updated. Independence from update status also implies independence of results from the particular software employed.
The framework, per se, with minimal adjustments, can produce models capable of describing other hospital departments. It follows that the repeated application of such modular framework allows, in principle, to model an entire healthcare infrastructure. With more redesign effort instead, you can certainly transfer it to other application domains.
Finally, the proposed tool allows the classification of patients, and associated medical procedures, through a cell design. Although it was designed for the management of nosocomial cross infection, without any imaginative effort, it can replicate for other infectious diseases, such as COVID-19 or the next pandemic threat.
The impact on COVID-19 of this model can be identified in the ability to manage the critical infrastructure/components of a hospital system, to withstand the pressure of an increasing number of infected patients who require their use. In Scenario 2, the “Cell Design” infection’s management analyzes what the benefit of a cell layout is, with the realization of an isolated ward for the quarantines imposed by infectious viruses. The benefit is measured in terms of improvements on the crossing time of patients affected by cross-infection compared to the case of a classic layout with patients sharing the same space. The layout in cells can reduce, due to isolation, the cross-infection, decreasing the transmissibility of the disease and increasing the healing time.
Therefore, the use of the framework is configured as a decision support to re-engineer the layout of critical hospital departments, thus improving the effectiveness of care.
Author Contributions
Conceptualization, E.R. and A.F.; methodology, E.R.; validation, C.R.; formal analysis, C.R.; resources, A.C.C.; data curation, A.C.C. and A.F.; writing—original draft preparation, A.C.C.; writing—review and editing, A.F. and E.R.; visualization, A.F.; supervision, C.R.; project administration, C.R. All authors have read and agreed to the published version of the manuscript.
Funding
This research received no external funding.
Institutional Review Board Statement
Not applicable.
Informed Consent Statement
Informed consent was obtained from all subjects involved in the data collection.
Data Availability Statement
Due to the nature of this research, participants of this study did not agree for their data to be shared publicly, so supporting data is not available.
Acknowledgments
The authors would like to thank the physicians and nurses whose valuable contributions made this research possible.
Conflicts of Interest
The authors declare no conflict of interest.
References
- Rocha, A.; Costa, A.S.; Figueira, J.R.; Ferreira, D.C.; Marques, R.C. Quality assessment of the Portuguese public hospitals: A multiple criteria approach. Omega 2021, 105, 102505. [Google Scholar] [CrossRef]
- Shander, A.; Fleisher, L.A.; Barie, P.S.; Bigatello, L.M.; Sladen, R.N.; Watson, C.B. Clinical and economic burden of postoperative pulmonary complications: Patient safety summit on definition, risk-reducing interventions, and preventive strategies. Crit. Care Med. 2011, 39, 2163–2172. [Google Scholar] [CrossRef] [PubMed]
- Askari, M.; Klaver, N.S.; van Gestel, T.J.; van de Klundert, J. Intention to use Medical Apps Among Older Adults in the Netherlands: Cross-Sectional Study. J. Med. Internet Res. 2020, 22, e18080. [Google Scholar] [CrossRef] [PubMed]
- Schiza, E.C.; Neokleous, K.C.; Petkov, N.; Schizas, C.N. A patient centered electronic health: EHealth system development. Technol. Health Care 2015, 23, 509–522. [Google Scholar] [CrossRef]
- Marsilio, M.; Pisarra, M.; Rubio, K.; Shortell, S. Lean adoption, implementation, and outcomes in public hospitals: Benchmarking the US and Italy health systems. BMC Health Serv. Res. 2022, 22, 122. [Google Scholar] [CrossRef]
- Klevens, R.M.; Edwards, J.R.; Richards, C.L., Jr.; Horan, T.C.; Gaynes, R.P.; Pollock, D.A.; Cardo, D.M. Estimating health care-associated infections and deaths in U.S. Hospitals, 2002. Public Health Rep. 2007, 122, 160–166. [Google Scholar] [CrossRef]
- Wickramasinghe, N.; Al-Hakim, L.; Gonzalez, C.M.; Tan, J. Lean Thinking for Healthcare; Springer: New York, NY, USA, 2014; ISBN 9781461480365. [Google Scholar]
- Souza, D.L.; Korzenowski, A.L.; Alvarado, M.M.; Sperafico, J.H.; Ackermann, A.E.F.; Mareth, T.; Scavarda, A.J. A systematic review on lean applications’ in emergency departments. Healthcare 2021, 9, 763. [Google Scholar] [CrossRef]
- Gabow, P.A.; Goodman, P.L. The lean prescription: Powerful medicine for our ailing healthcare system. In The Lean Prescription: Powerful Medicine for Our Ailing Healthcare System; CRC Press, Taylor & Francis: Boca Raton, FL, USA, 2014; pp. 1–155. ISBN 9781482246391. [Google Scholar]
- Abdallah, A.A. Healthcare Engineering: A Lean Management Approach. J. Healthc. Eng. 2020, 2020, 8875902. [Google Scholar] [CrossRef]
- Browning, T.R.; de Treville, S. A lean view of lean. J. Oper. Manag. 2021, 67, 640–652. [Google Scholar] [CrossRef]
- Benson, H. Chaos and complexity: Applications for healthcare quality and patient safety. J. Healthc. Qual. 2005, 27, 4–10. [Google Scholar] [CrossRef]
- Zimmerman, B. How Complexity Science Is Transforming Healthcare. In The SAGE Handbook of Complexity and Management; SAGE: London, UK, 2011; ISBN 9781446201084. [Google Scholar]
- Sugihara, G.; May, R.; Ye, H.; Hsieh, C.H.; Deyle, E.; Fogarty, M.; Munch, S. Detecting causality in complex ecosystems. Science 2012, 338, 496–500. [Google Scholar] [CrossRef] [PubMed]
- Cinaroglu, S. Complexity in healthcare management: Why does Drucker describe healthcare organizations as a double-headed monster? Int. J. Healthc. Manag. 2016, 9, 11–17. [Google Scholar] [CrossRef]
- Engelseth, P.; White, B.E.; Mundal, I.; Eines, T.F.; Kritchanchai, D. Systems modelling to support the complex nature of healthcare services. Health Technol. 2021, 11, 193–209. [Google Scholar] [CrossRef]
- Zeigler, B.P.; Muzy, A.; Kofman, E. Theory of Modeling and Simulation: Discrete Event & Iterative System Computational Foundations; Academic Press: London, UK, 2018; ISBN 9780128134078. [Google Scholar]
- Kennedy, O.G. The use of computer simulation in health care facility design. In Proceedings of the Winter Simulation Conference, San Francisco, CA, USA, 17–19 January 1973; pp. 172–198. [Google Scholar]
- Koizumi, N.; Kuno, E.; Smith, T.E. Modeling patient flows using a queuing network with blocking. Health Care Manag. Sci. 2005, 8, 49–60. [Google Scholar] [CrossRef] [PubMed] [Green Version]
- Rohleder, T.R.; Bischak, D.P.; Baskin, L.B. Modeling patient service centers with simulation and system dynamics. Health Care Manag. Sci. 2007, 10, 1–12. [Google Scholar] [CrossRef]
- Currie, C.S.M.; Fowler, J.W.; Kotiadis, K.; Monks, T.; Onggo, B.S.; Robertson, D.A.; Tako, A.A. How simulation modelling can help reduce the impact of COVID-19. J. Simul. 2020, 14, 83–97. [Google Scholar] [CrossRef] [Green Version]
- Ozkaynak, M.; Sircar, C.M.; Frye, O.; Valdez, R.S. A systematic review of design workshops for health information technologies. Informatics 2021, 8, 34. [Google Scholar] [CrossRef]
- Naumann, R.B.; Guynn, I.; Clare, H.M.; Lich, K.H. Insights from system dynamics applications in addiction research: A scoping review. Drug Alcohol Depend. 2022, 231, 109237. [Google Scholar] [CrossRef]
- Abdelghany, M.; Eltawil, A.B. Linking approaches for multi-methods simulation in healthcare systems planning and management. Int. J. Ind. Syst. Eng. 2017, 26, 275–290. [Google Scholar] [CrossRef]
- Patriarca, R.; Falegnami, A.; Bilotta, F. Embracing simplexity: The role of artificial intelligence in peri-procedural medical safety. Expert Rev. Med. Devices 2019, 16, 77–79. [Google Scholar] [CrossRef]
- Abdullah, S.S.; Rostamzadeh, N.; Sedig, K.; Garg, A.X.; McArthur, E. Visual analytics for dimension reduction and cluster analysis of high dimensional electronic health records. Informatics 2020, 7, 17. [Google Scholar] [CrossRef]
- Ola, O.; Sedig, K. Health literacy for the general public: Making a case for non-trivial visualizations. Informatics 2017, 4, 33. [Google Scholar] [CrossRef] [Green Version]
- Azcarate, C.; Esparza, L.; Mallor, F. The problem of the last bed: Contextualization and a new simulation framework for analyzing physician decisions. Omega 2020, 96, 102120. [Google Scholar] [CrossRef]
- Brailsford, S.C.; Desai, S.M.; Viana, J. Towards the holy grail: Combining system dynamics and discrete-event simulation in healthcare. In Proceedings of the Winter Simulation Conference, Baltimore, ML, USA, 5–8 December 2010; pp. 2293–2303. [Google Scholar]
- Chahal, K.; Eldabi, T.; Young, T. A conceptual framework for hybrid system dynamics and discrete event simulation for healthcare. J. Enterp. Inf. Manag. 2013, 26, 50–74. [Google Scholar] [CrossRef]
- Gönül-Sezer, E.D.; Ocak, Z. Comparison of System Dynamics and Discrete Event Simulation Approaches. In Simulation and Modeling Methodologies, Technologies and Applications; Springer: London, UK, 2016; Volume 442, ISBN 9783319312941. [Google Scholar]
- Zulkepli, J.; Eldabi, T. Towards a framework for conceptual model hybridization in healthcare. In Proceedings of the Winter Simulation Conference, Washington, DC, USA, 11–14 December 2016; Volume 2016, pp. 1597–1608. [Google Scholar]
- Mielczarek, B.; Zabawa, J. Modeling healthcare demand using a hybrid simulation approach. In Proceedings of the Winter Simulation Conference, Washington, DC, USA, 11–14 December 2016; pp. 1535–1546. [Google Scholar]
- Alvarado, M.; Lawley, M.; Li, Y. Healthcare simulation tutorial: Methods, challenges, and opportunities. In Proceedings of the Winter Simulation Conference, Washington, DC, USA, 11–14 December 2016; pp. 236–247. [Google Scholar]
- Nawawi, M.K.M.; Zulkepli, J.; Khalid, R.; Abidin, N.Z. Modeling in Healthcare: Selection of Simulation Types. Univers. J. Public Health 2021, 9, 401–409. [Google Scholar] [CrossRef]
- Romano, E.; Assante, D. A Management of Intensive Care Unit based on the System Dynamics Model. In Proceedings of the 5th International Conference on Applied Economics, Business and Development, Chania, Greece, 27–29 August 2013. [Google Scholar]
- Romano, E.; Santillo, L.C.; Zoppoli, P. Transformation of a production/assembly washing machine lines into a lean manufacturing system. WSEAS Trans. Syst. Control 2009, 4, 65–76. [Google Scholar]
- Murino, T.; Naviglio, G.; Romano, E. Optimal size of kanban board in a single stage multi product system. WSEAS Trans. Syst. Control 2010, 5, 464–473. [Google Scholar]
- Romano, E.; Guizzi, G.; Chiocca, D. A decision support tool, implemented in a system dynamics model, to improve the effectiveness in the hospital emergency department. Int. J. Procure. Manag. 2015, 8, 141–168. [Google Scholar] [CrossRef] [Green Version]
- Romano, E.; Iuliano, D. A simulation/optimisation approach to support the resource allocation in service firms. Int. J. Procure. Manag. 2018, 11, 53–75. [Google Scholar] [CrossRef]
- Garcia-Vicuña, D.; Esparza, L.; Mallor, F. Hospital preparedness during epidemics using simulation: The case of COVID-19. Cent. Eur. J. Oper. Res. 2022, 30, 213–249. [Google Scholar] [CrossRef]
- Kelton, W.D. Simulation with Arena; Zupick, N.B., Ed.; McGraw-Hill Education: New York, NY, USA, 2015; ISBN 0073401315. [Google Scholar]
- Bertolini, G.; Rossi, C.; Brazzi, L.; Radrizzani, D.; Rossi, G.; Arrighi, E.; Simini, B. The relationship between labour cost per patient and the size of intensive care units: A multicentre prospective study. Intensive Care Med. 2003, 29, 2307–2311. [Google Scholar] [CrossRef] [PubMed]
- Zulkepli, J.; Eldabi, T.; Mustafee, N. Hybrid simulation for modelling large systems: An example of integrated care model. In Proceedings of the 2012 Winter Simulation Conference (WSC), Berlin, Germany, 9–12 December 2012; pp. 1–12. [Google Scholar]
- Boffelli, S.; Rossi, C.; Anghileri, A.; Giardino, M.; Carnevale, L.; Messina, M.; Neri, M.; Langer, M.; Bertolini, G.; Marco, A.; et al. Continuous quality improvement in intensive care medicine. The GiViTI Margherita Project-Report 2005. Minerva Anestesiol. 2006, 72, 419–432. [Google Scholar] [PubMed]
- Kharaba, A.; Algethamy, H.; Hussein, M.; Al-Hameed, F.M.; Alghamdi, A.; Hamdan, A.; Fatani, J.; Elhazmi, A.; Alkhalaf, H.; Barghash, B.; et al. Incidence, outcomes, and predictors of Acinetobacter infection in Saudi Arabian critical care units. J. Crit. Care 2021, 66, 109–116. [Google Scholar] [CrossRef] [PubMed]
- Leroy, O.; Gangneux, J.-P.; Montravers, P.; Mira, J.-P.; Gouin, F.; Sollet, J.-P.; Carlet, J.; Reynes, J.; Rosenheim, M.; Regnier, B.; et al. Epidemiology, management, and risk factors for death of invasive Candida infections in critical care: A multicenter, prospective, observational study in France (2005–2006). Crit. Care Med. 2009, 37, 1612–1618. [Google Scholar] [CrossRef] [PubMed]
| Publisher’s Note: MDPI stays neutral with regard to jurisdictional claims in published maps and institutional affiliations. |
© 2022 by the authors. Licensee MDPI, Basel, Switzerland. This article is an open access article distributed under the terms and conditions of the Creative Commons Attribution (CC BY) license (https://creativecommons.org/licenses/by/4.0/).


