Abstract
In the field of face biometrics, finding the identity of a person in an image is most researched, but there are other, soft biometric information that are equally as important, such as age, gender, ethnicity or emotion. Nowadays, ethnicity classification has a wide application area and is a prolific area of research. This paper gives an overview of recent advances in ethnicity classification with focus on convolutional neural networks (CNNs) and proposes a new ethnicity classification method using only the middle part of the face and CNN. The paper also compares the differences in results of CNN with and without plotted landmarks. The proposed model was tested using holdout testing method on UTKFace dataset and FairFace dataset. The accuracy of the model was 80.34% for classification into five classes and 61.74% for classification into seven classes, which is slightly better than state-of-the-art, but it is also important to note that results in this paper are obtained by using only the middle part of the face which reduces the time and resources necessary.
1. Introduction
Nowadays, face recognition has become almost inevitable in real-world applications in the fields of security, biometrics, entertainment industry and others in order to identify a person. However, other than the identity, there are other, soft biometric traits that can be learned from faces such as age, gender, ethnicity or emotions. In recent years, soft biometrics has become one of the more prolific fields of research. It can refer to demographic attributes (age, gender, ethnicity, eye colour, hair colour, skin colour), anthropometric and geometric attributes (body geometry and face geometry), medical attributes (health condition, BMI, body weight, wrinkles) or material and behavioural attributes (hats, scarfs, bags, clothes, lenses, and glasses) [1]. Soft biometric traits are “physical, behavioural, or material accessories, which are associated with an individual, and which can be useful for recognising an individual. These attributes are typically gleaned from primary biometric data, are classifiable in pre-defined human understandable categories, and can be extracted in an automated manner” [2]. The soft biometric trait this paper focuses on is the ethnicity (race) of a person. Ethnicity classification has an important role in classifying face images. It can be used “to categorize humans into large and distinct populations or groups by heritable, phenotypic characteristics, geographic ancestry, physical appearance, ethnicity, and social status” [3]. Race is defined as “a group of people who have some common hereditary physical characteristics that distinguish them from other groups, e.g., skin, hair and eye color, skull shape, growth” [4]. In this paper, as is in the most biometric ethnicity classification papers, we do not distinguish between race and ethnicity.
As is the case with any information and research, the research on ethnicity classification and its application should be in accordance with ethical principles. The topic of ethnicity has always been a sensitive subject and field of research. As with the other soft biometric characteristics (age, sex, tattoos) there is the potential to discriminate and some believe that using algorithms can facilitate the discrimination. Even with these ethical considerations, the research on ethnicity classification is ongoing and the application areas widespread. Research, even of the sensitive topics is important and as stated in [5] “in the very end any scientific discovery has a potential to be used for the good or for the bad. That choice belongs to the humanity”.
From all the demographic attributes that can be found in face images, ethnicity is the least studied [6] but it has been receiving increasing attention in recent years mostly due to its numerous application areas [6,7,8,9]: biometric identification, video surveillance, forensic art, human computer interaction, targeted advertisement, social media profiling, large databases searching, demographic statistics.
As much as it is an important task in computer vision, it is also a complicated task. There are many different challenges in automatic ethnicity classification: (i) terminology, (ii) ethnicity categories overlapping and (iii) datasets. The first one relates to terminology. In most research papers on automatic ethnicity classification from faces, terms race and ethnicity are used interchangeably. Another challenge that arises is different classification of ethnicities. There are various research papers that distinguish between ethnicities but some use as little as three basic ethnicities (Asian, Caucasian and African), while others use up to two hundred different “races” or more accurately ethnicities. The lack of large and diverse publicly available datasets with accurate ethnicity labels poses another significant problem and the process of collecting and labeling new dataset is a challenge. The problem that arises with labeling ethnicity affiliations is the Other Race Effect (ORE) [10]. Humans perform significantly better when dealing with faces of people of their own ethnicity than with individuals belonging to other ethnicities, which means that in order to mitigate bias, people of different ethnicities should label the images in the dataset which is not always possible [11].
Through recent years, different ethnicity classification algorithms have been developed and multiple approaches to ethnicity classification have been presented. In order to classify a face image into one of the ethnicity classes, it is important to find face features that are different for each ethnicity class [12]. Most of the existing ethnicity classification algorithms consist of two main parts: (i) feature representation and (ii) ethnicity classification. Fu et al. [7] distinguish between four main methods of feature representation: chromatic representation, global feature representation, local feature descriptor representation and other representations. Ethnicity classification is most often viewed as a multiclass classification problem and utilizes existing machine learning classifiers. Nowadays, with the development of hardware resources and emergence of large datasets with ethnicity labels, neural networks, especially CNNs, are more often used. They most commonly include an input layer, multiple hidden layers and an output layer, while employing supervised learning for ethnicity classification. From the first artificial neural networks for learning to recognize handwritten digits to today’s modern deep neural networks used for various tasks in the field of computer vision, constant progress in the complexity and capabilities of networks allows solving problems that have been previously very difficult to solve.
The main goal of automatic ethnicity classification is to determine a person’s ethnicity class based on his/her facial attributes. The specific goal of this paper is to provide an overview of recent advances in ethnicity classification with focus on convolutional neural networks and to propose a new ethnicity classification method using only the middle part of the face, while employing convolutional neural networks and comparing differences in results of CNN with and without plotted landmarks. The proposed approach is not a one-shot image classification approach, it uses multiple images of each ethnicity class for training the CNN. There are a number of datasets with images for each ethnicity class and we also use data augmentation to train the network, so the lack of images problem is not as severe as in some other computer vision problems, such as face recognition. As some of the analysed research [5,13] state that the most race information is contained in the middle part of the face, which is the area around eyes and the nose, those are the parts of the face this research focuses on. The contribution in this paper can be summarized as: (i) implementation of a new CNN to classify face images into five ethnicities (White, Black, Asian, Indian and Others) and seven ethnicities (White, Black, Indian, East Asian, Southeast Asian, Middle Eastern, and Latin), (ii) training and validation of the CNN with and without plotted landmarks, (iii) evaluation of the proposed CNN models (with and without plotted landmarks) using the holdout method and (iv) comparison of the proposed models performance with state-of-the-art methods.
The paper is structured as follows: Section 2 gives a review of the state-of-the-art in the field of ethnicity classification with the focus on CNNs and developments in recent years. Section 3 describes the proposed approach in detail with focus on data preprocessing and CNN architecture. Section 4 gives the description of the datasets used for training, validation and testing and shows the detailed results of each experiment. The results of the proposed approach are presented and compared with existing state-of-the-art approaches. At the end of the paper conclusion and future research directions are discussed.
2. Related Work
When focusing on using neural networks for age estimation, it is important to distinguish between different types of neural networks. There are three most often used types: Artificial Neural Networks (ANN), Convolutional Neural Networks (CNN) and Recurrent Neural Networks (RNN) [14]. This paper focuses on CNNs for ethnicity classification. CNNs include an input layer, multiple hidden layers and an output layer, often consisting of two parts: automatic feature extractor and trainable classifier [15].
In order to find the relevant research, IEEE Xplore, Science Direct, Springer Link, Web of Science and Google Scholar were searched. The search string used (slightly modified for each source) was: (race classif* OR ethnicity classif* OR fac* race classif* OR fac* ethnicity classif*) AND (neural network OR cnn). The research was limited to the papers published in the last five years. Not all of the papers found by this search were relevant and there were some duplicate entries which were removed in first screening. This resulted in thirty-two papers which entered the second screening phase which consisted of excluding the papers which had not presented new algorithms or where algorithms have not been tested or results have not been published. This resulted with sixteen papers that were analysed and described in detail. The summary of the sixteen papers selected can be seen in Table 1.

Table 1.
Overview of ethnicity classification state-of-the-art.
First research analysed was by Wang et al. [16] who used deep CNNs (DCNN) to extract facial features and classify them simultaneously. The proposed CNN consisted of five layers, three convolutional and two fully-connected layers and automatically learned effective feature representation and did ethnicity classification for facial images. The proposed method was evaluated in three scenarios: (i) the classification of Black and White people, (ii) the classification of Chinese and non-Chinese people, and (iii) the classification of Han, Uyghurs and non-Chinese. The accuracies for the three scenarios were: 99.70%, 99.85% and 99.60%, respectively. Inzamam and Naeem [12] proposed a new approach for ethnicity classification that uses a pre-trained CNN (VGG-Face) to extract the features and Support Vector Machine (SVM) with a linear kernel to do the classification. The ethnicity in this paper is considered as a three class classification problem (Asian, Black and White) and the approach is tested on ten different datasets and average classification accuracy over all datasets is 98.28%, 99.66% and 99.05% for Asian, African-American and Caucasian, respectively. The next research analysed was [17]. The authors explored the fine-grained ethnicity classification on East Asian population. They collected and labeled the Wild East Asian Face Dataset with seven ethnicity categories (Chinese, Filipino, Indonesian, Japanese, Korean, Malaysian and Vietnamese). Two CNN architectures were proposed, one CNN with a single branch and one CNN with multiple branches that breaks the face into regions. The multi branch CNN gains better experimental results, but the accuracy of 33.33% shows that fine-grained ethnicity classification is a challenging task.
Wu et al. [27] proposed using an improved DCNN for ethnicity classification. The proposed network “uses a branch structure to merge networks of different depths, such that it can see multi-scale features”. They designed a multi-depth DCNN and fine-tuned it from a pre-trained VGG-16 and collected a larger and more balanced ethnicity dataset for training the network. The proposed network achieved state-of-the-art accuracy of almost 99% on both public and private datasets. Masood et al. [26] also used neural networks to solve the problem of ethnicity classification. They considered three major ethnicities: Mongolian, Caucasian and Negroid. The major drawback of this research is a small number of images used. The authors used 447 images from the FERET dataset and extracted several geometric features and color attributes to be used for classification. The authors conducted two experiments, one using a Multi Layer Perceptron (MLP) and one using CNN with accuracies of 82.4% and 98.6%, respectively. The authors state that time required for feature extraction and training should also be taken into consideration which is significantly longer in case of CNN. Mohammad and Al-Ani [13] identified the complexity problem in the existing approaches and focused on ethnicity classification for the mobile environment. They presented six different models that were designed as CNNs to classify images into five different ethnicities. They chose extended ocular region as a region of interest from facial images of FERET dataset. The highest performance CNN model had a classification accuracy of 98.35% with 25,941 parameters while the squeezed CNN model showed a classification accuracy of 97.35% with just 8117 parameters. Han et al. [25] present a Deep Multi-Task Learning (DMTL) approach to estimate multiple heterogeneous attributes (age, gender, ethnicity, beard, sunglasses, hair color, etc.) from a single face image. They use CNNs consisting of shared feature learning for all attributes and category-specific feature learning for heterogeneous attributes. Experimental results on benchmarks with multiple face attributes show that the proposed approach has superior performance compared to state of the art. For ethnicity classification, an accuracy of 98.6% on MORPH II and 94.9% on LFW+ was achieved. Das et al. [24] proposed a Multi-Task Convolution Neural Network (MTCNN) approach for ethnicity classification employing joint dynamic loss weight adjustment towards classification of gender, age and ethnicity, as well as towards mitigation of soft biometrics related bias. The proposed algorithm was tested on UTKFace dataset and BEFA dataset and achieved accuracies of 90.1% and 84.29%, respectively. A new hybrid supervised learning method for ethnicity classification was proposed by [8] Their method combines the soft likelihood of CNN classification output with an image ranking engine that leverages on matching of the hierarchical features between the query and dataset images. A supervised Support Vector Machine (SVM) hybrid learning is developed to train the combined feature vectors to perform ethnicity classification. The authors state that the proposed model improves the classification accuracy by 3% compared to other state-of-the-art methods. Talo et al. [23] offer another public ethnicity dataset consisting of labeled images to overcome the challenges of real-world ethnicity estimation tasks and present a benchmark study to find the ethnicity of a human face using a pre-trained CNN model on the large-scale face dataset. The model achieves an accuracy of 97.6% in the ethnicity classification task. Khan and Mahmoud [22] approached ethnicity classification as a problem of transfer learning to explore if ethnicity is a transfer boundary. They consider a series of datasets annotated by ethnicity and attempt to predict ethnicity across domains. They show the effectiveness of transfer learning in problems of ethnicity classification and highlight the difficulties within subsampling racially diverse datasets from large unbalanced datasets. The authors in [21] incorporated different facial attributes in their proposed CNN model for ethnicity classification, like surface, skin color pattern and other secondary characteristics to classify the images into two different ethnicity categories Asian and non-Asian. The proposed model achieved an accuracy of 84.91% tested on a Private dataset. The drawback of this approach is that it has not been tested on any publicly available dataset and so it cannot be compared with other algorithms. Mazida et al. [20] proposed a deep learning model using large scale data (BUPT dataset) which is not restricted to laboratory environments but has large variations in pose, expression, age and backgrounds. The model pre-processes the images and aligns them by using facial landmarks before feeding them into the network. The proposed R-Net CNN is optimized by comparing different activation functions and optimizers and tested on other datasets and compared with popular pre-trained models. The achieved accuracy on the BUPT dataset is 97%. Hamdi and Moussaoui [19] focused on comparing different machine learning and deep learning algorithms for ethnicity classification. SVM, Random Forest, ANN, Transfer Learning and CNNs were compared for age, gender and ethnicity classification. The conclusion was that CNNs provide the best results for all three classifications. Greco et al. [11] approached a problem of ethnicity classification from a different aspect. They did not propose a novel ethnicity classification algorithm, but a new dataset for ethnicity classification. They state that existing datasets have some drawbacks such as insufficient number of images for each ethnicity and insufficient number of images in general. In addition, different datasets define different ethnicity groups and do not take into account Other Race Effects when labeling images. In order to improve on these drawbacks, the authors created a new dataset for ethnicity classification called VMER which has 3,309,742 images of 9129 subjects of four different ethnicities (African American, Caucasian Latin, East Asian and Asian Indian). Khan et al. [18] proposed a face segmentation algorithm that segments a given face image into seven face classes and developed a new ethnicity classification algorithm based on information from the face segmentation model. They used a DCNN to construct a face segmentation model. In order to train the DCNN, face images were labeled according to seven different classes (nose, skin, hair, eyes, brows, back and mouth). Next, the developed DCNN model was used to create segmentation results. For each class, the probabilistic classification method and probability maps (PMs) are used. From seven features, five were used for ethnicity classification. The performance of the proposed ethnicity classification method was assessed on four standard face datasets and obtained better results than previous studies. The main drawback of this paper is the manual labeling process which increases the probability of errors.
From the papers analysed, it can be concluded that there is no consensus about ethnicity classes. Some of the papers define two ethnicity classes, such as Asian and non-Asian [18,21], White and Others [16,22,27], but there are also papers that classify people into four [11,18,19,20] or even seven different ethnicity classes [17]. In addition, until recently, no large publicly available dataset with ethnicity labels was available. This poses a problem because different algorithms are tested on different classes and on different datasets which makes it impossible to compare the algorithm results. One thing all the papers agree with is that algorithm performance is measured by classification accuracy. Most of the papers that apply CNN to ethnicity classification problem base their CNN on one of the common CNN architectures (VGG-16, ResNet, R-Net, VGG-Face, AlexNet), but a small number of papers train their own CNN [16,17,18,21].
3. Proposed Approach
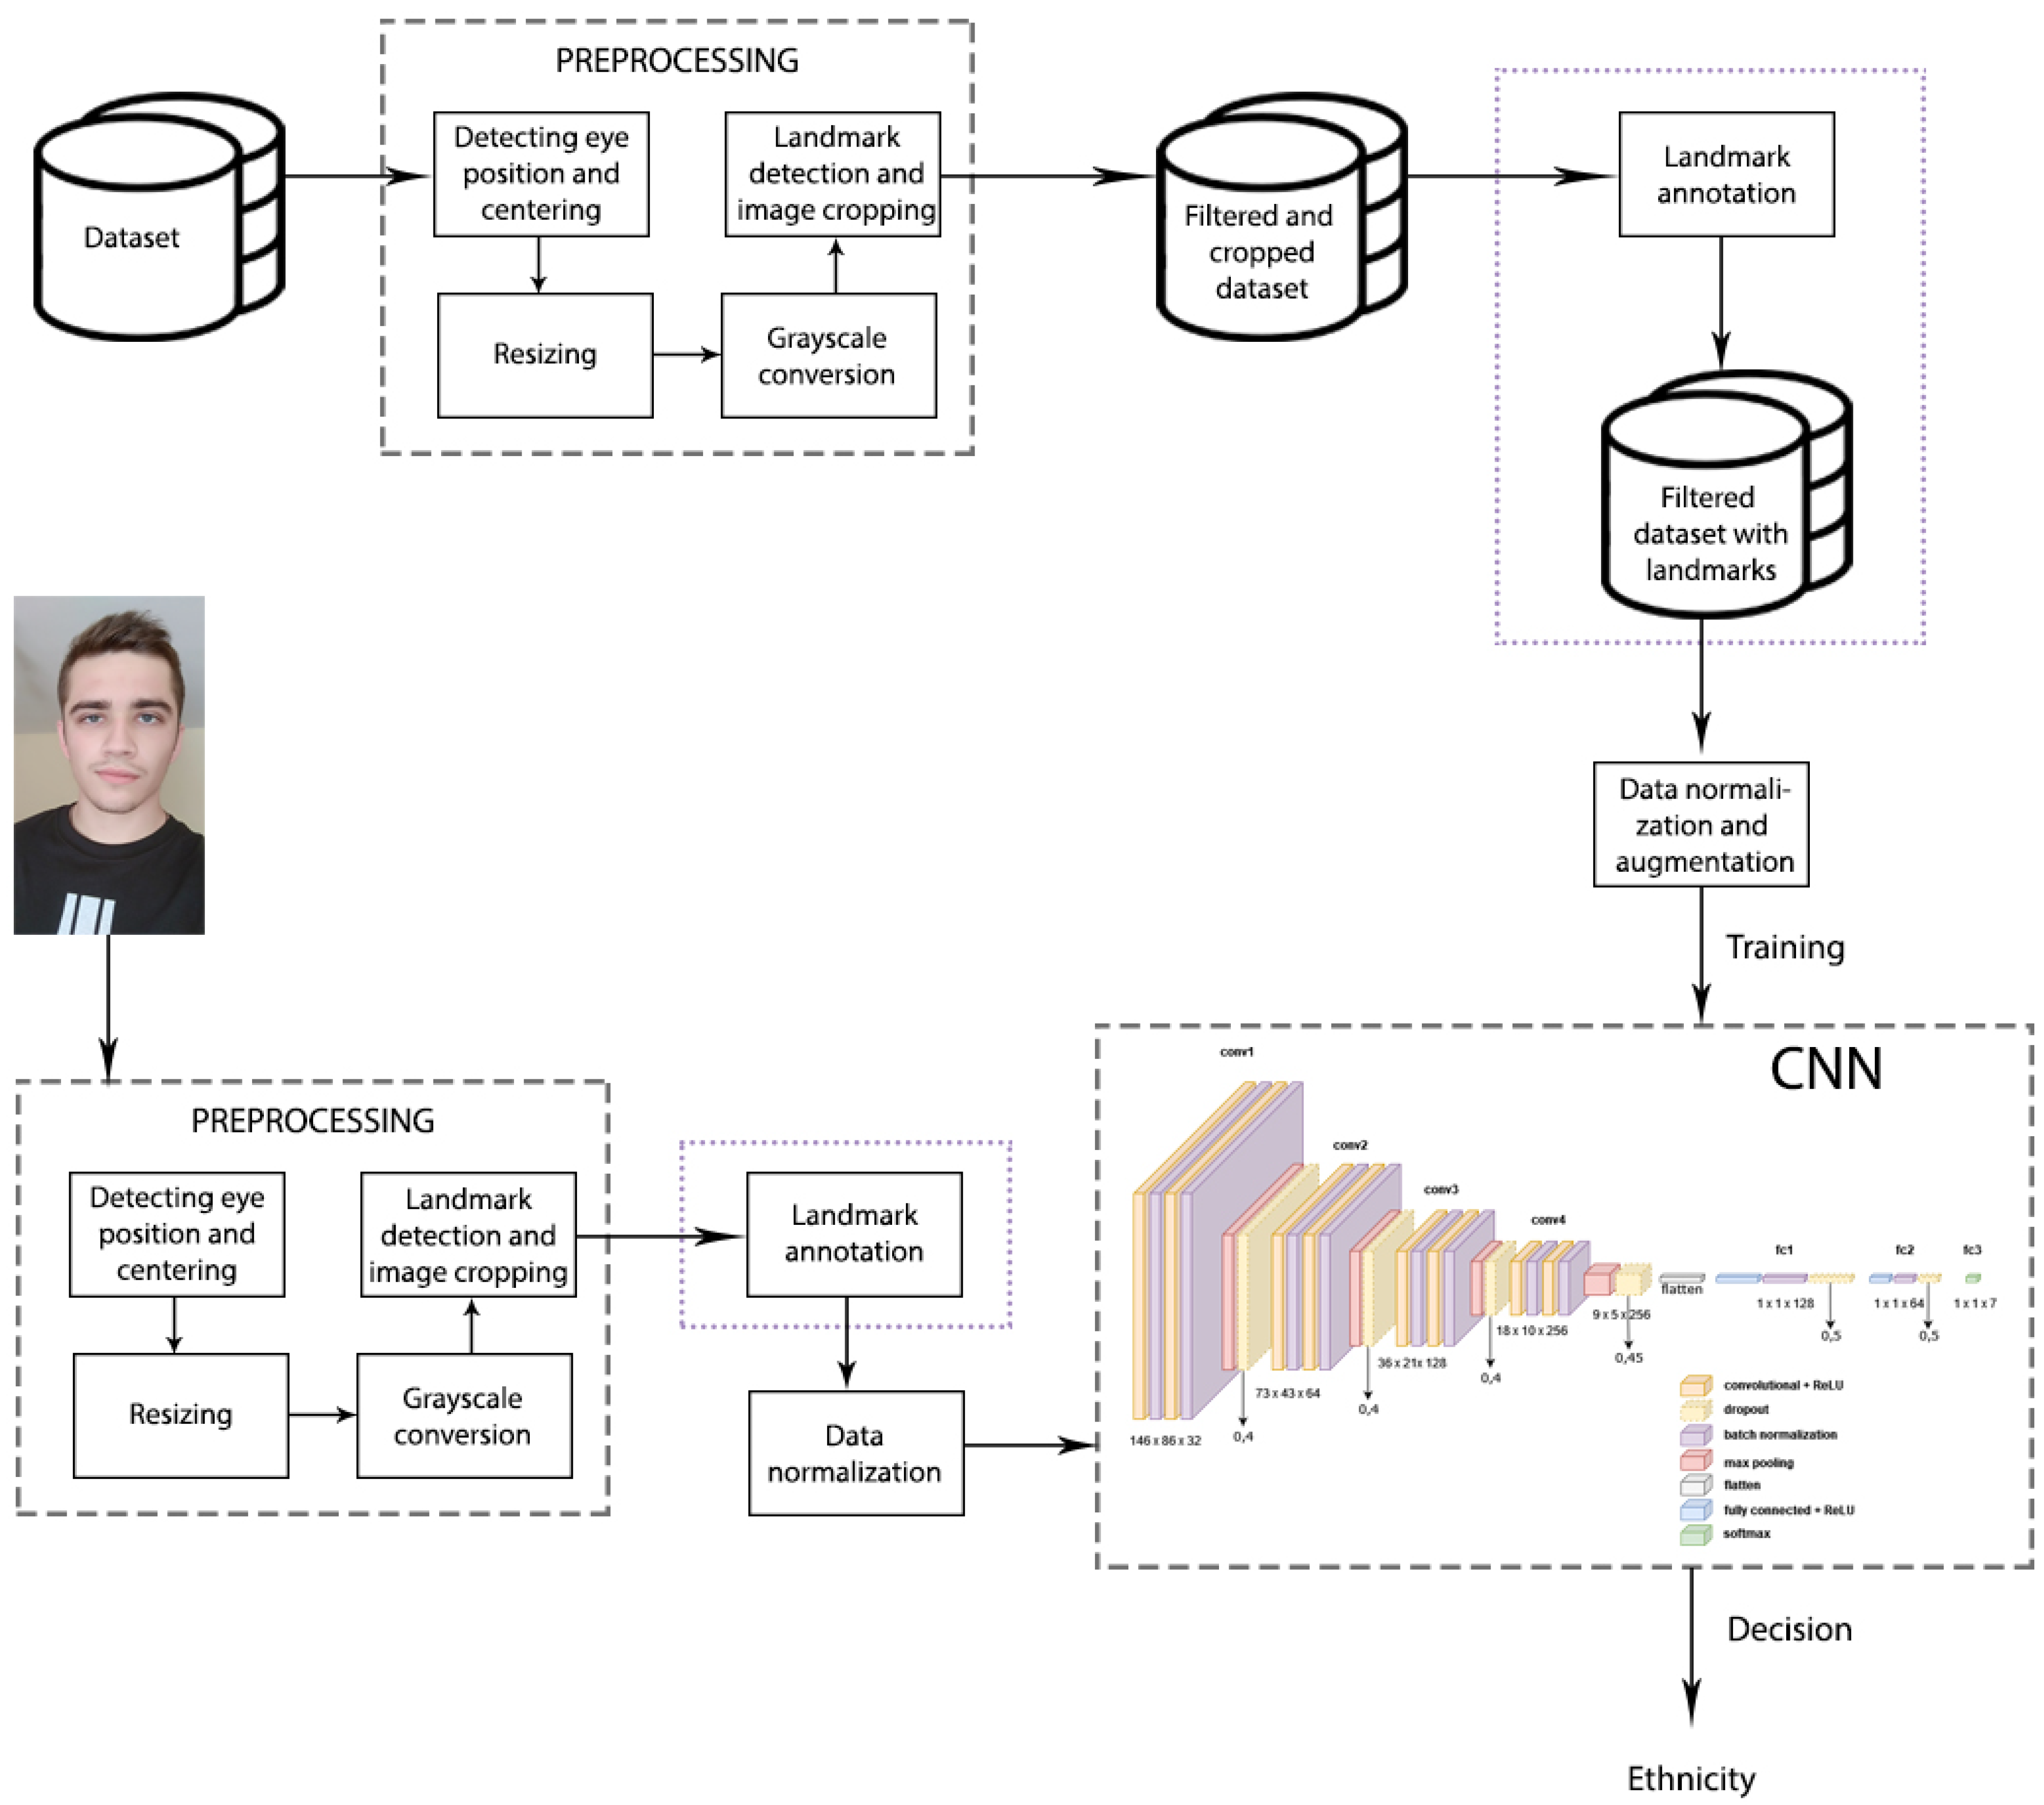
The approach proposed in this paper consists of several stages. First, all of the training images are preprocessed, which is described in more detail in Section 3.1. After preprocessing, the filtered dataset with cropped images is created. Here, the approach for ethnicity classification with plotted landmarks (Figure 1) goes to the landmark annotation step after which a new dataset with annotated landmarks is created. The approach for ethnicity classification without plotted landmarks omits this step and goes to data normalization and augmentation. The steps omitted in the approach without plotted landmarks are marked with purple dotted lines in the Figure 1. The normalized and augmented images are then used to train the CNN. After CNN training and validation, testing is conducted. First part is to input an image which is preprocessed in the same way as training images, then landmarks are annotated (only in the approach with plotted landmarks), images normalized and the trained CNN makes a prediction of ethnicity. Based on the previous research and observation through study of other papers, in which landmarks are not often used in combination with deep neural networks, one of the aims of this paper is to investigate if landmark plotting can contribute to ethnicity classification models.
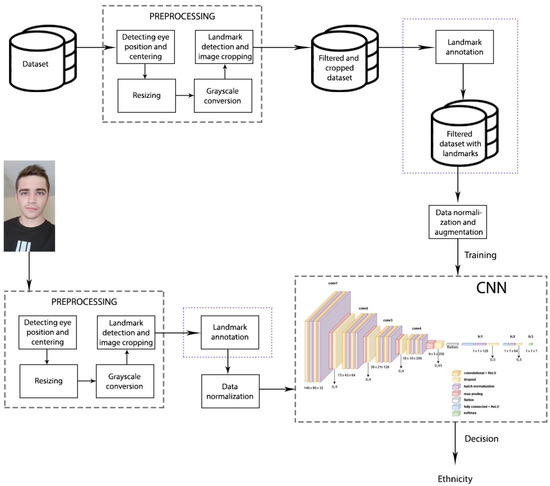
Figure 1.
Architecture of the ethnicity classification approach. Purple dotted lines mark the steps which are omitted in the approach without plotted landmarks.
3.1. Data Preprocessing
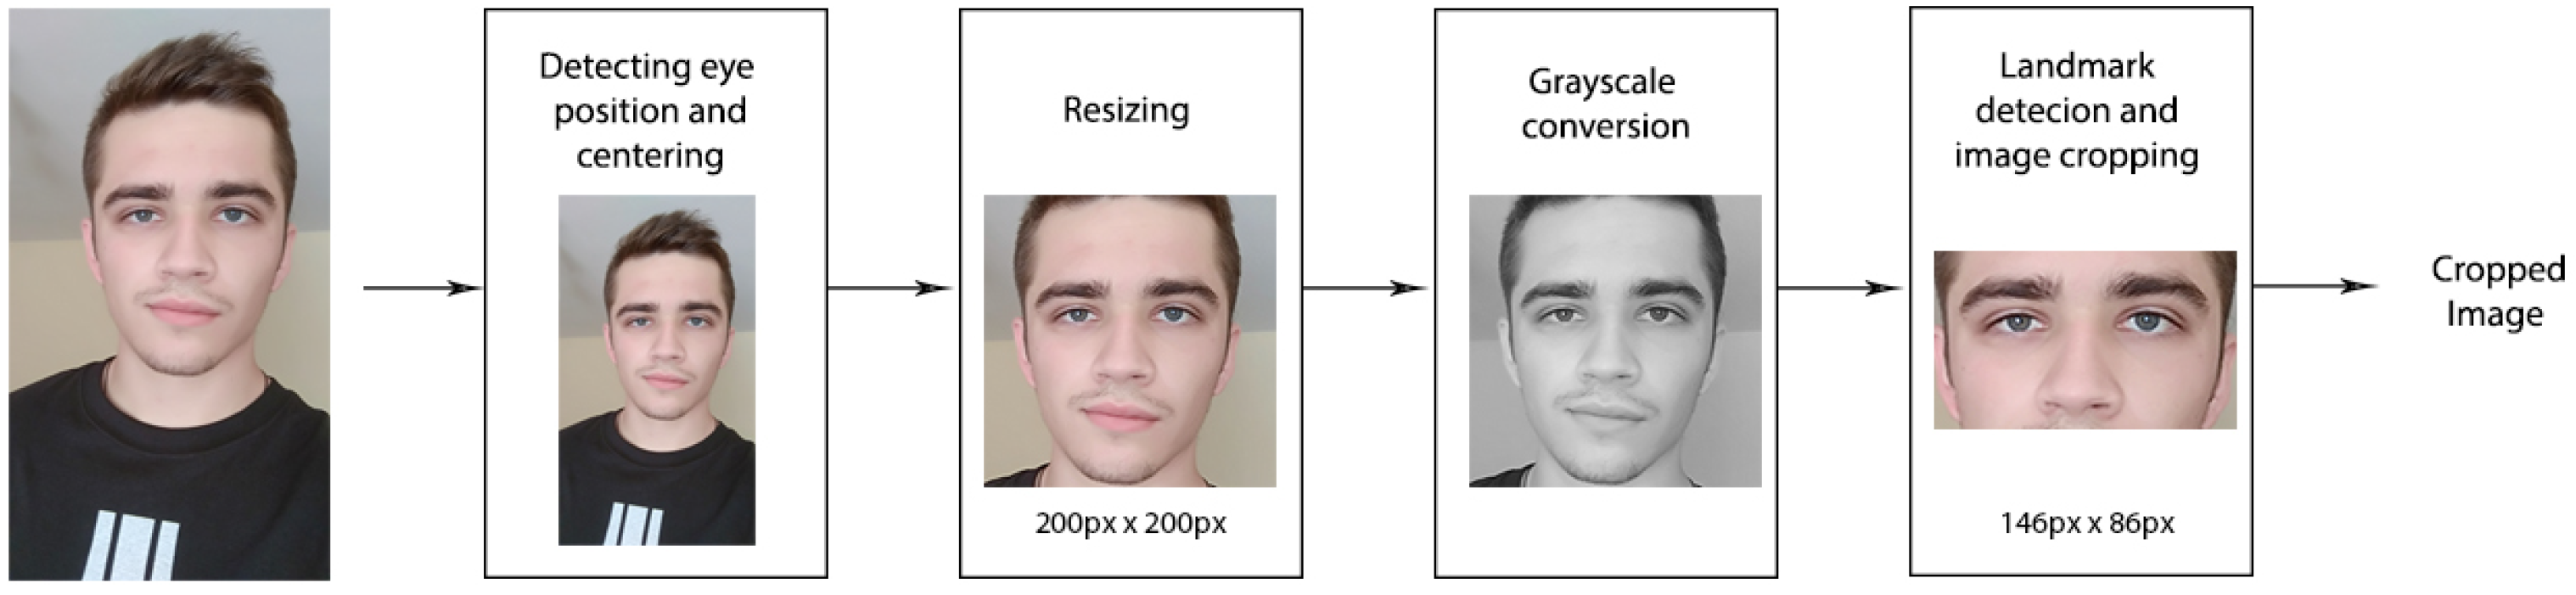
The complete preprocessing stage consists of five steps (Figure 2): (1) eye detection and face centering; (2) resizing the image; (3) grayscale conversion; (4) landmark detection and (5) image cropping.
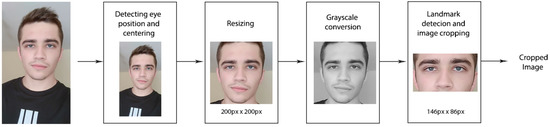
Figure 2.
Preprocessing block diagram.
To facilitate image processing, all images were first centered based on the detected eye position in the image and resized to 200 × 200 pixels. As the landmark detector and predictor only work on grayscale images, all images are initially converted to grayscale. For each face found by the detector, the predictor finds 68 landmarks. For the detection of landmarks, Histogram of Oriented Gradients (HOG) and linear Support Vector Machines (SVM) were used. HOG is created by dividing the image into several parts or cells for which the histogram of oriented gradients of pixels is calculated, and the combination of cell histograms then represents the histogram of oriented gradients of the whole image [28]. SVM that is applied to the final histograms in the system separates the data it receives by viewing them as vectors and trying to separate them into two classes on one plane which is usually of high complexity. The goal of SVM is to calculate which of these hyperplanes separates the data with the least error. By calculating such a hyper-plane for each image on a given data set, the system learns the classification. Based on this method, the detection of the face and any region of interest on the face is performed.
As this research focuses on ethnicity classification from the middle part of the face, all images used for training and validation have been cropped to contain only that specific part of the face. The result is a rather unusual 146 × 86 pixel image format that has proven satisfactory for images in selected datasets. These images are two-thirds smaller, resulting in smaller disk space requirements and lower computational complexity.
3.2. Proposed Network Architecture
Deep neural networks are a more advanced and complex approach to neural network design. The form of deep neural networks that will be used in this paper is the CNN [29]. The starting point for creation of the CNN proposed in this paper was the VGG-16 model which is most commonly used for soft biometric features analysis [11]. It is based on chaining the VGG blocks where one VGG block consists of two convolutional layers with a relatively small filter size followed by a max pooling layer. Each chaining of VGG blocks doubles the number of filters in convolutional layers, which, due to the consequences of using the compression layer, process half the size of the feature map. As convolutional layers also require the application of activation functions, the ReLU function is used, which proved to be the best choice. The Adam optimizer was selected as the CNN network optimizer.
Through experimenting, 20 different CNN models were created and Table 2 shows five CNN models with best validation accuracy. All of the models used ReLU activation function, Adam optimizer and SoftMax function and had a learning rate of 0.001.
Table 2.
CNN models with 5 best validation accuracy.
In order to achieve the best possible network for the obtained problem, methods to increase the accuracy and reduce losses in network performance have been implemented. Two of these methods were applied before the data processing in the network. The first is data normalization. The goal of normalization is to bring the data in the range between 0 and 1 to facilitate the calculation of the gradient to the optimizer. In this case, the input image is represented as a set of pixels, and each pixel contains three RGB values (red, green and blue) that range from 0 to 255. To perform normalization, each RGB value for each pixel is divided with 255, which calculates the final values.
The second method used is data augmentation. Data augmentation takes an image from disk and creates different versions of that image before loading it into the training program, which is then processed by the CNN. In this paper, different versions include horizontal and vertical stretching of up to 10% of the size and horizontal image mirroring. Testing has shown that augmentation that rotates the image by a random number of degrees results in poorer CNN performance and such augmentation was not used. The augmentation process actually results in virtually more images in the data set and at the same time makes it more difficult for the network to learn because all images are no longer fully standard (although they are standard compared to their augmentations). An additional advantage of this method is that more data is obtained from all input images than is the size of computer memory on which the network is trained would allow.
In the process of modeling a network for this paper, we consulted [30,31] where authors stated that Batch Normalization and Dropout usually do not provide better results when used together, but we experimented to find out what happens in the case of ethnicity classification on datasets selected for this research. We have tested implementations using only Batch Normalization layers, only Dropout layers and a combination of both. The results showed that by using only Batch Normalization layers our network gained around 1.8 percent better accuracy on the validation and test sets, compared to the combination of those layers, with a training graph that showed a slight tendency of overfitting the dataset. Using only Dropout layers showed significantly worse accuracy and network behaviour but increased training speed. By implementing a combination of Batch Normalization and Dropout we gained a network which showed good behaviour on our dataset and reduced the training time by a significant margin—duration of training per epoch reduced from around 80 s to about 24. Same happened with the prediction speed (network with combined layers was about 3 times faster). This was the reason that we selected the 18th iteration of the CNN network (Figure 3 and Table 3) for this paper.
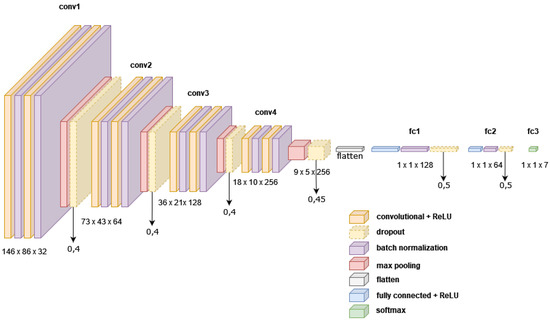
Figure 3.
Architecture of the final CNN network used for ethnicity classification.
Table 3.
CNN architecture hyperparameters.
The total network consists of four VGG blocks, a flattening layer, fully connected ANN with batch normalization and dropout and a SoftMax layer. Each VGG block is a sequence of the following: (i) convolutional layer, (ii) an activation function (REctified Linear Unit), (iii) batch normalization, (iv) a pooling layer (max pooling) and (v) a dropout layer. CNN uses the Adam optimization algorithm to update network weights based on training data [32]. The filter size in the first VGG block is 4 × 4 pixels to help capture larger image features which is reduced to 3 × 3 pixels in the next block and finally 2 × 2 pixels in the rest of the network. The total number of layers of this network is 31. The total number of parameters that can be trained has been reduced by adding more Dropout layers from 3,500,000 in the first version to 2,050,000 parameters in the final version.
4. Results and Discussion
This section gives an overview of datasets used for ethnicity classification in state-of-the-art research and a detailed description of the selected datasets used for this research. After selection and description of datasets, experiment is described and training, validation and testing results of the networks are presented. At the end of this section, the results are compared with state-of-the-art results.
4.1. Datasets
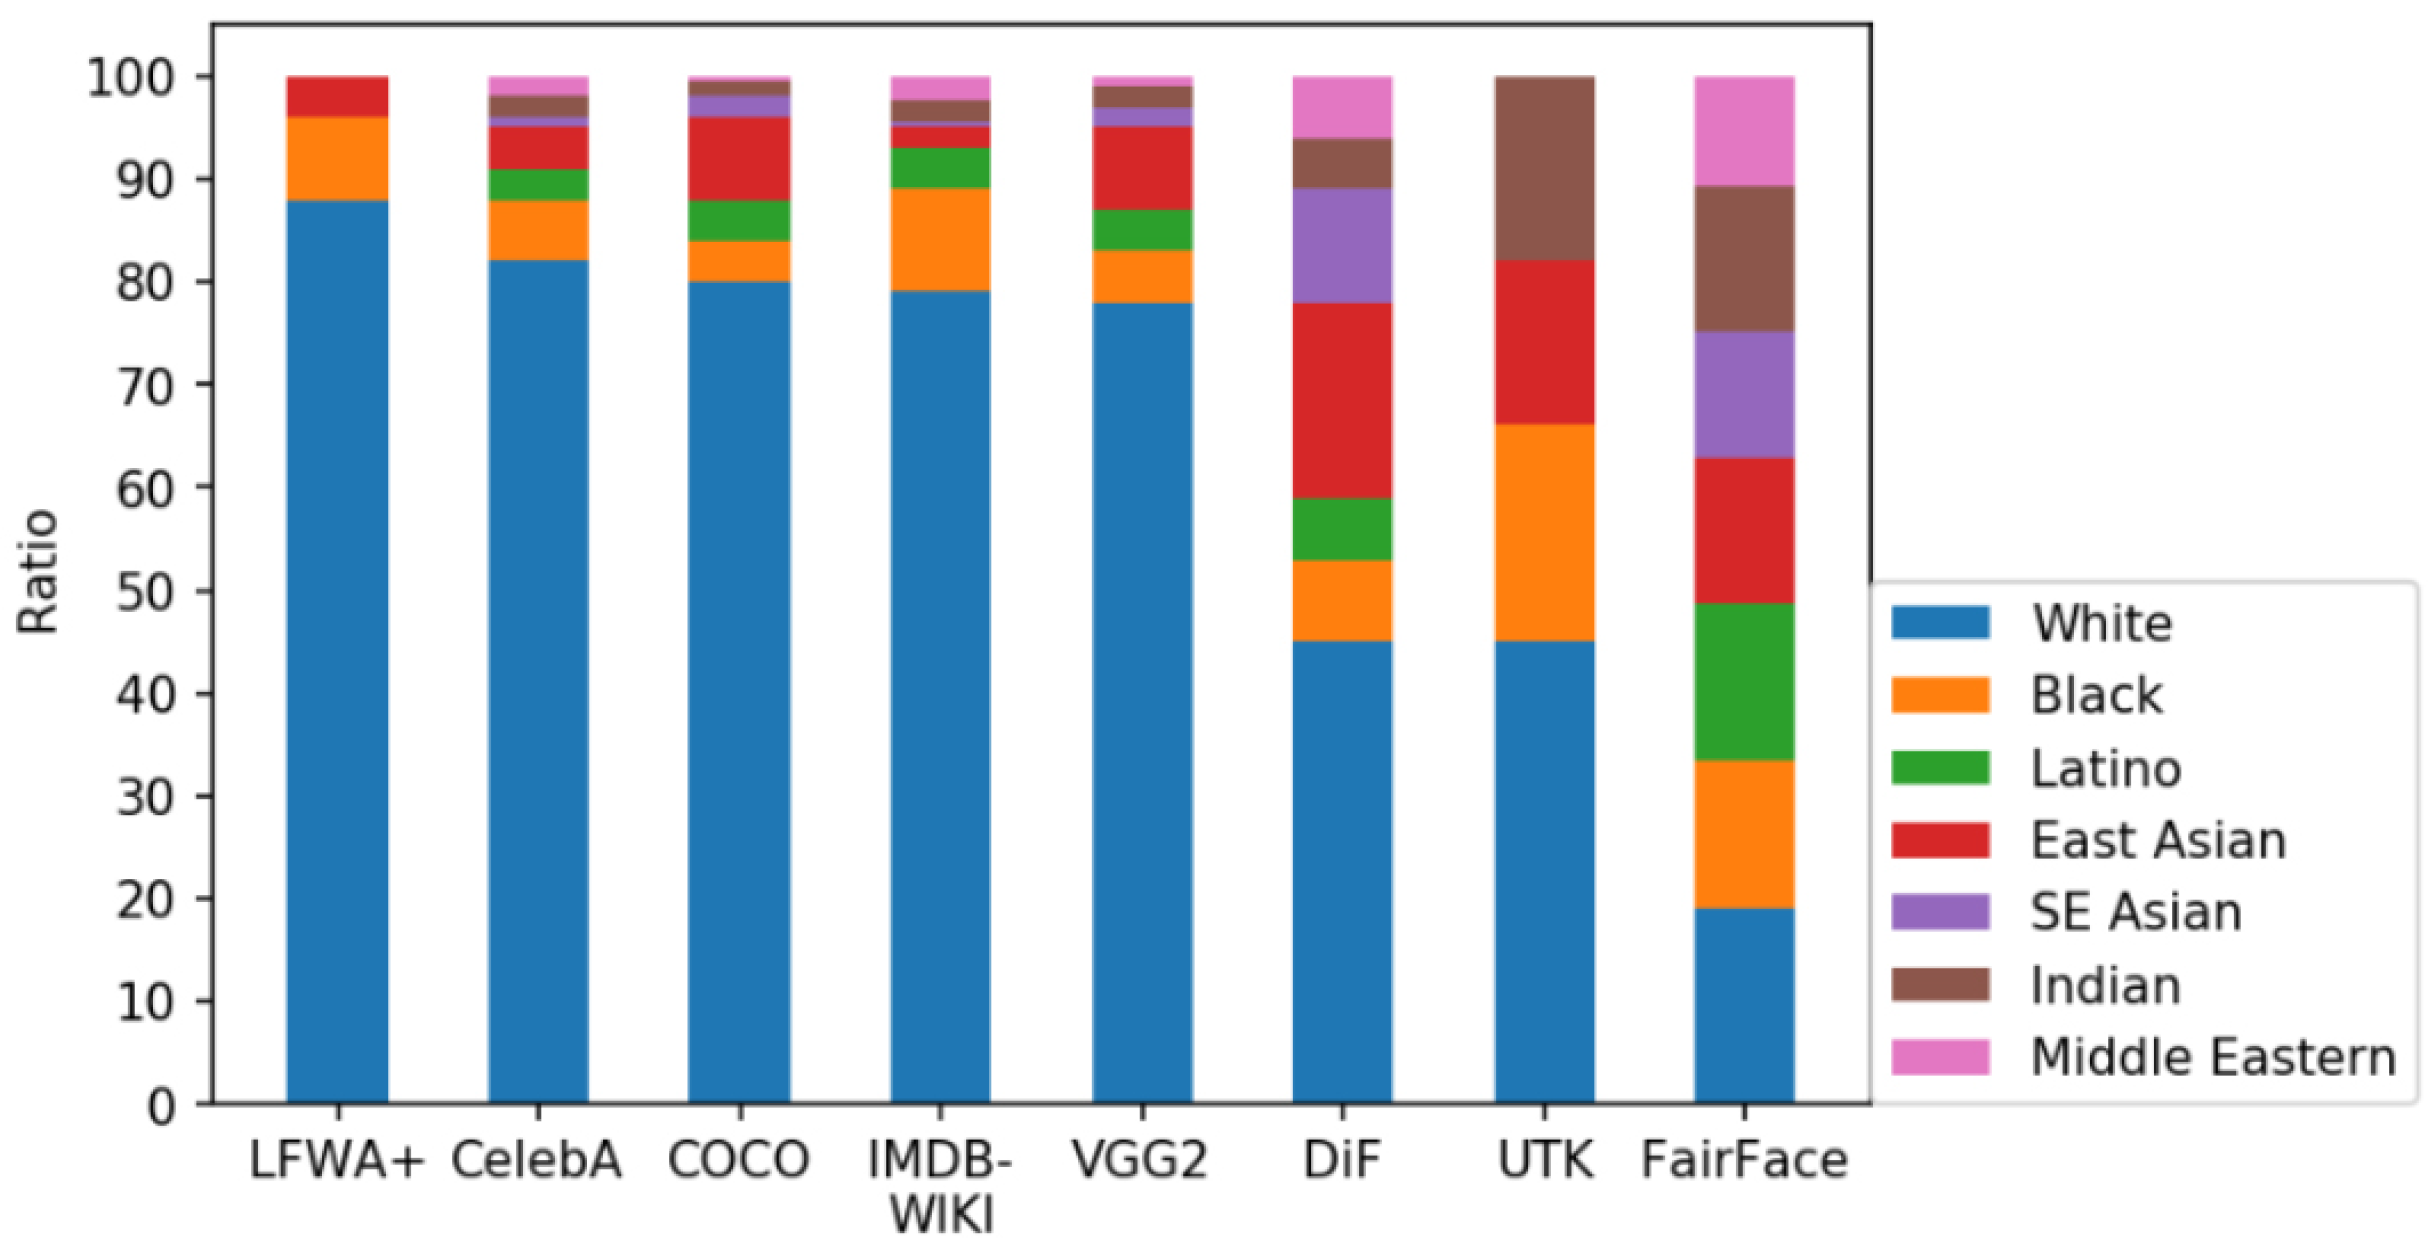
There are a number of datasets with ethnicity labels, but only a small number is sufficiently large for CNN training. Some of the problems with datasets were described in previous sections. The overview of existing ethnicity classification datasets can be seen in Table 4. where datasets were sorted by number of images in each dataset. It can be seen that some datasets have only one ethnicity group: CUN [33], KFDB [34], CAS-PEAL [35], IFDB [36], FEI [37] and JAFFE [38]. Those datasets cannot by themselves be used to train or test the classifiers, but they can be used in conjunction with other datasets. The visualization of selected datasets and their ethnicities representation can be seen in Figure 4.
Table 4.
Overview of ethnicity classification datasets.
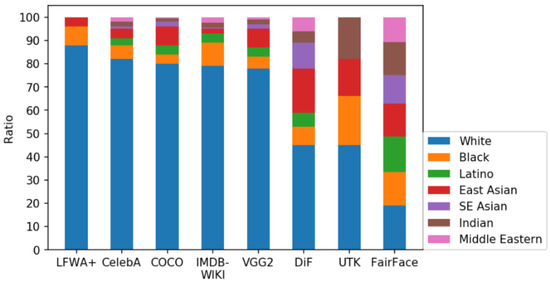
Figure 4.
Ratio of represented ethnicities in datasets [39].
When creating or choosing a dataset for neural network training, several things need to be considered. The larger size of the dataset contributes to increased accuracy. The quality of the images themselves should be similar to the image quality expected from users in real-world scenarios. The balance of ethnicity representation in the set, as well as gender, proved to be crucial for the successful CNN training for ethnicity classification.
The datasets selected for this research are UTKFace [40] and FairFace [39] dataset based on the number of images, their public availability, the ethnicity groups labeled and ethnicity balance in the dataset. The selected datasets have ethnicity labels for each image. In addition, they were created primarily for the purpose of ethnicity classification, while other datasets were created mostly for face recognition problems or age and gender recognition so the ethnicity balance was not as important. In the next subsection, the two selected datasets will be described in detail. Before neural network training and testing, images need to be preprocessed as described in Section 3.1. If face or 68 landmarks could not be detected in the image, the image was dropped from the data set and new filtered data sets were created.
4.1.1. UTKFace Filtered
UTKFace consists of 23,807 face images of different people aged 1 to 116 years divided into racial classes: White, Black, Asian, Indian and Others (Middle Eastern, Latin). Those classes are pre-labeled in the dataset and serve as ground truth values for CNN training and performance measures calculation. The representation of ethnicities in the data set is 40% White, 20% Black, 15% Asian, 15% Indian and 10% Other. After preprocessing, UTKFace Filtered contains 18,246 images or 5561 images less than in the original (approximately 23% reduction). The comparison can be seen in Figure 5. The ratio between the ethnicities representations was changed in UTKFace Filtered to 41% White, 22% Black, 13% Asian, 18% Indian and 6% Other.
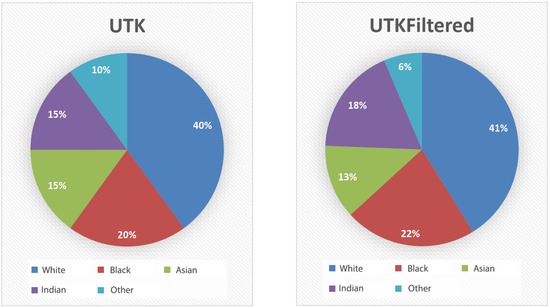
Figure 5.
Representation of ethnicities in UTKFace (left) and UTKFace filtered (right).
Based on the presented data, it can be concluded that filtering of the dataset does not disturb the balance in the representation of the ethnicities of the set. Therefore, the UTKFace filtered dataset should still be of exceptional quality for training ethnicity classification algorithms. Furthermore, gender representation in the initial dataset was at a ratio of 54% male face images versus 46% female images. The ratio between the representation of male and female facial images in the UTKFace filtered dataset is 53.7% versus 46.3%.
Table 5 shows exact numbers of all ethnicities and genders represented in the UTKFace filtered datased used in this paper.
Table 5.
Overview of image distribution in UTKFace filtered dataset.
4.1.2. FairFace Filtered
FairFace consists of 97,698 facial images of different people aged 1 to 70 divided into racial groups: White, Black, Latin, East Asian, Southeast Asian, Indian and Middle Eastern. As is for the UTKFace dataset, ethnicity classes are pre-labeled in the dataset. Representation is balanced with about 14% of images for each ethnicity with equal representation of males and females. According to the above figures and the comparison made in the FairFace survey [39], these two data sets are the most balanced datasets observed (Figure 4).
FairFace filtered contains a total of 55,384 images, or 42,314 images less than in the original (approximately 43.3% reduction). Comparison of FairFace and FairFace filtered can be seen in Figure 6. The reason for such a large reduction is that FairFace contains a large number of images taken from a bad angle, images that do not show enough face to detect it properly, modified images that are not in the full RGB spectrum, etc. Such images are not compatible with the aim of this paper that primarily focuses on landmarks and a complete frontal image of the face.
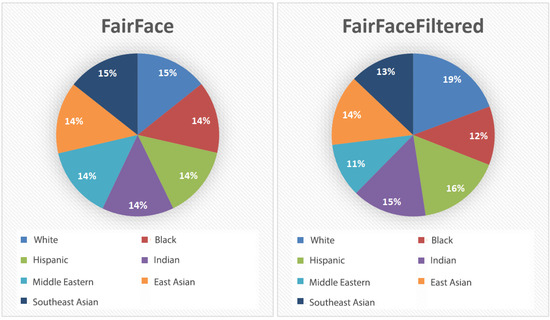
Figure 6.
Representation of ethnicities in FairFace (left) and FairFace filtered (right).
At FairFace filtered, the ethnicity representation in the dataset now appears to be: 19% White, 12% Black, 16% Latin, 15% Indian, 11% Middle Eastern, 14% East Asian, and 13% Southeast Asian.
Gender representation in the initial dataset was at 53% male face images versus 47% female face images. The ratio between the representation of male and female facial images in the FairFace filtered is 49.4% versus 50.6%. With the FairFace set, it can be noticed that by filtering, the set actually balanced even better in the general ratio of male and female face images (Table 6).
Table 6.
Overview of image distribution in FairFace filtered dataset.
4.2. Experiments
All networks were trained on the same machine whose main features are: processor—Intel i7 7700, graphics card—Nvidia GTX 1060 6 GB and RAM—16 GB DDR4 2400 MHz. CNNs were trained using a graphics card. Libraries on which neural networks are based and which are the basis of this paper are dlib [50], OpenCV [51], Keras [52] and scikit-learn [53]. The following experiments will train, validate and test the CNNs without plotted landmarks and then CNNs with plotted landmarks will be trained, validated, tested and compared.
4.2.1. Training and Validation
In order to train and test the proposed approach, a holdout method was used. The dataset was split into a training (50%), validation (25%) and testing (25%) set. The training set is the set of images used to train the model, validation set is used to check and adjust the model parameters and the test set is used to see how well that model performs on unseen data.
The network is trained so that it minimizes categorical cross-entropy loss:
where is the i-th scalar value in the model output, is the corresponding target value, and output size is the number of scalar values in the model output [54].
For validation of the network, accuracy is calculated. It is a metric that describes how the model performs across all classes. It is calculated as the ratio of the total number of predictions that were correct [14]:
First, the final CNN (Model_18) was trained on 50% of the UTKFace filtered dataset and validated. This trained network (Model_F1) was then used to test the accuracy of the model without plotted landmarks for classification into five ethnicities from the UTKFace dataset. Next, the CNN was trained on 50% of the FairFace filtered dataset without plotted landmarks and validated. This trained network (Model_F2) was then used to test the accuracy of the model without plotted landmarks for classification into seven ethnicities from the FairFace dataset.
After that, the focus shifts on training with plotted landmarks where the same model (Model_18) was trained from the beginning on 50% of the UTKFace filtered dataset with plotted landmarks and validated. This trained model (Model_F3) was used to test the accuracy of the model with plotted landmarks for classification into five ethnicities from the UTKFace filtered dataset. Next, the CNN was trained on 50% of the FairFace filtered dataset with plotted landmarks and validated. This trained network (Model_F4) was then used to test the accuracy of the model with plotted landmarks for classification into seven ethnicity classes from the FairFace dataset.
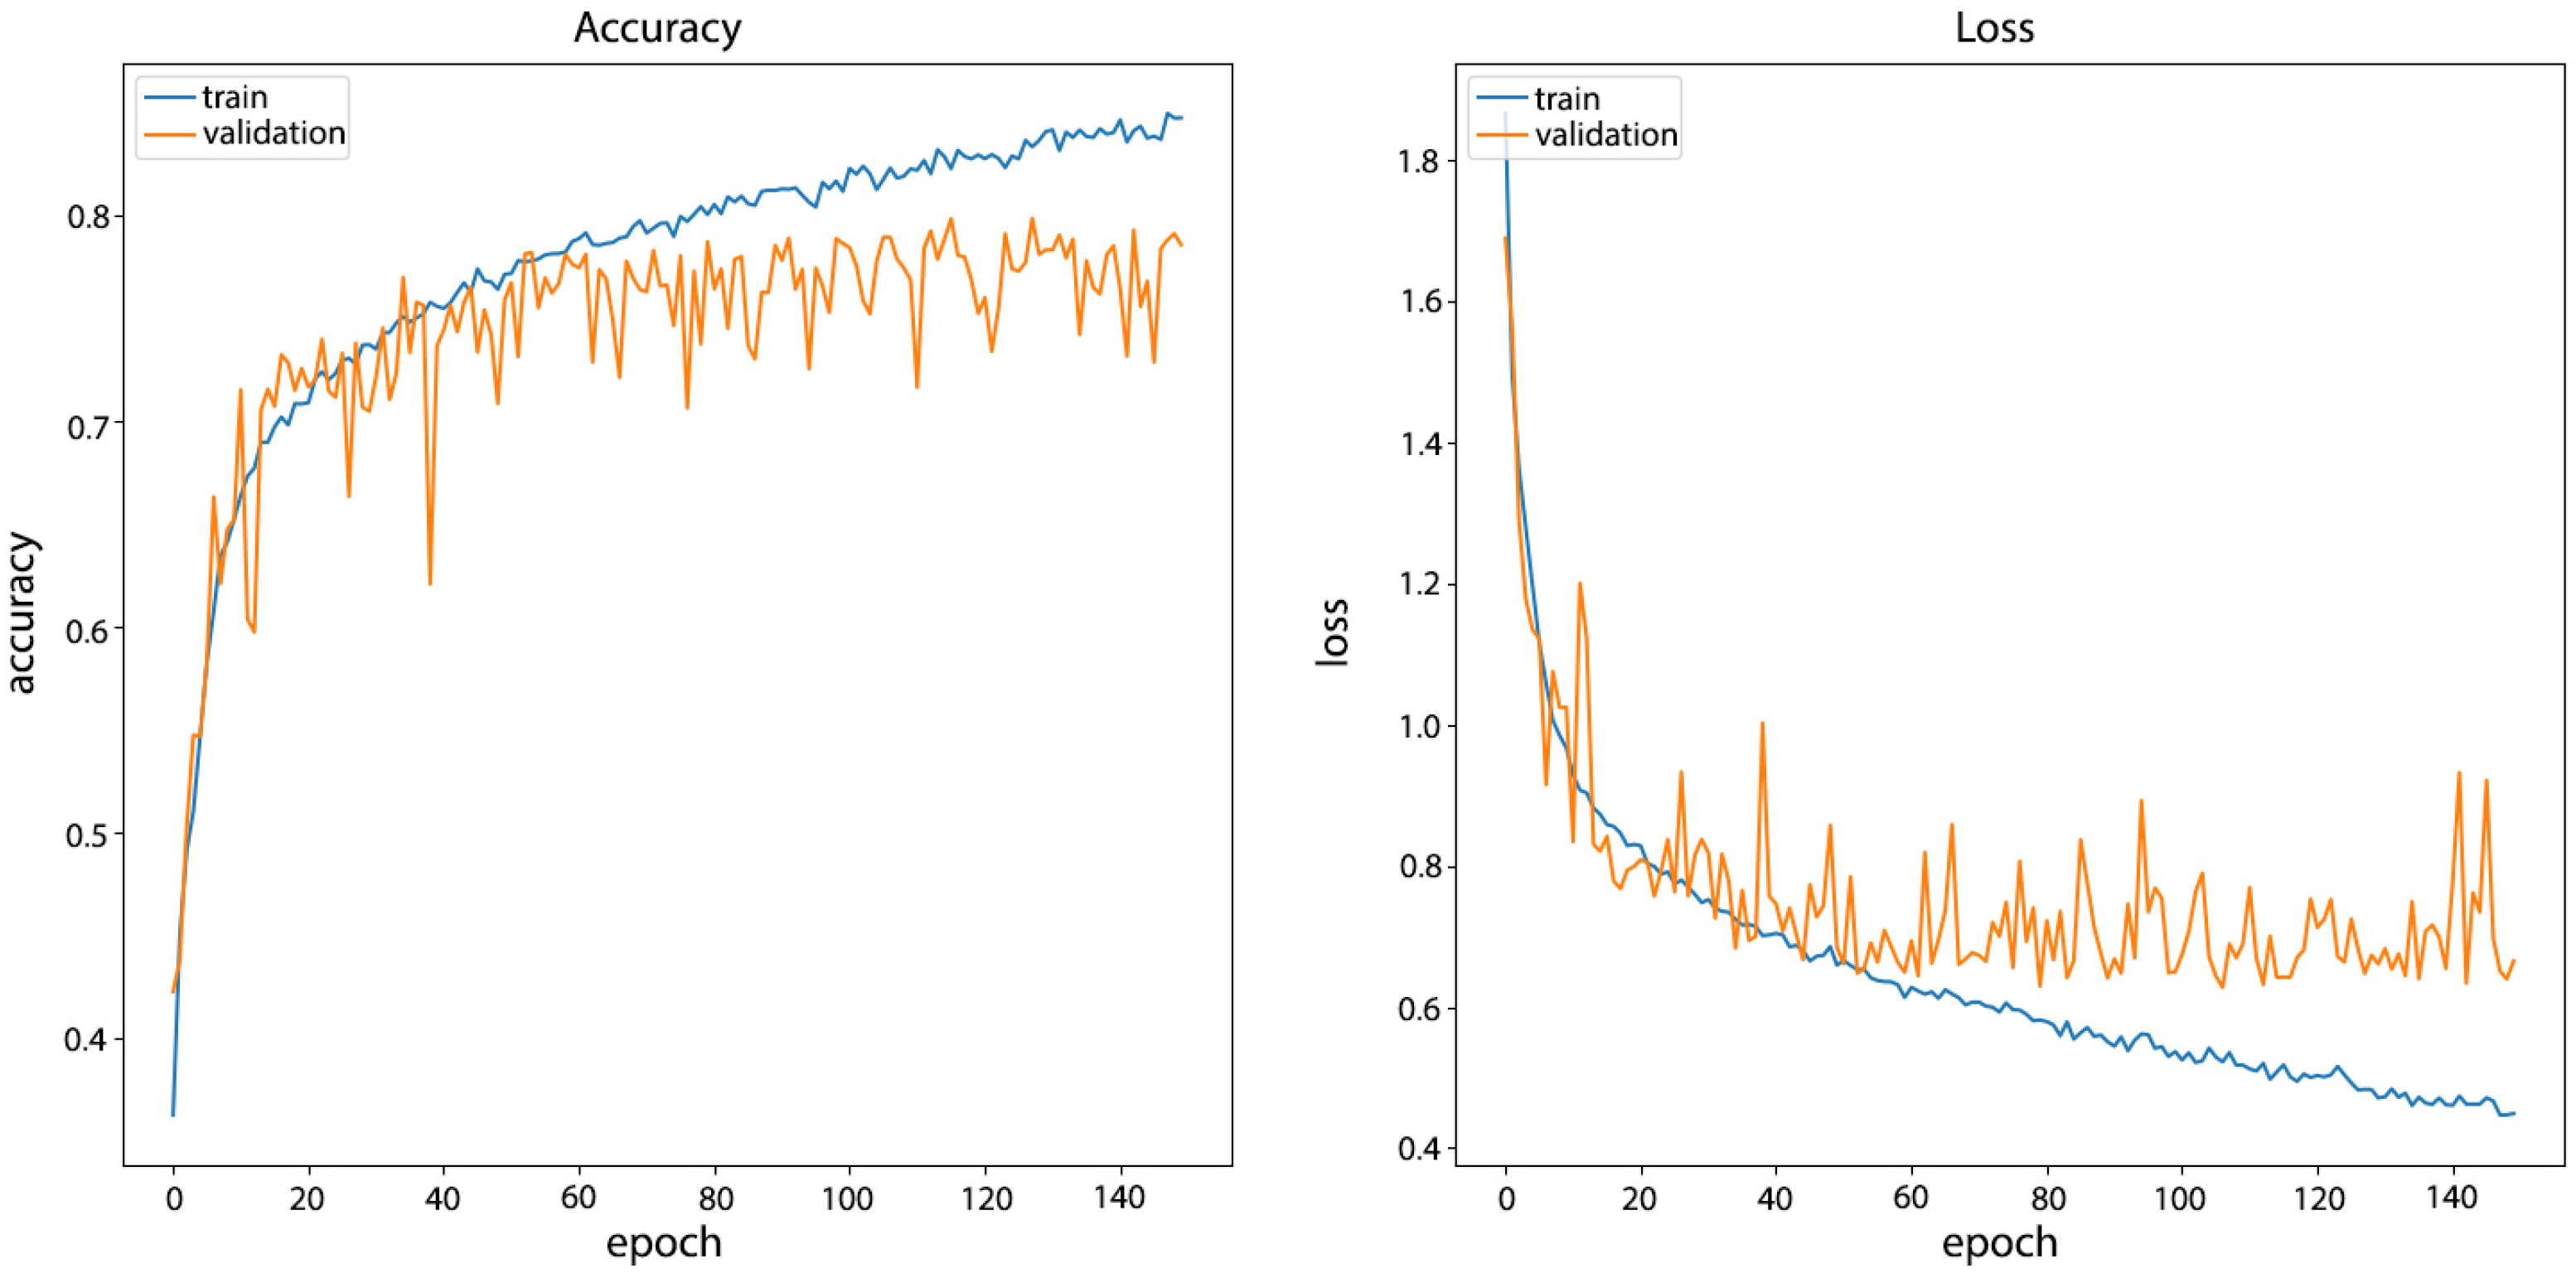
Models without plotted landmarks. The training of the network on the UTKFace filtered dataset (Model_F1) has been done for 150 epochs in order to see the behavior of the network when training for a longer time. The total duration of network training was two hours. Compared to the starting network, better network behavior can be observed on the validation data set. The accuracy of the network after training was 89.78% on the training set and 78.6% on the validation set. The results of network training can be seen in Figure 7.
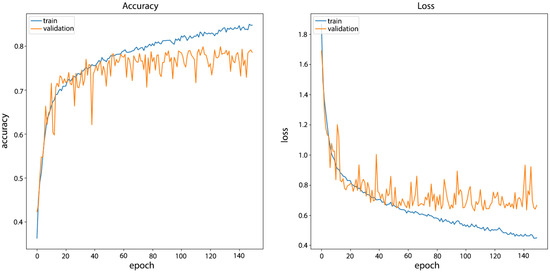
Figure 7.
CNN Model_F1 training results on UTKFace filtered dataset without plotted landmarks.
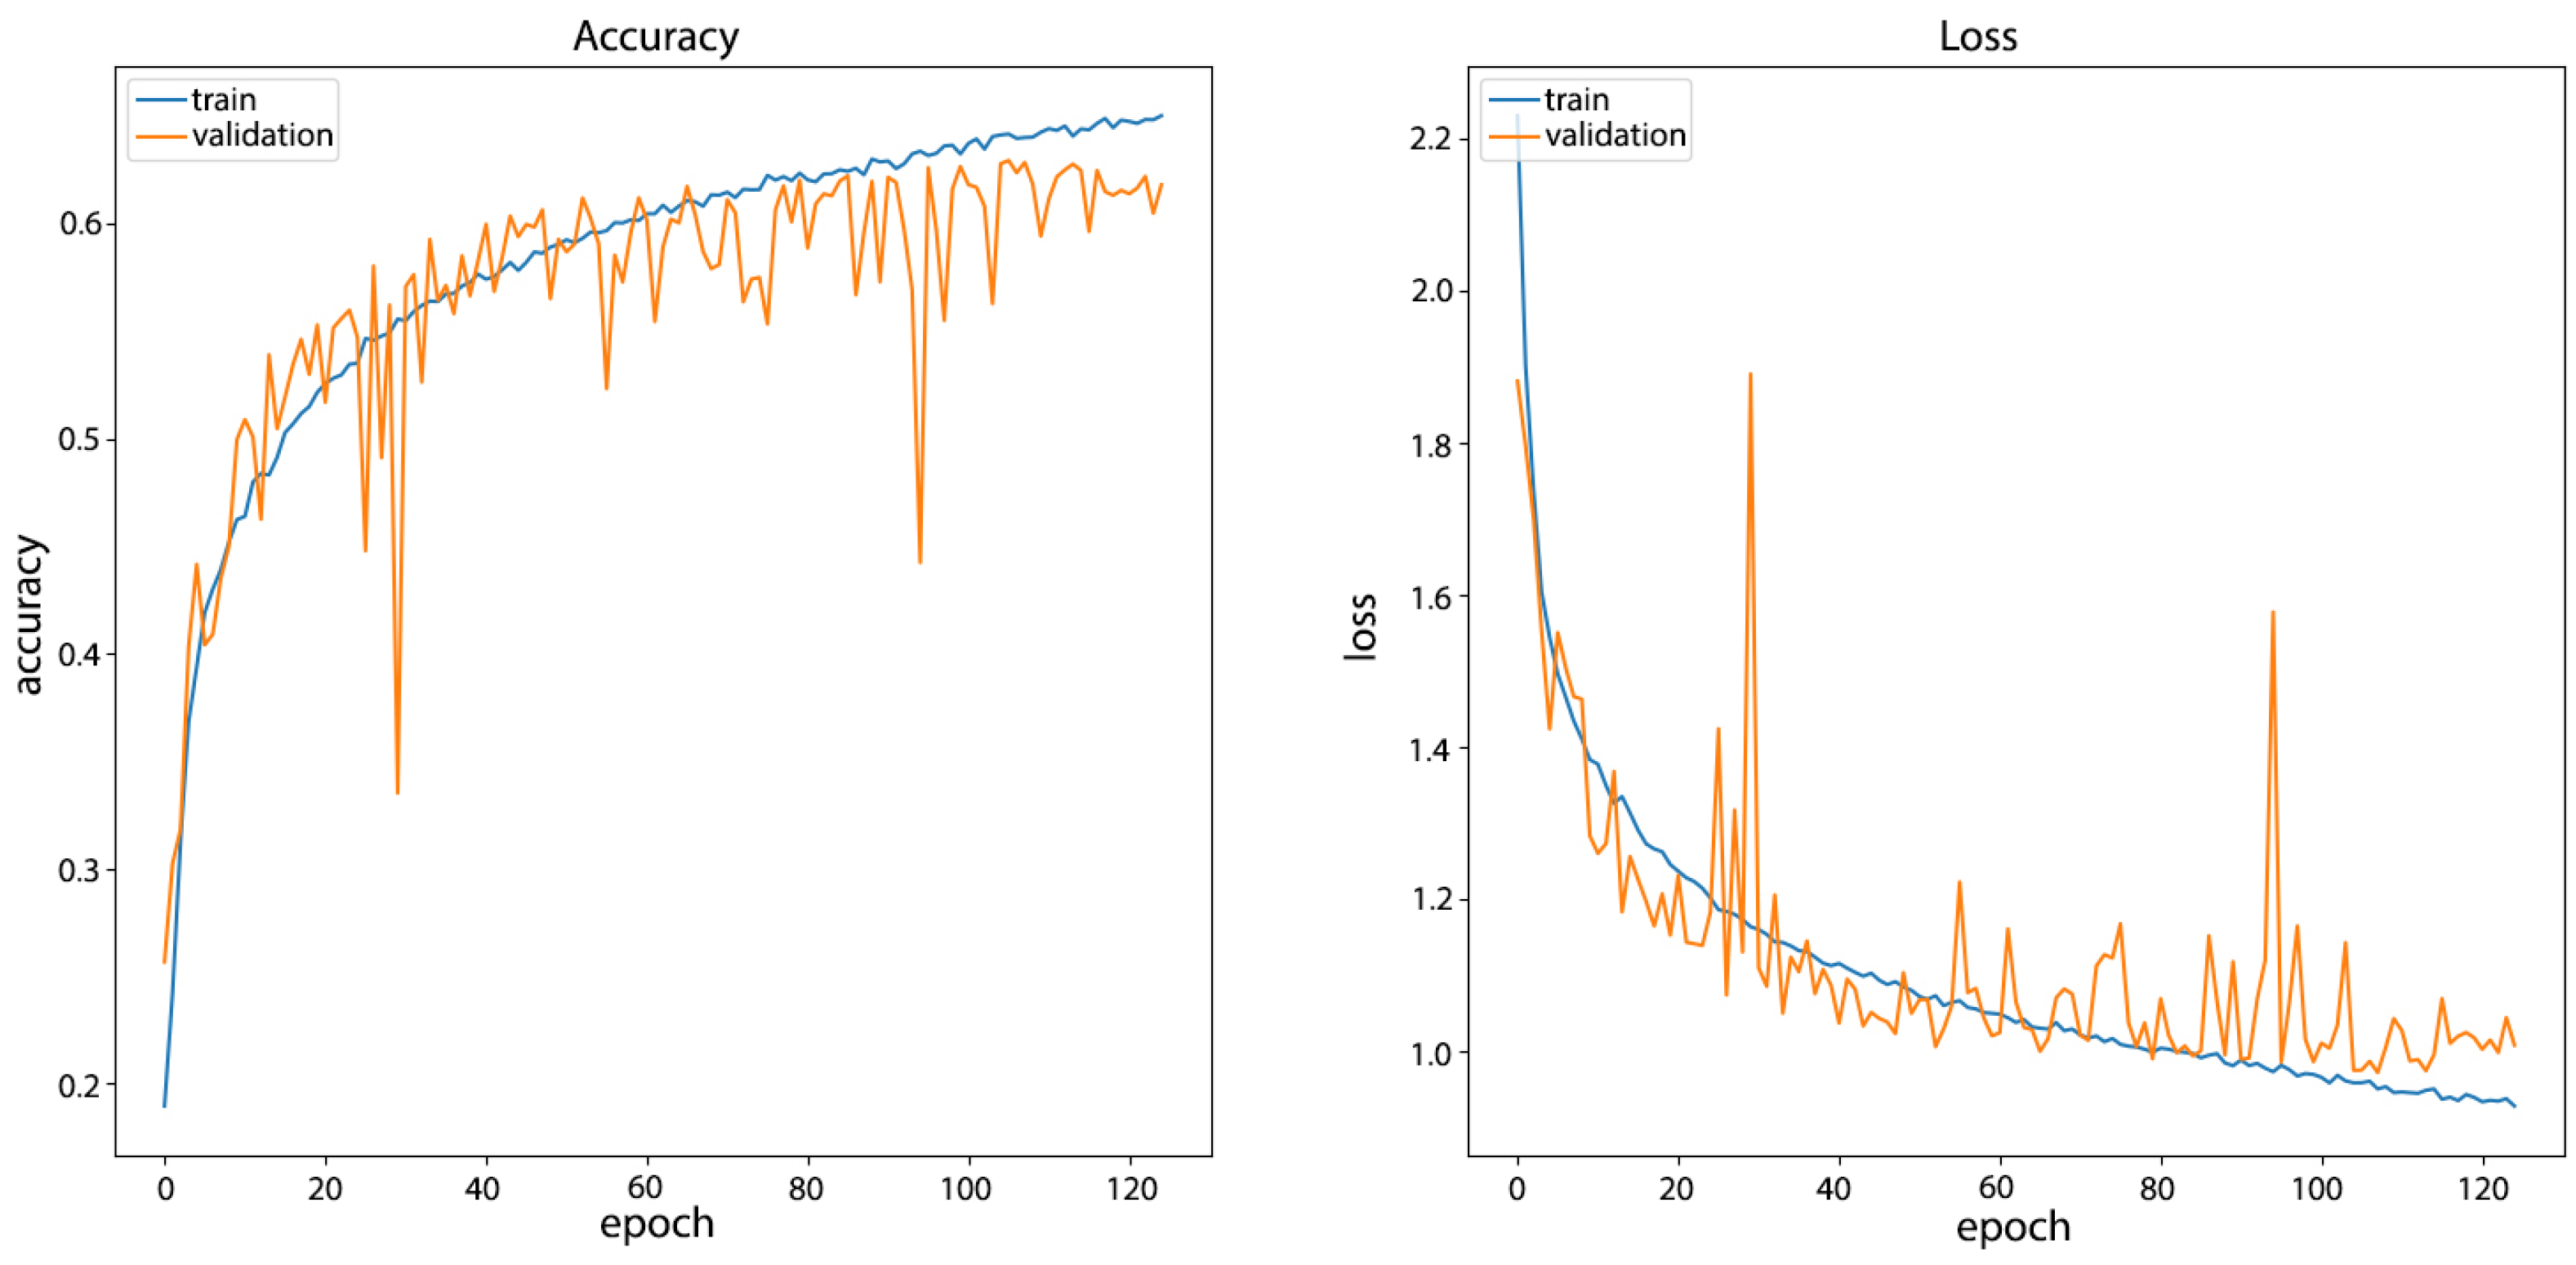
The training of the network on the FairFace filtered dataset (Model_F2) was nine hours and the network had a final accuracy on the training data set of 70.72% with an accuracy on the validation set of 61.84%. In addition, from the graph shown in Figure 8, it can be seen that the curves of the sets are similar, which shows the relatively small difference in accuracy. This validation shows that increasing the number of ethnicity classes negatively affects network performance in training for ethnicity classification. Next, training on the datasets with plotted landmarks will show how the use of face landmarks impacts the results.
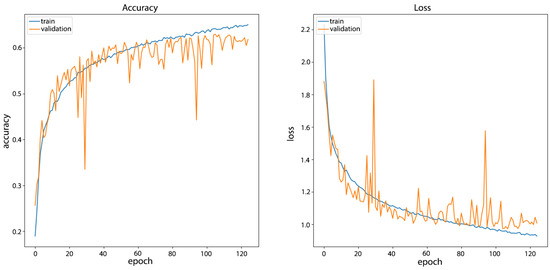
Figure 8.
CNN Model_F2 training results on FairFace filtered dataset without plotted landmarks.
Models with plotted landmarks. In models trained on images with plotted landmarks, the emphasis is on the area of the face around the nose and eyes, the same as in previous models. The landmarks are characteristic points on human face. The landmarks used in this research are the ones commonly used in face recognition and ethnicity classification research. One of the problems that often reduce the performance of ethnicity classification systems is the errors in landmark positioning. The idea of adding landmark annotations was to make it easier for convolutional layer filters, and thus networks, to detect and recognize facial landmarks that are important in ethnicity classification and see if it will help the CNN to achieve a better accuracy. Landmarks are added to images by simply annotating the significant landmarks.
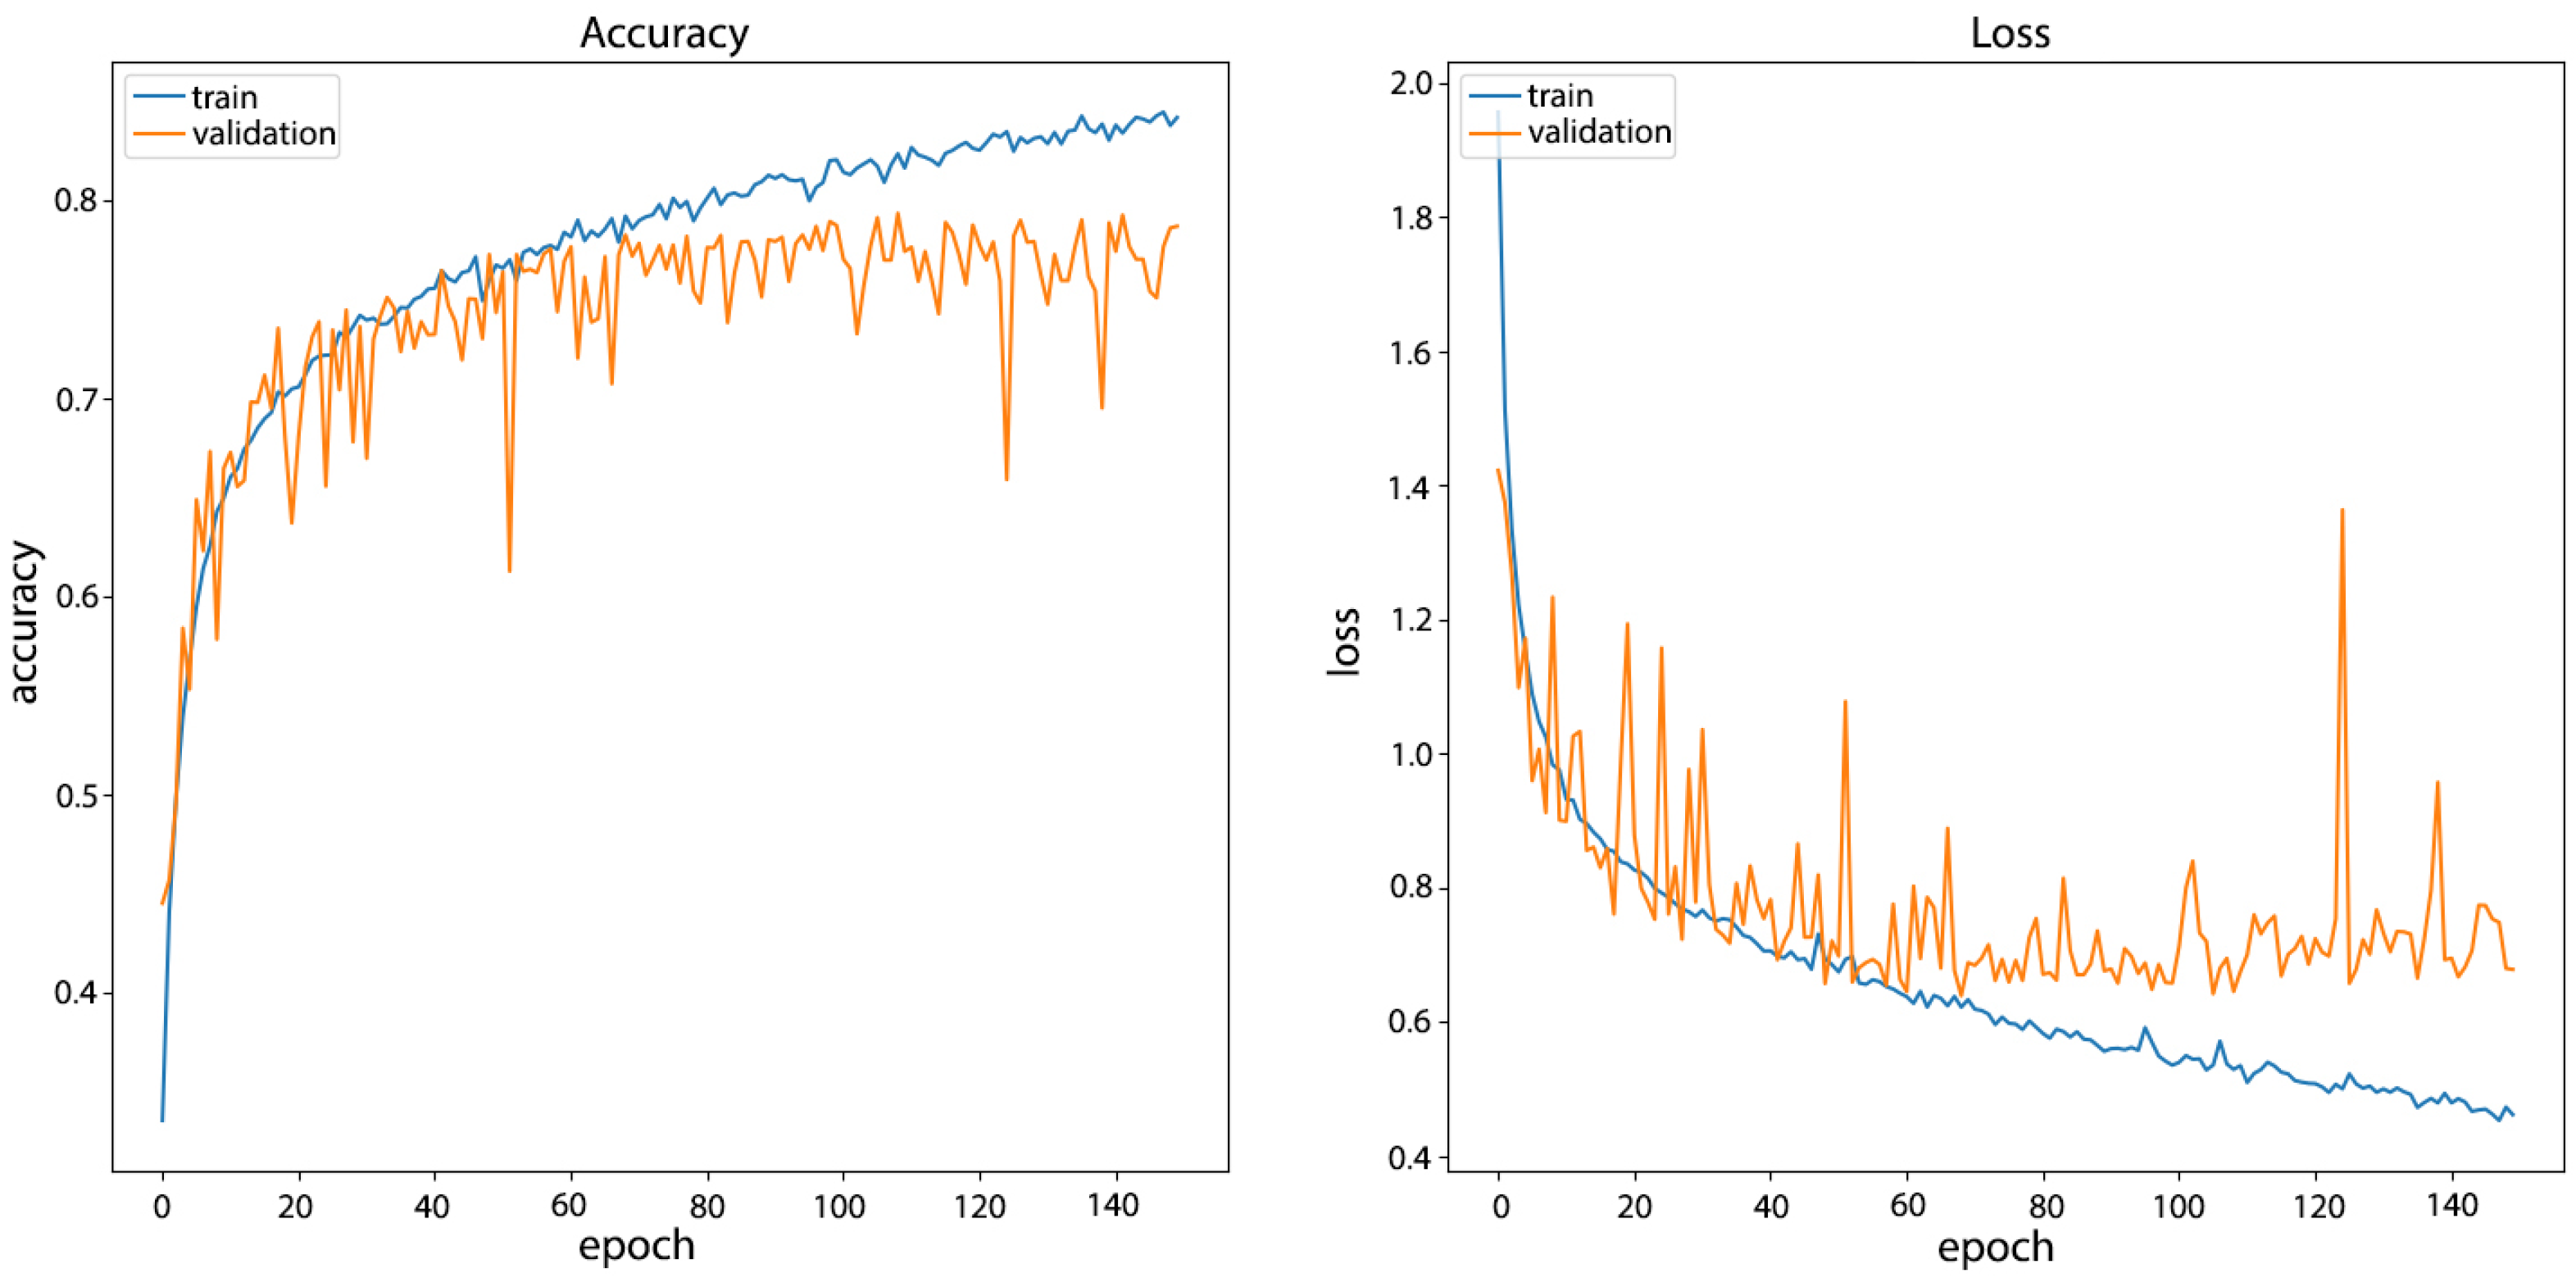
The results of training and validation on UTKFace filtered datasets can be seen in Figure 9 and training and validation results on FairFace filtered dataset can be seen in Figure 10.

Figure 9.
CNN Model_F3 training results on UTKFace filtered dataset with plotted landmarks.
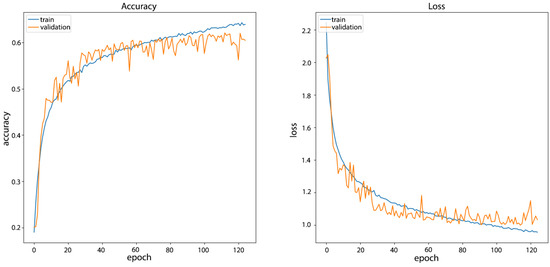
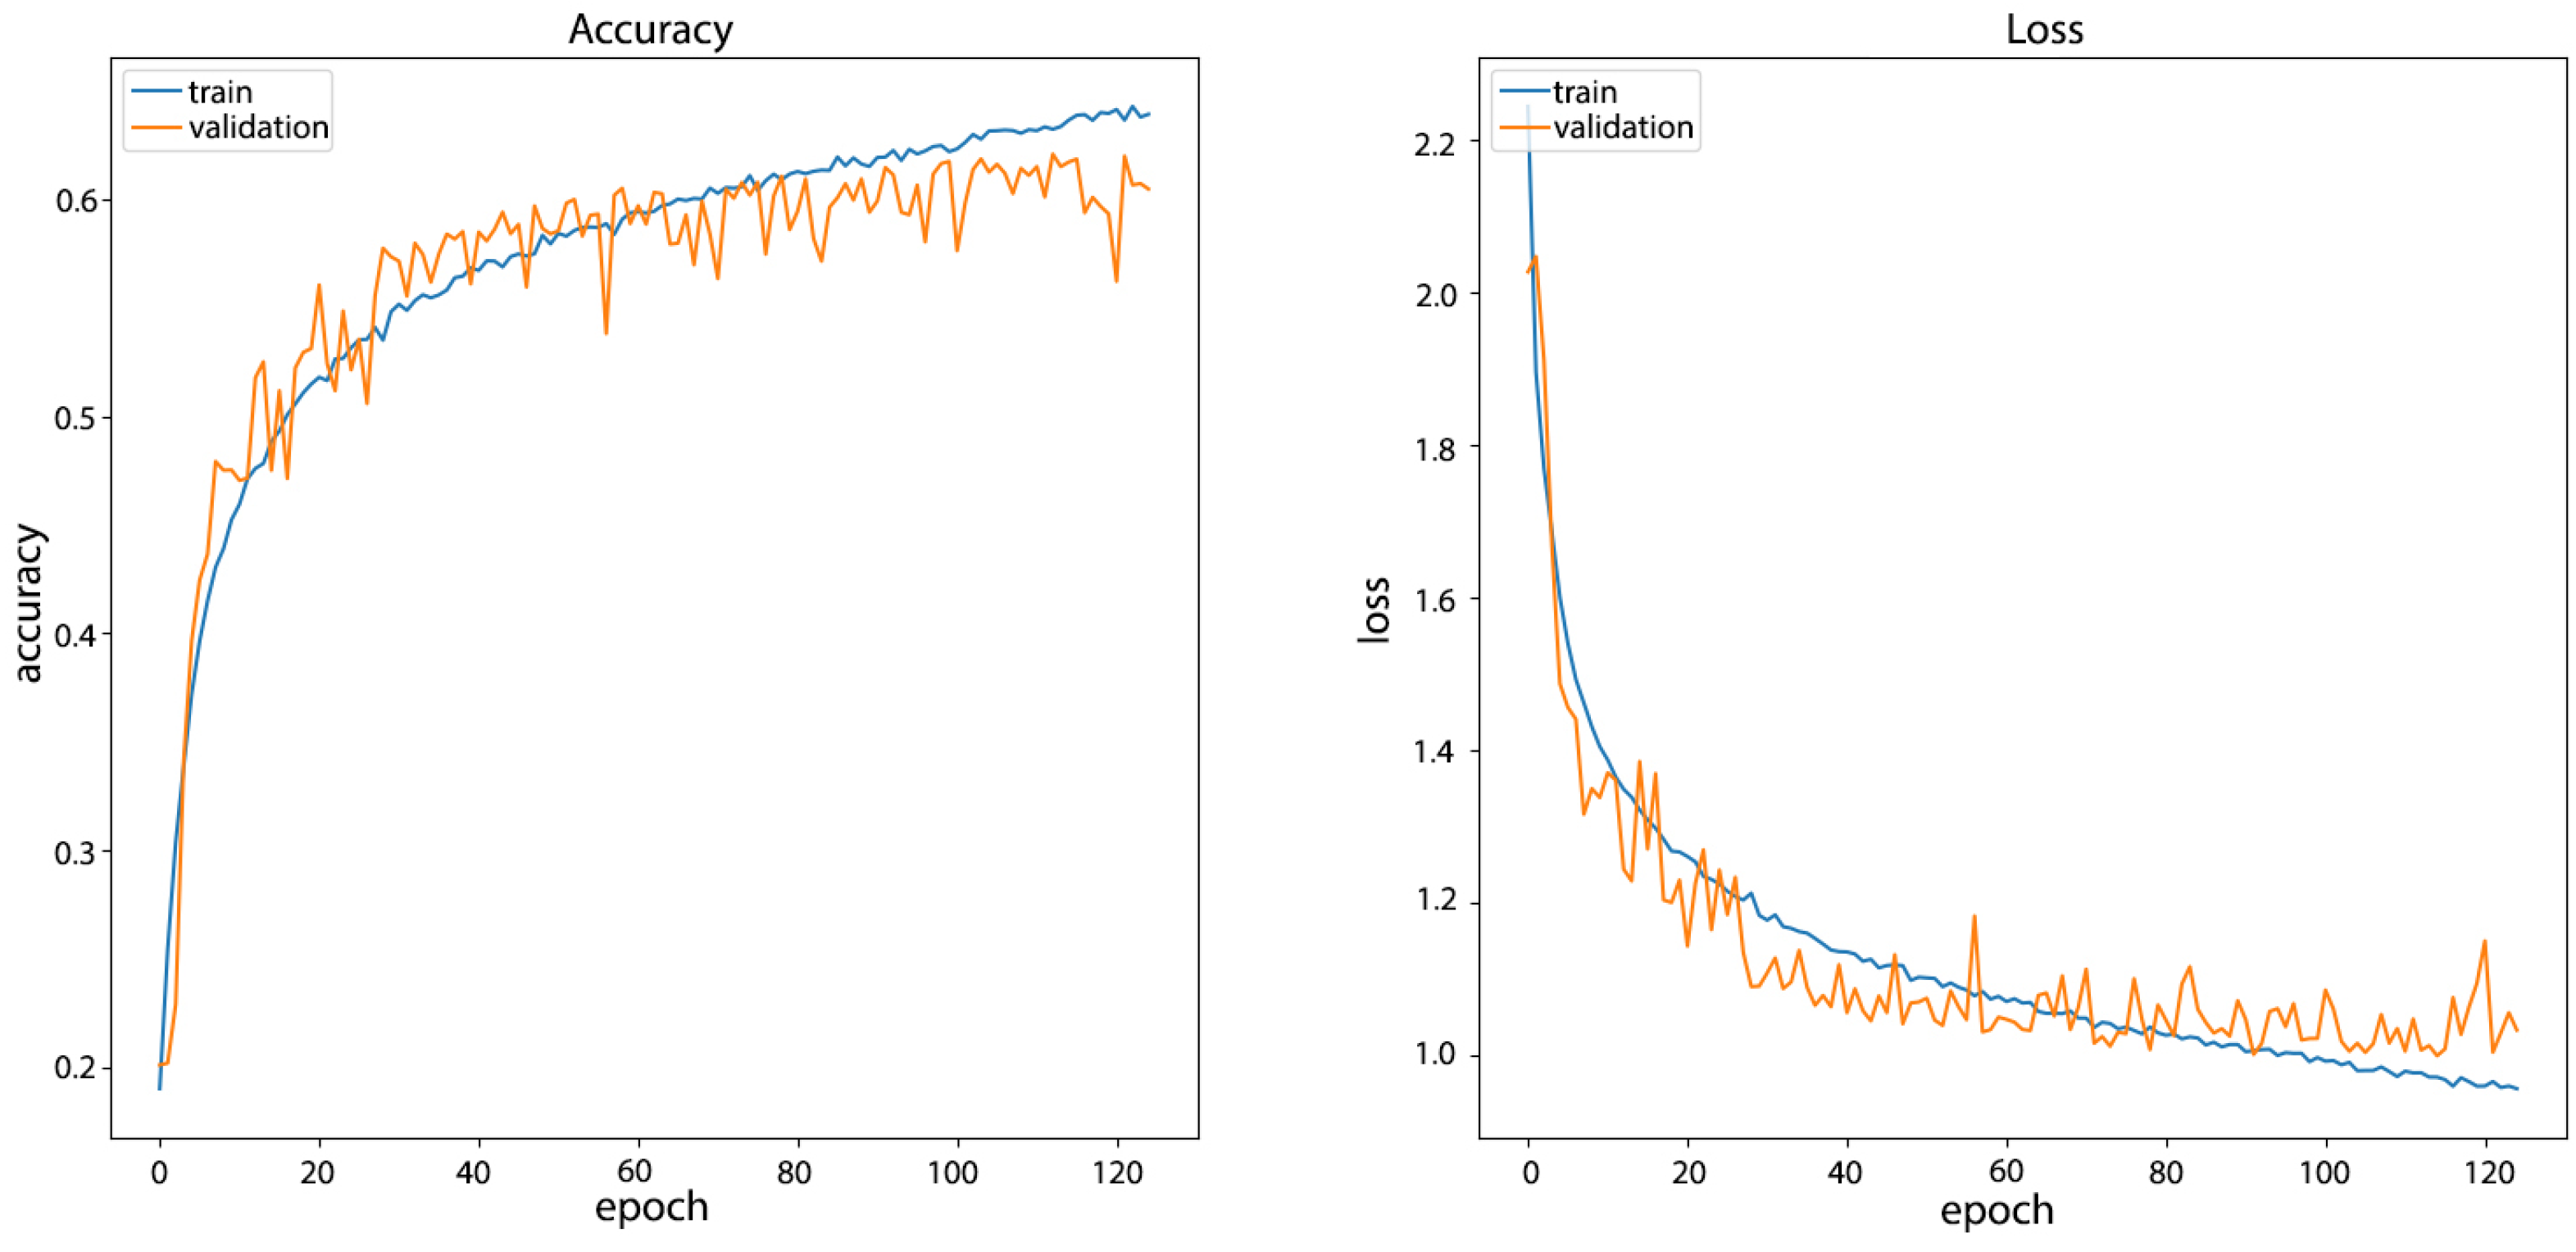
Figure 10.
CNN Model_F4 training results on FairFace filtered dataset with plotted landmarks.
It can be seen that the network showed slightly lower performance at the validation set during training with a slightly slower growth in the accuracy of the training set as at sets without plotted landmarks. In terms of comparison with the UTKFace filtered set, the final results showed an accuracy of 88.67% on the training set (versus 89.78% without plotted landmarks) and 78.71% on the validation set (versus 78.60%).
In training the FairFace filtered dataset with plotted landmarks, the results showed an accuracy of 70.24% on the training set (versus 70.72% without plotted landmarks) and 60.46% on the validation set (versus 61.84% without plotted landmarks).
The training and validation results of CNNs trained on UTKFace filtered and FairFace filtered datasets (Table 7), with and without plotted landmarks show there are no significant differences in the results, but the final conclusion will be given after experiments on the test set.
Table 7.
Comparison of training and validation results on UTKFace filtered and FairFace filtered dataset.
4.2.2. Results and Discussion
As mentioned in the previous section, in order to test the model performance, a holdout method was used where 25% of the images (4564 images of UTKFace filtered dataset and 13,846 images of FairFace filtered dataset) were used for testing. Those were the images that were not used in training and validation. The distribution of images by ethnicity in both test sets can be seen in Table 8 and Table 9.
Table 8.
Distribution of images by ethnicity in the UTKFace filtered testing set.
Table 9.
Distribution of images by ethnicity in the FairFace filtered testing set.
At the validation step of this experiment, Accuracy was calculated, but Accuracy may not always be a good measure, especially if the dataset is not completely balanced, as is the case with UTKFace filtered test set. To do a comprehensive testing, confusion matrix for each test is calculated, where ethnicity labels from the datasets serve as ground truth values, and for each class, Precision, Recall and F1-score are calculated. As stated earlier, Accuracy is the probability that the model prediction is correct. F1-score is a harmonic mean of Precision and Recall, calculated as [53]:
where Precision is the proportion of positive cases that were correctly identified and Recall is a proportion of actual positive cases which are correctly identified. For the final models global performance evaluation, accuracy and weighted F1-score, which takes into account the weights of each class, are calculated.
During training, four CNN models were trained and validated and will be used for testing in this section. The first two models were trained and validated on images without plotted landmarks, where the first one (Model_F1) used images from UTKFace filtered dataset and the second (Model_F2) used images from FairFace filtered dataset. The second two models, Model_F3 and Model_F4 were trained and validated on images with plotted landmarks from UTKFace filtered dataset and FairFace filtered dataset, respectively.
Models without plotted landmarks. Model_F1 was trained and validated on the UTKFace filtered dataset and no landmarks were plotted on the images. The testing was conducted on 4564 images randomly selected for testing (which were not a part of the training or validation sets). Based on the obtained results, a confusion matrix was created (Table 10).
Table 10.
Confusion matrix for the UTKFace filtered testing without plotted landmarks.
From the confusion matrix, different performance measures were calculated. The performance measures of each ethnicity class can be seen in Table 11. For each ethnicity class, the Precision, Recall and F1-score were calculated.
Table 11.
Results for the UTKFace filtered testing without plotted landmarks.
Model_F2 was trained and validated on the FairFace filtered dataset and no landmarks were plotted on the images. The testing was conducted on 13,846 images. A confusion matrix was created from the test results (Table 12).
Table 12.
Confusion matrix for the FairFace filtered testing without plotted landmarks.
As in the first test, performance measures were calculated from the confusion matrix and detailed performance measures of each ethnicity class can be seen in Table 13.
Table 13.
Results for the FairFace filtered testing without plotted landmarks.
Models with plotted landmarks. The third model (Model_F3) was trained and validated on the UTKFace filtered dataset, but for this model, landmarks were plotted on the images. The testing was conducted on 4564 images and confusion matrix was created (Table 14).
Table 14.
Confusion matrix for the UTKFace filtered testing with plotted landmarks.
In order to compare the models with and without plotted landmarks, the same performance measures for each ethnicity class were calculated (Table 15). If we analyze the results of all performance measures on the same test set but with and without plotted landmarks, we reach similar conclusions as those after training and validation, and that is that there are no significant differences in performance (Precision, Recall, F1-score) between the approaches that plot the landmarks and those that do not on UTKFace filtered dataset. In addition, the models that use plotted landmarks require an additional step for landmark annotation which makes them more complex but do not yield better results.
Table 15.
Results for the UTKFace filtered testing with plotted landmarks.
The last model (Model_F4) was trained and validated on the FairFace filtered dataset and landmarks were plotted on the images. The testing was conducted on 13,846 images and based on the results, a confusion matrix was created (Table 16).
Table 16.
Confusion matrix for the FairFace filtered testing with plotted landmarks.
Similar to the last test, to compare the models with and without plotted landmarks on FairFace filtered dataset, the same performance measures for each ethnicity class were calculated (Table 17). The results for seven class classification on FairFace filtered dataset gives the same conclusions and it is that there are no significant differences if landmarks are plotted on images.
Table 17.
Results for the FairFace filtered testing with plotted landmarks.
At the end of testing, performance measures for each model are calculated. To this end, Accuracy and Weighted F1-score are used. The comparison of model performance can be seen in Table 18. As mentioned earlier, there are no significant differences in performance of the models with and without plotted landmarks; moreover, the models without plotted landmarks have slightly better performance than those with plotted landmarks. However, through development and training of different models, it has been noticed that employing plotted landmarks could yield “smoother” loss values while training (which is noticeable comparing Figure 8 and Figure 10) which in turn could yield better results over a longer network training period. Still, this remains a hypothesis that should be tested in future research. The model for classification into five ethnicities (White, Black, Asian, Indian and Other) without plotted landmarks has an accuracy of 80.34%, while the model for classification into the same five ethnicities but with plotted landmarks has an accuracy of 79.97%. It is similar if weighted F1-score is compared, which is 79.40% for five ethnicity classes without plotted landmarks and 78.32% with plotted landmarks. If the models for classification into seven ethnicity classes (White, Black, Latin, Indian, Middle Eastern, East Asian and Southeast Asian) are compared, the accuracy without plotted landmarks is 61.74% versus 60.52% with landmarks plotted. Similar, the weighted F1-score without plotted landmarks is 61.77% and with plotted landmarks 60.28%.
Table 18.
Comparison of testing results on UTKFace filtered and FairFace filtered dataset.
Other than accuracy results, we also compared time and resources necessary for the proposed approach. Comparing required disk space for storing the datasets showed that converted images used up to 50% less space. It also showed that plotting the images with landmarks required more space than just the conversion did. After the datasets were converted into numpy arrays, that were used in training, this difference became even more prominent because it started measuring in gigabytes—the UTK Filtered training set array was 4.36 GB for 200 × 200 px pictures, while cropped pictures required only 1.34 GB. This reduced size allowed us to comfortably fit the training set directly into memory of the training computer, which in turn mitigated the need to load our datasets from disk. Reduced size of the images also contributed to faster training times. We were able to test this on the UTKFace filtered dataset which has shown that the time required for training one epoch reduced tenfold—from about 250 s of training per epoch on 200 × 200 px images to average of 24 s on the converted sets.
4.3. Comparison of the Results with State-of-the-Art
As mentioned in previous sections, comparison between different CNN methods for ethnicity classification is difficult because of several factors, most prominent being: different ethnicity classes and different datasets used for testing. Table 19 shows the accuracy of the reviewed ethnicity classification methods using CNNs.
Table 19.
Accuracy of state-of-the-art models for ethnicity classification.
There are three papers that tested their CNNs on the UTKFace dataset, but only one of the papers [19] used all ethnicity categories from the dataset. Other two papers [20,24] dropped the ethnicity category Other. The paper by Hamdi and Moussaoui [19] tested different CNNs and reported the best accuracy of 78.88% on the UTKFace dataset, while the approach proposed in this paper reports the accuracy of 80.34%. In addition, it is important to note that results in this paper are obtained by using only a part of the face, which significantly reduces the time and resources necessary for image preprocessing, training and testing the CNNs and, as it can be seen, the obtained accuracy does not suffer.
5. Future Work
Future research will focus on improving the behavior of the network and improving the performance of the model with applying transfer learning, which takes an already trained version of popular models such as VGG-16 as a base model. Another way to improve the CNN performance is to combine multiple neural networks into one. A comprehensive recommendation for future research on ethnicity classification based on facial images would be to use CNN networks with the application of transfer learning over one of the proven good models for facial recognition. For training, a balanced data set of selected ethnicity classes should be built (select ethnicities whose representation covers the largest part of the world population according to the literature), and the aim would be to further examine the influence of landmarks on ethnicity classification and better facial image recognition. Future work will also focus on training the network on larger datasets and with more epochs and on conducting more extensive experiments with Batch Normalization and Dropout and their influence on the time and resources needed for training and testing.
6. Conclusions
This paper deals with the problem of classification of persons according to ethnicity based on facial images. The results of ethnicity classification both with and without plotted landmarks were analysed and compared. In order to determine the initial ability of landmarks in ethnicity classification, previous research on this topic has been studied, which has shown sufficient differences in the characteristic features of persons between different ethnicity classes to distinguish them. Accordingly, and with the observed increasing trend of using neural networks to solve this and related problems, neural networks were selected as the main driver of research in this paper.
The scientific contribution of the paper can be seen in the development of a new CNN for ethnicity classification into five ethnicities (White, Black, Asian, Indian and Others) and seven ethnicities (White, Black, Latin, East Asian, Southeast Asian, Indian and Middle Eastern) using only the middle part of the face. The area of the face around the nose and eyes has been observed to contain the most visual data that allows successful ethnicity classification. Therefore, processing only that part of the face allows smaller resource consumption while the accuracy (80.34% on the UTKFace) is still slightly better than in the state-of-the-art using the whole face (78.88% on the UTKFace dataset). The developed CNN has been tested using holdout method on two different datasets (UTKFace and FairFace) and the results are compared with state-of-the-art methods which shows an improvement in accuracy, while decreasing preprocessing and training time. Landmarks were applied to deep neural networks (CNNs) which showed no significant differences in the results of CNN networks, but only increased the time and resources necessary for image preprocessing, training and testing the CNNs.
The importance of ethnicity classification can also be seen in wide and varied application areas [5,55,56]: (i) medicine, (ii) security and surveillance, (iii) marketing, (iv) biometrics, (v) human computer interaction, (vi) fashion. In medicine, ethnicity information can be important for understanding health issues and diagnosis and treatment of conditions with specific responses in organisms of different races. Security and surveillance often focus on finding different people (suspects, victims, missing persons) in video surveillance or databases and ethnicity classification helps to narrow down the search and possible matches and to eliminate persons based on their soft biometrics. In marketing, ethnicity classification can aid ad targeting and market research and can be used to better understand the customers habits. Ethnicity classification on human computer interaction can help provide users “ethnically adequate services, and thus avoiding the possibility of being offended by cultural taboos” [5]. Another rising application area is fashion, where the concept of visagism emerged. The idea behind this concept is to find appropriate accessories, makeup or hair colors which can highlight face features and ethnicity is an important factor in those systems.
Author Contributions
Conceptualization, D.B. and P.G.; methodology, D.B. and P.G.; software, D.B.; validation, D.B. and P.G.; formal analysis, D.B. and P.G.; investigation, D.B.; resources, P.G. and I.T.; data curation, D.B.; writing—original draft preparation, D.B. and P.G.; writing—review and editing, P.G. and I.T.; visualization, D.B., P.G. and I.T.; supervision, P.G.; project administration, P.G. All authors have read and agreed to the published version of the manuscript.
Funding
This research was funded by the project “Development of CSTI platform for retrieval and analysis of structured and unstructured data”. The project received funding from the European Regional Development Fund through OP Competitiveness and Cohesion 2014–2020 within the Call for Proposals “Development of the products and services arising from research and development activities—Phase II”, under grant number KK.01.2.1.02.0310.
Institutional Review Board Statement
Not applicable.
Informed Consent Statement
Not applicable.
Data Availability Statement
Not applicable.
Conflicts of Interest
The authors declare no conflict of interest.
References
- Tomičić, I.; Grd, P.; Bača, M. A review of soft biometrics for IoT. In Proceedings of the 2018 41st International Convention on Information and Communication Technology, Electronics and Microelectronics (MIPRO), Opatija, Croatia, 21–25 May 2018; pp. 1115–1120. [Google Scholar] [CrossRef]
- Mezzoudj, S.B.A.; Seghir, R. What Else Does Your Biometric Data Reveal? A Survey on Soft Biometrics. Multimed. Tools Appl. 2016, 11, 441–467. [Google Scholar]
- Reid, D.A.; Nixon, M.S.; Stevenage, S.V. Towards large-scale face-based race classification on spark framework. IEEE Trans. Pattern Anal. Mach. Intell. 2019, 78, 26729–26746. [Google Scholar] [CrossRef]
- Školski Rječnik Hrvatskoga Jezika. Available online: https://rjecnik.hr/search/?strict=yes&q=rasa (accessed on 14 September 2021).
- Darabant, A.S.; Borza, D.; Danescu, R. Recognizing Human Races through Machine Learning—A Multi-Network, Multi-Features Study. Mathematics 2021, 9, 195. [Google Scholar] [CrossRef]
- Becerra-Riera, F.; Llanes, N.M.; Morales-González, A.; Méndez-Vázquez, H.; Tistarelli, M. On Combining Face Local Appearance and Geometrical Features for Race Classification. In Progress in Pattern Recognition, Image Analysis, Computer Vision, and Applications; Springer International Publishing: Cham, Switzerland, 2019; pp. 567–574. [Google Scholar]
- Fu, S.; He, H.; Hou, Z.G. Learning Race from Face: A Survey. IEEE Trans. Pattern Anal. Mach. Intell. 2014, 36, 2483–2509. [Google Scholar] [CrossRef] [Green Version]
- Heng, Z.; Dipu, M.; Yap, K.H. Hybrid Supervised Deep Learning for Ethnicity Classification using Face Images. In Proceedings of the 2018 IEEE International Symposium on Circuits and Systems (ISCAS), Florence, Italy, 27–30 May 2018; pp. 1–5. [Google Scholar] [CrossRef]
- Lu, X.; Jain, A.K. Ethnicity Identification from Face Images. In Biometric Technology for Human Identification; International Society for Optics and Photonics; SPIE: Bellingham, WA, USA, 2004; Volume 5404, pp. 114–123. [Google Scholar] [CrossRef]
- Kelly, D.J.; Quinn, P.C.; Slater, A.M.; Lee, K.; Ge, L.; Pascalis, O. The Other-Race Effect Develops During Infancy. Psychol. Sci. 2007, 18, 1084–1089. [Google Scholar] [CrossRef] [PubMed] [Green Version]
- Greco, A.; Percannella, G.; Vento, M.; Vigilante, V. Benchmarking deep network architectures for ethnicity recognition using a new large face dataset. Mach. Vis. Appl. 2020, 31, 1–31. [Google Scholar] [CrossRef]
- Anwar, I.; Islam, N.U. Learned Features are Better for Ethnicity Classification. Cybern. Inf. Technol. 2017, 17, 152–164. [Google Scholar] [CrossRef] [Green Version]
- Mohammad, A.S.; Al-Ani, J.A. Convolutional Neural Network for Ethnicity Classification using Ocular Region in Mobile Environment. In Proceedings of the 2018 10th Computer Science and Electronic Engineering (CEEC), Colchester, UK, 19–21 September 2018; pp. 293–298. [Google Scholar] [CrossRef]
- Grd, P. A Survey on Neural Networks for Face Age Estimation. In Proceedings of the 32nd Central European Conference on Information and Intelligent Systems, Varazdin, Croatia, 13–15 October 2021; pp. 219–227. [Google Scholar]
- Duan, M.; Li, K.; Yang, C.; Li, K. A hybrid deep learning CNN–ELM for age and gender classification. Neurocomputing 2018, 275, 448–461. [Google Scholar] [CrossRef]
- Wang, W.; He, F.; Zhao, Q. Facial Ethnicity Classification with Deep Convolutional Neural Networks. In Biometric Recognition; Springer International Publishing: Cham, Switzerland, 2016; pp. 176–185. [Google Scholar]
- Srinivas, N.; Atwal, H.; Rose, D.C.; Mahalingam, G.; Ricanek, K.; Bolme, D.S. Age, Gender, and Fine-Grained Ethnicity Prediction Using Convolutional Neural Networks for the East Asian Face Dataset. In Proceedings of the 2017 12th IEEE International Conference on Automatic Face Gesture Recognition (FG 2017), Washington, DC, USA, 30 May–3 June 2017; pp. 953–960. [Google Scholar] [CrossRef]
- Khan, K.; Khan, R.U.; Ali, J.; Uddin, I.; Khan, S.; Roh, B.H. Race Classification Using Deep Learning. Comput. Mater. Contin. 2021, 68, 3483–3498. [Google Scholar] [CrossRef]
- Hamdi, S.; Moussaoui, A. Comparative study between machine and deep learning methods for age, gender and ethnicity identification. In Proceedings of the 2020 4th International Symposium on Informatics and its Applications (ISIA), M’sila, Algeria, 15–16 December 2020; pp. 1–6. [Google Scholar] [CrossRef]
- Ahmed, M.A.; Choudhury, R.D.; Kashyap, K. Race estimation with deep networks. J. King Saud Univ.-Comput. Inf. Sci. 2020. [Google Scholar] [CrossRef]
- Baig, T.I.; Alam, T.M.; Anjum, T.; Naseer, S.; Wahab, A.; Imtiaz, M.; Raza, M.M. Classification of Human Face: Asian and Non-Asian People. In Proceedings of the 2019 International Conference on Innovative Computing (ICIC), Seoul, Korea, 26–29 August 2019; pp. 1–6. [Google Scholar] [CrossRef]
- Khan, A.; Mahmoud, M. Considering Race a Problem of Transfer Learning. In Proceedings of the 2019 IEEE Winter Applications of Computer Vision Workshops (WACVW), Village, HI, USA, 7–11 January 2019; pp. 100–106. [Google Scholar]
- Talo, M.; Ay, B.; Makinist, S.; Aydin, G. Bigailab-4race-50K: Race Classification with a New Benchmark Dataset. In Proceedings of the 2018 International Conference on Artificial Intelligence and Data Processing (IDAP), Malatya, Turkey, 28–30 September 2018; pp. 1–4. [Google Scholar] [CrossRef]
- Das, A.; Dantcheva, A.; Brémond, F. Mitigating Bias in Gender, Age and Ethnicity Classification: A Multi-task Convolution Neural Network Approach. In Proceedings of the ECCV Workshops, Munich, Germany, 8–14 September 2018. [Google Scholar]
- Han, H.; Jain, A.K.; Wang, F.; Shan, S.; Chen, X. Heterogeneous Face Attribute Estimation: A Deep Multi-Task Learning Approach. IEEE Trans. Pattern Anal. Mach. Intell. 2018, 40, 2597–2609. [Google Scholar] [CrossRef] [PubMed] [Green Version]
- Masood, S.; Gupta, S.; Wajid, A.; Gupta, S.; Ahmed, M. Prediction of Human Ethnicity from Facial Images Using Neural Networks. In Data Engineering and Intelligent Computing; Springer: Singapore, 2018; pp. 217–226. [Google Scholar]
- Wu, X.; Yuan, P.; Wang, T.; Gao, D.; Cai, Y. Race Classification from Face using Deep Convolutional Neural Networks. In Proceedings of the 2018 3rd International Conference on Advanced Robotics and Mechatronics (ICARM), Sigapore, 18–20 July 2018; pp. 1–6. [Google Scholar] [CrossRef]
- Dalal, N.; Triggs, B. Histograms of oriented gradients for human detection. In Proceedings of the 2005 IEEE Computer Society Conference on Computer Vision and Pattern Recognition (CVPR’05), San Diego, CA, USA, 20–26 June 2005; Volume 1, pp. 886–893. [Google Scholar] [CrossRef] [Green Version]
- Simonyan, K.; Zisserman, A. Very Deep Convolutional Networks for Large-Scale Image Recognition. In Proceedings of the 3rd International Conference on Learning Representations, ICLR, San Diego, CA, USA, 7–9 May 2015. [Google Scholar]
- Li, X.; Chen, S.; Hu, X.; Yang, J. Understanding the Disharmony Between Dropout and Batch Normalization by Variance Shift. In Proceedings of the IEEE/CVF Conference on Computer Vision and Pattern Recognition (CVPR), Long Beach, CA, USA, 15–20 June 2019. [Google Scholar]
- Garbin, C.; Zhu, X.; Marques, O. Dropout vs. Batch Normalization: An Empirical Study of Their Impact to Deep Learning. Multimed. Tools Appl. 2020, 79, 12777–12815. [Google Scholar] [CrossRef]
- Kingma, D.P.; Ba, J. Adam: A Method for Stochastic Optimization. arXiv 2014, arXiv:1412.6980. [Google Scholar]
- Fu, S.Y.; Yang, G.S.; Hou, Z.G. Spiking neural networks based cortex like mechanism: A case study for facial expression recognition. In Proceedings of the 2011 International Joint Conference on Neural Networks, San Jose, CA, USA, 31 July–5 August 2011; pp. 1637–1642. [Google Scholar] [CrossRef]
- Hwang, B.W.; Roh, M.C.; Lee, S.W. Performance evaluation of face recognition algorithms on Asian face database. In Proceedings of the Sixth IEEE International Conference on Automatic Face and Gesture Recognition, Seoul, Korea, 17–19 May 2004; pp. 278–283. [Google Scholar] [CrossRef]
- Gao, W.; Cao, B.; Shan, S.; Chen, X.; Zhou, D.; Zhang, X.; Zhao, D. The CAS-PEAL Large-Scale Chinese Face Database and Baseline Evaluations. IEEE Trans. Syst. Man Cybern.-Part Syst. Hum. 2008, 38, 149–161. [Google Scholar] [CrossRef] [Green Version]
- Bastanfard, A.; Nik, M.A.; Dehshibi, M.M. Iranian Face Database with age, pose and expression. In Proceedings of the 2007 International Conference on Machine Vision, Isalambad, Pakistan, 28–29 December 2007; pp. 50–55. [Google Scholar]
- Thomaz, C.E.; Giraldi, G.A. A new ranking method for principal components analysis and its application to face image analysis. Image Vis. Comput. 2010, 28, 902–913. [Google Scholar] [CrossRef]
- Lyons, M.; Budynek, J.; Akamatsu, S. Automatic classification of single facial images. IEEE Trans. Pattern Anal. Mach. Intell. 1999, 21, 1357–1362. [Google Scholar] [CrossRef] [Green Version]
- Kärkkäinen, K.; Joo, J. FairFace: Face Attribute Dataset for Balanced Race, Gender, and Age for Bias Measurement and Mitigation. In Proceedings of the 2021 IEEE Winter Conference on Applications of Computer Vision (WACV), Waikoloa, HI, USA, 3–8 January 2021; pp. 1547–1557. [Google Scholar] [CrossRef]
- Zhang, Z.; Song, Y.; Qi, H. Age Progression/Regression by Conditional Adversarial Autoencoder. In Proceedings of the 2017 IEEE Conference on Computer Vision and Pattern Recognition (CVPR), Honolulu, HI, USA, 21–26 July 2017; pp. 4352–4360. [Google Scholar]
- Sim, T.; Baker, S.; Bsat, M. The CMU pose, illumination, and expression database. IEEE Trans. Pattern Anal. Mach. Intell. 2003, 25, 1615–1618. [Google Scholar] [CrossRef] [Green Version]
- Riccio, D.; Tortora, G.; Marsico, M.D.; Wechsler, H. EGA—Ethnicity, gender and age, a pre-annotated face database. In Proceedings of the 2012 IEEE Workshop on Biometric Measurements and Systems for Security and Medical Applications (BIOMS), Salerno, Italy, 14 September 2012; pp. 1–8. [Google Scholar]
- Kumar, N.; Berg, A.; Belhumeur, P.N.; Nayar, S. Describable Visual Attributes for Face Verification and Image Search. IEEE Trans. Pattern Anal. Mach. Intell. 2011, 33, 1962–1977. [Google Scholar] [CrossRef] [Green Version]
- Ricanek, K.; Tesafaye, T. MORPH: A longitudinal image database of normal adult age-progression. In Proceedings of the 7th International Conference on Automatic Face and Gesture Recognition (FGR06), Southampton, UK, 10–12 April 2006; pp. 341–345. [Google Scholar] [CrossRef]
- Phillips, P.J.; Rauss, P.J.; Der, S.Z. FERET (Face Recognition Technology) Recognition Algorithm Development and Test Results; Army Research Laboratory: Adelphi, MD, USA, 1996. [Google Scholar]
- Liu, Z.; Luo, P.; Wang, X.; Tang, X. Deep Learning Face Attributes in the Wild. In Proceedings of the 2015 IEEE International Conference on Computer Vision (ICCV), Santiago, Chile, 7–13 December 2015; pp. 3730–3738. [Google Scholar]
- Ma, D.S.; Correll, J.; Wittenbrink, B. The Chicago face database: A free stimulus set of faces and norming data. Behav. Res. Methods 2015, 47, 1122–1135. [Google Scholar] [CrossRef] [Green Version]
- Phillips, P.J.; Flynn, P.J.; Scruggs, T.; Bowyer, K.W.; Chang, J.; Hoffman, K.; Marques, J.; Jaesik, M.; Worek, W. Overview of the face recognition grand challenge. In Proceedings of the 2005 IEEE Computer Society Conference on Computer Vision and Pattern Recognition (CVPR’05), San Diego, CA, USA, 20–25 June 2005; Volume 1, pp. 947–954. [Google Scholar]
- Lobue, V.; Thrasher, C. The Child Affective Facial Expression (CAFE) set: Validity and reliability from untrained adults. Front. Psychol. 2015, 5, 1532. [Google Scholar] [CrossRef]
- dlib C++ Library. Available online: http://dlib.net/ (accessed on 10 October 2021).
- Opencv-Python: Wrapper Package for OpenCV Python Bindings. Available online: https://github.com/skvark/opencv-python (accessed on 10 October 2021).
- Keras Documentation: Keras API Reference. Available online: https://keras.io/api/ (accessed on 10 October 2021).
- Pedregosa, F.; Varoquaux, G.; Gramfort, A.; Michel, V.; Thirion, B.; Grisel, O.; Blondel, M.; Prettenhofer, P.; Weiss, R.; Dubourg, V.; et al. Scikit-Learn: Machine Learning in Python. J. Mach. Learn. Res. 2011, 12, 2825–2830. [Google Scholar]
- Categorical Crossentropy. Available online: https://peltarion.com/knowledge-center/documentation/modeling-view/build-an-ai-model/loss-functions/categorical-crossentropy (accessed on 12 October 2021).
- Vo, T.; Nguyen, T.; Le, C.T. Race Recognition Using Deep Convolutional Neural Networks. Symmetry 2018, 10, 564. [Google Scholar] [CrossRef] [Green Version]
- Mays, V.M.; Ponce, N.A.; Washington, D.L.; Cochran, S.D. Classification of Race and Ethnicity: Implications for Public Health. Annu. Rev. Public Health 2003, 24, 83–110. [Google Scholar] [CrossRef] [PubMed]


Publisher’s Note: MDPI stays neutral with regard to jurisdictional claims in published maps and institutional affiliations. |
© 2022 by the authors. Licensee MDPI, Basel, Switzerland. This article is an open access article distributed under the terms and conditions of the Creative Commons Attribution (CC BY) license (https://creativecommons.org/licenses/by/4.0/).