Article

Misalignment Detection for Web-Scraped Corpora: A Supervised Regression Approach

1
CrossLang NV, 9050 Gentbrugge, Belgium
2
Independent Data Science Consultant, 9000 Ghent, Belgium
*
Author to whom correspondence should be addressed.
Informatics 2019, 6(3), 35; https://doi.org/10.3390/informatics6030035
Submission received: 30 April 2019 / Revised: 14 August 2019 / Accepted: 29 August 2019 / Published: 1 September 2019
(This article belongs to the Special Issue Advances in Computer-Aided Translation Technology)

Abstract

:
To build state-of-the-art Neural Machine Translation (NMT) systems, high-quality parallel sentences are needed. Typically, large amounts of data are scraped from multilingual web sites and aligned into datasets for training. Many tools exist for automatic alignment of such datasets. However, the quality of the resulting aligned corpus can be disappointing. In this paper, we present a tool for automatic misalignment detection (MAD). We treated the task of determining whether a pair of aligned sentences constitutes a genuine translation as a supervised regression problem. We trained our algorithm on a manually labeled dataset in the FR–NL language pair. Our algorithm used shallow features and features obtained after an initial translation step. We showed that both the Levenshtein distance between the target and the translated source, as well as the cosine distance between sentence embeddings of the source and the target were the two most important features for the task of misalignment detection. Using gold standards for alignment, we demonstrated that our model can increase the quality of alignments in a corpus substantially, reaching a precision close to 100%. Finally, we used our tool to investigate the effect of misalignments on NMT performance.

1. Introduction

A machine translation (MT) system usually increases its performance when more training data is added. Especially in the context of statistical machine translation (SMT), the motto is: “the more data, the better”, e.g., Goutte et al. [1]. However, previous research showed that the performance of a neural machine translation (NMT) system decreases when the training data contains noisy sentence pairs [2,3], as an NMT model tends to assign high probabilities to rare events.
Data crawled from the web typically contains a variety of noise: untranslated sentences, language and encoding errors, short segments, and misalignments. The effect of these types of noise on NMT and SMT was systematically investigated by Khayrallah and Koehn [4]. Untranslated sentences and wrong language in the target were found to harm NMT performance the most, while SMT performance was hardly affected. Misalignments, the focus of this paper, seemed to decrease NMT performance by 1 to 2 BLEU, depending on the amount of misalignments added to a clean corpus, while having almost no effect on SMT performance. In another study, however, it was shown that alignment errors can impact SMT performance as well [5].
Detecting misalignments has been the focus of a large body of research and was tackled by combining bilingual data and automatic classifiers [6], lexical translation and the Jaccard similarity index [7], machine translation [8] or word and sentence embeddings [9,10]. Further, Carpuat et al. [11] introduced the concept of similarity classification by building a supervised classifier using annotations of Cross-Lingual Textual Entailment.
Based on the ideas introduced in References [9,10,11], different neural network architectures that compute cross-lingual sentence similarity scores, after mapping sentences to a (cross-lingual) embedding space, were proposed for the task of misalignment detection and parallel corpus mining [12,13,14,15,16,17,18,19].
In this work, we combined ideas introduced in References [6,7,8,9,10,11] to build a model for misalignment detection. Our work is different than previous studies, as we reformulated the problem of misalignment detection as a supervised regression task, rather than a (unsupervised) classification task. Therefore, we introduced a misalignment detection score (MAD score) and labeled a dataset consisting of parallel and divergent sentence pairs accordingly.
We used our gold standard for misalignment detection to investigate the importance of different features and take into account both shallow features and features obtained after an initial translation step carried out by a baseline NMT system. This translation step is necessary in order to calculate the Levenshtein distance between the target and the translated source, and to calculate cosine distance between the sentence embeddings of the (translated) target and the translated source. We showed that the Levenshtein distance and the cosine distance between sentence embeddings are the two most important features. Next, we evaluated our model against gold standards for alignment (EN–FR and EN–GA language pairs). This intrinsic evaluation showed that our model can increase the quality of alignments in a corpus substantially, reaching a precision close to 100% for both language pairs. Our results were compared to the ones obtained with BiCleaner [20], another tool for misalignment detection used in the official release of the ParaCrawl corpus (https://paracrawl.eu).
Finally, we used our model to investigate the effect of misalignments on NMT performance. Our experiments showed that although removing misalignments can be beneficial in terms of data selection, leaving misalignments in the training data did not result in a decrease in NMT performance.
The aim of this work was not to attain state-of-the-art performance, but to present a methodology for misalignment detection that has the potential to produce easier interpretable scores and which is lightweight enough for practical use.

2. Materials and Methods

The problem of misalignment detection is treated as a supervised regression problem. In this section, we provide more details on the labeled dataset, and introduce a score for misalignment detection (MAD score). Next, we give an overview of the engineered features that are used for misalignment detection. Finally, we describe the data used for intrinsic and extrinsic evaluation.
In order to make the relation between the various datasets and experiments clearer, we provide two schemes. In Figure 1, we illustrate the relation between the various datasets and models. Our model for misalignment detection (https://github.com/CrossLangNV/MAD will be trained on a FR–NL labeled dataset, after which it will be applied on two language pairs (GA–EN and FR–EN). As the calculation of some of the features of our model relies on an initial translation step (GA→EN, FR→EN), MT models were used. We refer to Section 2.2 for an overview of all the features. In Figure 2, we show how our model (MAD) could be used to detect misalignments in an English–Irish (EN–GA) corpus. Applying our model on a pair of sentences yields a score (0–4), indicative of the quality of the suggested alignment. By setting a threshold on this score one obtains a MAD cleaned corpus. We will apply our model both on the EN–GA ParaCrawl corpus, as on a EN–FR web-scraped corpus.

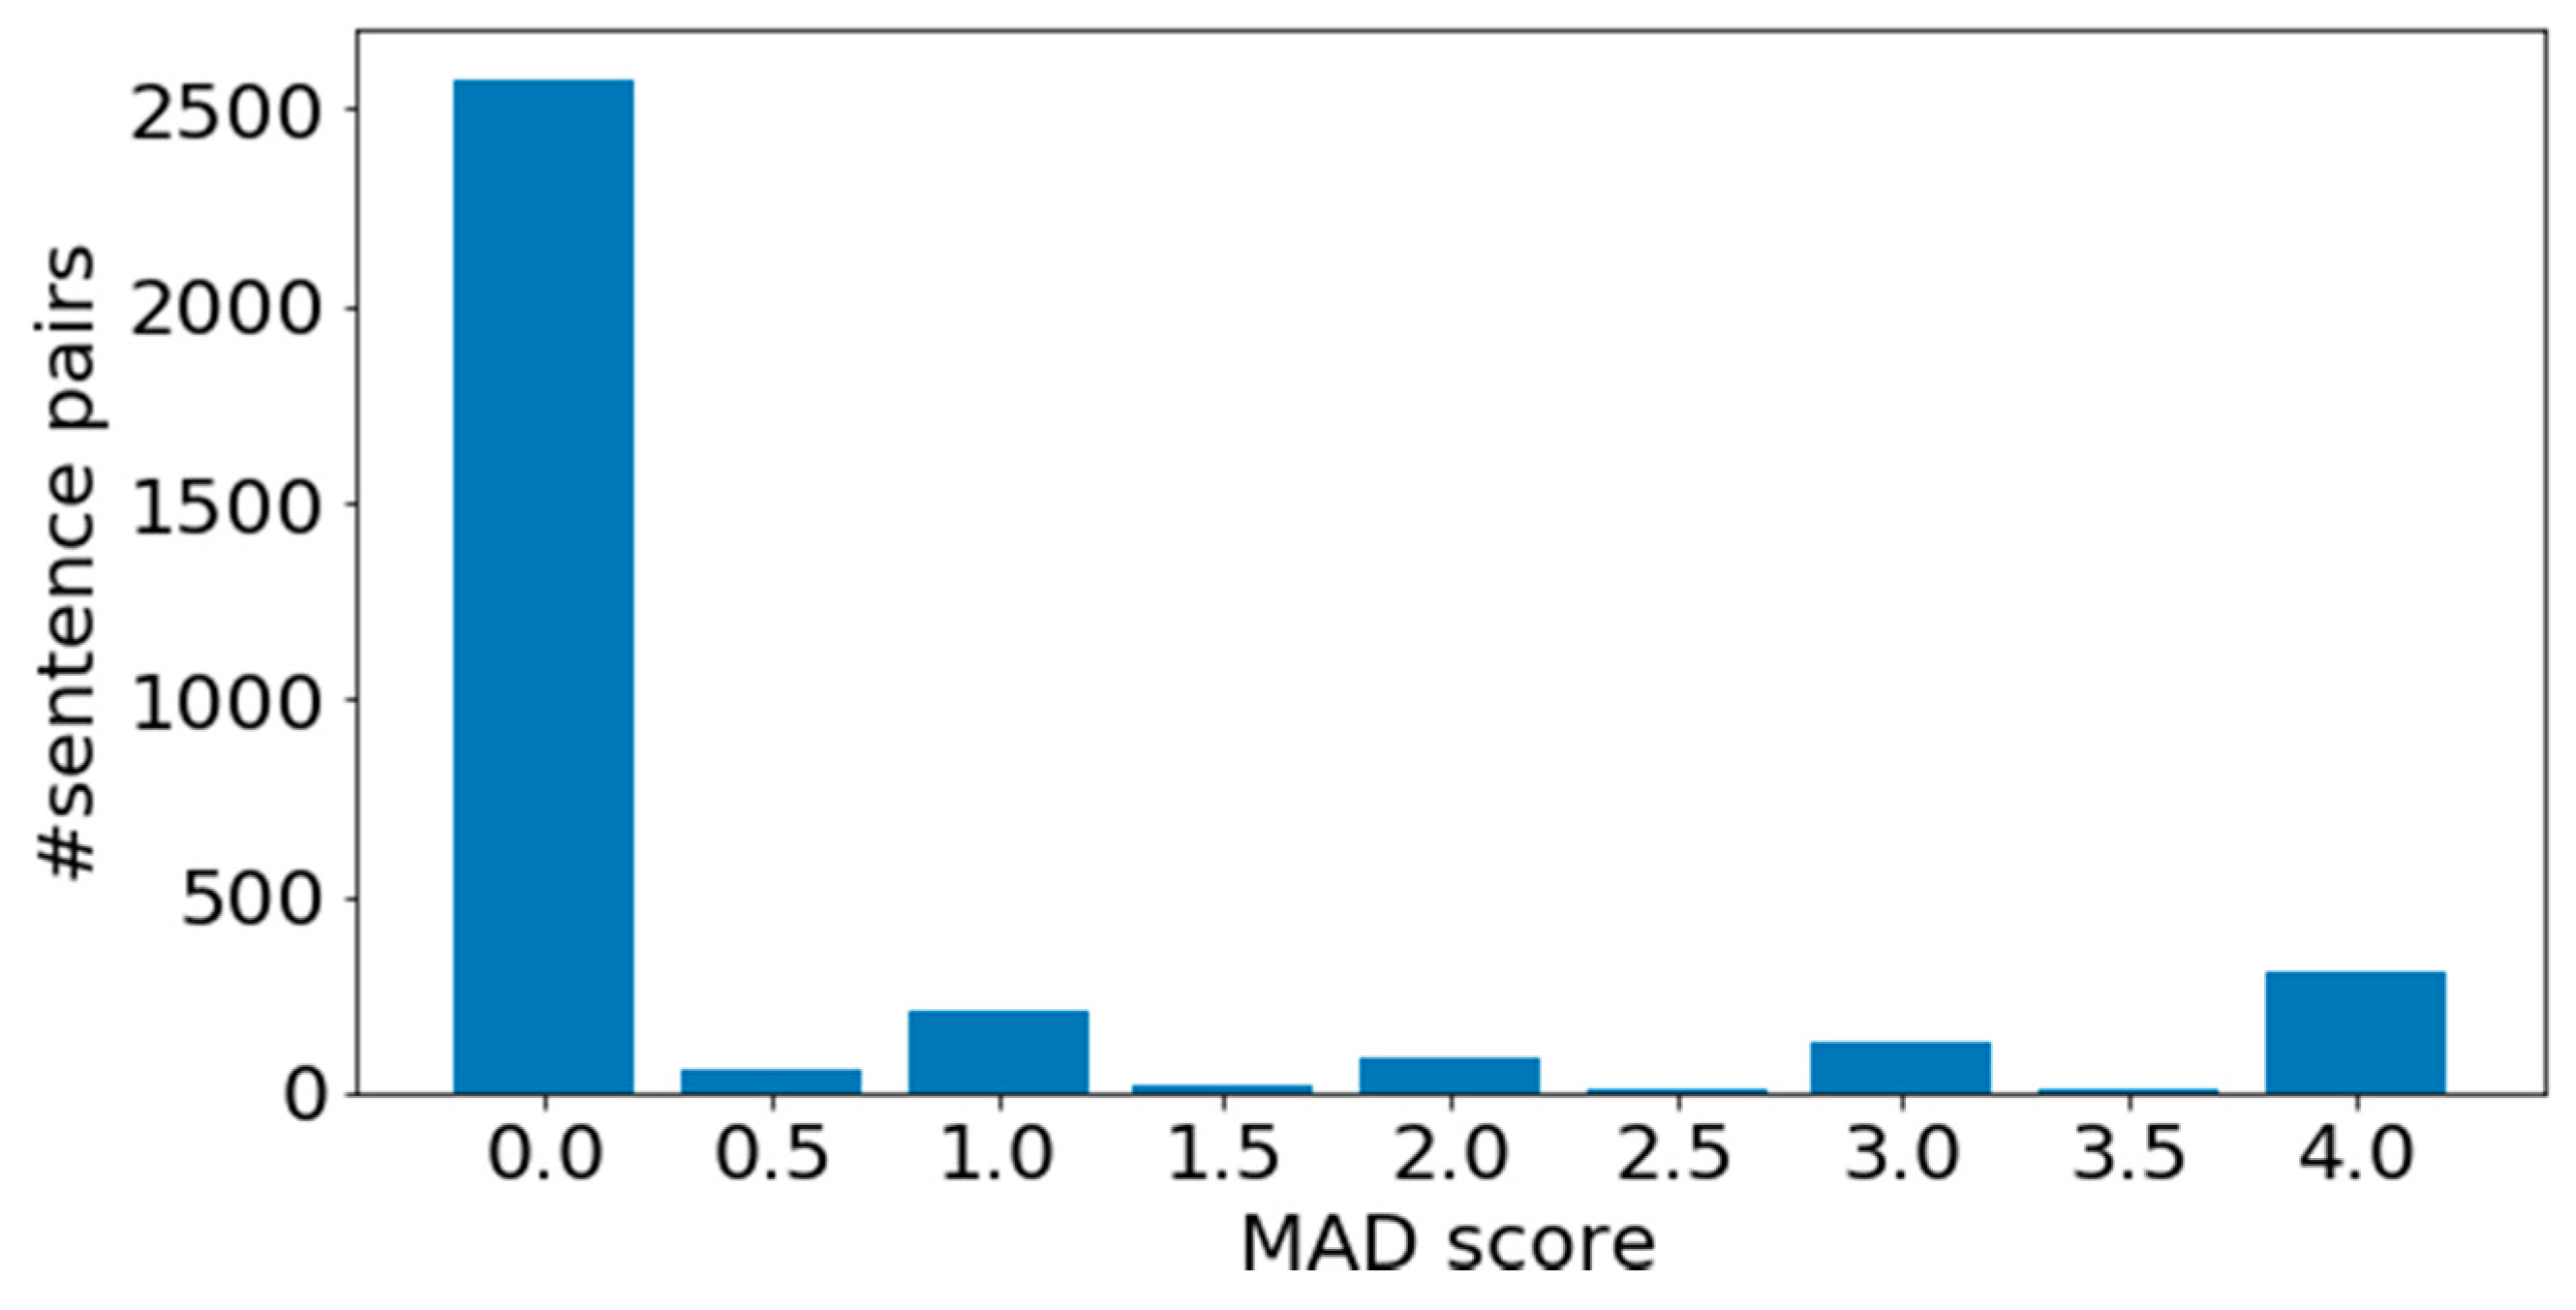
2.1. Labeled Dataset
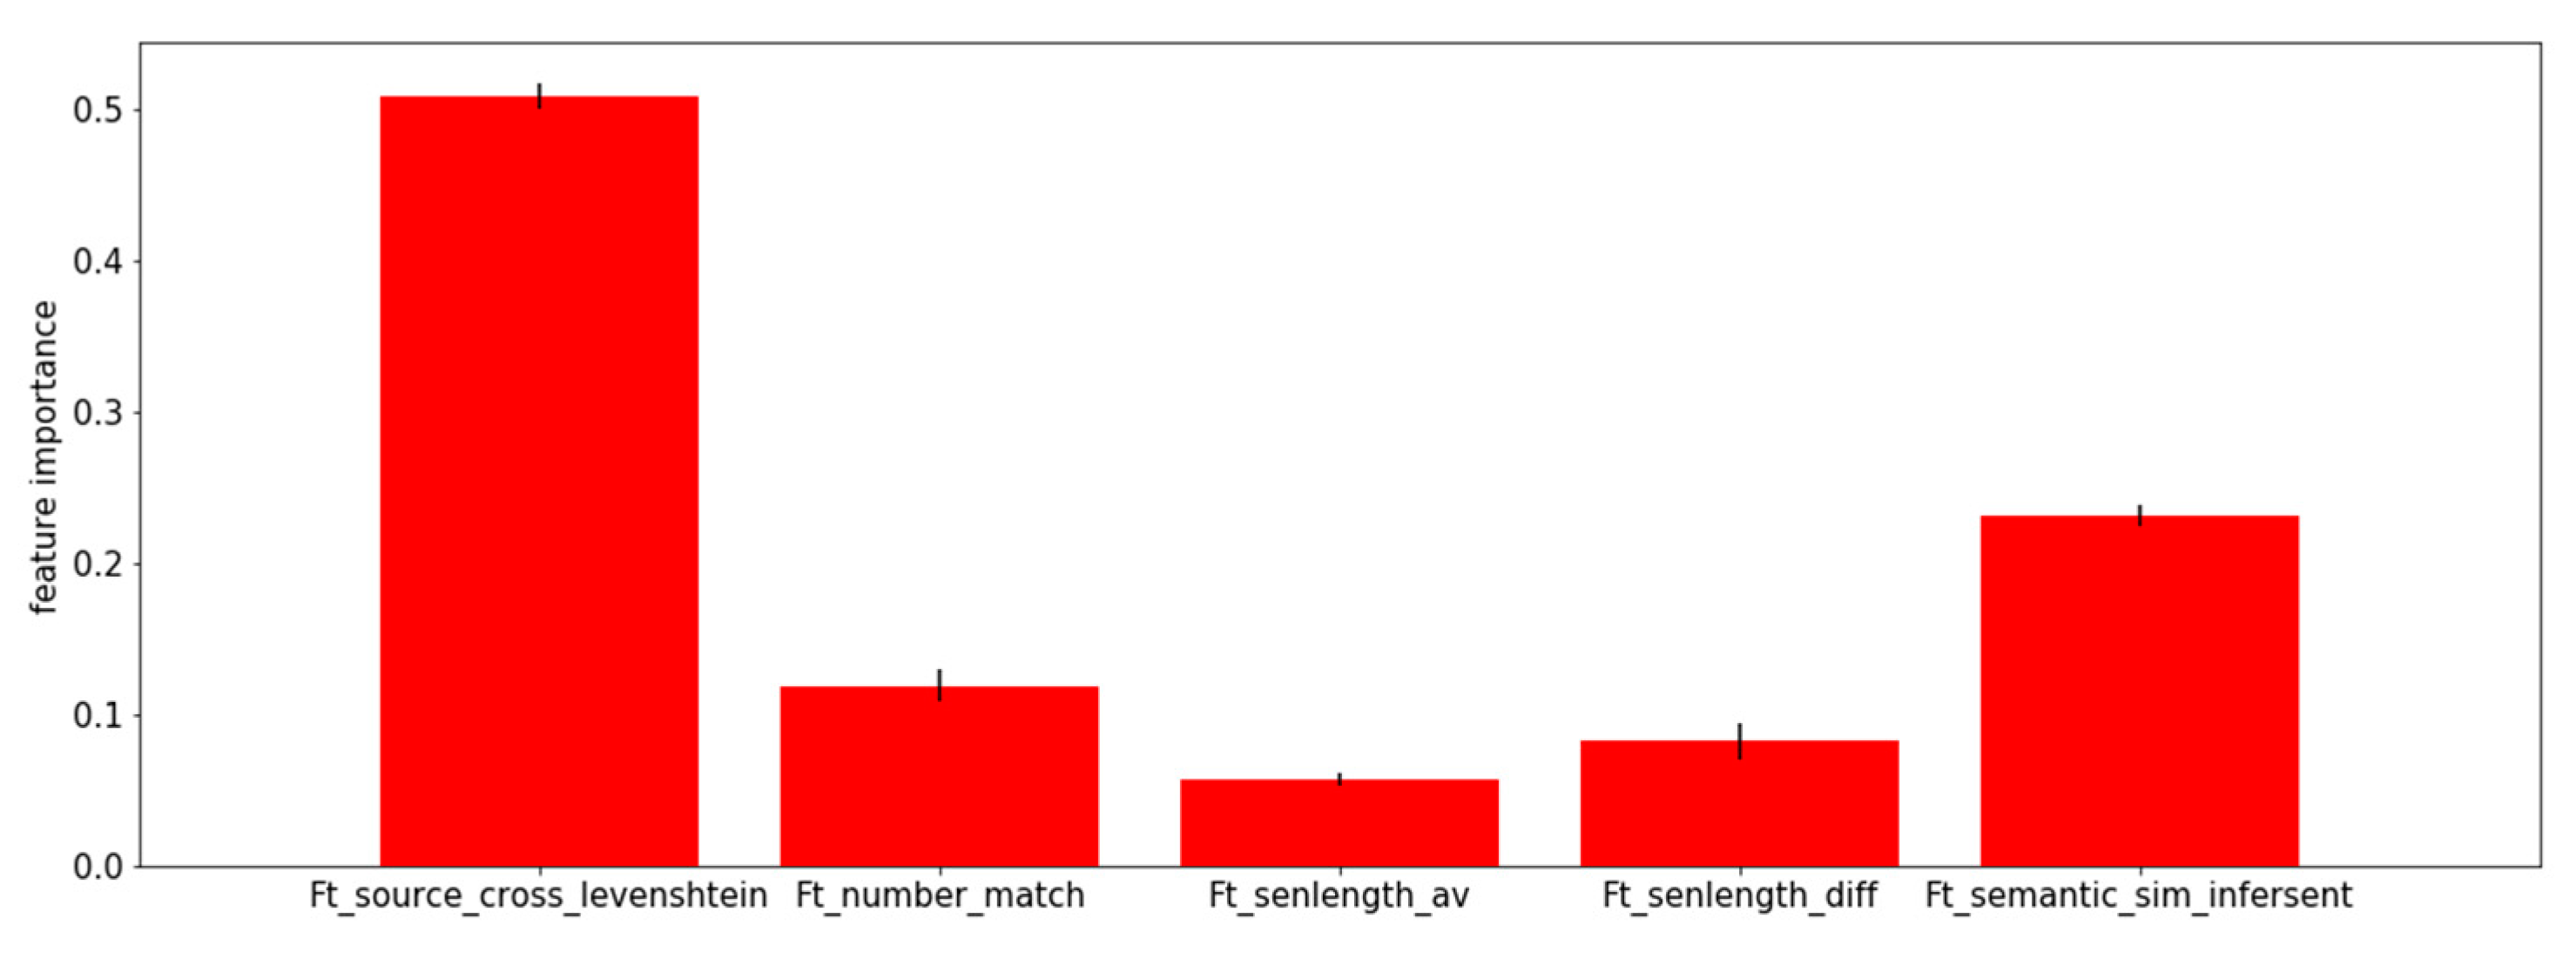
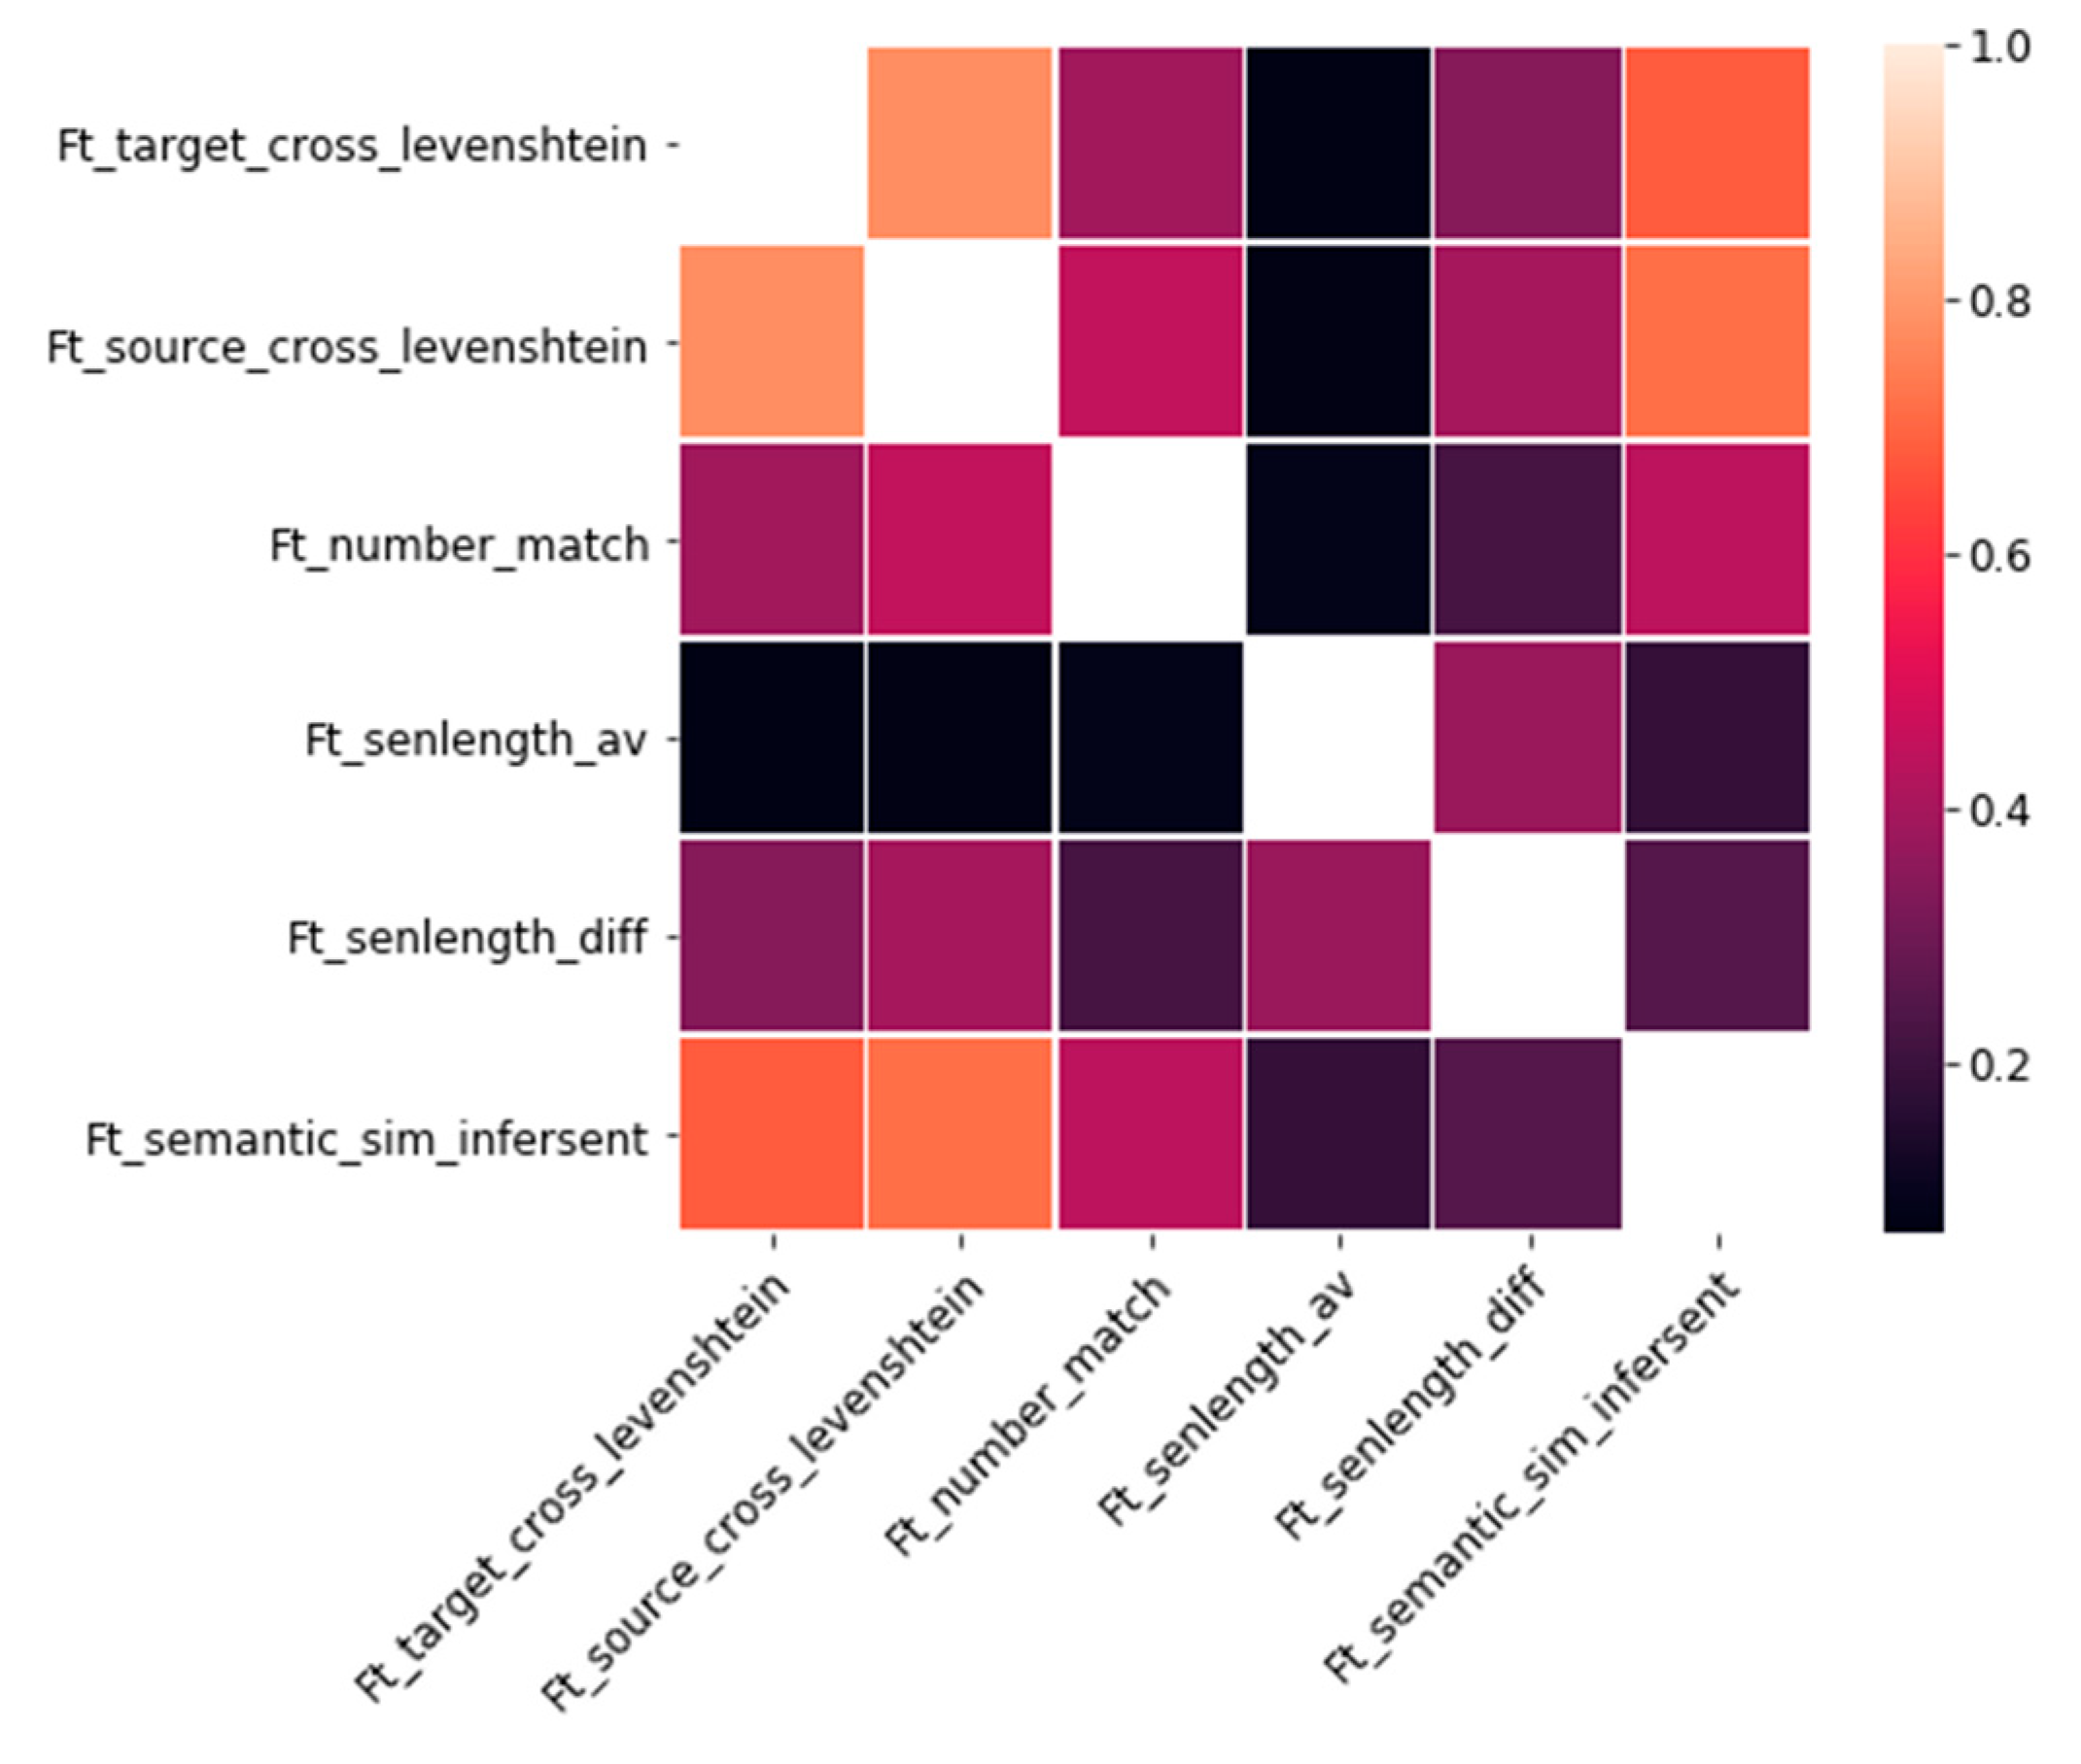
A labeled dataset in the FR–NL language pair was created by manual annotation involving one fluent speaker of both languages (native in NL, fluent in FR) and one machine translation expert according to levels of misalignment (see Table 1). As the annotators have a complementary background, we chose to let them work together to annotate the sentences, so a single annotation per sentence pair was obtained (both annotators read the sentence pairstogether, after which they agreed upon a score). Sentence pairs falling in between two categories were labeled as such (e.g., sentence pairs with a perceived MAD score between 1 and 2 were labeled with a MAD score 1.5), although the annotators were encouraged to give integer values. We noted that assigning a score (0–4) instead of a yes/no label to each pair of sentences avoids serious disagreements among different annotators for marginal cases (since these can be given an appropriate 0–4 score.
The labeled datasets consist of 3406 sentence pairs (FR–NL) collected from a bilingual website (www.rva.be) of which some are perfectly aligned, and some suffering from various misalignment errors. We refer to Figure 3 for the distribution of the MAD scores. If we consider sentence pairs with a MAD score strictly larger than 2 as misaligned, then 14% of the sentence pairs in our labeled dataset are misaligned. For the training of our model, we sampled a balanced training set of 866 sentence pairs, where 28% of the sentence pairs were labeled as misaligned. The other sentences were assigned to the test set for evaluation (2540 sentence pairs with 10% misaligned sentences).

2.2. Features

The used features can be split in two groups: those that are calculated after a translation step and represent lexical or semantic similarity of the two sides of a parallel corpus (S-T); and features based on shallow properties such as sentence length and number match. We investigated many features and list the best performing features below.
  • Ft_senlength_av: Average sentence length (in characters) of the S-T sentence pair.
  • Ft_senlength_diff: Absolute difference among sentence length of S and T (in characters).
  • Ft_number_match: Hand-crafted hard rule score between −1 and 1. Equal to 0 if S and T do not contain numbers; and closer to −1 or 1 if there is a big mismatch, respectively match among the detected numbers in S and T. For more details we refer to Appendix A.
  • Ft_source_cross_levenshtein: Levenshtein distance between the target sentence T and the translation of the source sentence S in the target language.
  • Ft_semantic_sim_infersent: Cosine similarity between the sentence embedding of the source and target sentences translated into English. Sentence embeddings are calculated using a pre-trained sentence encoder, InferSent (https://github.com/facebookresearch/InferSent), trained with fastText (https://github.com/facebookresearch/fastText). InferSent is a sentence embeddings method that provides semantic representations for English sentences. For more information about the sentence encoder we refer to Conneau et al. [21].
To calculate these features on the labeled dataset, three translation steps are required: NL→FR, for the calculation of Ft_source_cross_levenshtein and NL→EN and FR→EN for the calculation of Ft_semantic_sim_infersent. Translations were performed by a neural MT engine.
As none of these features explicitly use language-specific properties related to French or Dutch, we can expect that the resulting model can be applied to other language pairs, provided the required MT engines are available. This will be further investigated in Section 3.2.2 and Section 3.3.

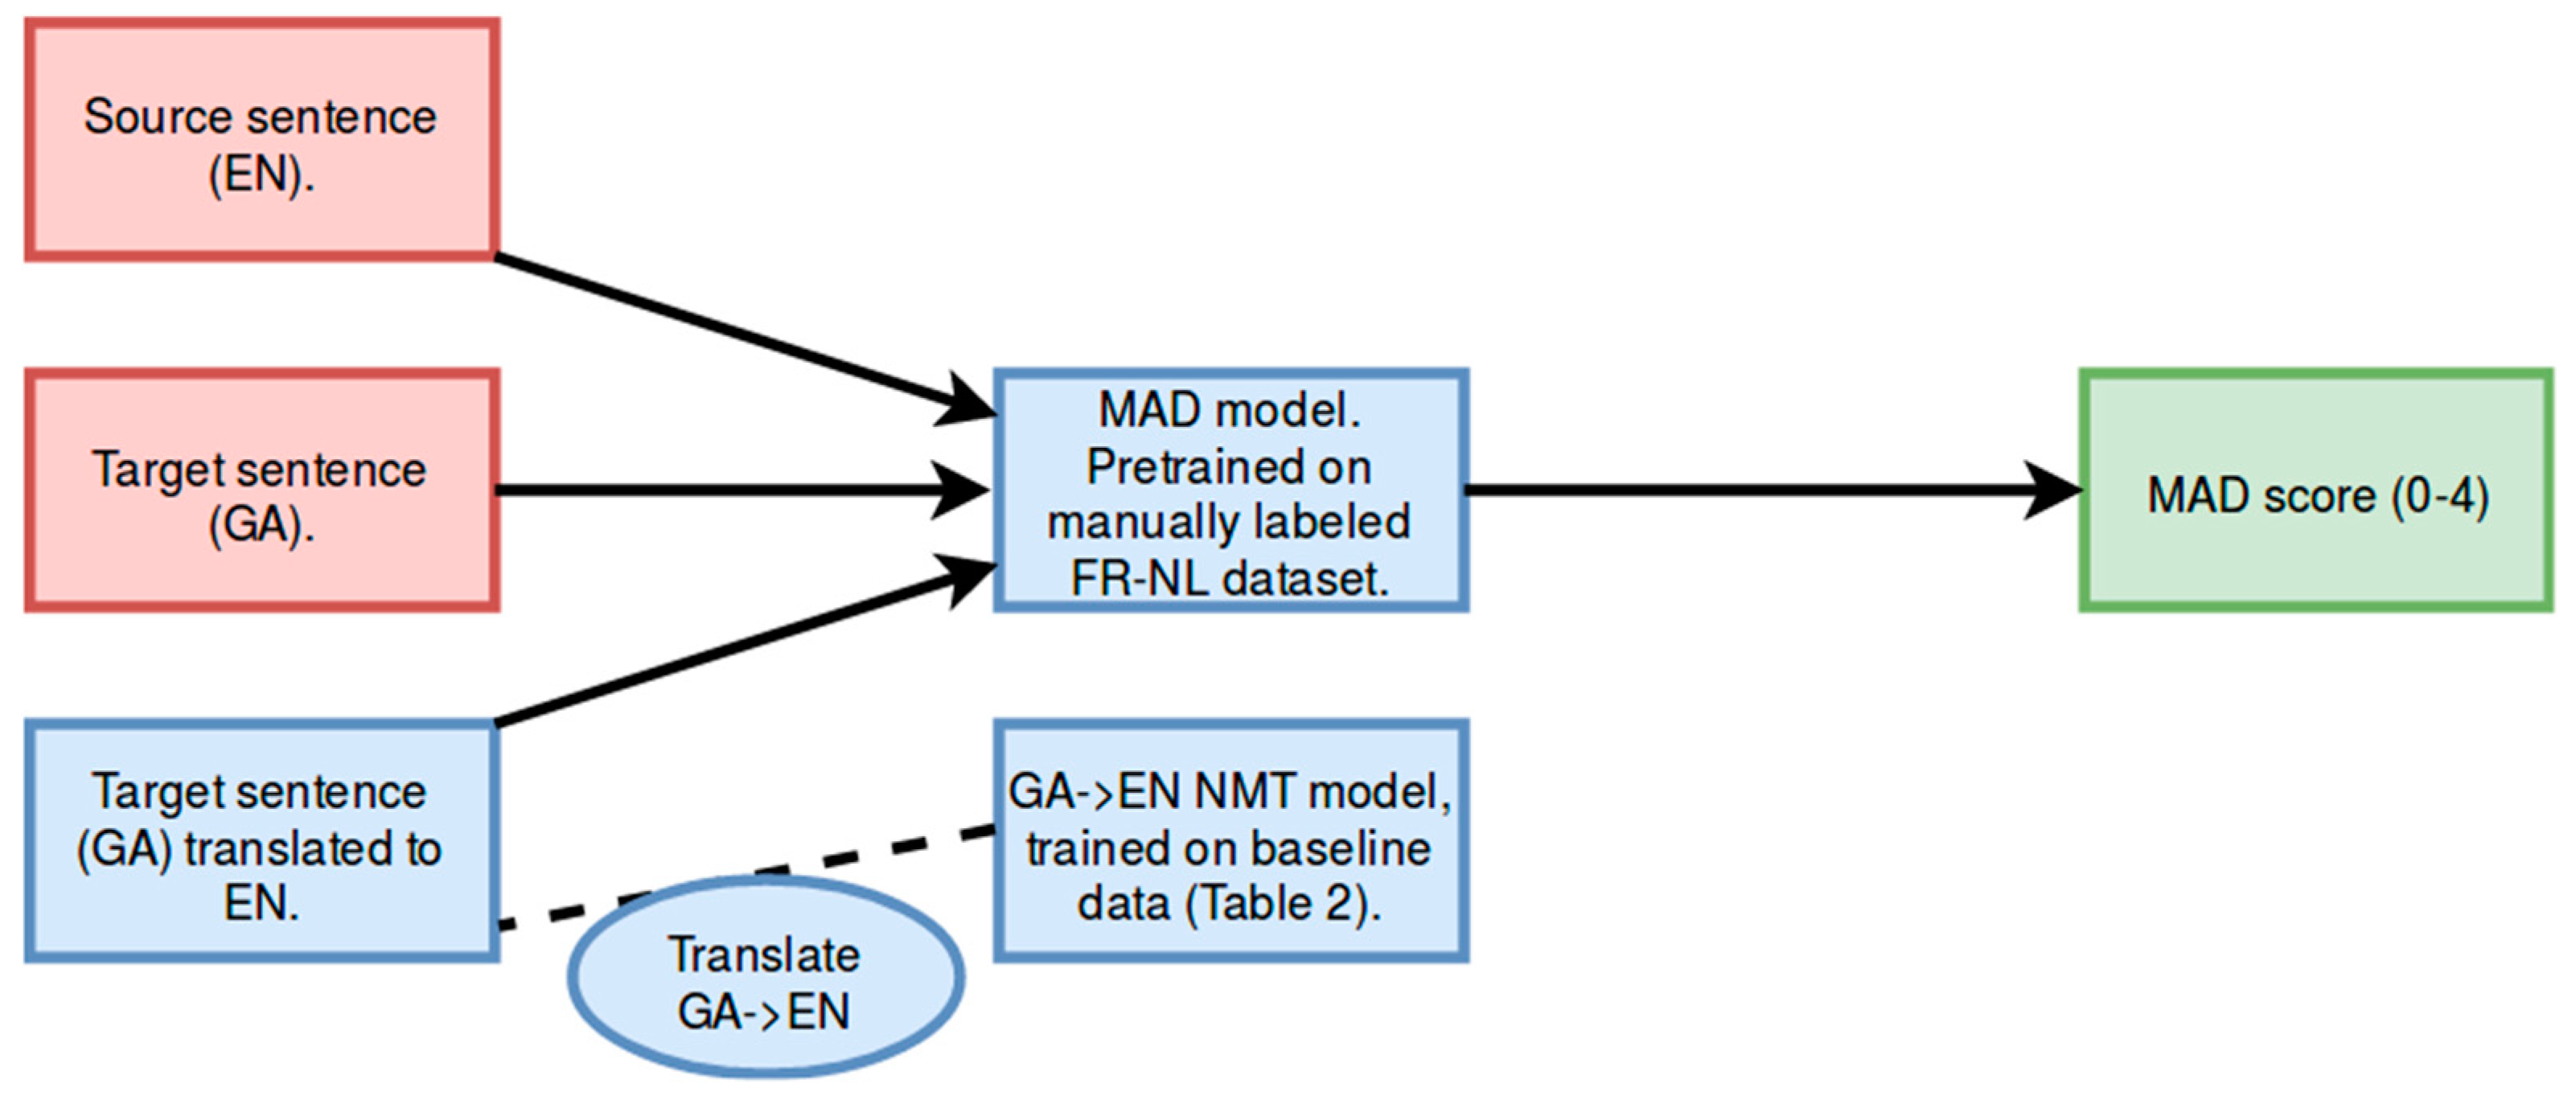
2.3. Supervised Regression

We used the balanced training set described in Section 2.1 to train a regression model and used 5-fold cross validation on this set for tuning of the hyper-parameters, with R2 as our metric. Several types of models were tested via Scikit-learn [22], of which Support Vector Regression with a Radial Basis Function kernel proved a slightly better performance than Random Forest Regression. Note that we considered using a classifier instead of a regression model, but noticed a decrease in performance during intrinsic evaluation, therefore a regression model was chosen.
For evaluation of our best performing model, the held-out test set was used. In the context of misalignment detection, it is clear that the false negative rate (FNR) (if a misalignment is considered a positive label) is the most important metric to minimize, as we want to avoid classifying misalignments as aligned. Therefore, we also defined a utility score equal to TNR(1−p) × TPRp, with TNR the true negative rate (specificity) and TPR (= 1 − FNR) the true positive rate (recall), and p equal to 0.33; i.e., a metric biased towards the TPR (FNR). This utility score was used to decide on the optimal threshold for classifying sentences as aligned or misaligned by our model.

2.4. Data for Machine Translation

Our model for misalignment detection (MAD) was evaluated on two language pairs, EN–FR and EN–GA. To calculate the required features, an initial translation step is required: X→EN. Therefore, we trained MT engines using the RNN (Recurrent Neural Network) architecture in OpenNMT [23] on the baseline training data listed in Table 2, after removal of a test set of 3k sentence pairs. We use the following abbreviations in the table: DCEP (Digital Corpus of the European Parliament), DGT (Directorate-General for Translation of the European Commission), ECDC (European Centre for Disease Prevention and Control), and EAC (Directorate General for Education and Culture of the European Commission).
For evaluation of MAD, a web-scraped corpus was used for each language pair (EN–FR, EN–GA). For EN–FR, we scraped and aligned data ourselves from various bilingual websites related to the legal domain. This data was scraped using Scrapy (https://scrapy.org) and then documented aligned using Malign (https://github.com/paracrawl/Malign), a tool for document alignment that makes use of MT. Sentence alignment of these document pairs was subsequently performed using Hunalign (http://mokk.bme.hu/en/resources/hunalign) [24]. More details are provided in References [25]. For EN–GA the raw ParaCrawl data (https://paracrawl.eu, https://s3.amazonaws.com/web-language-models/paracrawl/release3/EN–GA.classify.gz) was used. We refer to Table 3 and to Appendix B for a more detailed overview of the web-scraped corpus EN–FR.

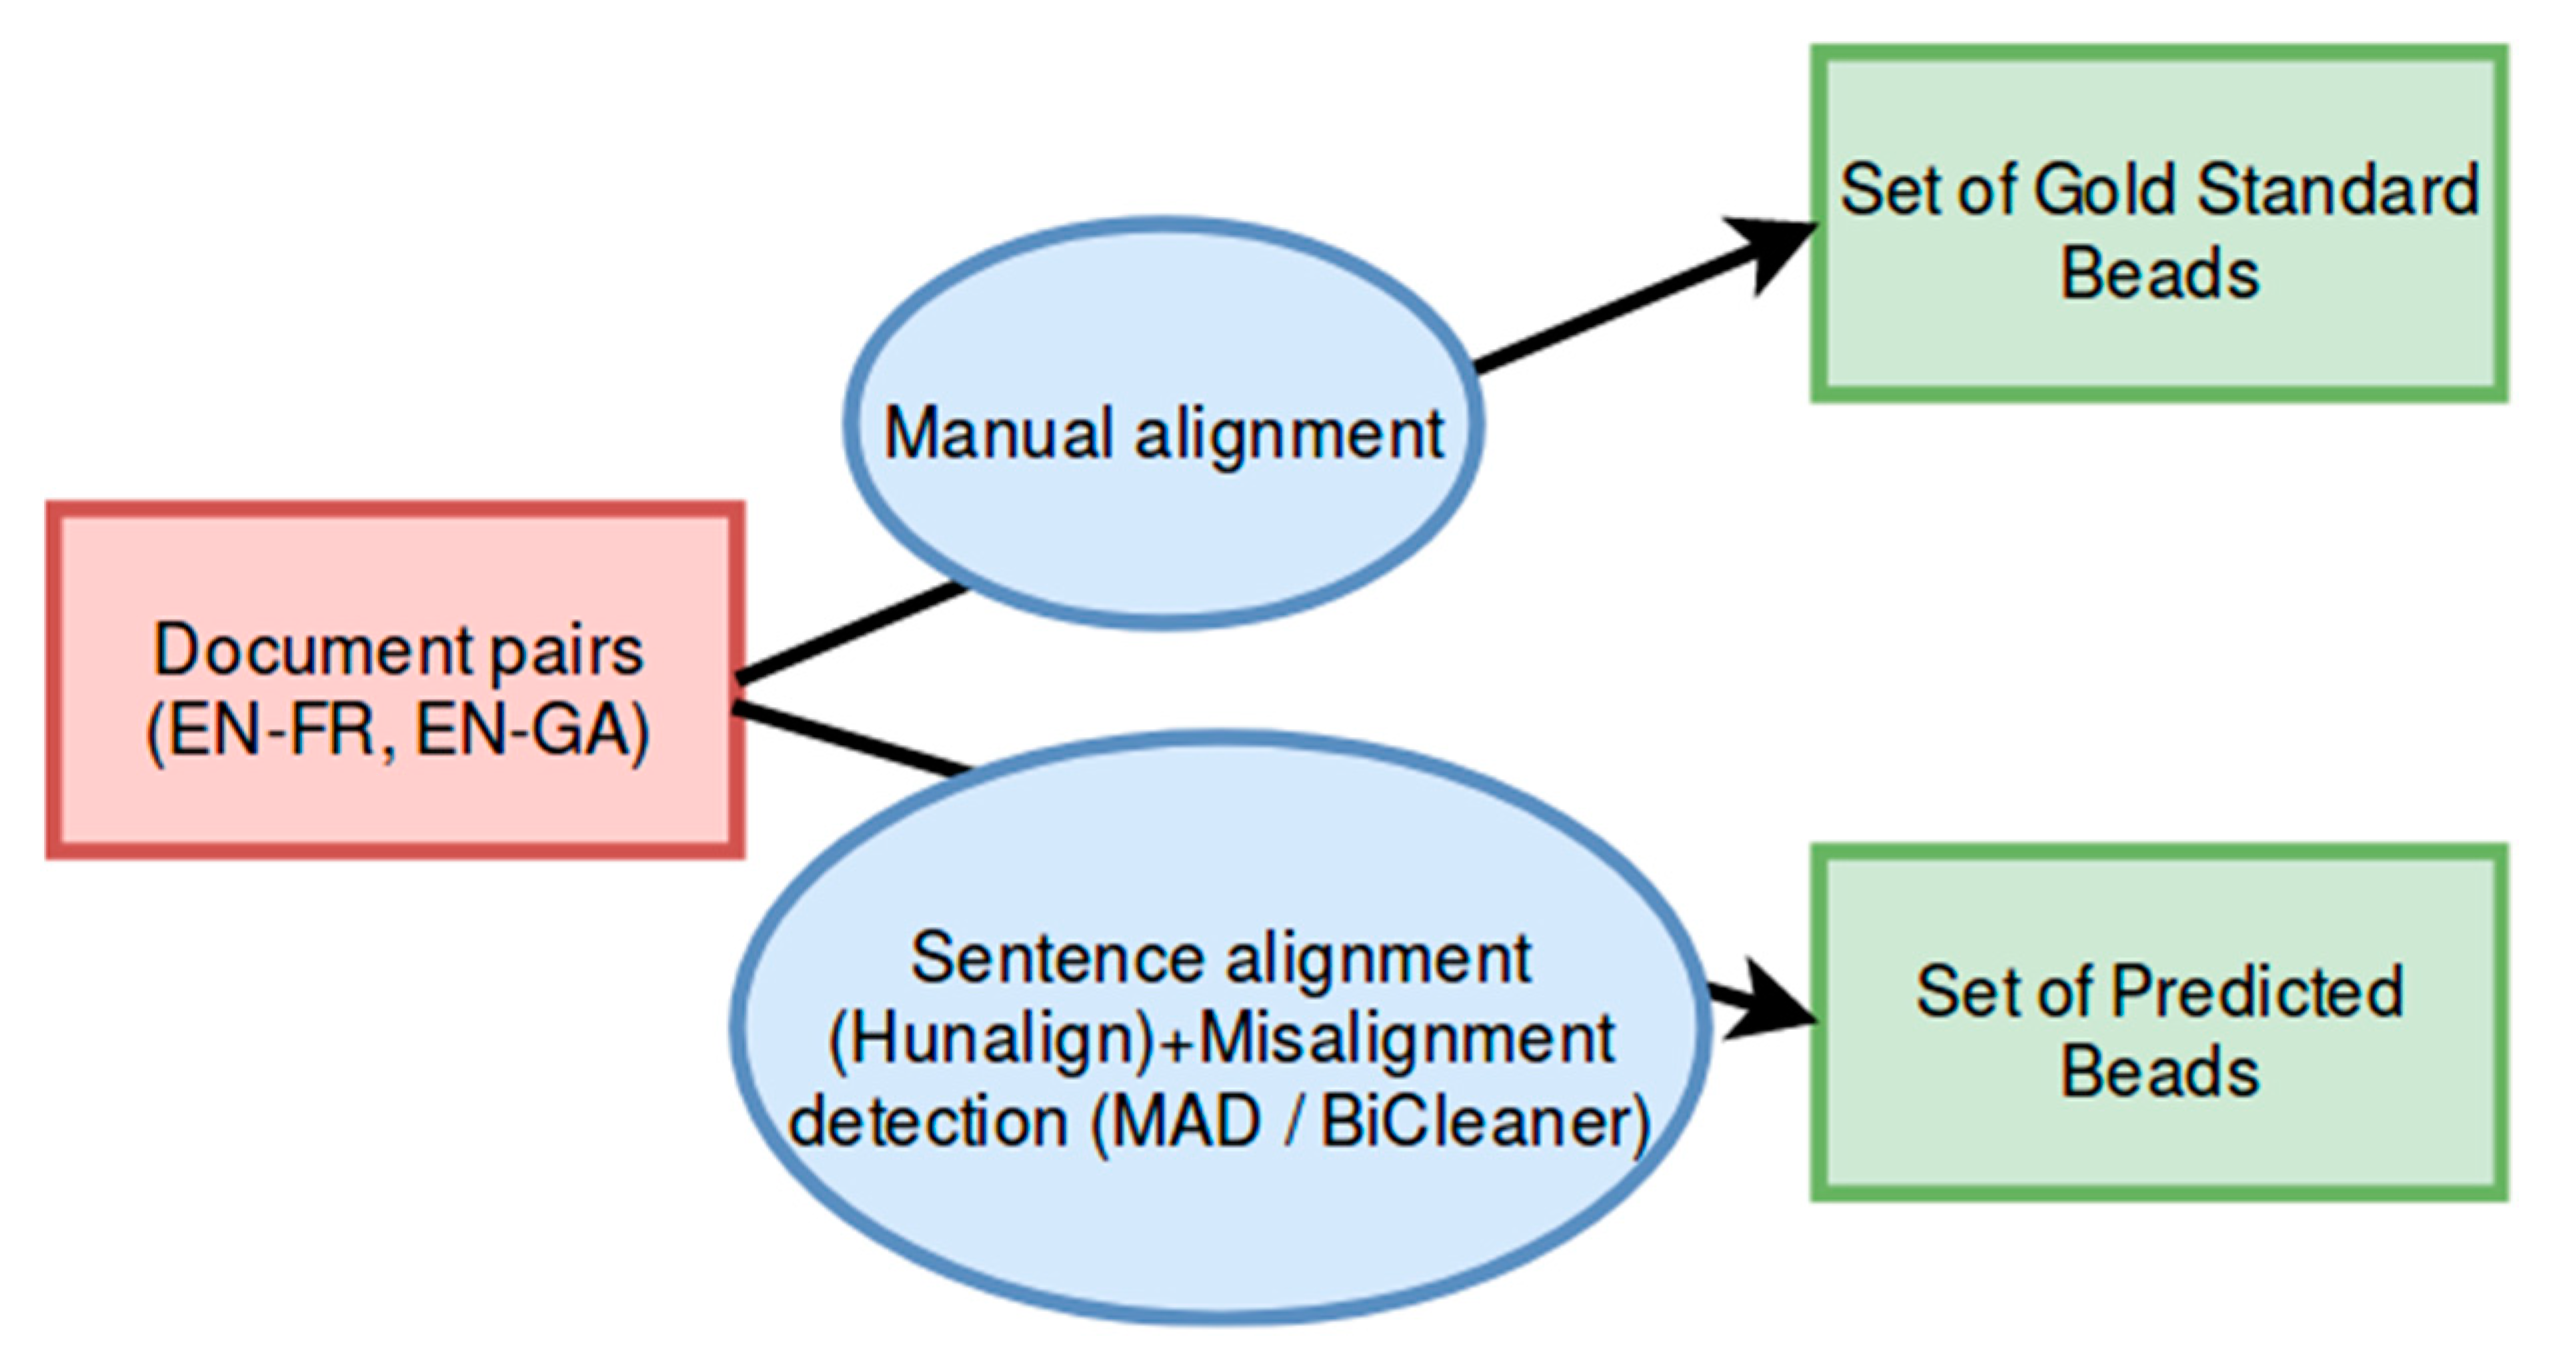
2.5. Gold Standard for Sentence Alignment

Typically, the cleaning/misalignment detection step will be executed after an initial sentence alignment step of document pairs. In terms of evaluation of our model, it is therefore crucial that we investigate to what extent our model can improve the quality of alignments of a corpus. Therefore, we created a gold standard for sentence alignment from a set of document-aligned document pairs.
Sentence alignment involves several types of links. A typical link has a single source and a single target sentence (1-to-1 link), but there are also 1-to-many, many-to-1, many-to-many, and null links (0-to-1 or 1-to-0 links). For instance, two source sentences may have been translated into one target sentence:
  • Source: Payment can be made in person. However, the office should be contacted beforehand.
  • Target: Le versement peut être effectué en personne, mais le bureau doit être contacté en avance.
Evaluating automatic sentence alignment takes place by comparing the output to a manually created gold standard. This manual alignment involves establishing links between one or more subsequent source sentences and one or more subsequent target sentences [24], in such a way that the links cannot be divided further into smaller links; Brown et al. [26] refer to such sets of subsequent sentences as “beads”. Therefore, the above example may be part of a manual alignment. However, the below example would lead two beads to be added to the manual alignment:
  • Source: Payment can be made in person.
  • Target: Le versement peut être effectué en personne.
  • Source: However, the office should be contacted beforehand.
  • Target: Toutefois, le bureau doit être contacté en avance.
The automatic sentence alignment is compared to the manual alignment based on the beads that are present in both alignments or in just one of them. Based on this comparison, precision/recall figures can be calculated, as shown in Section 3.2.2. Null beads in the automatic or manual alignment are ignored during evaluation, as we do not want to bias towards this trivial type of link. Partial links, only produced by the manual alignment, are also ignored during evaluation.
For EN–FR, we manually aligned 13 document pairs initially scraped from the European e-justice portal (https://e-justice.europa.eu); 11 document pairs scraped from the website of the Irish Department of Education and Skills were manually aligned for EN–GA (https://www.education.ie). In Table 4, we show the statistics of the gold standards (note that these gold standards for sentence alignment were already communicated in the context of previous research by our group [23]).

2.6. BiCleaner

BiCleaner detects noisy sentence pairs in a parallel corpus by estimating the likelihood of a pair of sentences being mutual translations (value near 1) or not (value near 0). Very noisy sentences are given the score 0 and are detected by means of hand-crafted hard rules. These rules are addressed at detecting evident flaws such as language errors, encoding errors, short segments, and very different lengths in parallel sentences. In a second step, misalignments are detected by means of an automatic classifier, making use of features extracted from probabilistic bilingual dictionaries and shallow properties such as sentence lengths, capitalized words, and punctuation marks. Finally, sentences are scored based on fluency and diversity. More details are provided in Reference [20].
Training a classifier with BiCleaner requires a clean parallel corpus (100k sentences is the recommended size) as well as source-target and target-source probabilistic dictionaries. Pre-trained classifiers for 23 language pairs (https://github.com/bitextor/bitextor-data/releases/tag/bicleaner-v1.0) are already provided.
For application of BiCleaner on the EN–FR and EN–GA sentence pairs (Section 3.2.2 and Section 3.3) we used the pre-trained classifiers provided by the authors. For the FR–NL language pair (Section 3.2.1), no pre-trained classifier was available, so we trained one ourselves. We used the FR–NL DGT corpus (http://opus.nlpl.eu/DGT.php) and sampled 2M sentence pairs, on which we ran GIZA++ (https://github.com/moses-smt/giza-pp) to obtain our probabilistic dictionaries. Entries with a probability 10 times lower than the maximum translation probability for each word were removed in order to speed up the process, as recommended on the BiCleaner GitHub page (https://github.com/bitextor/bicleaner). A BiCleaner classifier was then trained on 150k sentence pairs sampled from the FR–NL DGT corpus using our probabilistic dictionaries.
The main difference between BiCleaner and MAD is that the former is not designed specifically for misalignment detection, but also removes other types of noise (by means of a set of hand-crafted rules) and scores sentences based on fluency and diversity, making it more than a tool for misalignment detection. Therefore, in practice, BiCleaner could be used in combination with MAD (we refer to Section 3.2 and Section 3.3). The second main difference is that, although both require a parallel corpus, our methodology leverages an MT engine, while BiCleaner makes use of probabilistic bilingual dictionaries.

3. Results

This section is divided in three sections. In the first section we explain the details of our machine learning pipeline and assess the importance of each of the features described in Section 2.2 for the task of misalignment detection. Then, we performed two types of intrinsic evaluation. First, we evaluated our model on the labeled held-out test set described in Section 2.1 and compared our results with those obtained using another tool for misalignment detection, BiCleaner. Second, we evaluated our model on two gold standards for alignment for the EN–FR and EN–GA language pairs. Finally, we performed an extrinsic evaluation by applying MAD on two web-scraped corpora, and examined the effect of removing misalignments on NMT performance.

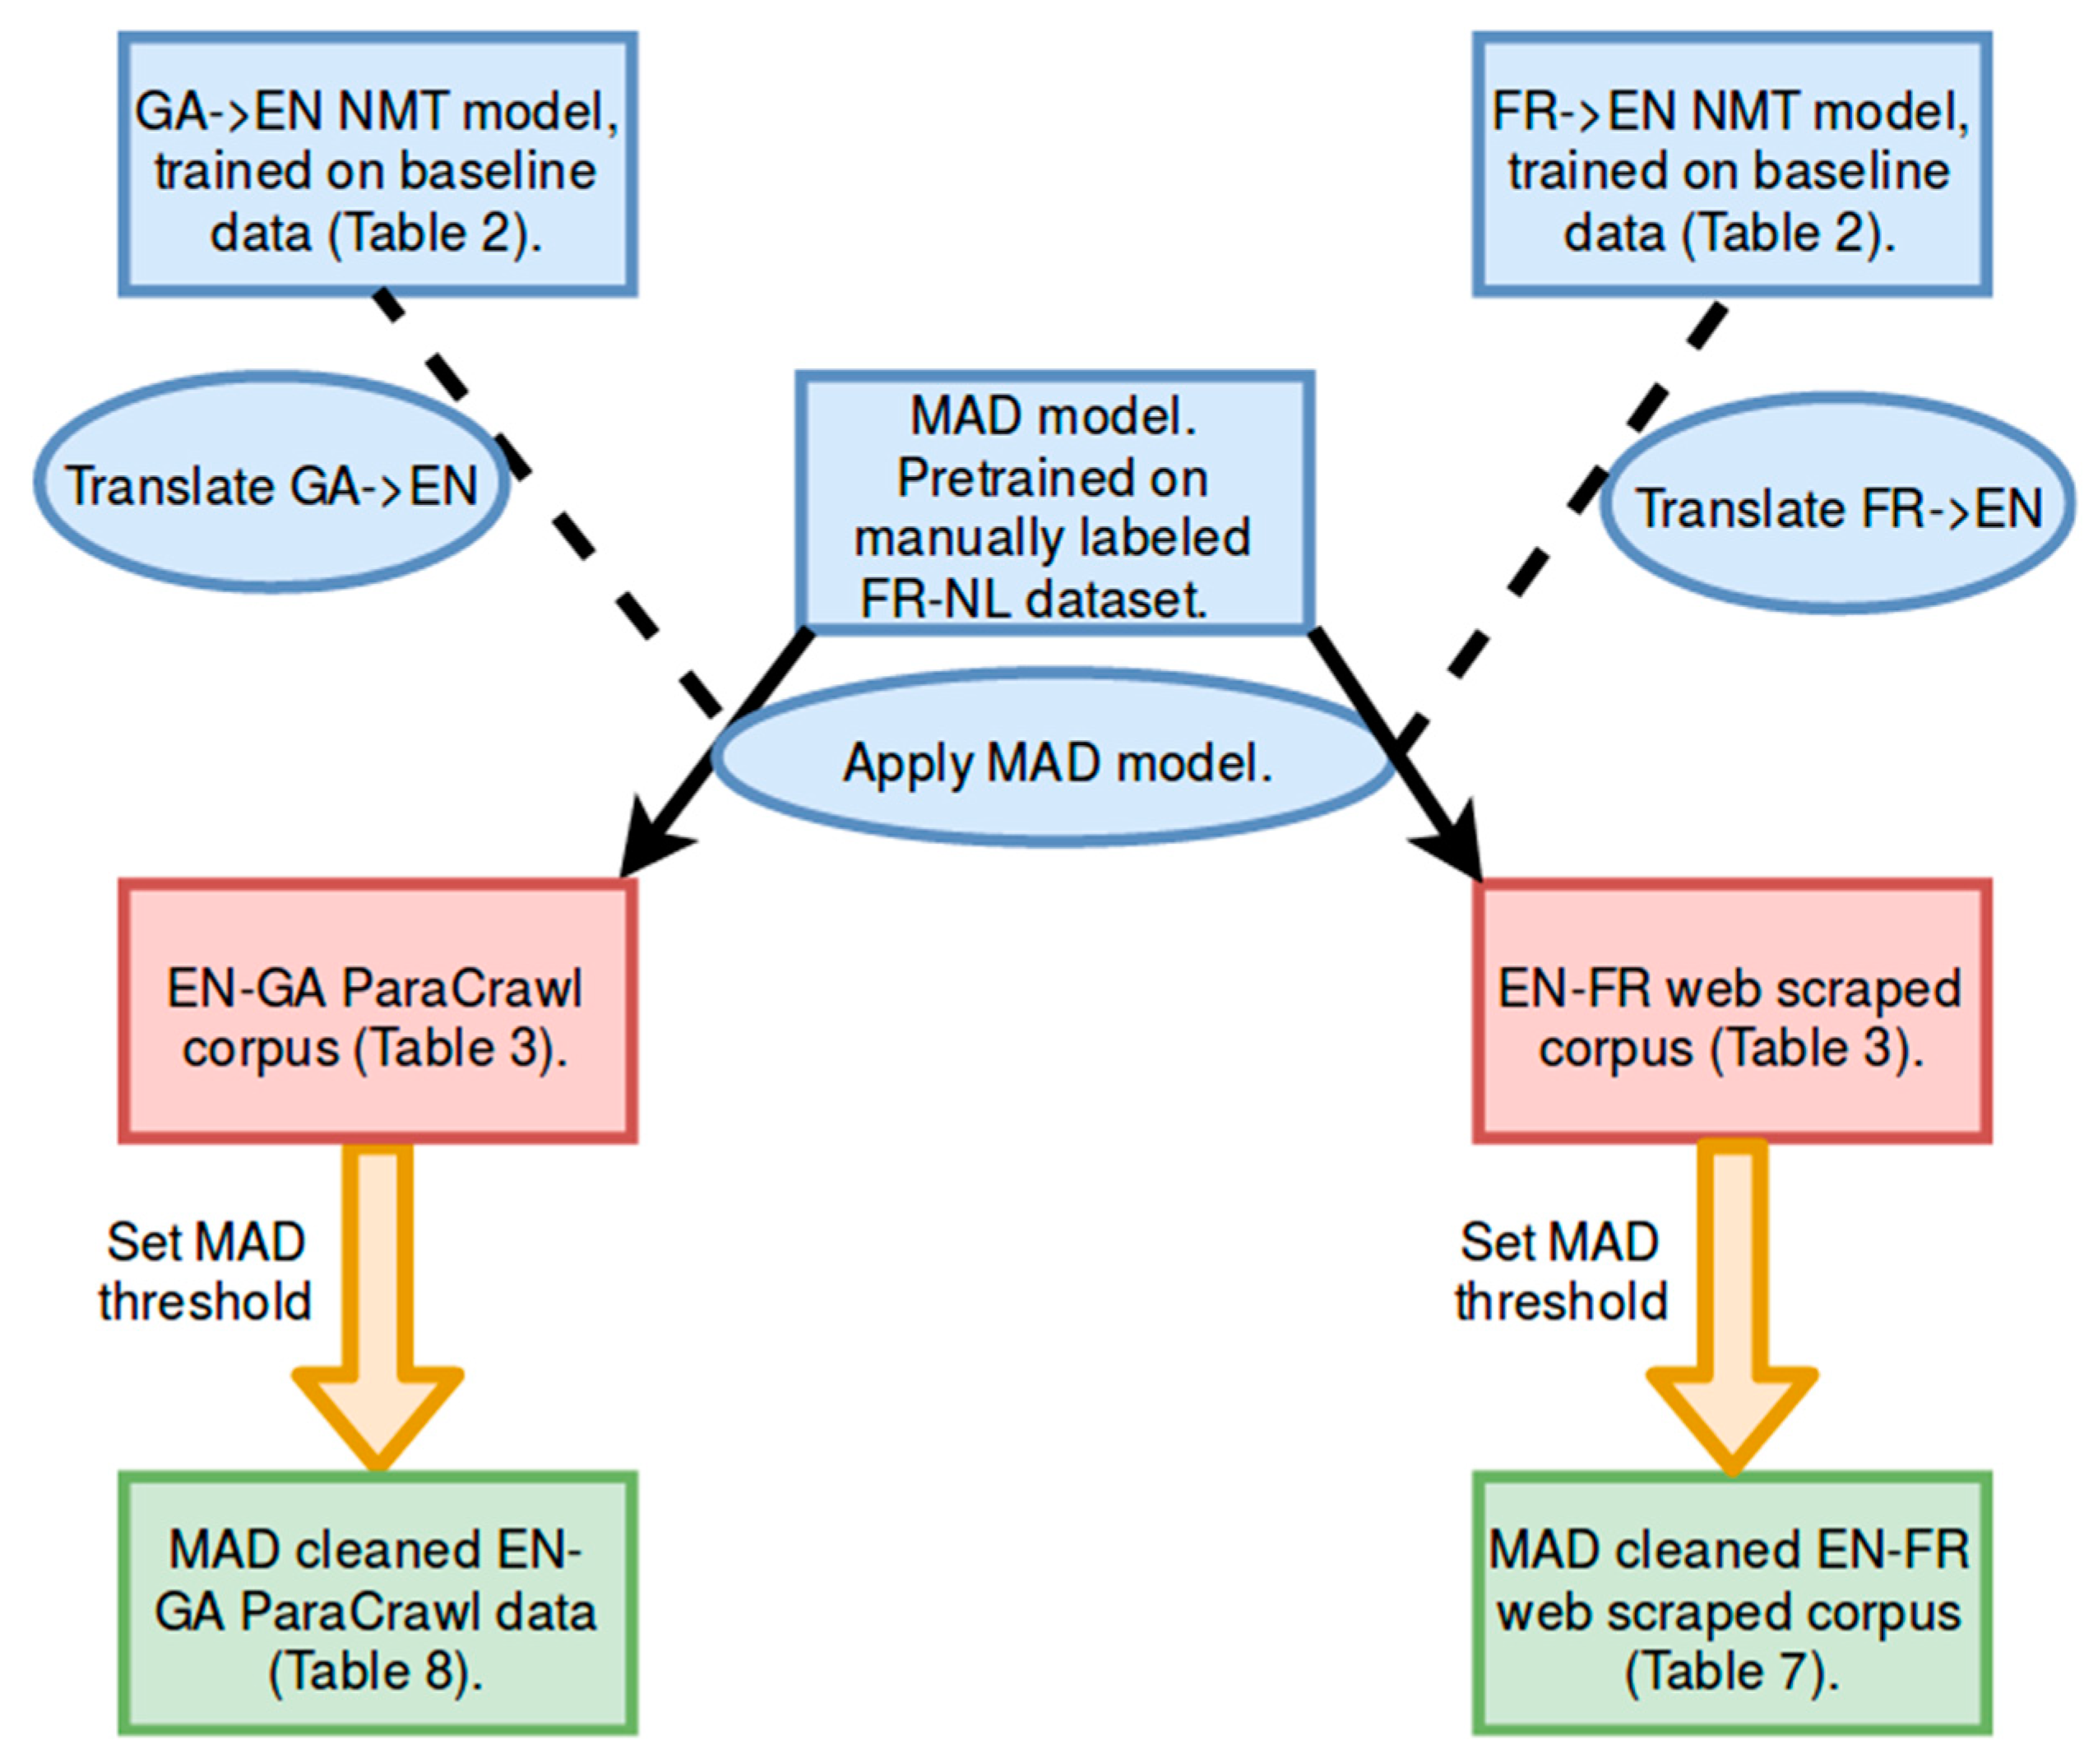
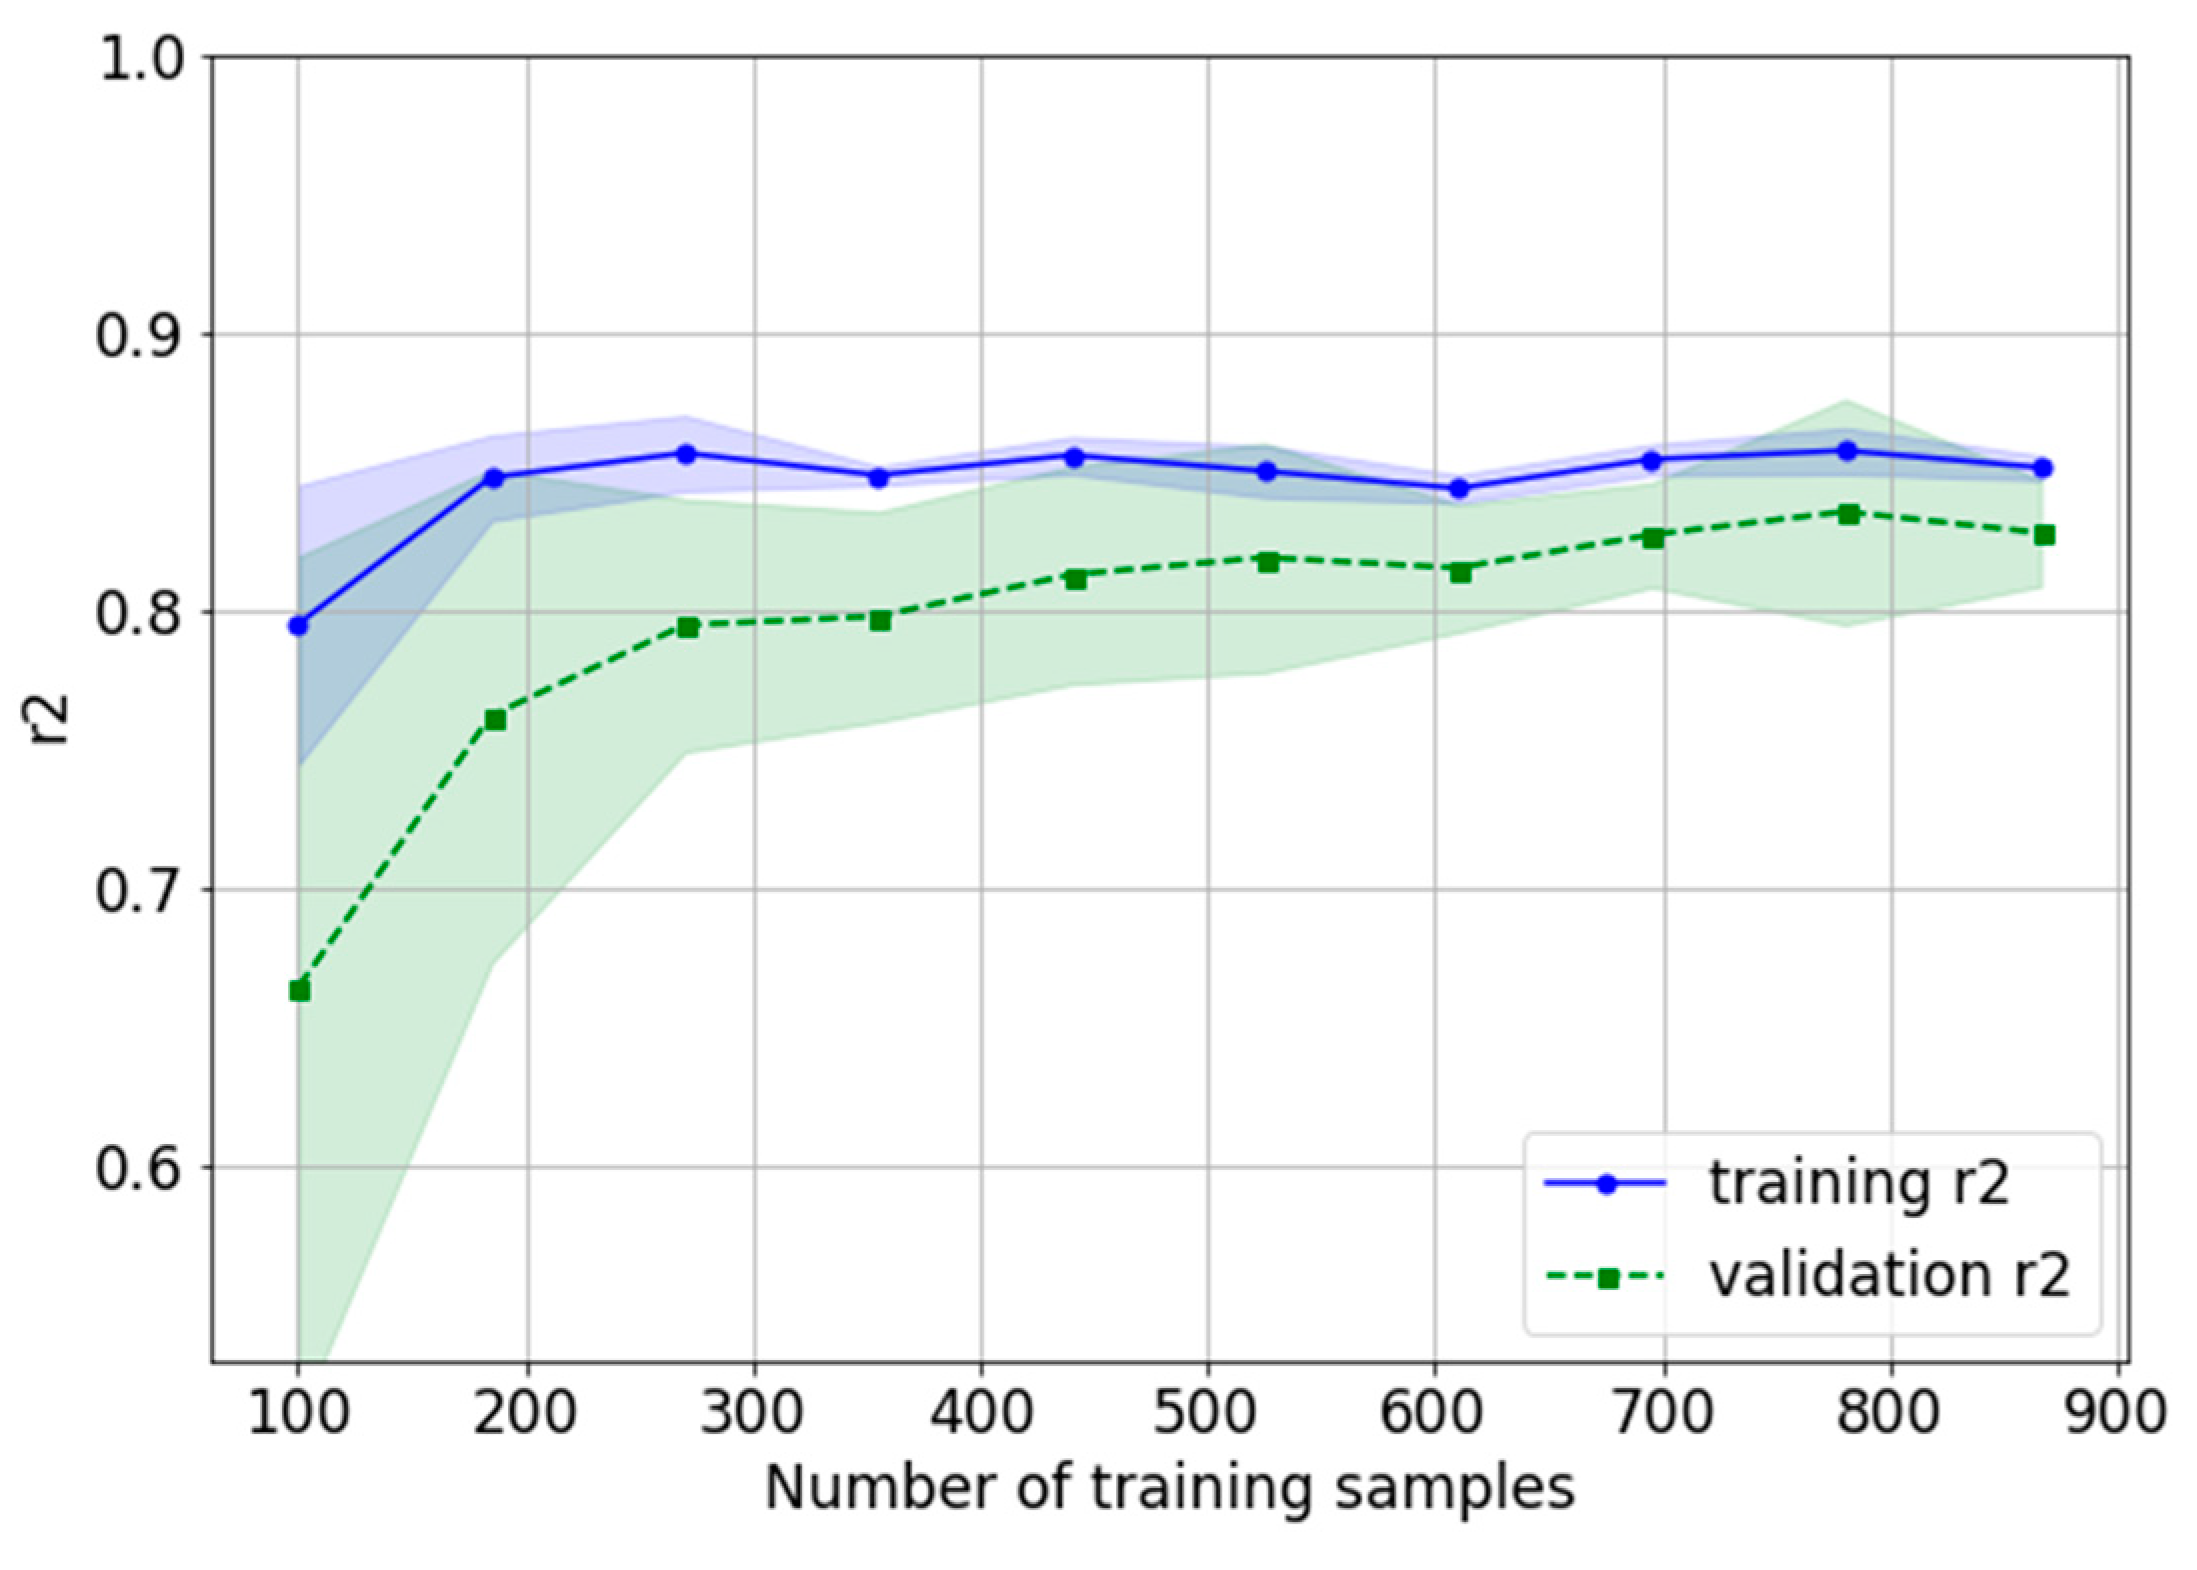
3.1. Machine Learning Pipeline

As we have a labeled dataset at our disposal, an interesting contribution of this paper is the assessment of the importance of each of the features for the task of misalignment detection. We refer to Table 5 for the F-scores and Mutual Information (MI) among each of the features and the MAD score.
From Table 5 it is clear that the shallow features contain much less information than those obtained after a translation step. To get some more insight about the importance of each feature when combined with others, we also fitted a Random Forest Regression model (with a maximum depth of 10 to avoid overfitting) to the training data and calculated how much each feature decreased the weighted variance in a tree (see Figure 4). As our features are correlated (we refer to Appendix C), these results are somewhat biased, though they are still in line with the results shown in Table 5. Note that the Levenshtein distance between the source and the translation of the target in the source language was also considered as a feature (i.e., Ft_target_cross_levenshtein). However, its importance was comparable to the feature Ft_source_cross_levenshtein, and due to the high correlation of these features and because it would involve another translation step, it was not withheld.
Next we used the calculated features to train a Support Vector Regression model. We used 5-fold cross-validation to tune the hyper-parameters and found that a Radial Basis Function with C = 10, γ = 0.19, and ε = 0.1 gave the best performance. A Random Forest Regression model was also considered; however, its performance was slightly worse. In Figure 5, we show the learning curve, where we show training and validation R2 for different sizes of the balanced training set. We observed that training and validation R2 converge for an increasing number of training samples, which indicates that our model does not show clear signs of over- or underfitting, and that the model would not benefit much from adding extra data to our training set.
Finally, a Support Vector Regression model was trained on the complete balanced training set, with the hyper-parameters listed above. In the next sections, we evaluated the performance of this model, both intrinsically and extrinsically.

3.2. Intrinsic Evaluation

As mentioned above, two types of intrinsic evaluation were performed: on the held-out labeled test set (FR–NL) and on two gold standards for alignment for the EN–FR and EN–GA language pairs described in Section 2.5.

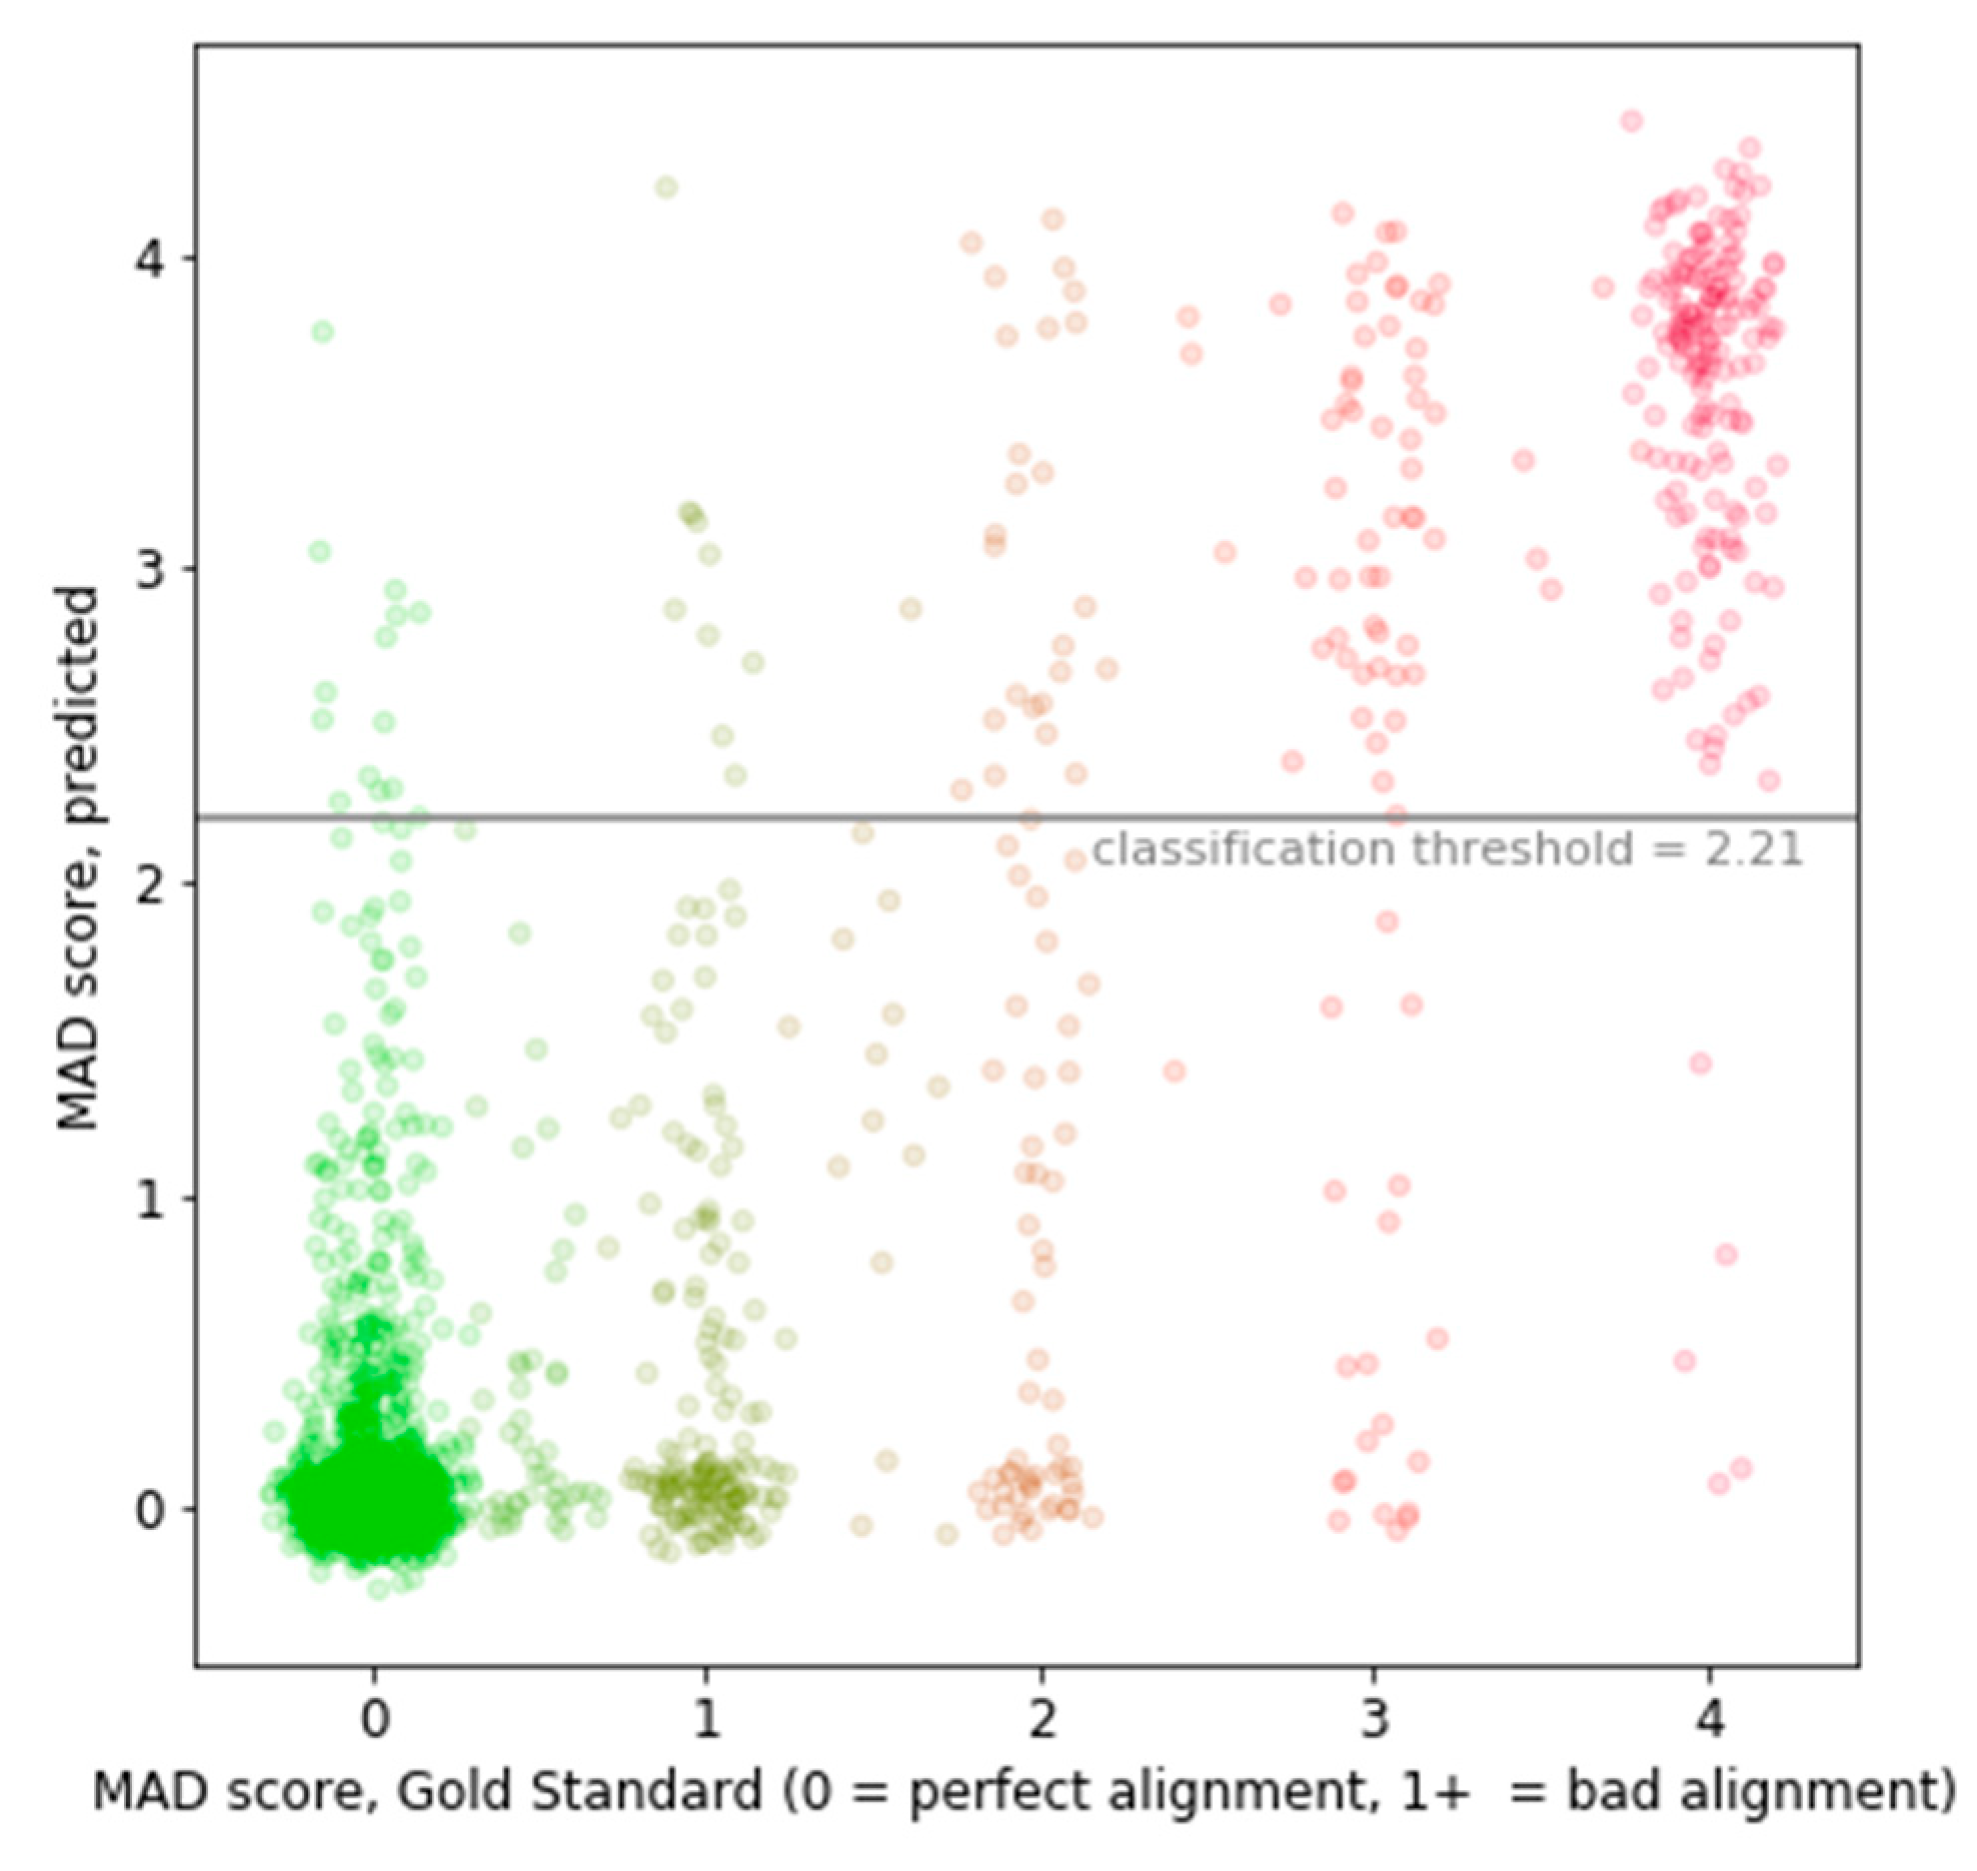
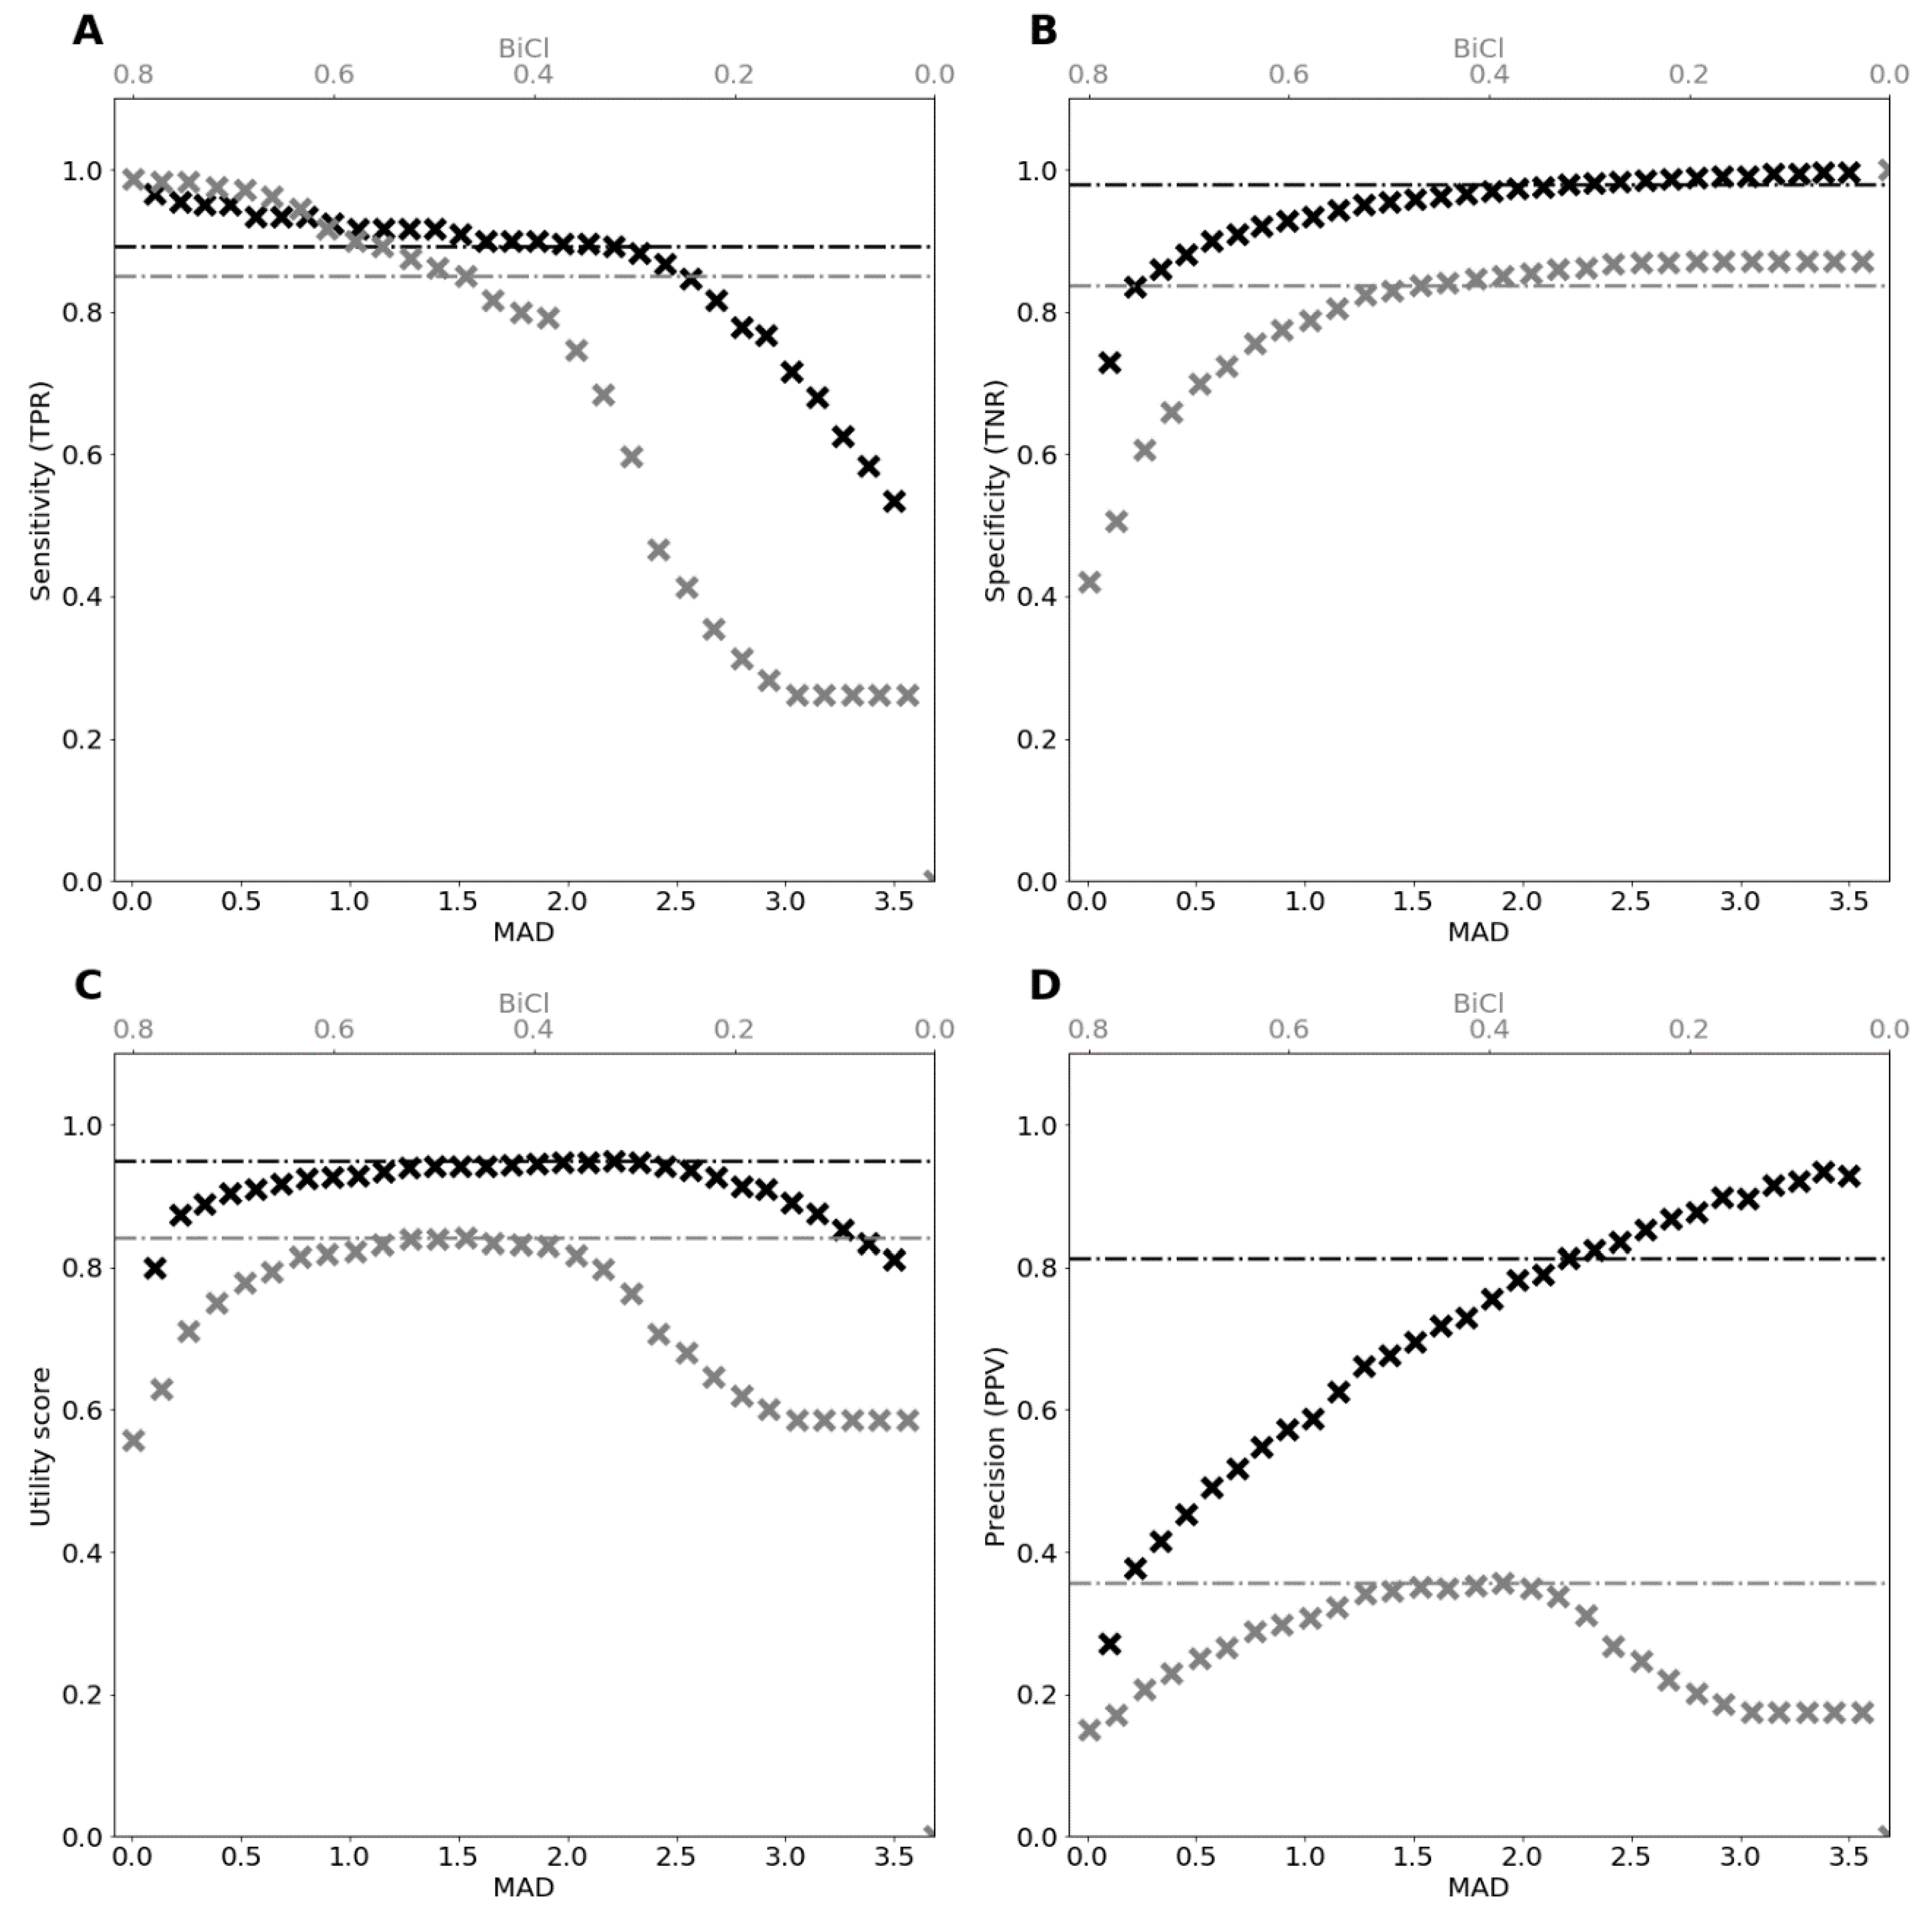
3.2.1. Intrinsic Evaluation on the Gold Standard for Misalignment Detection

In this section, we evaluate the performance of our model on the labeled held-out test set (FR–NL). We refer to Figure 6 for an overview of the Misalignment Gold Standard score (MAD score) versus the Predicted Misalignment score for sentence pairs in the held-out test set. We observed that our model was very good at detecting misalignments with a MAD score equal to 4. Also, perfectly aligned sentences (MAD score equal to 0) were scored as such. However, making the distinction among the intermediate scores proved to be a somewhat harder task.
Next, we calculated different metrics for various thresholds of our model and compared our results with the ones obtained when BiCleaner was run on the same data (see Figure 7). We calculated sensitivity, specificity, and precision. Also, a utility score was calculated (see Section 2.3), a classification metric biased towards sensitivity, which we want to maximize, as we want to minimize the number of misalignments classified as aligned. In order not to confuse the reader, we note that in this section, a misalignment was considered a positive label.
We observed that our model was better at the task of misalignment detection: although BiCleaner seemed to be able to detect misalignments if the threshold sufficiently increased (see Figure 7A), it also classified many aligned sentences as misaligned, i.e., lower precision and specificity, see Figure 7B,D. At the threshold level where the utility score was maximized (classification threshold equal to 2.21 for MAD and 0.51 for BiCleaner), our model performed better, especially in terms of precision.

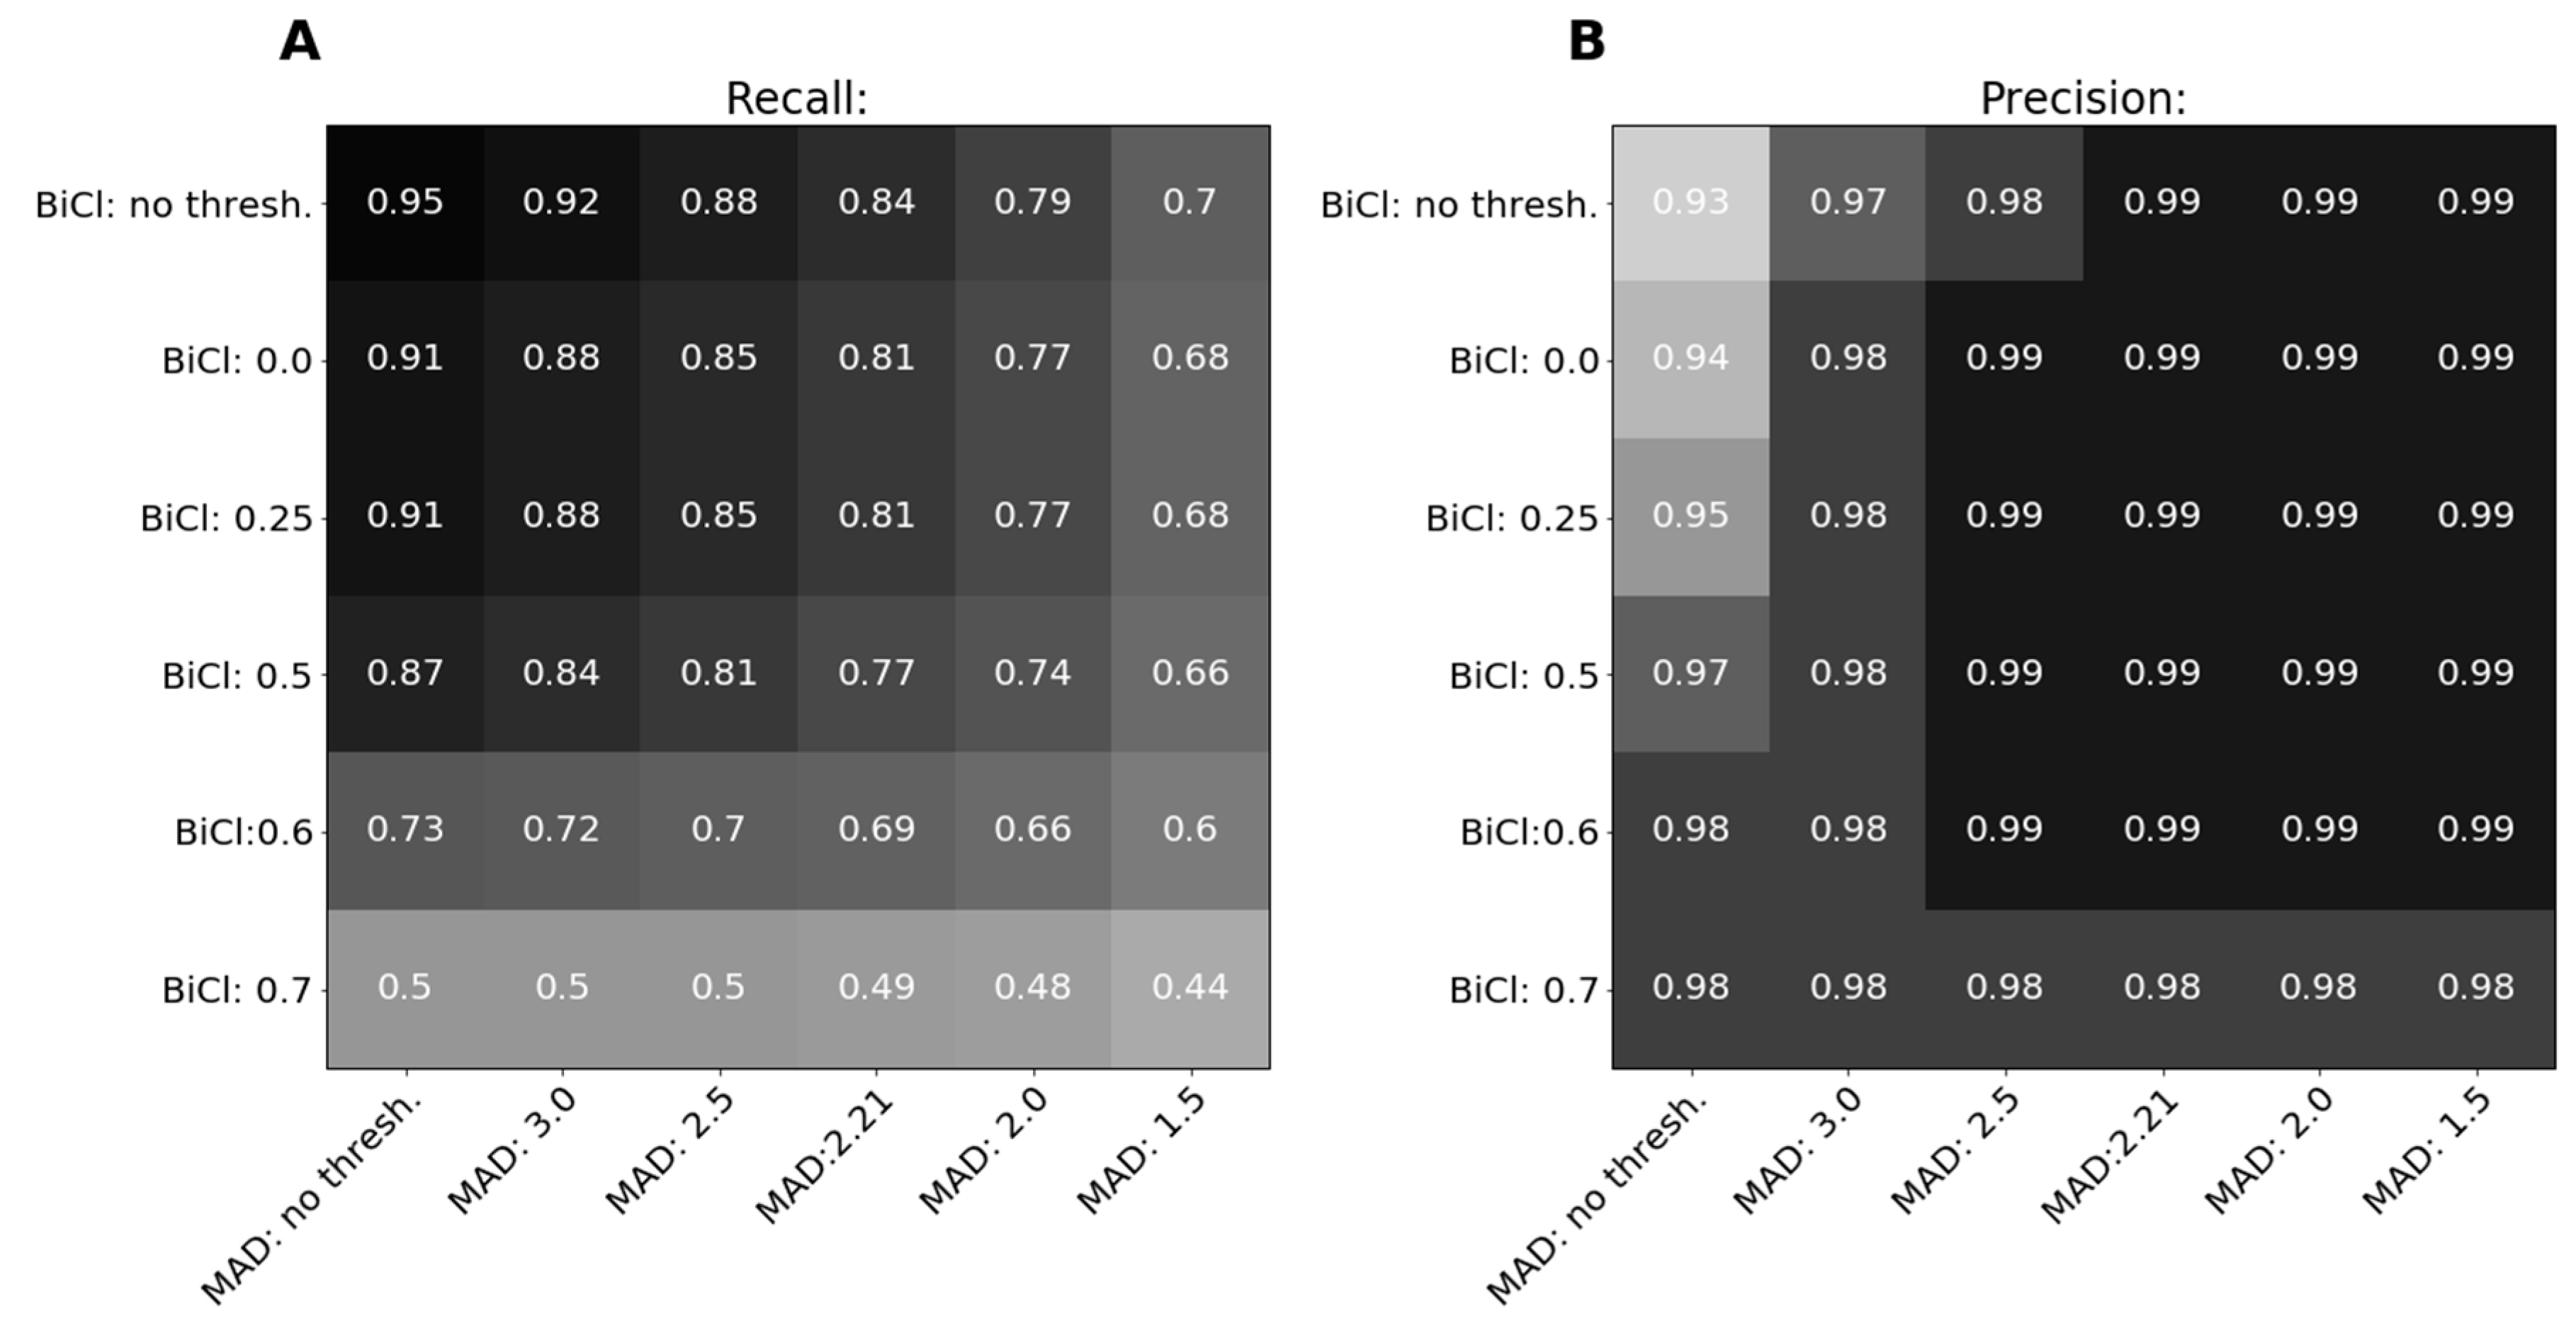
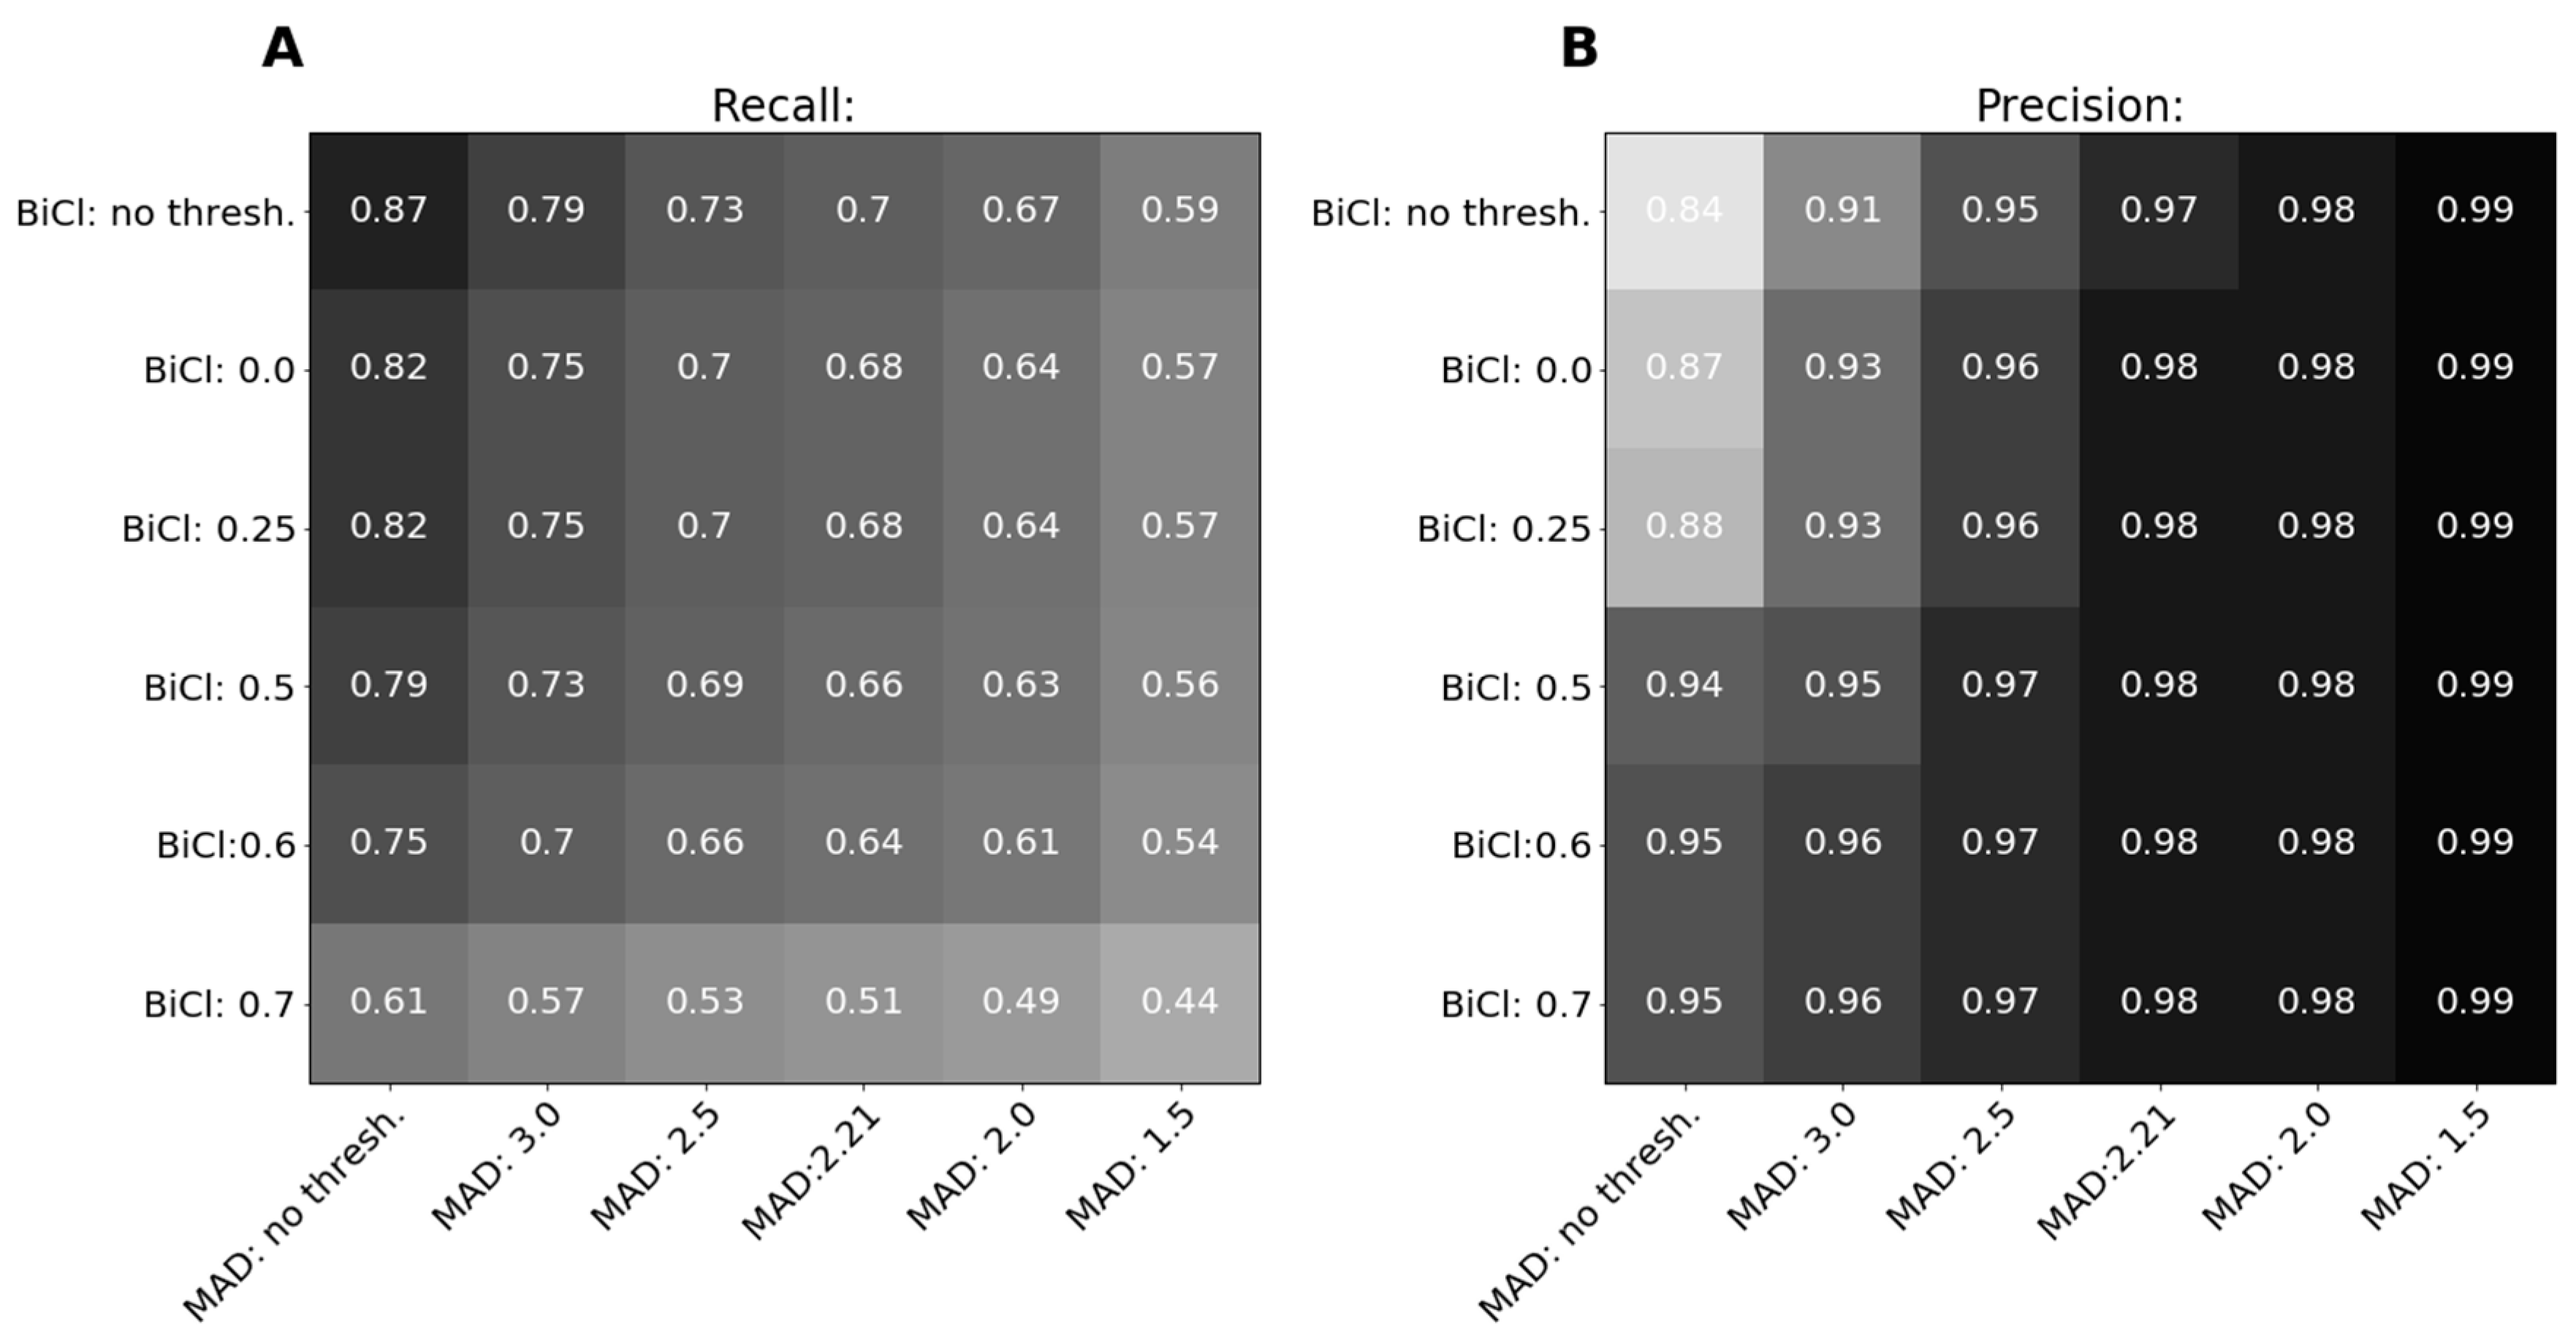
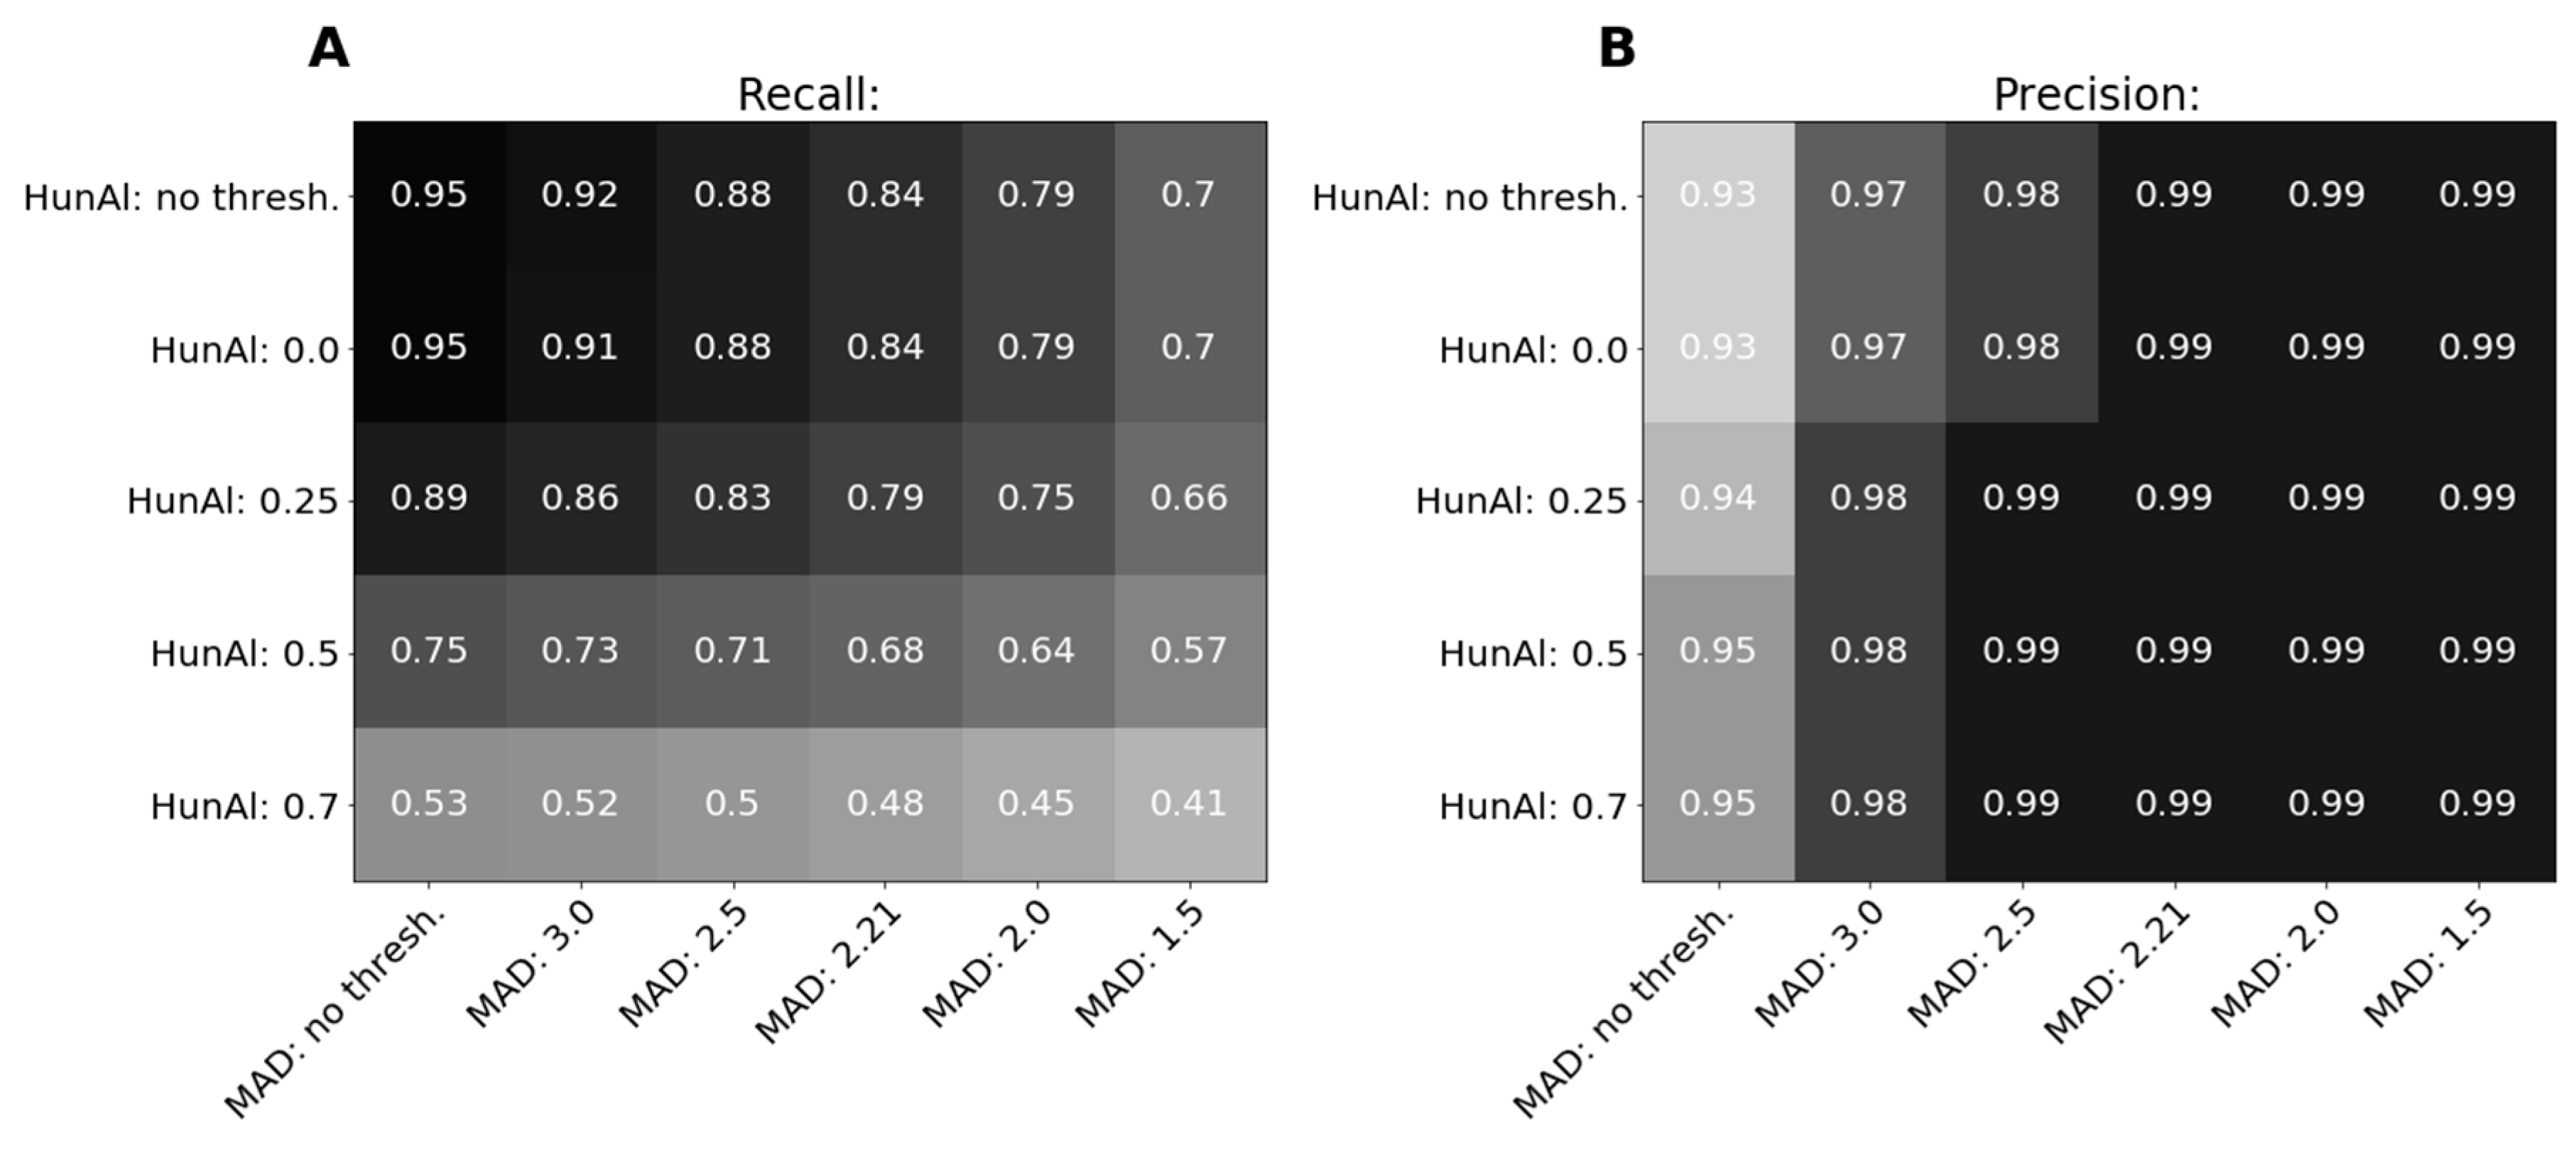
3.2.2. Intrinsic Evaluation on Gold Standards for Alignment

In this section, we examine to what extent MAD/BiCleaner can improve the alignment quality of a bilingual corpus. We present recall and precision scores for various thresholds of BiCleaner and our model (MAD) on gold standards for alignment.
For the creation of the set of gold standard beads, we manually sentence aligned 13 document pairs for EN–FR and 11 document pairs for EN–GA (we refer to Section 2.5). To obtain the set of predicted beads, we initially sentence aligned the document pairs, using Hunalign, after which MAD or BiCleaner were run on these alignments. We also refer to Figure 8 for an illustration of our adopted methodology.
To calculate recall, we took the set of gold standard beads and the set of predicted beads for a certain threshold of BiCleaner and MAD. Next, the total number of shared beads was divided by the total number of beads in the gold standard. Precision was calculated by taking the set of shared beads for a certain threshold of BiCleaner and MAD and dividing this number by the total number of predicted beads (see Figure 9 and Figure 10). The reported thresholds need to be interpreted as follows: all sentence pairs with a BiCleaner score lower than or with a MAD score higher than the corresponding threshold were ignored during evaluation.
By looking at the first row of Figure 9 and Figure 10 (A,B), we can already conclude that our model can improve the precision of the alignments produced by Hunalign for both language pairs, while still retaining a sufficiently high recall: both for EN–FR and EN–GA a precision of 98–99% could be reached, with a recall of around 90–85% for EN-FR and 70–60% for EN-GA (the actual value depends on the chosen threshold). If we compare the first row with the first column, we observe that the obtained precision using MAD was higher than the precision obtained using BiCleaner, especially if the recall scores are taken into account, e.g., for EN–FR a precision of 99% could be reached with a recall of 85%, while BiCleaner only reaches a precision of 98%, with a recall of 73%. For EN–GA a precision of 98–99% with a recall of around 70–60% was obtained using MAD, while BiCleaner only reaches a precision of 95% with a comparable recall.
For completeness, we mention that the tool used for sentence alignment, Hunalign, also yielded a score, providing an indication of the quality of the produced alignment. However, we observed that using a threshold for Hunalign, in an effort to remove misalignments, did not result in a more qualitative corpus in terms of alignment. We refer to Appendix D, Figure A2 and Figure A3 for an evaluation on the gold standards.

3.3. Extrinsic Evaluation

In this section we describe the extrinsic evaluation of our model, MAD, on two language pairs (EN–FR, EN–GA). Extrinsic evaluation was carried out by examining the effect of removal of detected misalignments from a web-scraped corpus on MT performance. Results will be compared to the ones obtained using another tool for misalignment detection, BiCleaner.
We trained EN > FR and EN > GA neural MT engines with OpenNMT-tensorflow (https://github.com/OpenNMT/OpenNMT-tf) using the Transformer architecture during 20 epochs and default training settings. Preprocessing was done with aggressive tokenization, and joint subword (BPE) and vocabulary sizes set to 32k. The translation quality of the MT models is measured by calculating BLEU scores on a held-out test set of 3k sentence pairs, sampled from the baseline training data (see Table 2). The reported BLEU score is the maximal BLEU reached in the last 10 epochs of training; convergence of our systems was observed after a few epochs (<10) of training.
For the EN–FR language pair we applied MAD and BiCleaner on the web-scraped corpus described in Section 2.4 (Table 3). Alignments with a MAD score higher, resp. BiCleaner score lower than a given threshold were removed from the corpus. The resulting corpus was then added to a sample of the baseline training data. The chosen threshold for MAD was the optimal threshold found via intrinsic evaluation (we refer to Section 3.2.1), while we used the BiCleaner threshold used in the official release of the clean ParaCrawl corpus (0.7). We reduced the baseline size to 1000k sentence pairs in order for it to have a similar weight as the web-scraped data. We refer to Table 6 for the results. We see that adding 1118k sentence pairs, selected by MAD, to the baseline training data results in an increase in BLEU of 0.7. However, adding the web-scraped corpus to the baseline data without removing possible misalignments, either with MAD or BiCleaner, results in an increase in BLEU of 1.0. The increase in BLEU when using BiCleaner instead of MAD was 0.5. A first conclusion that can be drawn from this experiment, is that, although misalignments were removed from the corpus, it does not result in an increase in BLEU compared to the situation when all unprocessed data were added: the increase in training data seemed to outweigh the decrease in alignment quality.
To further investigate the effect of the removal of misalignment on NMT performance, we did another set of experiments for the low resource EN–GA language pair using the ParaCrawl data, known to be very noisy. ParaCrawl data contains a diversity of noise: misalignments, untranslated sentences, non-linguistic characters, wrong encoding, language errors and short segments. It was shown in [4] that these other types of noise harm NMT performance to a much larger extent than misalignments, especially language errors and untranslated sentences. Because the focus of the present paper is on misalignment detection, we filter out these other types of noise by setting a BiCleaner threshold of 0.0 (setting a BiCleaner threshold of 0.0 will also remove sentence pairs with very different sentence lengths, i.e., misalignments that are easy to detect). This, combined with the removal of duplicates, reduces the size of the ParaCrawl corpus from 156M sentence pairs to 1234k. In this way our comparison to BiCleaner is less biased towards the effect of other types of noise not related to misalignments.
In Table 7 we show the results of our experiments (the number of an experiment is shown in the first column, the third and fourth column indicate the BiCleaner threshold and the MAD threshold). In all our experiments we added ParaCrawl data to the baseline training data for EN–GA. Due to the limited amount of baseline data, adding any data to the baseline already results in a minimum increase in BLEU of 10.6.
For a fair comparison of MAD and BiCleaner, the best scoring 500k sentence pairs (experiments 2 and 3) in terms of MAD, resp. BiCleaner score were considered. The performance in terms of BLEU score was similar, with BiCleaner performing 0.3 BLEU better. Taking a random sample of 500k sentences from the pre-filtered ParaCrawl corpus results in a worse performance (see experiment 4). As an interesting extra experiment, we trained an NMT engine on the 500k sentences assigned with the highest MAD score (i.e., sentences considered misaligned, see experiment 5), resulting in a BLEU 4.9–5.2 lower than the systems trained on the best scoring sentences.
The same experiments were performed with 600k sentence pairs instead of 500k (Experiments 6–8). It is interesting to see that adding sentences scoring worse in terms of misalignment score (either MAD or BiCleaner score), still add information to the NMT system, increasing the BLEU score by 0.6–0.3 BLEU.
If we add all the sentence pairs from the pre-filtered ParaCrawl corpus (1234k sentence pairs, experiment 10), we obtain a BLEU of 43.4, which is approximately the same BLEU as obtained when adding the 600k sentence pairs labeled as aligned by MAD or BiCleaner. So similarly as observed in our experiments for the EN–FR language pair, we see that adding sentences considered as misaligned does not seem to harm NMT performance. However, in terms of data selection, misalignment detection could be more important as we were able to obtain the same BLEU by adding only half of the data to the baseline system.
In a final set of experiments we investigated the effect of raw crawl data (i.e., misalignments and other types of noise present in ParaCrawl) on NMT performance. Therefore we sampled 1234k unique sentence pairs from the set of 156M raw ParaCrawl sentence pairs, and added this data to the baseline (Experiment 9) and to the top 600k sentences selected by MAD (experiment 11): we observe that adding these noisy sentence pairs to a fairly good performing NMT engine results in a decrease in BLEU of 1.8 (compare Experiment 11 with Experiment 6).

4. Discussion

In this paper, we investigated the problem of misalignment detection in the context of NMT. In contrast to previous research on this topic [6,7,8,9,10,11], we reformulated the problem as a supervised regression task, rather than a classification task. By assigning a score to various degrees of misalignments, we constructed a labeled dataset on which a regression model could be trained. Following this methodology, the predicted misalignment score was possibly easier to interpret, reflecting the degree of alignment/misalignment.
Our model for misalignment detection, MAD, makes use of several features, both shallow features (such as sentence length and matching numbers), as well as features calculated after an initial translation step. Using our labeled dataset, we showed that two features proved the most value for the task of misalignment detection, both obtained after a machine translation step: (1) the Levenshtein distance between the source/target and the translation of the target/source in the source/target language; (2) a feature that measures the semantic sentence similarity, using the cosine distance of sentence embeddings, similarly to References [9,10].
Note that in order to calculate the second feature, we used precomputed sentence embeddings in combination with a translation step, while in References [9,10,11,12,13,14,15,16,17,18,19] (cross-lingual) embeddings were trained directly on the task of misalignment detection. These (cross-lingual) embeddings fine-tuned to the task are likely to deliver better performance. However, such an approach could be more difficult to deploy compared to our model, especially if an MT model is already available.
We evaluated our model using two types of intrinsic evaluation. One involved a held-out labeled test set for FR–NL, the other gold standards for alignment for the EN–FR and EN–GA language pair. On the held-out labeled test set, our model showed to be promising, being able to detect more than 90% of the misalignments in the test set, depending on the chosen threshold, with a precision higher than 80%. Compared to another frequently used tool for misalignment detection, BiCleaner, our model performed better. However, we noted that these results should be interpreted with caution, as the held-out test set is, in terms of domain and language pair, close to the labeled training set used for training of our model. Therefore, we performed another type of intrinsic evaluation for the EN–FR and EN–GA language pair. We showed that our model could indeed increase the quality of alignments of a corpus, reaching a precision close to 100% when evaluated on a gold standard. Compared to BiCleaner our model showed better performance, especially if the recall was taken into account.
The effect of removing misalignments on NMT performance was investigated for the two language pairs EN–FR and EN–GA. In the case of EN–FR, we observed that removing alignments from a web-scraped corpus did not result in an increase in NMT performance, on the contrary, the decrease in data size outweighed the increased alignment quality. This result differs from previous work on misalignment detection and data cleaning in an NMT context, e.g., [4,11,14,20]. However, we noted that the web-scraped corpus EN–FR used for extrinsic evaluation was much cleaner in terms of misalignments and other noise than the corpora used in previous work, such as the OpenSubtitles and ParaCrawl corpus: the amount of misalignments and degree of misalignment (in terms of MAD score) present in the web-scraped corpus was probably too low to harm NMT performance, as is clear from the amount of data labeled as aligned by MAD (76% of the sentence pairs). We also refer to Reference [4] where it was shown that a considerable amount of misaligned sentences, all with a perceived MAD score of 4, need to be added to a clean corpus in order to obtain a decrease in BLEU; adding 20–50% (ratio of original clean corpus) of misaligned sentences to a clean corpus resulted in a decrease of 0.9–1.1 BLEU.
For the low resource EN–GA language pair, experiments were performed on the ParaCrawl corpus, known to contain a considerable number of misalignments and other types of noise. Our results were in line with the results obtained for the EN–FR language pair: adding misalignments did not result in a significant decrease in NMT performance. However, in terms of data selection, removing misalignments could be beneficial: similar BLEU scores were obtained using approximately half of the data, in line with Reference [13].
It should be noted that our model is specifically tuned for the task of misalignment detection, whereby parallel corpus mining and corpus cleaning (we refer to the WMT shared task on parallel corpus filtering [27,28] and the BUCC shared task on parallel corpus mining [29]), involve other important factors such as selection of sentences based on fluency and diversity anddetection of language errors, which possibly have a more profound effect on NMT performance, (e.g. [4]).
Because our proposed methodology requires a MT system, the question arises to what extent the parallel data used to train the MT system affects the performance of MAD. By applying MAD on two different types of data: i.e., a clean (EN–FR) corpus, related to the legal domain, and a noisy (EN–GA) corpus, containing more generic data, we tried to answer this question. We demonstrated that MAD could achieve fairly good performance on both types of data (i.e., legal and generic), while using an MT system trained on the same type of data (Table 2). Moreover, we applied MAD on the language pair EN–GA, using only 133k parallel sentences, illustrating the usability of the proposed methodology in a low-resource scenario.
In this work, we developed a model that tried to characterize the nature of misalignment beyond binary predictions. Identifying the degree of misalignment proved to be an important task: our experiments showed that adding misalignments to a corpus did not result in a significant decrease in NMT performance. Although we were able to detect misalignments with high precision, it turned out to be a difficult task to quantify the degree of misalignment. This should be addressed further in future work. Related to this, it would be useful to investigate what types of misalignment harm NMT performance the most, and, vice versa, what types of misalignments NMT could benefit from. Especially in the context of a low-resourced NMT, this could be of importance.

Author Contributions

Conceptualization, A.D., S.Z., R.M. and J.V.d.B.; methodology, A.D., S.Z. and R.M.; software, A.D., A.B., K.S. and K.V.W.; validation, A.D.; formal analysis, A.D.; investigation, A.D.; resources, A.D., F.E., K.S. and K.V.W.; data curation, A.D., J.B., F.E. and T.V.; writing—original draft preparation, A.D. and S.Z.; writing—review and editing, A.D., S.Z. and T.V.; visualization, A.D. and R.M.; supervision, J.V.d.B.; project administration, J.V.d.B.

Funding

This research received no external funding.

Conflicts of Interest

The authors declare no conflict of interest.

Appendix A

Algorithm A1. Pseudo-code to calculate the feature Ft_number_match.
def get_numbers(sentence):
  ‘Function that returns a set containing all the unique numbers in a given sentence.’
  return set_numbers
 
def get_size(set):
  ‘Function that returns the amount of numbers in a given set.’
  return size
 
def calculate_ft_number_match(source_sentence, target_sentence)
  ‘Function that calculates Ft_number_match given a source and target sentence.’
  set_numbers_source=get_numbers(source_sentence)
  set_numbers_target=get_numbers(target_sentence)
 
  ‘Calculate total amount of numbers in source and target sentence.’
  total_number=size(set_numbers_source)+size(set_numbers_target)
 
  ‘Calculate size of symmetric difference, union and intersection of the set of numbers in source and target sentence:’
  num_symdiff=size(symmetric_difference(set_numbers_source, set_numbers_target))
  num_union=size(union(set_numbers_source, set_numbers_target))
  num_intersect=size(intersection(set_numbers_source, set_numbers_target))
 
  ‘Calculate the number match score:’
  if total_numbers==0:
    score=0.0
  else if total_numbers!=0 and num_symdiff==0:
    score=round(1.0-(1.0+num_union)**(-0.3333),2)
  else if total_numbers >1 and num_symdiff >=1:
    score=-(num_symdiff - num_intersect)/num_union
 
  return score
We show some examples in Table A1:
Table A1. Some examples to illustrate calculation of Ft_number_match.
Source SentenceTarget SentenceFt_Number_Match
I was born on the 4th of May.I was born on the 5th of May.−1.00
I was born on the 4th of May.I was born on the 4th of May.0.21
I was born on the 4th of May. I have 2 sisters.I was born on the 4th of May. I have 2 sisters.0.31
I was born on the 4th of May. I have 5 sisters.I was born on the 4th of May. I have 2 sisters.−0.33
The feature Ft_number_match will thus assign a score of 0 if there are no numbers in the source or target sentence and a score of −1.0 if there are no matching numbers, and will increase/decrease if the number of matching numbers increases/decreases relative to the total amount of numbers present in the source and the target sentence.

Appendix B

Overview of the web-scraped corpus EN–FR.
Table A2. Overview of the scraped corpus EN–FR on domain/url-level.
Domain/Url
EN–FR
Description# Unique Sentence Pairs# Tokens (EN)
https://e-justice.europa.euEuropean e-justice portal50,8841,376,827
laws-lois.justice.gc.caConsolidated Acts and regulations66,3462,300,404
http://justice.gc.caDepartment of Justice142,4583,571,748
www.noscommunes.caHouse of commons1,042,79723,074,752
https://sencanada.caSenate123,5702,802,562
www.legifrance.gouv.frGovernment entity responsible for publishing legal texts online25,321827,434
www.oecd.orgOrg. for Economic Co-operation and Development.21,511571,287
Total (deduplicated) 1,472,51134,520,231

Appendix C

Correlation matrix of the features described in Section 2.2.
Figure A1. Correlation matrix (Pearson correlation).
Informatics 06 00035 g0a1

Appendix D

Recall and precision scores for various thresholds of Hunalign and our model (MAD) on the gold standard for alignment. The thresholds need to be interpreted as follows: all sentence pairs with a Hunalign score lower, or a MAD score higher than the corresponding threshold were ignored during evaluation.
Figure A2. Evaluation on gold standard (EN–FR) for various Hunalign and MAD thresholds. The first row shows results when no threshold is set for Hunalign, and the first column shows results when no threshold is set for MAD. (A) Recall. (B) Precision.
Informatics 06 00035 g0a2
Figure A3. Evaluation on gold standard (EN–GA) for various Hunalign and MAD thresholds. The first row shows results when no threshold is set for Hunalign, and the first column shows results when no threshold is set for MAD. (A) Recall. (B) Precision.
Informatics 06 00035 g0a3

References

  1. Goutte, C.; Carpaut, M.; Foster, G. The impact of Sentence Alignment Errors on Phrase-Based Machine Translation Performance. In Proceedings of the Tenth Biennial Conference of the Association for Machine Translation in the Americas, San Diego, CA, USA, 28 October–1 November 2012. [Google Scholar]
  2. Chen, B.; Kuhn, R.; Foster, G.; Cherry, C.; Huang, F. Bilingual Methods for Adaptive Training Data Selection for Machine Translation. In Proceedings of the 12th Conference of the Association for Machine Translation in the Americas (AMTA), Austin, TX, USA, 29 October–2 November 2016; p. 93. [Google Scholar]
  3. Belinkov, Y.; Bisk, Y. Synthetic and Natural Noise Both Break Neural Machine Translation. CoRR 2016, arXiv:abs/1711.02173. [Google Scholar]
  4. Khayrallah, H.; Koehn, P. On the Impact of Various Types of Noise on Neural Machine Translation. arXiv 2018, arXiv:1805.12282. [Google Scholar]
  5. Lamraoui, F.; Langlais, P. Yet Another Fast and Open Source Sentence Aligner. Time to Reconsider Sentence Alignment? In Proceedings of the Machine Translation Summit XIV, Nice, France, 2–6 September 2013; pp. 77–84. [Google Scholar]
  6. Munteanu, D.S.; Marcu, D. Improving Machine Translation Performance by Exploiting Non-Parallel Corpora. Comput. Linguist. 2005, 31, 477–504. [Google Scholar] [CrossRef]
  7. Etchegoyhen, T.; Azpeitia, A. Set-Theoretic Alignment for Comparable Corpora. In Proceedings of the 54th Annual Meeting of the Association for Computational Linguistics, Berlin, Germany, 7–12, August 2016; pp. 2009–2018. [Google Scholar]
  8. Abdul-Rauf, S.; Schwenk, H. On the Use of Comparable Corpora to Improve SMT performance. In Proceedings of the 12th Conference of the European Chapter of the ACL (EACL 2009), Athens, Greece, 30 March–3 April 2009; pp. 16–23. [Google Scholar]
  9. España-Bonet, C.; Csaba Varga, A.; Barrón-Cedeño, A.; van Genabith, J. An Empirical Analysis of NMT-Derived Interlingual Embeddings and their Use in Parallel Sentence Identification. IEEE J. Sel. Top. Signal Process. 2017, 11, 1340–1350. [Google Scholar] [CrossRef]
  10. Grégoire, F.; Langlais, P. A First Attempt Toward a Deep Learning Framework for Identifying Parallel Sentences in Comparable Corpora. In Proceedings of the 10th Workshop on Building and Using Comparable Corpora, Vancouver, Canada, 3 August 2017; pp. 46–50. [Google Scholar]
  11. Carpuat, M.; Vyas, Y.; Niu, X. Detecting Cross-lingual Semantic Divergence for Neural Machine Translation. In Proceedings of the First Workshop on Neural Machine Translation, Vancouver, Canada, 30 July–4 August 2017; pp. 69–79. [Google Scholar]
  12. Grégoire, F.; Langlais, P. Extracting Parallel Sentences with Bidirectional Recurrent Neural Networks to Improve Machine Translation. In Proceedings of the 27th International Conference on Computational Linguistics, Santa Fe, NM, USA, 21–25 August 2018; pp. 1442–1453. [Google Scholar]
  13. Schwenk, H. Filtering and Mining Parallel Data in a Joint Multilingual Space. In Proceedings of the 56th Annual Meeting of the Association for Computational Linguistics, Melbourne, Australia, 15–20 July 2018; Volume 2, pp. 228–234. [Google Scholar]
  14. Vyas, Y.; Niu, X.; Carpuat, M. Identifying Semantic Divergences in Parallel Text without Annotations. In Proceedings of the North American Chapter of the Association for Computational Linguistics: Human Language Technologies ACL, New Orleans, LA, USA, 1–6 June 2018; Volume 1, pp. 1503–1515. [Google Scholar]
  15. Bouamor, H.; Sajjad, H. Parallel Sentence Extraction from Comparable Corpora using Multilingual Sentence Embeddings. In Proceedings of the Eleventh International Conference on Language Resources and Evaluation (LREC), Miyazaki, Japan, 7–12 May 2018. [Google Scholar]
  16. Hassan, H.; Aue, A.; Chen, C.; Chowdhary, V.; Clark, J.; Federmann, C.; Huang, X.; Junczys-Dowmunt, M.; Lewis, W.; Li, M.; et al. Achieving Human Parity on Automatic Chinese to English Translation. arXiv 2018, arXiv:1803.05567. [Google Scholar]
  17. Pham, M.; Crego, J.; Senellart, J.; Yvon, F. Fixing Translation Divergences in Parallel Corpora for Neural MT. In Proceedings of the 2018 Conference on Emperical Methods in Natural Language Processing, Brussels, Belgium, 31 October–4 November 2018; pp. 2967–2973. [Google Scholar]
  18. Artetxe, M.; Schwenk, H. Margin-Based Parallel Corpus Mining with Multilingual Sentence Embeddings. arXiv 2018, arXiv:1811.01136. [Google Scholar]
  19. Guo, M.; Shen, Q.; Yang, Y.; Ge, H.; Cer, D.; Hernandez Abrego, G.; Stevens, K.; Constant, N.; Sung, Y.; Strope, B.; et al. Effective Parallel Corpus Mining using Bilingual Sentence Embeddings. In Proceedings of the Third Conference on Machine Translation (WMT), Brussels, Belgium, 31 October–1 November 2018; Volume 1, pp. 165–176. [Google Scholar]
  20. Sánchez-Cartagena, V.M.; Bañón, M.; Sergio Ortiz-Rojas, S.; Ramírez-Sánchez, G. Prompsit’s Submission to WMT 2018 Parallel Corpus Filtering Shared Task. In Proceedings of the Third Conference on Machine Translation (WMT), Brussels, Belgium, 31 October–1 November 2018; Volume 2, pp. 955–962. [Google Scholar]
  21. Conneau, A.; Kiela, D.; Schwenk, H.; Barrault, L.; Bordes, A. Supervised Learning of Universal Sentence Representations from Natural Language Inference Data. In Proceedings of the 2017 Conference on Emperical Methods in Natural Language Processing, Copenhagen, Denmark, 7–11 September 2017; pp. 670–980. [Google Scholar]
  22. Pedregosa, F.; Varoquaux, G.; Gramfort, A.; Michel, V.; Thirion, B.; Grisel, O.; Blondel, O.; Prettenhofer, P.; Weiss, R.; Dubourg, V.; et al. Scikit-learn: Machine Learning in Python. J. Mach. Learn. Res. 2011, 12, 2825–2830. [Google Scholar]
  23. Klein, G.; Kim, Y.; Deng, Y.; Senellart, J.; Rush, A.M. OpenNMT: Open-Source Toolkit for Neural Machine Translation. arXiv 2017, arXiv:1701.02810. [Google Scholar] [Green Version]
  24. Varga, D.; Németh, L.; Halácsy, P.; Kornai, A.; Trón, V.; Nagy, V. Parallel Corpora for Medium Density Languages. In Proceedings of the RANLP, Borovets, Bulgaria, 21–23 September 2005; pp. 590–596. [Google Scholar]
  25. Defauw, A.; Vanallemeersch, T.; Szoc, S.; Everaert, F.; Van Winckel, K.; Scholte, K.; Brabers, J.; Van den Bogaert, J. Collecting Domain Specific Data for MT: An Evaluation of the ParaCrawl Pipeline. In Proceedings of the Machine Translation Summit, Dublin, Ireland, 19–23 August 2019. [Google Scholar]
  26. Brown, P.F.; Lai, J.C.; Mercer, R.L. Aligning Sentences in Parallel Corpora. In Proceedings of the 29th Annual Meeting of the ACL, Berkeley, CA, USA, 18–21 June 1991; pp. 169–176. [Google Scholar]
  27. Barbu, E.; Parra Escartín, C.; Bentivogli, L.; Negri, M.; Turchi, M.; Orasan, M.F. The First Automatic Translation Memory Cleaning Shared Task. Comput. Transl. 2016, 30, 145–166. [Google Scholar] [CrossRef]
  28. Koehn, P.; Khayrallah, H.; Heafield, K.; Forcada, M.L. Findings of the WMT 2018 Shared Task on Parallel Corpus Filtering. In Proceedings of the Third Conference on Machine Translation (WMT), Brussels, Belgium, 31 October–1 November 2018; Volume 2, pp. 726–739. [Google Scholar]
  29. Zweigenbaum, P.; Sharoff, S.; Rapp, R. Overview of the Second BUCC Shared Task: Spotting Parallel Sentences in Comparable Corpora. In Proceedings of the 10th Workshop on Building and Using Comparable Corpora, Vancouver, Canada, 3 August 2017; pp. 60–67. [Google Scholar]
Figure 1. Overview of the relationship among the various datasets and models used.
Informatics 06 00035 g001
Figure 2. Illustration of how MAD can be applied on the EN–GA corpus.
Informatics 06 00035 g002
Figure 3. Distribution of MAD score for the labeled dataset.
Informatics 06 00035 g003
Figure 4. Feature importance (impurity) of our features in the training set. Black vertical lines show the variance of the feature importance.
Informatics 06 00035 g004
Figure 5. Learning curve. The figure shows training and validation R2 of a Support Vector Regression model for different sizes of the train set using 5-fold cross-validation.
Informatics 06 00035 g005
Figure 6. Gold Standard MAD score versus predicted MAD score for sentence pairs in the held-out test set.
Informatics 06 00035 g006
Figure 7. Evaluation of our model (MAD) on a held-out test set (2540 sentence pairs, 10% misaligned sentences) from the labeled dataset for misalignment detection described in Section 2.1. Black crosses show performance for various thresholds of MAD; gray crosses show performance for various BiCleaner thresholds. Note that a misalignment is considered a positive label. Horizontal, dotted black and gray lines show performance for MAD resp. BiCleaner thresholds for which the utility score is maximal. (A) Sensitivity for various MAD (black, lower x-axis) and BiCleaner (gray, upper x-axis) thresholds. (B) Specificity. (C) Utility score. (D) Precision.
Informatics 06 00035 g007
Figure 8. Intrinsic evaluation on Gold Standard for alignment.
Informatics 06 00035 g008
Figure 9. Evaluation of gold standard (EN–FR) for various BiCleaner and MAD thresholds. The first row shows recall/precision when no threshold was set for BiCleaner, the first column shows recall/precision when no threshold was set for MAD. (A) Recall. (B) Precision.
Informatics 06 00035 g009
Figure 10. Evaluation of gold standard (EN–GA) for various BiCleaner and MAD thresholds. The first row shows recall/precision when no threshold is set for BiCleaner, the first column shows recall/precision when no threshold is set for MAD. (A) Recall. (B) Precision.
Informatics 06 00035 g010
Table 1. Description of criteria used for labeling of the sentence pairs (S,T) from the dataset. In brackets, we show the translation into English of the French andDutch sentences respectively for the non-French and/or Dutch speaker.
MAD ScoreCriteriaExample (S)Example (T)
0
  • There is no missing or differing information. AND
  • The information is presented in basically the same way without errors.
Vous avez un permis de conduire valide.
(You have a valid driving license.)
U hebt een geldig rijbewijs.
(You have a valid driving license.)
1
  • There is a slight difference in information content. OR
  • There is disagreement about whether the translation is correct. OR
  • There is a slight error on one side such as a single misspelling.
Vous avez un permis de conduire valide.
(You have a valid driving license.)
U hebt een geldig rijbewijs.
(You have a valide driving license.)
2
  • There is a more significant difference in content/meaning. OR
  • There is a more significant error on one side such as a single garbled or missing word.
Vous avez un permis de conduire valide du FNI.
(You have a valid driving license from the FNI.)
U hebt een geldig rijbewijs van de DVLA in Swansea.
(You have a valid driving license from the DVLA in Swansea.)
3
  • There are major additions and/or omissions on one side. BUT
  • There is still some common information.
Vous avez un permis de conduire valide ou vous êtes en train de demander une licence provisoire.
(You have a valid driving license or you are applying for a temporary license.)
U hebt een geldig rijbewijs.
(You have a valid driving license.)
4
  • The source and target have nothing to do with each other (apart from perhaps topic).
Vous avez un permis de conduire valide.
(You have a valid driving license.)
Formulier C-63 moet ingediend worden drie weken op voorhand.
(Form C-63 must be submitted three weeks in advance.)
Table 2. Overview of the data used for training of X→EN engines necessary for document alignment and calculation of MAD features. A sample of this data was also used for training of our baseline engines EN→X. Columns two and three show the number of unique sentence pairs (EN–FR, EN–GA).
CorpusEN–FREN–GA
DCEP (https://wt-public.emm4u.eu/Resources/DCEP-2013/DCEP-Download-Page.html)3,728,97846,418
DGT (http://opus.nlpl.eu/DGT.php)3,071,99744,309
ECDC (https://ec.europa.eu/jrc/en/language-technologies/ecdc-translation-memory)2499-
EAC (https://ec.europa.eu/jrc/en/language-technologies/eac-translation-memory)4476-
Eubookshop (http://opus.nlpl.eu/EUbookshop-v2.php)-133,363
Total (deduplicated)4,258,861139,404
Table 3. Overview of the corpora used for extrinsic evaluation of MAD.
Language PairCorpus#Sentence Pairs
EN–FRweb-scraped corpus1,472,511
EN–GARaw ParaCrawl corpus v4.0156,189,807
Table 4. Gold standard statistics (EN–FR and EN–GA). Note that partial links involve two partially equivalent sentences that are not part of a bead; they are considered as a combination of a 0-to-1 bead and a 1-to-0 bead, hence they are ignored.
Type#Sentence Pairs
EN–FR:
English sentences723
French sentences716
1-to-1 beads629
Many-to-1 beads16
1-to-many beads18
Many-to-many beads1
Total number of beads used for evaluation664
1-to-0 beads35
0-to-1 beads32
English sentences in partial links5
French sentences in partial links5
Total number of beads731
EN–GA:
English sentences746
Irish sentences778
1-to-1 beads631
Many-to-1 beads18
1-to-many beads19
Many-to-many beads3
Total number of beads used for evaluation671
1-to-0 beads38
0-to-1 beads67
English sentences in partial links13
Irish sentences in partial links15
Total number of beads776
Table 5. Normalized F-score and MI.
FeatureF-ScoreMI
Ft_source_cross_levenshtein1.001.00
Ft_semantic_sim_infersent0.490.76
Ft_number_match0.210.51
Ft_senlength_diff0.100.16
Ft_senlength_av0.010.03
Table 6. Extrinsic evaluation of MAD and BiCleaner (EN–FR), with highest score shown in bold.
Type of Data (EN–FR)BiCl ThresholdMAD ThresholdUnique Sentence PairsUnique Sentence Pairs Added to the BaselineBLEU
baseline sample training data--1000k0k40.5
+web-scraped corpus (MAD)-2.212118k1118k41.2
+web-scraped corpus (BiCl)0.7-1787k787k41.0
+web-scraped corpus--2472k1472k41.5
Table 7. Extrinsic evaluation of MAD and BiCleaner (EN–GA) with highest scores shown in bold.
Exp nrType of Data (EN–GA)BiCl Thresh.MAD Thresh.Unique Sentence Pairs, TotalUnique Sentence Pairs Added to the BaselineBLEU
1baseline training data--133k0k25.0
2+ParaCrawl data (top500k MAD)0.02.27633k500k42.9
3+ParaCrawl data (top 500k BiCl)0.76-633k500k43.2
4+ParaCrawl data (random 500k)0.0-633k500k41.8
5+ParaCrawl data (top 500k misaligned MAD)0.0-633k500k38.0
6+ParaCrawl data (top 600k MAD)0.02.80733k600k43.5
7+ParaCrawl data (top 600k BiCl)0.7-733k600k43.5
8+ParaCrawl data (random 600k)0.0-733k600k42.3
9+ParaCrawl data (random noise)--1367k1234k35.6
10+ParaCrawl data (all, BiCl score > 0.0)0.0-1367k1234k43.4
11+ParaCrawl data (top 600k MAD)+ParaCrawl data (random noise)0.0,
-
2.80
-
1967k600k + 1234k41.7

