Visual Analysis of Stochastic Trajectory Ensembles in Organic Solar Cell Design
Abstract
:1. Introduction
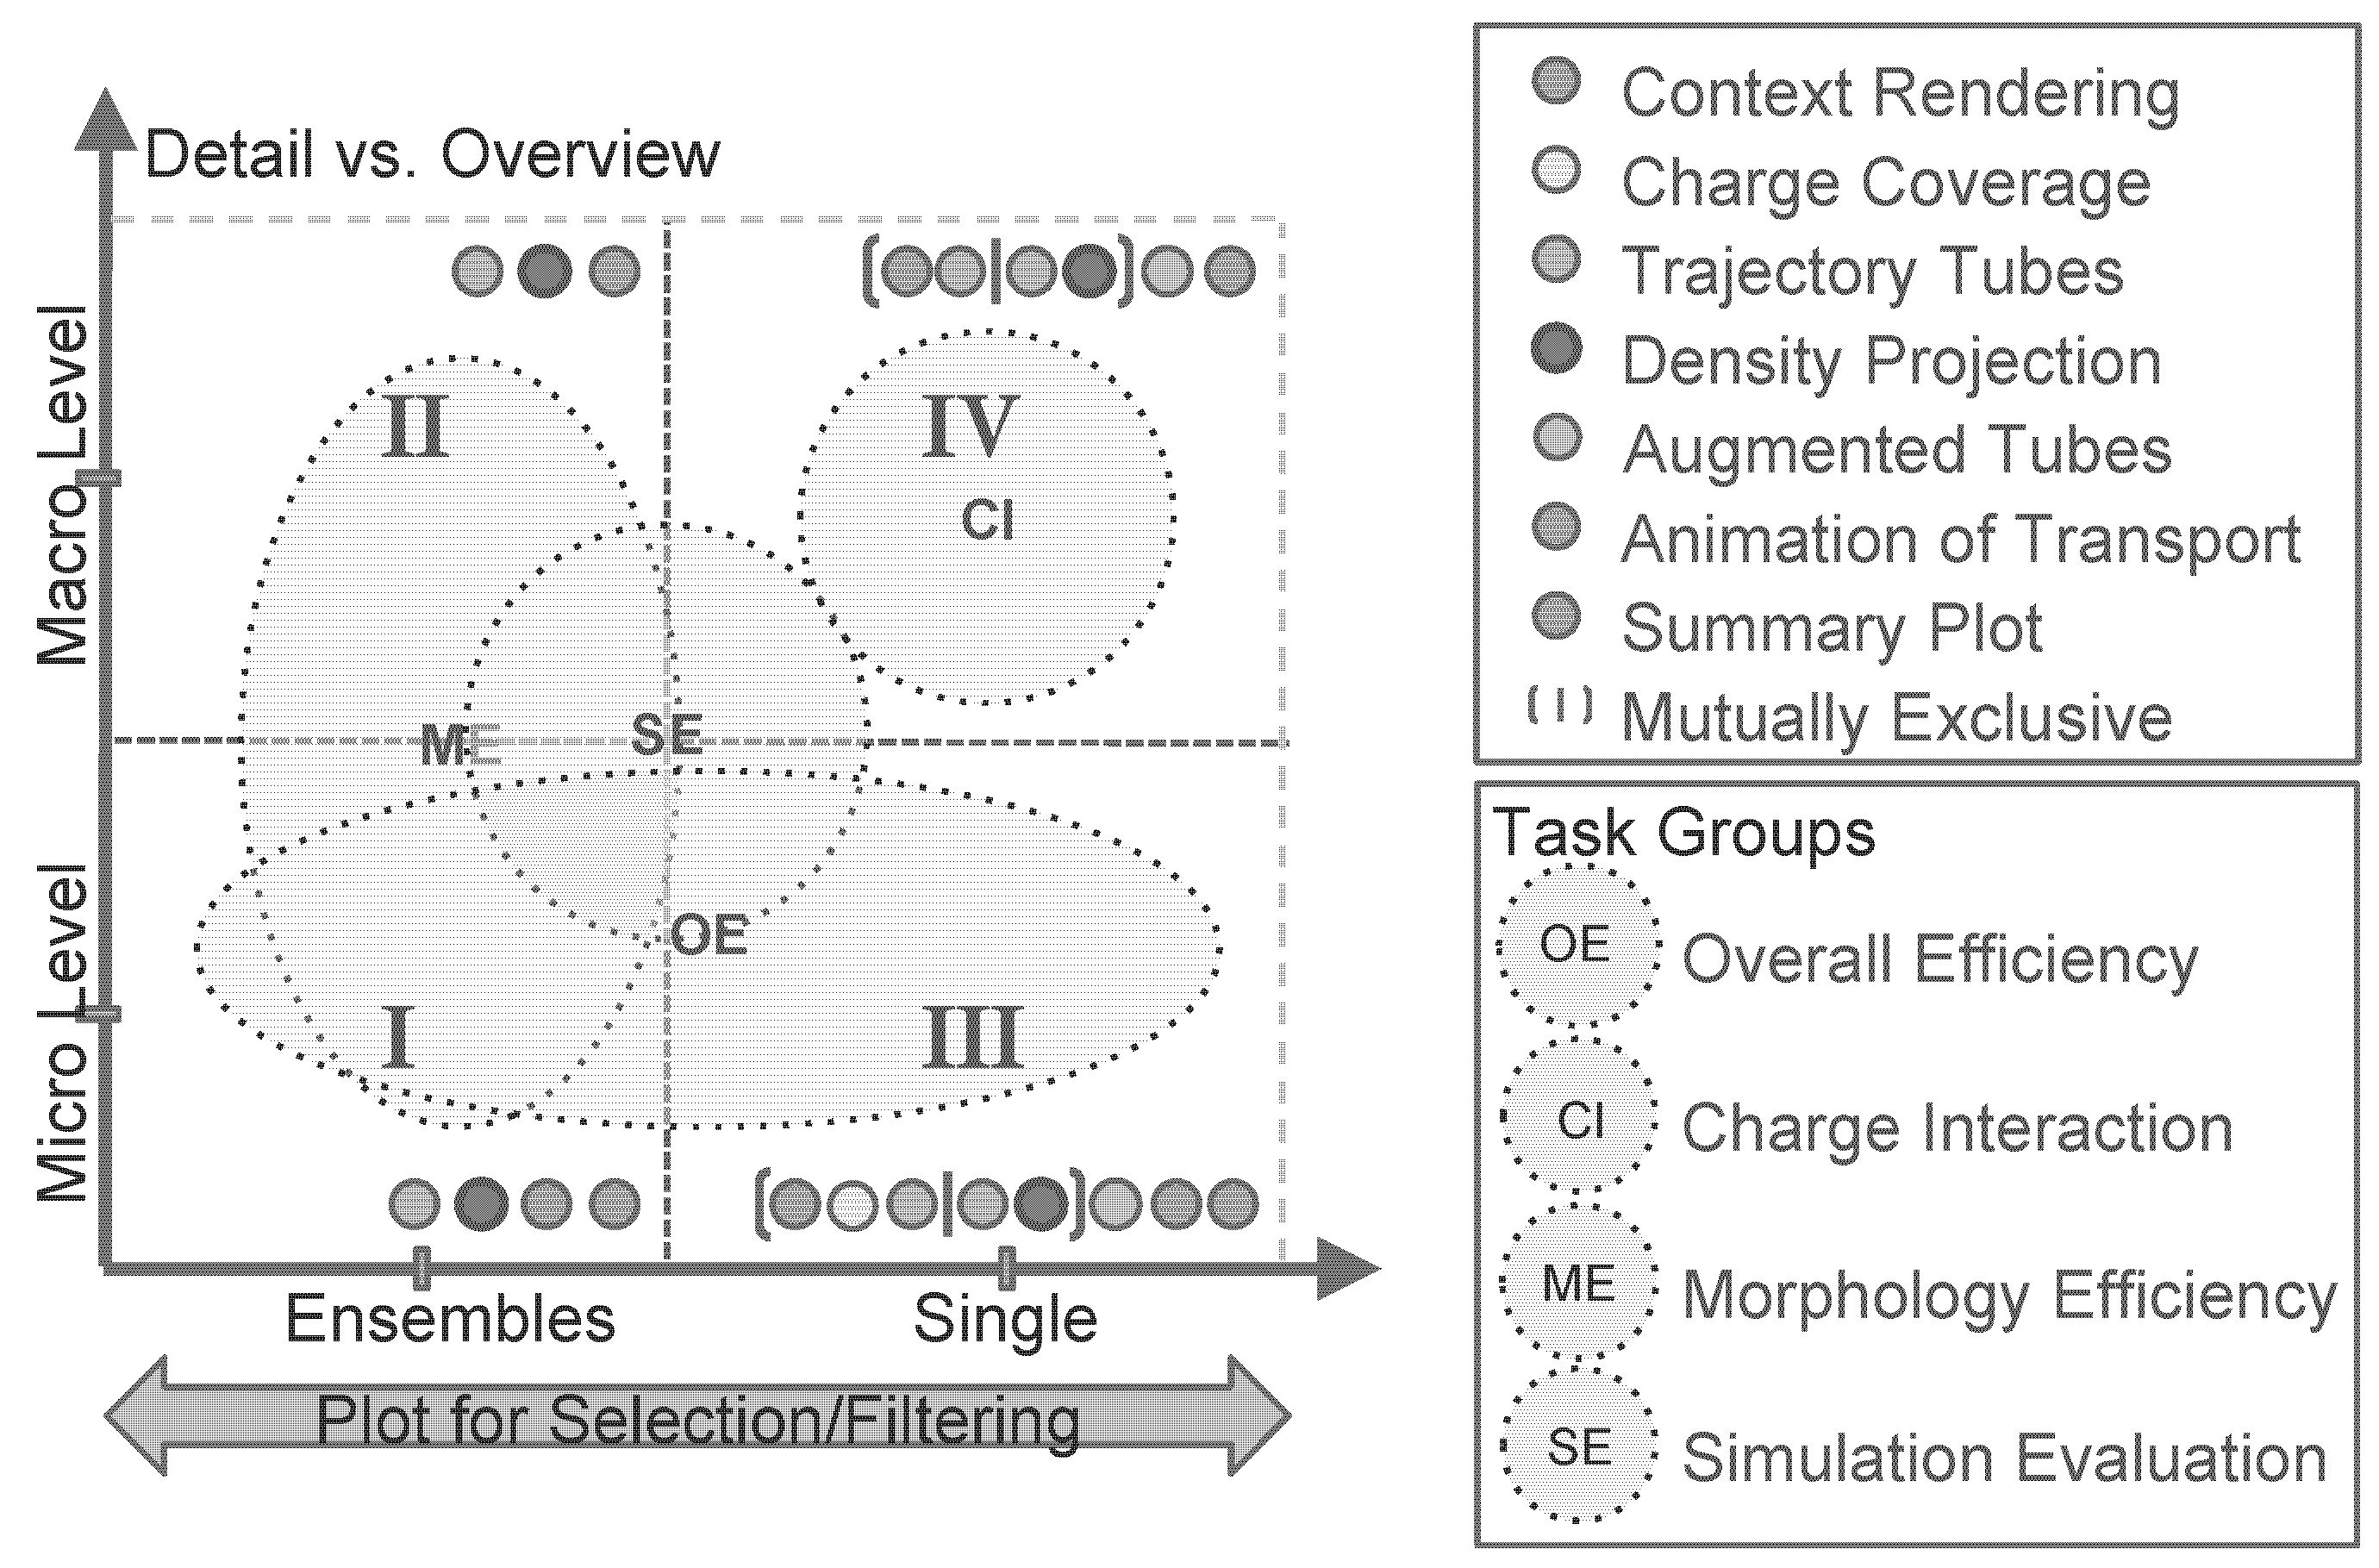
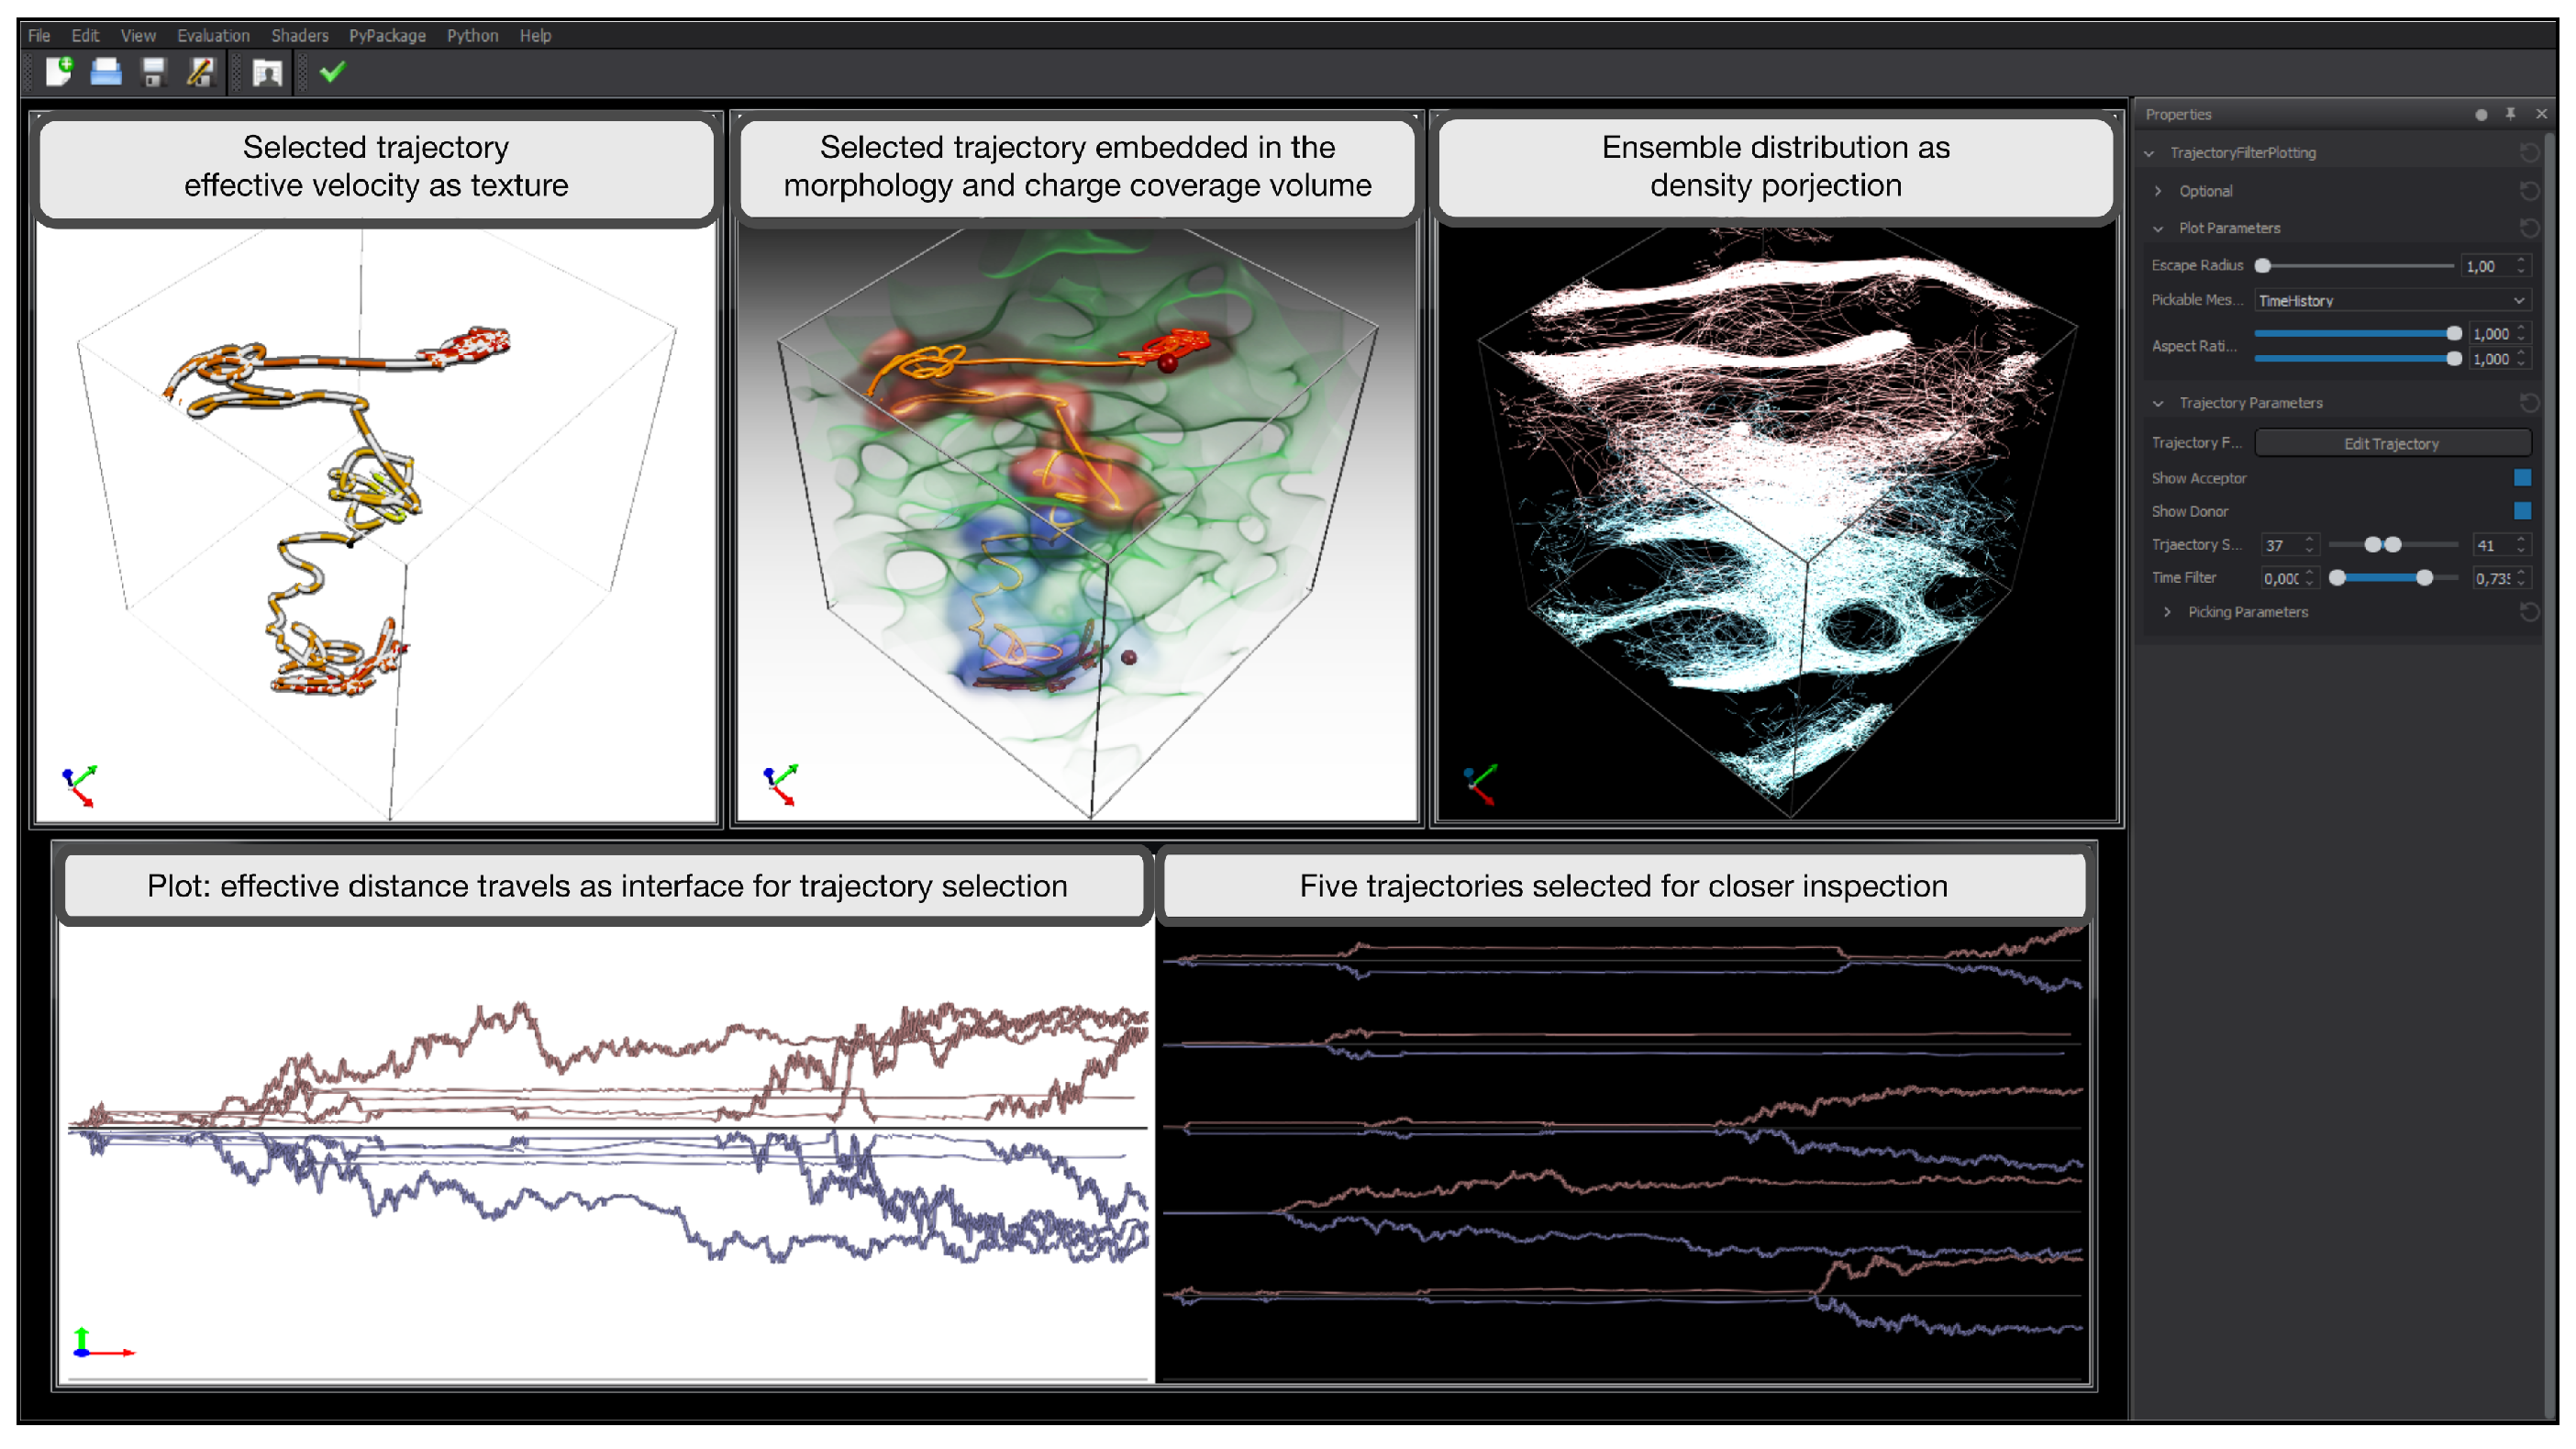
- We propose a set of linked visualization techniques that enable the investigation of dense charge-transport trajectory ensembles by exploiting trajectory abstraction and relating trajectories to a solar cell’s morphology.
- We propose novel geometric measures to analyze the efficiency of individual trajectories and trajectory ensembles based on the concept of charge flow lines.
- We discuss how these components are integrated into a single visualization framework, which supports domain experts when visually analyzing organic solar cell simulations.
1.1. Application Task Characterization
1.2. Organic Solar Cell Design
1.3. Some Details about the Data
2. Related Work
3. Trajectory Exploration Framework
3.1. Spatial Views
3.1.1. Quadrant I: Ensemble Visualization, Microscopic View
3.1.2. Quadrant II: Ensemble Visualization, Macroscopic View
3.1.3. Quadrant III and IV: Inspection of Individual Trajectories
3.2. Statistical Plots and Efficiency Measures
- (i)
- Trajectory-based measuresThese measures have the purpose to equip the macro-level charge flow lines with measures that are commonly related to flow. A central measure is the effective velocity, which describes the macro-level charge velocity. The measures can be adapted to the chosen level of detail via a scale parameter r. The unit for r is intermolecular distance.
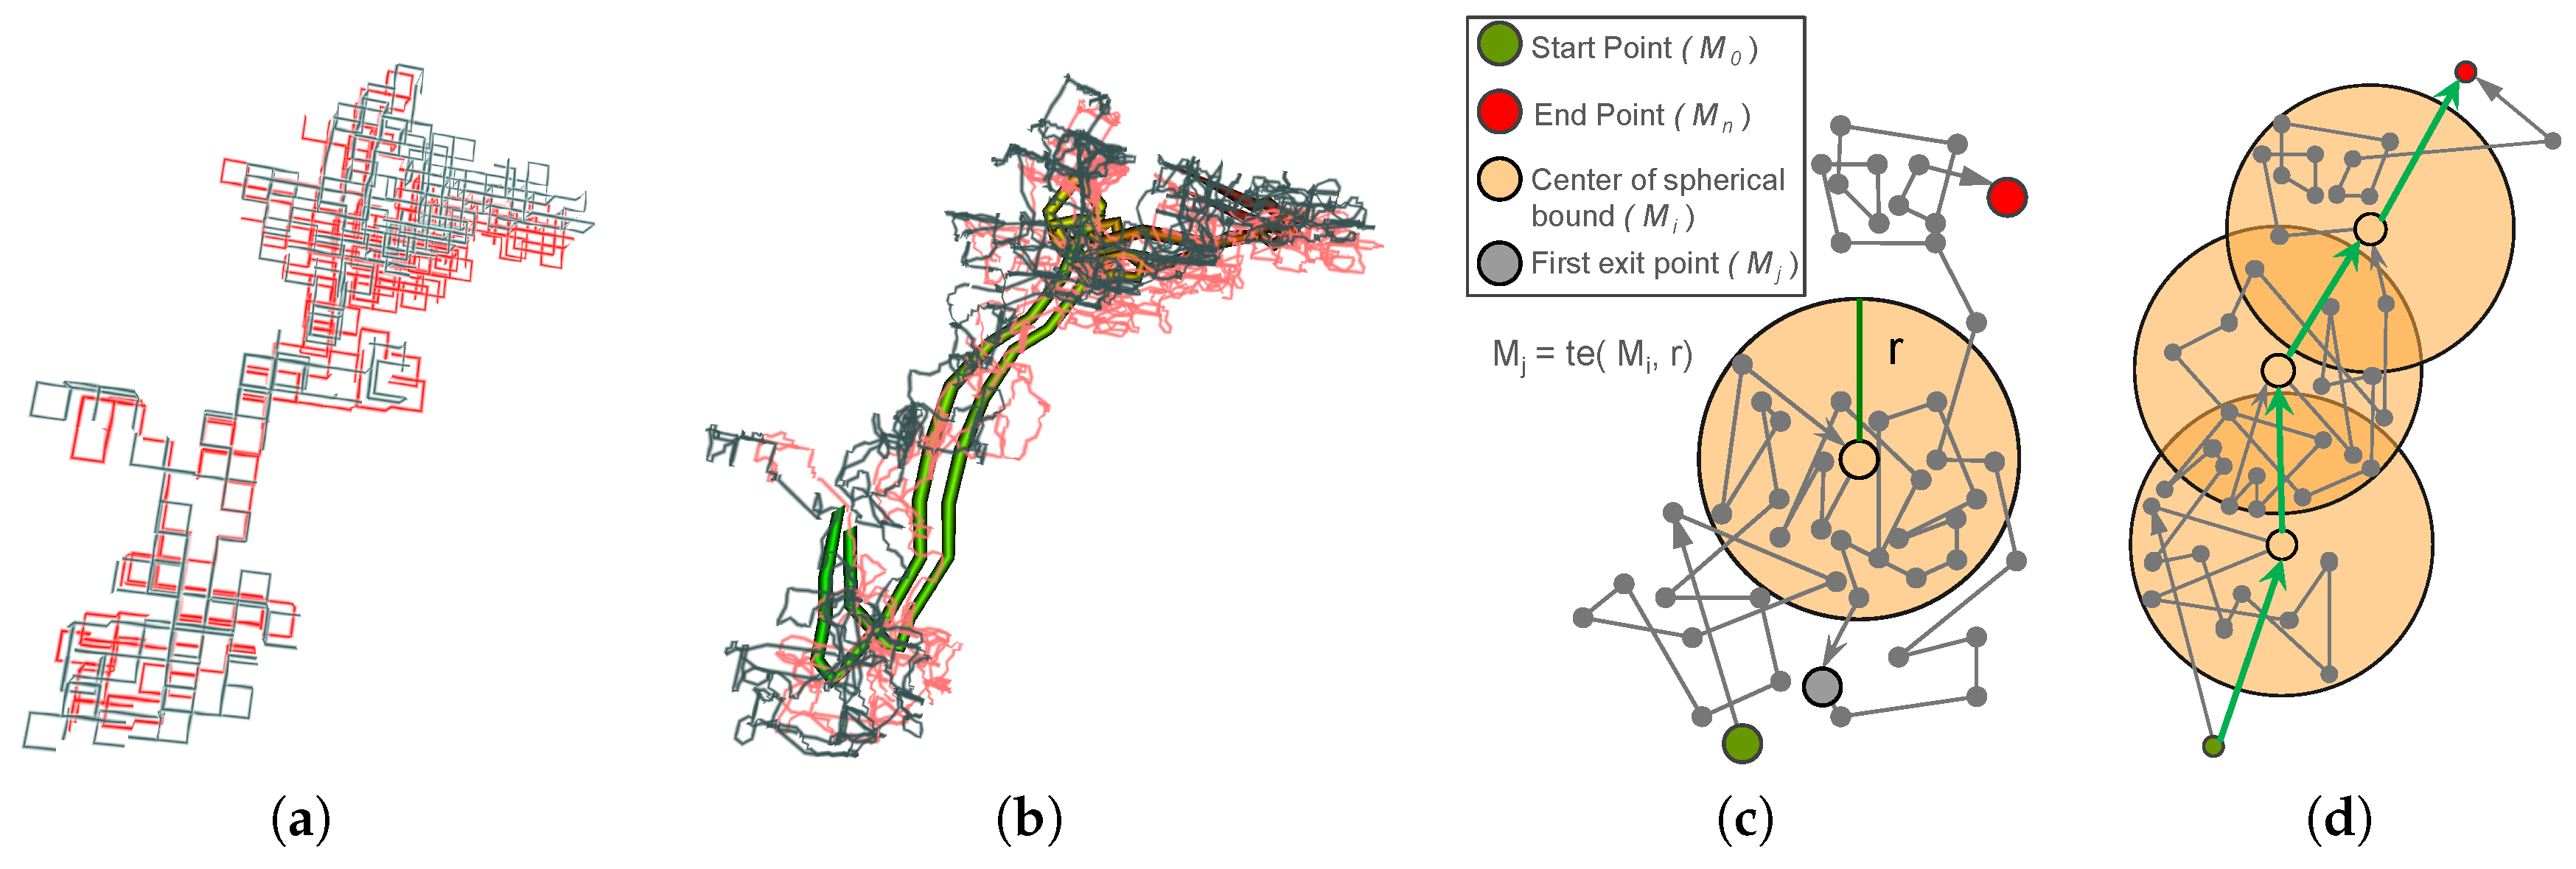
- Escape time . The escape time of a charge from molecule with respect to scale r is defined as the time the charge needs to leave the r-neighborhood of the molecule, see Figure 8c. It is high in regions where the charge is trapped for a longer time. The dwell time at a molecule corresponds to the escape time for .
- Effective velocity . The effective velocity is directly related to the escape time. Low velocity hints at low efficiency in the charge transport, this can be due to traps in the morphology or a strong inter charge interaction.
- Effective distance traveled —The effective distance is the Euclidean distance of the current charge position to the start position as function of time. This measure is related to the escape time but allows a stronger focus on the geometry of the trajectory.
- Tortuosity —Tortuosity sets the actual path length of the trajectory in relation to the effective distance traveled .
- (ii)
- Charge pair related measuresThe morphology of the material is not the only critical aspect for the efficiency of the charge transport. There is also a strong interaction between individual charge pairs influencing their transport. If charge pairs come very close to each other, this comprises the risk of recombination, which means that the charge is lost for the entire process.
- Pair distance —This distance measure keeps track of the Euclidean distance of a hole and an electron created in one CT state. In the optimal case this would be a monotonously increasing function of time.
- Minimal distance to charge of other kind —In the case of multiple CT states a recombination is not only possible with the own ‘partner’ (geminate recombination) but with all charges of the complementary type (nongeminate recombination). In this way it is a generalization of .
- Minimal distance to charge of same kind —Charges of the same type interact with each other and can thus reduce the effective transport. This measure gives an overview over the distribution of the charges within the material. Charges of the same type interact with each other and can thus reduce the effective transport. This measure gives an overview over the distribution of the charges within the material.
- (iii)
- Morphology related measuresThe morphology is a critical parameter for the design of the solar cells. While a large interfacing surface is advantageous for the creation of CT states, a complex morphology can crate traps for the charge transport.
- Distance to interface —This distance is the shortest distance of molecule to the material interface. It is computed once for each morphology. As distance metric we use a Manhattan metric following the molecular grid structure. Thus the distance roughly corresponds to the minimal number of charge transitions necessary to reach the interface. Since recombination of charges only happens at the material interface it is favorable that the charges keep a certain distance to the interface.
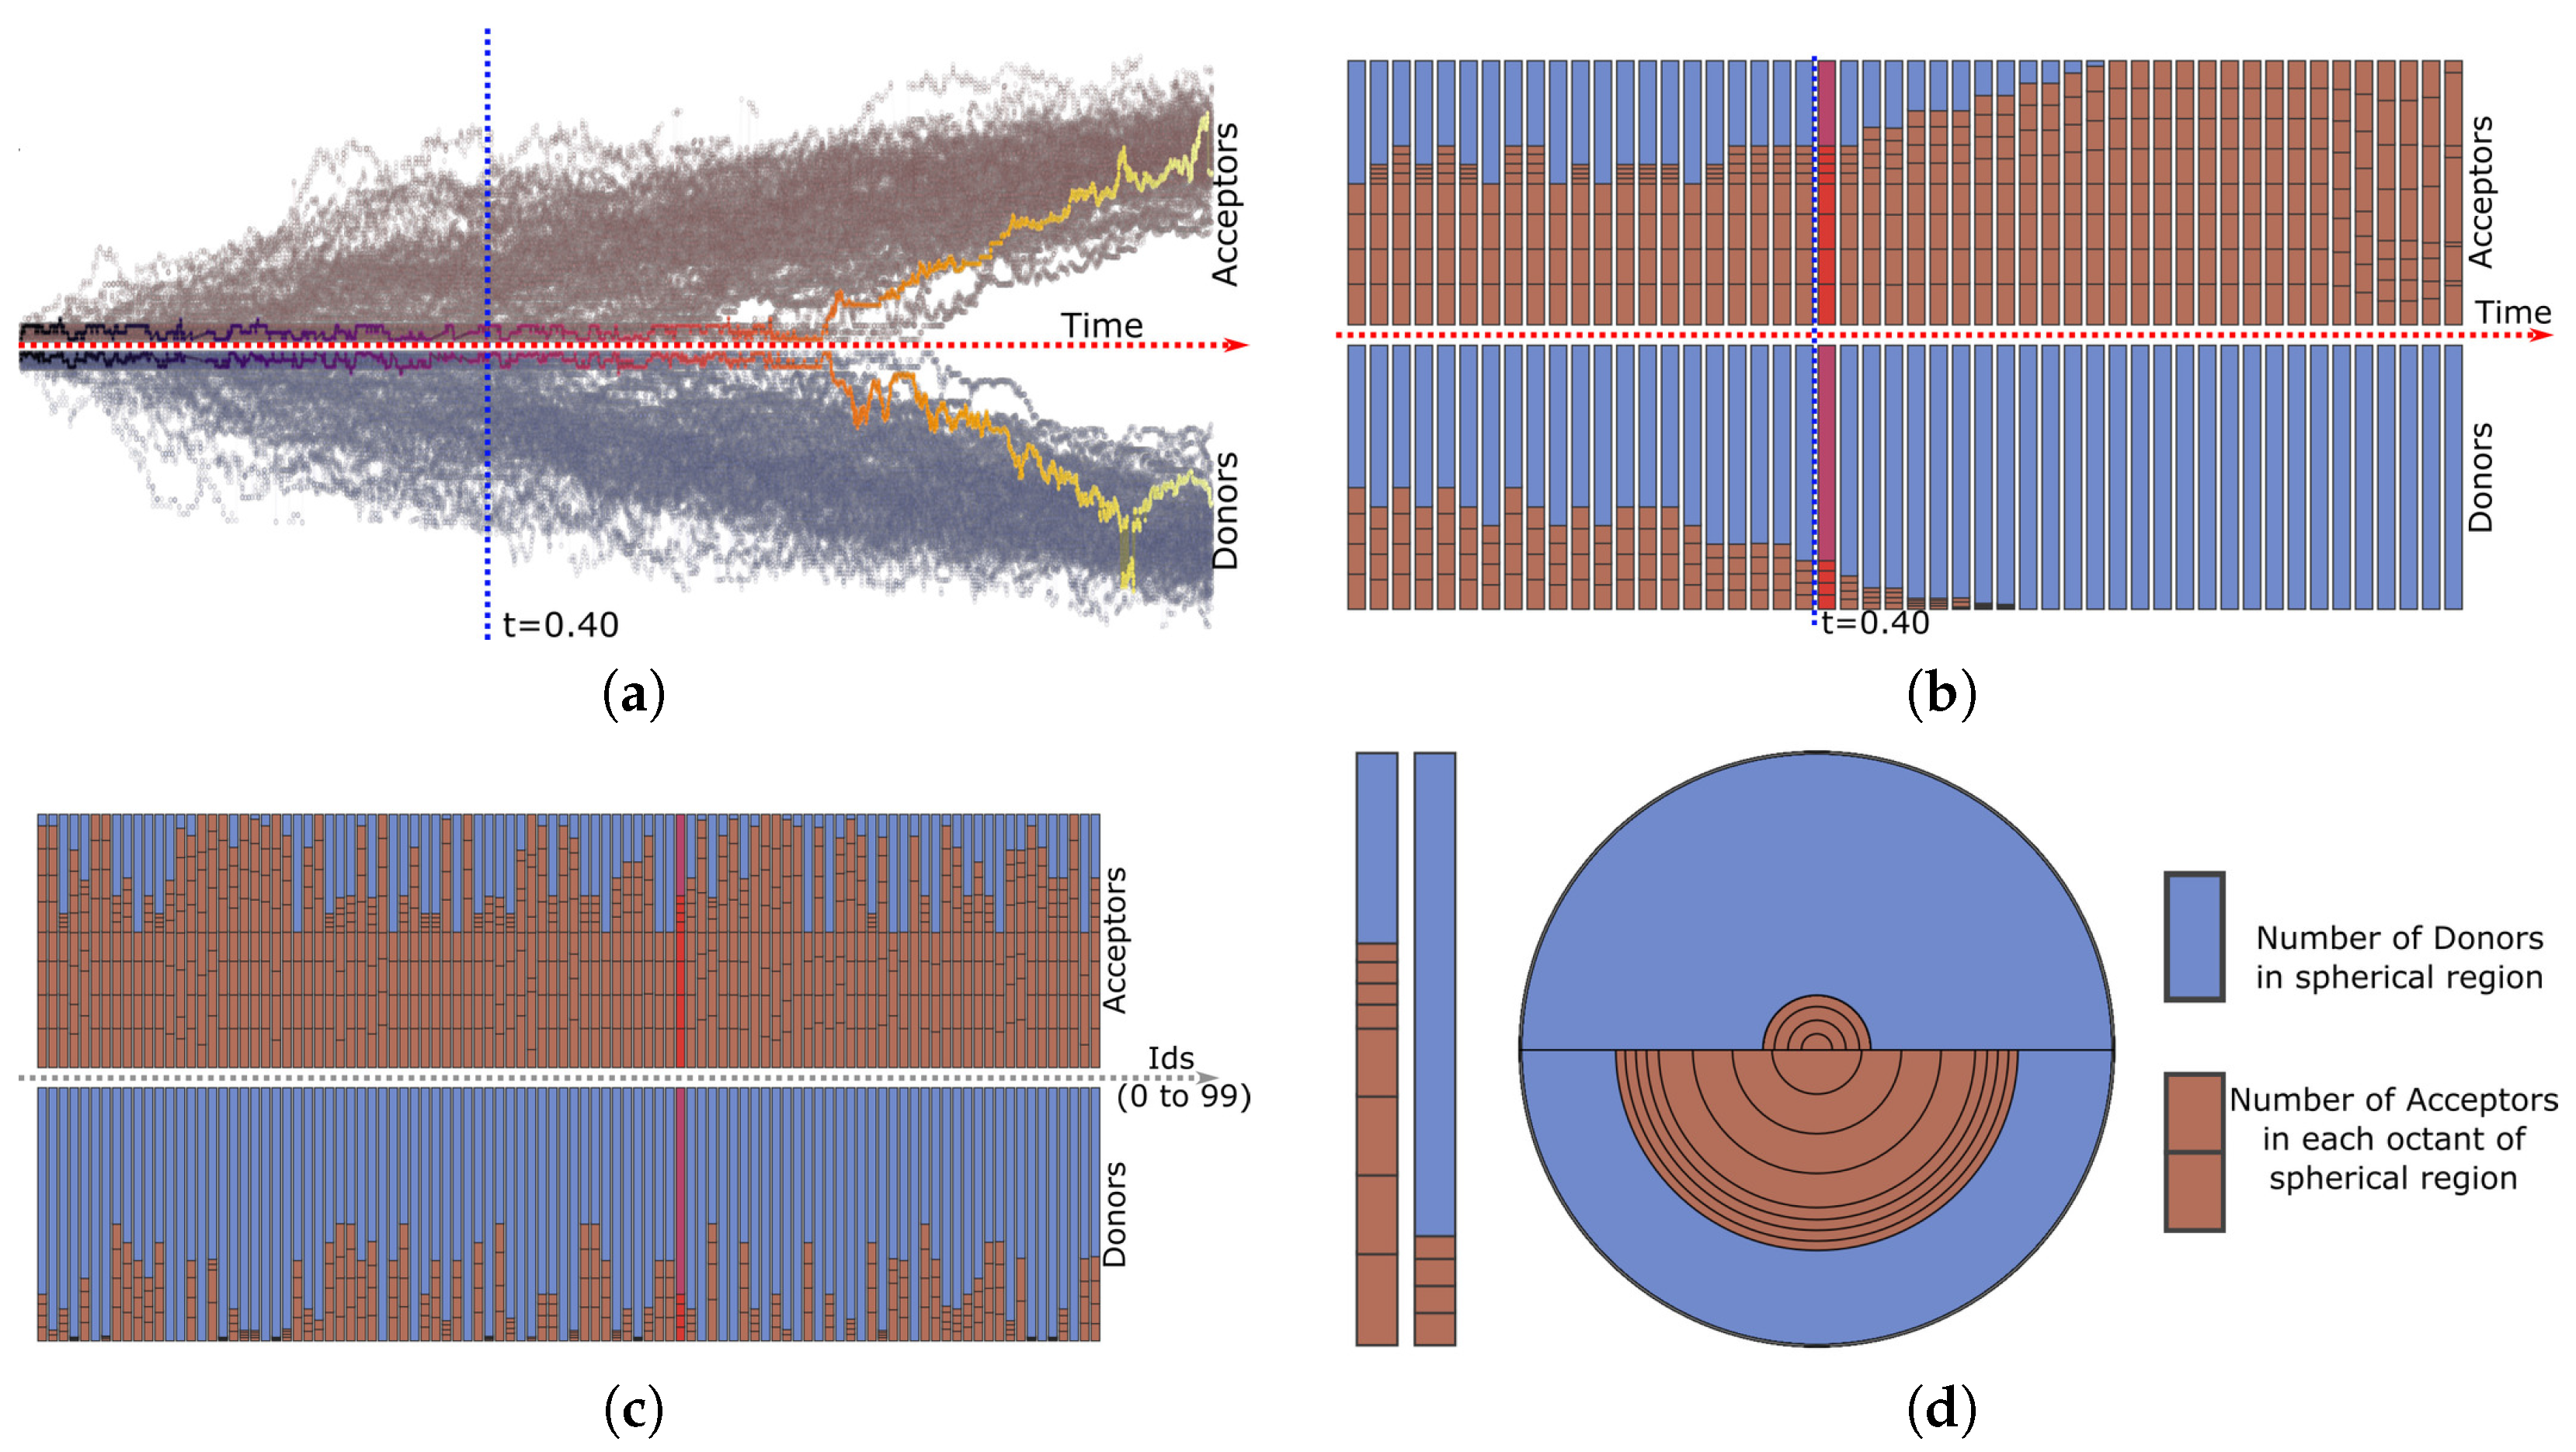
- Morphology Composition plots—Through these plots the morphology composition (acceptor-donor ratio) can be investigated. It displays the acceptor-donor material ratio in the neighborhood surrounding a charge. For a single trajectory, the ratio is plotted for the entire transportation (Figure 7b). For ensembles, the morphology ratio at a specific time (Figure 7c) is plotted. The acceptor-donor ratio is computed for a spherical region. The spherical region is divided into eight octants illustrating the distribution in each octant. (Figure 7d).
4. Technical Details
4.1. Charge Flow Lines
4.2. Ribbon Computation
5. Use Cases
5.1. Scenario 1—Simple Planar Interface One CT
5.2. Scenario 2—Complex Interface Exploration
6. Conclusions
Acknowledgments
Author Contributions
Conflicts of Interest
References
- Jakobsson, M.; Linares, M.; Stafström, S. Monte Carlo simulations of charge transport in organic systems with true off-diagonal disorder. J. Chem. Phys. 2012, 137, 114901. [Google Scholar] [CrossRef] [PubMed]
- Volpi, R.; Stafström, S.; Linares, M. A consistent Monte Carlo simulation in disordered PPV. J. Chem. Phys. 2015, 142, 094503. [Google Scholar] [CrossRef] [PubMed]
- Volpi, R.; Kottravel, S.; Norby, M.S.; Stafström, S.; Linares, M. Effect of Polarization on the Mobility of C60: A Kinetic Monte Carlo Study. J. Chem. Theory Comput. 2016, 12, 812–814. [Google Scholar] [CrossRef] [PubMed]
- Volpi, R.; Linares, M. Organic Solar Cells. In Specialist Periodic Reports—Chemical Modelling; RSC: London, UK, 2016; Volume 13. [Google Scholar]
- Tang, C.W. Two-layer organic photovoltaic cell. Appl. Phys. Lett. 1986, 48, 183–185. [Google Scholar] [CrossRef]
- Marcus, R.A. On the Theory of Oxidation, Reduction, Reactions Involving Electron Transfer. J. Chem. Phys. 1956, 24, 966. [Google Scholar] [CrossRef]
- Aboulhassan, A.; Baum, D.; Wodo, O.; Ganapathysubramanian, B.; Amassian, A.; Hadwiger, M. A Novel Framework for Visual Detection and Exploration of Performance Bottlenecks in Organic Photovoltaic Solar Cell Materials. Comput. Graph. Forum 2015, 34, 401–410. [Google Scholar] [CrossRef]
- Wodo, O.; Tirthapura, S.; Chaudhary, S.; Ganapathysubramanian, B. A graph-based formulation for computational characterization of bulk heterojunction morphology. Org. Electron. 2012, 13, 1105–1113. [Google Scholar] [CrossRef]
- Aboulhassan, A.; Li, R.; Knox, C.; Amassian, A.; Hadwiger, M. CrystalExplorer: An Interactive Knowledge-Assisted System for Visual Design of Solar Cell Crystal Structures. EuroVisShort 2012. [Google Scholar] [CrossRef]
- Kozlikova, B.; Krone, M.; Lindow, N.; Falk, M.; Baaden, M.; Baum, D.; Viola, I.; Parulek, J.; Hege, H.C. Visualization of Biomolecular Structures: State of the Art. EuroVisSTAR2015 2015. [Google Scholar] [CrossRef]
- Andrienko, N.; Andrienko, G. Visual analytics of movement: An overview of methods, tools and procedures. Inf. Vis. 2012, 12, 3–24. [Google Scholar] [CrossRef]
- Andrienko, G.; Andrienko, N.; Bak, P.; Keim, D.; Wrobel, S. Visual Analytics of Movement; Springer: Berlin, Germany, 2013. [Google Scholar]
- Doleisch, H.; Hauser, H.; Gasser, M.; Kosara, R. Interactive Focus + Context Analysis of Large, Time-Dependent Flow Simulation Data. Simulation 2006, 82, 851–865. [Google Scholar] [CrossRef]
- Gasteiger, R.; Neugebauer, M.; Beuing, O.; Preim, B. The FLOWLENS: A focus-and-context visualization approach for exploration of blood flow in cerebral aneurysms. IEEE Trans. Vis. Comput. Graph. 2011, 17, 2183–2192. [Google Scholar] [CrossRef] [PubMed]
- Zöckler, M.; Stalling, D.; Hege, H.C. Interactive visualization of 3d-vector fields using illuminated stream lines. In Proceedings of the IEEE Conference on Visualization (Vis ’96), San Francisco, CA, USA, 27 October–1 November 1996; pp. 107–114. [Google Scholar]
- Schussman, G.; Ma, K.L. Anisotropic Volume Rendering for Extremely Dense, Thin Line Data. In Proceedings of the IEEE Conference on Visualization ’04, Austin, TX, USA, 10–15 October 2004; pp. 107–114. [Google Scholar]
- Tarini, M.; Cignoni, P.; Montani, C. Ambient Occlusion and Edge Cueing to Enhance Real Time Molecular Visualization. IEEE Trans. Vis. Comput. Graph. 2006, 12. [Google Scholar] [CrossRef] [PubMed]
- Everts, M.H.; Bekker, H.; Roerdink, J.; Isenberg, T. Depth-Dependent Halos: Illustrative Rendering of Dense Line Data. IEEE Trans. Vis. Comput. Graph. 2009, 15, 1299–1306. [Google Scholar] [CrossRef] [PubMed]
- Eichelbaum, S.; Hlawitschka, M.; Scheuermann, G. LineAO—Improved Three-Dimensional Line Rendering. IEEE Trans. Vis. Comput. Graph. 2013, 19, 433–445. [Google Scholar] [CrossRef] [PubMed]
- Isenberg, T. A Survey of Illustrative Visualization Techniques for Diffusion-Weighted MRI Tractography. In Visualization and Processing of Higher Order Descriptors for Multi-Valued Data; Springer International Publishing AG: Gewerbestrasse, Switzerland, 2015; pp. 235–256. [Google Scholar]
- Diaz-Garcia, J.; Vazquez, P.P. Fast illustrative visualization of fiber tracts. In Advances in Visual Computing; Springer: Berlin/Heidelberg, Germany, 2012; pp. 698–707. [Google Scholar]
- Schröder, S.; Obermaier, H.; Garth, C.; Joy, K.I. Feature-based Visualization of Dense Integral Line Data; OASIcs-OpenAccess Series in Informatics. In Proceedings of the IRTG 1131 Workshop 2011, Kaiserslautern, Germany, 10–11 June 2011; Volume 27. [Google Scholar]
- Brambilla, A.; Carnecky, R.; Peikert, R.; Viola, I.; Hauser, H. Illustrative Flow Visualization: State of the Art, Trends and Challenges. STARs 2012, 75–94. [Google Scholar] [CrossRef]
- Everts, M.H.; Bekker, H.; Roerdink, J.B.; Isenberg, T. Interactive illustrative line styles and line style transfer functions for flow visualization. arXiv 2015, arXiv:arXiv:1503.05787. [Google Scholar]
- Salzbrunn, T.; Garth, C.; Scheuermann, G.; Meyer, J. Pathline Predicates and Unsteady Flow Structures. Vis. Comput. 2008, 24, 1039–1051. [Google Scholar] [CrossRef]
- Kuhn, A.; Lindow, N.; Günther, T.; Wiebel, A.; Theisel, H.; Hege, H.C. Trajectory Density Projection for Vector Field Visualization, Eurovis Short Papers. In Proceedings of the EuroVis 2013, Leipzig, Germany, 17–21 June 2013. [Google Scholar]
- Lindholm, S.; Falk, M.; Sunden, E.; Bock, A.; Ynnerman, A.; Ropinski, T. Hybrid Data Visualization Based On Depth Complexity Histogram Analysis. Comput. Graph. forum 2014, 34, 74–85. [Google Scholar] [CrossRef]
- Scharsach, H. Advanced GPU raycasting. In Proceedings of the CESCG 2005, Budmerice, Slovakia, 9–11 May 2005; pp. 69–76. [Google Scholar]
- Sanyal, J.; Zhang, S.; Dyer, J.; Mercer, A.; Amburn, P.; Moorhead, R.J. Noodles: A Tool for Visualization of Numerical Weather Model Ensemble Uncertainty. IEEE Trans. Vis. Comput. Graph. 2010, 16, 1421–1430. [Google Scholar] [CrossRef] [PubMed]
- Wilson, A.T.; Potter, K.C. Toward visual analysis of ensemble data sets. In Proceedings of the 2009 Workshop on Ultrascale Visualization (UltraVis ’09), Portland, OR, USA, 16 November 2009; ACM: New York, NY, USA, 2009; pp. 48–53. [Google Scholar]
- Ferstl, F.; Bürger, K.; Westermann, R. Streamline Variability Plots for Characterizing the Uncertainty in Vector Field Ensembles. IEEE Trans. Vis. Comput. Graph. 2015, 22, 767–776. [Google Scholar] [CrossRef] [PubMed]
- Bos, W.J.T.; Kadoch, B.; Schneider, K. Angular Statistics of Lagrangian Trajectories in Turbulence. Phys. Rev. Lett. 2015, 114, 214502. [Google Scholar] [CrossRef] [PubMed]
- Savage, J.; Voth, G.A. Persistent Subdiffusive Proton Transport in Perfluorosulfonic Acid Membranes. J. Phys. Chem. Lett. 2014, 5, 3037–3042. [Google Scholar] [CrossRef] [PubMed]
- Burov, S.; Tabei, S.M.A.; Huynh, T.; Murrell, M.P.; Philipson, L.H.; Rice, S.A.; Gardel, M.L.; Scherer, N.F.; Dinner, A.R. Distribution of directional change as a signature of complex dynamics. Proc. Natl. Acad. Sci. USA 2013, 110, 19689–19694. [Google Scholar] [CrossRef] [PubMed]





© 2017 by the authors. Licensee MDPI, Basel, Switzerland. This article is an open access article distributed under the terms and conditions of the Creative Commons Attribution (CC BY) license (http://creativecommons.org/licenses/by/4.0/).
Share and Cite
Kottravel, S.; Volpi, R.; Linares, M.; Ropinski, T.; Hotz, I. Visual Analysis of Stochastic Trajectory Ensembles in Organic Solar Cell Design. Informatics 2017, 4, 25. https://doi.org/10.3390/informatics4030025
Kottravel S, Volpi R, Linares M, Ropinski T, Hotz I. Visual Analysis of Stochastic Trajectory Ensembles in Organic Solar Cell Design. Informatics. 2017; 4(3):25. https://doi.org/10.3390/informatics4030025
Chicago/Turabian StyleKottravel, Sathish, Riccardo Volpi, Mathieu Linares, Timo Ropinski, and Ingrid Hotz. 2017. "Visual Analysis of Stochastic Trajectory Ensembles in Organic Solar Cell Design" Informatics 4, no. 3: 25. https://doi.org/10.3390/informatics4030025
APA StyleKottravel, S., Volpi, R., Linares, M., Ropinski, T., & Hotz, I. (2017). Visual Analysis of Stochastic Trajectory Ensembles in Organic Solar Cell Design. Informatics, 4(3), 25. https://doi.org/10.3390/informatics4030025


