Article

Direct Visual Editing of Node Attributes in Graphs

by
Christian Eichner
1,
Stefan Gladisch
2,
Heidrun Schumann
1 and
Christian Tominski
1,*
1
Institute of Computer Science, University of Rostock, A.-Einstein-Str. 22, Rostock D-18059, Germany
2
Fraunhofer Institute for Computer Graphics Research IGD, J.-Jungius-Str. 11, Rostock D-18059, Germany
*
Author to whom correspondence should be addressed.
Informatics 2016, 3(4), 17; https://doi.org/10.3390/informatics3040017
Submission received: 15 July 2016 / Revised: 1 September 2016 / Accepted: 23 September 2016 / Published: 1 October 2016

Abstract

:
There are many expressive visualization techniques for analyzing graphs. Yet, there is only little research on how existing visual representations can be employed to support data editing. An increasingly relevant task when working with graphs is the editing of node attributes. We propose an integrated visualize-and-edit approach to editing attribute values via direct interaction with the visual representation. The visualize part is based on node-link diagrams paired with attribute-dependent layouts. The edit part is as easy as moving nodes via drag-and-drop gestures. We present dedicated interaction techniques for editing quantitative as well as qualitative attribute data values. The benefit of our novel integrated approach is that one can directly edit the data while the visualization constantly provides feedback on the implications of the data modifications. Preliminary user feedback indicates that our integrated approach can be a useful complement to standard non-visual editing via external tools.

Graphical Abstract

1. Introduction

Visualization enables users to effectively extract relevant information from complex data [1]. However, data-intensive work today typically also includes manipulating the data [2]. That is, new or altered information must be input into an existing database. Examples are adding missing values, correcting erroneous data items, and inserting new facts.
Visualization usually focuses on representing the data, while editing the data requires external tools. For example, when a data analyst finds a problem in the data that needs correcting, he or she has to switch to a separate view or even another software tool to actually make the correction. To confirm that the edit operation has the desired effect, the analyst has to go back to the visualization tool, look up the modified data item, and assess its correctness. This example makes clear that there is a significant indirection between the data visualization and the data editing.
As convincingly argued by Baudel [3], data visualization tools should ideally enable the editing of the data as well. The advantages are obvious. First, the visual representation would support users in discovering data items being relevant for edit operations. Second, the data editing could be facilitated by means of direct interaction with the visual representation. Third, the effect of the edit operation in the local and global context of the data would be visible immediately.
Such a direct visual editing approach reduces the need to resort to external non-visual tools to a minimum and thus promotes a fluid data analysis and editing workflow [4]. On top of that, it enables continuous editing operations during which the user can test different what-if scenarios before a new data value is eventually set.
Our goal is to bring these advantages to bear. To this end, we introduce an integrated visualize-and-edit approach for editing node attributes of graphs. The key idea is to combine classic visualization methods with direct visual editing interaction. We use node-link representations to visualize a graph’s structure, while attribute-dependent layouts emphasize the characteristics of the data attributes of the graph (e.g., value distribution or missing values). The interaction for data editing is based on the direct manipulation paradigm [5]. Attribute values can be edited by dragging nodes in the visualization, while constant visual feedback helps users understand the effect of the ongoing edit operation. The general visualize-and-edit concept is instantiated in two different ways. We use (1) a scatter plot layout with position-based editing for quantitative node attributes and (2) a semantic substrates layout with region-based editing for qualitative node attributes. Both instances are supplemented with dedicated visual cues and interaction aids supporting the user in carrying out editing tasks.
User feedback has been acquired by running a small observational study with a proof-of-concept prototype. We report positive comments and suggestions for improvements brought forward by the study participants. We close with a discussion of the advantages and limitations of our approach and ideas for future work.

2. Related Work

Graphs are multi-faceted data models [6], where the graph structure and the graph attributes are often of primary interest. Direct visual editing of graphs relates to two aspects, the visualization of graphs and the interaction with graphs.

2.1. Visualization

The visualization of graph structures is commonly supported by node-link diagrams [7], matrices [8], and hybrid representations [9]. Multivariate data attributes can be studied using classic visualization techniques, such as Table Lens [10], scatter plot matrix [11], and parallel coordinates plot [12].
Analyzing the interplay of graph structure and data attributes requires dedicated visualization methods [13]. A widely applied approach is to use node-link diagrams in different variants. Their primary distinguishing characteristic is the balance between the visibility of the graph structure (e.g., connectivity, cliques, hubs) and the data attributes (e.g., individual values, distribution, outliers).
Sophisticated graph layout algorithms [7] follow a structure-first strategy. They determine node positions so as to maximize the visibility of the graph structure. Visualizing data attributes is secondary. It is typically implemented by varying the node representation, for example by coloring nodes [14] or by using enhanced glyph representations [15].
On the other hand, attribute-dependent layouts follow an attribute-first strategy to maximize the visibility of data values. The idea behind attribute-dependent layouts is to position graph nodes according to their associated data values. Different layout methods exist for different attribute-oriented visualization tasks [16,17,18,19]. While the graph structure is communicated by these methods as well, it may be less efficient due to node and edge clutter.
An alternative approach is to employ multiple coordinated views, where each view emphasizes a particular aspect of the graph [20]. While theoretically being more comprehensive, this approach can also be more challenging for the user due to increased cognitive demands [21].

2.2. Interaction

Interaction enables users to engage in a dialog with the data [22,23]. Spence distinguishes stepped interaction (one action at a time) and continuous interaction (multiple actions in a short period of time) [24]. Continuous interaction is particularly beneficial in open-ended exploratory scenarios. It enables users to quickly test multiple what-if alternatives before arriving at a final decision.
Standard techniques that make use of continuous interaction include multi-scale graph exploration via zoomable interfaces [25] and multi-faceted analysis of graph attributes via dynamic queries [1]. More advanced interactive lenses can be employed to access different levels of abstraction in clustered graphs, to reduce edge clutter, or to create local overviews of the nodes of interest [26].
A variety of interactive tools exist for manipulating graph layouts. Examples for adjusting node positions include alignment sticks [27], node-attracting magnets [28], as well as hot boxes and radial menus [29]. There are also dedicated techniques for adjusting edge routes [30]. In all of these works, interaction is used to modify the visual layout of the data, not the data themselves. Actually editing graphs is different, because it results in a permanent change of the data, rather than a transient change of their visual representation.
Existing graph visualization systems already allow users to permanently manipulate the graph structure [31,32,33,34]. Nodes and edges can either be edited via command input into a console or via drag-and-drop gestures on node-link diagrams. Editing can also be facilitated via sketching [35], multi-touch interaction [36], or semi-automatic lens techniques [37]. A first experimental approach exists for editing edges in matrix representations [38]. An interesting observation is that the literature does not prescribe a clear preference for alphanumeric input (e.g., commands) vs. graphical input (e.g., drag-and-drop). This suggests that the appropriate choice is highly dependent on user preferences and task contexts. Therefore, off-the-shelf systems usually provide both alternatives.
However, when it comes to editing data attributes in graphs, existing systems fall short in solutions for direct visual editing. Manipulating graph attributes typically requires alphanumeric input to be entered into a console or into separate views, such as data tables or property forms [31,32,33,34]. There are also in-place editing mechanisms via separate pop-up dialogs. These solutions enable precise editing of data values, yet being separate from the visualization, they remain indirect. Moreover, they offer only stepped interaction, that is, values can be set only in a discrete fashion. It is not possible to visually scan a range of possible attribute values before a suitable value is eventually committed to the data. This can be a significant drawback in scenarios where the value to be entered depends on the overall effect on the data distribution in relation to the graph structure.
A notable exception are radial controls for editing graph attributes directly through the visualization [39]. While they offer continuous interaction, they are limited, though, to the editing of single attribute values of single nodes and edges.
In summary, various methods exist for visualizing graphs and for interacting with their visual representations. In terms of the graph visualization, a balance has to be found between structure visibility and attribute visibility. As we are primarily interested in node attributes, our solution will be biased toward attribute visibility. In terms of the editing of graphs, existing systems already enable users to modify a graph’s structure directly via the visual representation. However, only little previous work has studied the editing of attribute values of graphs. The few approaches that exist rely only on alphanumeric input, offer only stepped interaction, or cannot be applied to sets of nodes.

3. Approach

We address this gap with an integrated visualize-and-edit approach to modifying node attributes in graphs. Before we go into the details, we give a brief outline and discuss the requirements to be taken into account.

3.1. Outline and Requirements

Direct manipulation [5] and continuous interaction [24] are key concepts to facilitate fluid interaction in visualization [4]. Many visualization tools use these concepts for adjustments of the visual representation. We are interested in using them for editing, that is, for actually changing the underlying data.
Changing attribute values in a graph involves three phases: (i) identifying the data to be edited; (ii) modifying the data; and (iii) verifying the editing outcome. Addressing these phases, our solution combines an appropriate base visualization with direct editing interaction and informative visual feedback. These components have to fulfill several requirements:
  • The base visualization has to show the graph structure and graph attributes in a single view [13]. This enables users to spot relations between structural aspects and associated data (e.g., hubs exhibit high attribute value). Attribute values being potential candidates for editing (e.g., missing values, outliers) should be emphasized. A necessary condition in terms of interaction is that nodes are displayed as discrete, modifiable graphical objects. Moreover, the nodes have to be laid out in a fashion that goes hand in hand with the interaction for editing.
  • Direct visual editing requires interaction mechanisms for selecting values to be edited and for specifying new values from the attributes’ value ranges. The interaction should be engaging [4] and the costs for interacting should be low [40]. To this end, the interactions are to be carried out with the visualization using a direct manipulation approach. Appropriate methods have to be included to assist users in the editing procedure. Interesting challenges are the precise adjustment of continuous data values and the interaction with information that is off-screen.
  • Informative visual feedback must be provided constantly during edit operations. This requires immediate updates of the base visualization once a new value has been set. The visual feedback should convey not only the locally changed data values, but also the global effect on the value distribution. In addition to visual feedback, it makes sense to consider visual feedforward [41] as well. Feedforward is useful for giving users an idea of what they can expect from their interaction with the system.
The discussed requirements informed the design of our visualize-and-edit approach. In terms of the visualization, node-link diagrams paired with attribute-dependent layouts perfectly match our needs. While node-link diagrams visualize the graph structure, attribute-dependent layouts convey the data characteristics of node attributes. With this visual design, we slightly favor attribute visibility over structure visibility. Node-link diagrams are also favorable in terms of interaction. Because graph nodes are represented as dots or circles, they can be easily interacted with directly. Moreover, attribute-dependent layouts already prescribe a spatial mapping of data values, so we can use the same mapping to drive the editing of data values. In other words, editing can be implemented as the spatial modification of node positions via drag-and-drop gestures.
Depending on the node attributes to be edited, we employ two different attribute-dependent layouts and corresponding interaction strategies. Next, we focus on editing quantitative node attributes, and later, we address qualitative data.

3.2. Strategy for Quantitative Values

3.2.1. Visualizing Quantitative Node Attributes Using a Scatter Plot Layout

For visualizing and editing quantitative attribute values in a node-link diagram, we use a scatter plot layout similar to [17]. As illustrated in Figure 1, two selected node attributes are mapped along the axes of the scatter plot layout. Following the attribute-first strategy, the graph nodes are arranged with respect to the attribute axes so that node positions correspond to the nodes’ associated data values. Regularly, nodes have a neutral gray outline; for selected nodes, the outline is black. Nodes whose values are outliers with respect to the attributes’ value distribution are shown with a red outline. Graph edges are visualized as curved links to represent structural aspects of the graph. Optionally, edge clutter can be reduced by showing only the edges of hovered and selected nodes. To preserve structure visibility even when edges are filtered, node color is reserved to show the node degree using the yellow-green-blue color scale from ColorBrewer [42].
In order to visualize and edit different node attributes, the mapping of attributes to the axes of the scatter plot layout can be altered by the user. To make layout changes comprehensible, node transitions can be animated. Additionally, the graph nodes are labeled with their IDs to facilitate recognition. A particle-based labeling algorithm helps us to reduce overlap among nodes and labels [43].
An advantage of the scatter plot representation is that any combination of two attributes can be inspected visually. The attribute values can be set into relation with the color-coded node degree and the links of the graph structure. For example, if the majority of high-degree nodes exhibit rather low attribute values, but there is one high-degree node with an extreme attribute value, then this node’s attribute value may be subject to corrective editing. In general, outlier values are potentially interesting for being edited. They are immediately visible as nodes being located away from the main body of the data. To put further emphasis on outlier values, we mark them with a red outline.
With the basic design explained so far, two issues remain to be addressed. First, the position of nodes with missing values is typically undefined. Second, similar data values lead to over-plotting, which makes it difficult to interact with individual nodes.
We deal with missing values by reserving for each axis a dedicated coordinate. This is shown as reddish bars next to the axes in Figure 1. The reddish color signals to the user that nodes with missing values are present in the data.
The over-plotting problem is tackled by dynamically clustering the graph depending on the current zoom level. If there is insufficient space to show individual nodes, they are aggregated to form cluster nodes. The cluster nodes are shown as squares to make them easily distinguishable from regular nodes. The size of a square and its numeric label indicate the number of nodes contained in a cluster. The cluster color visualizes the aggregated degree of the cluster’s member nodes. Upon request, a cluster node can temporarily fan out its content to make it possible to see and edit individual nodes. Figure 2 shows a detailed example of a cluster node and its fan out.

3.2.2. Direct Editing Interaction and Visual Feedback

With the scatter plot visualization, we have an ideal basis for employing direct manipulation of nodes for the purpose of editing. Each display dimension already corresponds to a node attribute’s value range. This makes direct visual editing easy: The user grabs a node, moves it across the layout, and the position where the node is dropped defines the new attribute value(s) to be committed to the data. In contrast to regular drag-and-drop, we require the user to perform a long press before the dragging can start. This way, conflicts with any pre-existing interactions based on drag gestures can be avoided, the risk of editing by accident is reduced, and the user is made aware of the critical fact that the underlying data will be manipulated. While a drag gesture is being performed, the node position is constantly updated and a label indicates the exact attribute value at the current position. An additional ruler locally indicates which values can be reached when the drag gesture is continued. The ruler not only provides feedforward [41], it also helps the user to stay focused on the node being edited as it reduces eye movements toward the scales at the axes.
In addition to editing individual nodes, we also support the simultaneous adjustment of multiple selected nodes. For such a multi-node batch editing, we distinguish between absolute and relative change. Absolute change means that all attribute values are set according to the absolute cursor position; a node cluster will be the result. In contrast, relative change means that individual attribute values are shifted according to the displacement of the cursor with the consequence that relative distances are preserved.
Using the drag-and-drop gestures, it is now possible to freely edit node attributes to any value in the range of the scatter plot layout. Values far beyond the mapped data range, however, are not directly accessible via spatial modification of nodes, which is a general problem. Extra zoom and pan operations may be necessary before such extreme values can be set. Yet, the consequences for our approach are limited, as it is questionable if setting extreme outlier values is a regular editing task. More likely is the case that outlier values need to be corrected.

3.2.3. Editing Aids

Low interaction costs are crucial for our approach. According to Norman, interaction costs can be attributed to the execution of an action and the interpretation of the result [44]. Consequently, we enhance our basic solution with additional tools and aids to reduce the effort for editing data values and verifying the outcome.
The execution of editing gestures relies on the human motor system, which however is accurate only within certain limits and prone to involuntary motion. Therefore, exact editing requires concentration and focus, which means that interaction costs for editing can be high. Norman suggests constraining the interaction to make it easier to execute [44]. We follow this advice in that the drag gesture is dynamically restricted to axis-parallel movements. First, we detect along which axis of the scatter plot the user intends to edit. The axis is chosen depending on the maximal coordinate of the initial cursor displacement within a reasonable neighborhood around the point where a drag gesture started. Once a decision for either axis has been made, the drag gesture remains constrained until it ends. The advantage of constraining the drag horizontally or vertically is clear: Involuntary manipulations of the second attribute are ruled out. For added flexibility, users can temporarily or permanently switch to unconstrained editing. In this mode, node values can be modified with respect to two attributes simultaneously. Yet, preliminary user feedback indicates that this is rarely necessary.
The verification of the effect of an edit operation is naturally supported by the scatter plot visualization, which is constantly updated. The effect on the global value distribution is visible in the layout itself and in additional box plots that are attached to each axis. What can be difficult to evaluate, though, is the effect with respect to the local graph neighborhood of the node being edited. This information can be important as correlations might exist between connected nodes and their attribute values. Therefore, we additionally determine and highlight local outliers in the k-neighborhood. Such outliers are again marked directly in the scatter plot by red outlines around nodes. This signals to the user that the edit operation created a value that deviates significantly from the values in its local graph neighborhood.

3.2.4. Increasing Editing Precision

A key concern when editing quantitative values via direct manipulation is interaction precision. As for any visualization, precision is limited by the resolution of the input-output system and dependent on the minimum-maximum value range mapped to the available pixels. The practical implication is that moving the cursor by one pixel results in a data modification by a constant delta. Particularly for continuous attributes with large value ranges, subtle edits can be difficult to perform because the delta is too large. To allow for sufficiently small deltas, one can vary the minimum-maximum range by zooming. This, however, implies additional manual navigation and entails global change of the state of the visualization.
We prefer a more light-weight solution by dynamically embedding a focus+context transformation [45]. This transformation locally stretches the space for a focused interval of interest and compresses its context. Because a fixed magnification is of limited use when working with various heterogeneous value ranges across multiple node attributes, our solution offers a dynamic magnification (similar to [46]). By adjusting the magnification factor, the interaction precision can be increased gradually. Experimentally, we found that increasing the precision at fixed rates proportional to a base-10 logarithmic function is a suitable solution. As attributes usually have different value ranges, it is possible to adjust the magnification factor independently for each axis.
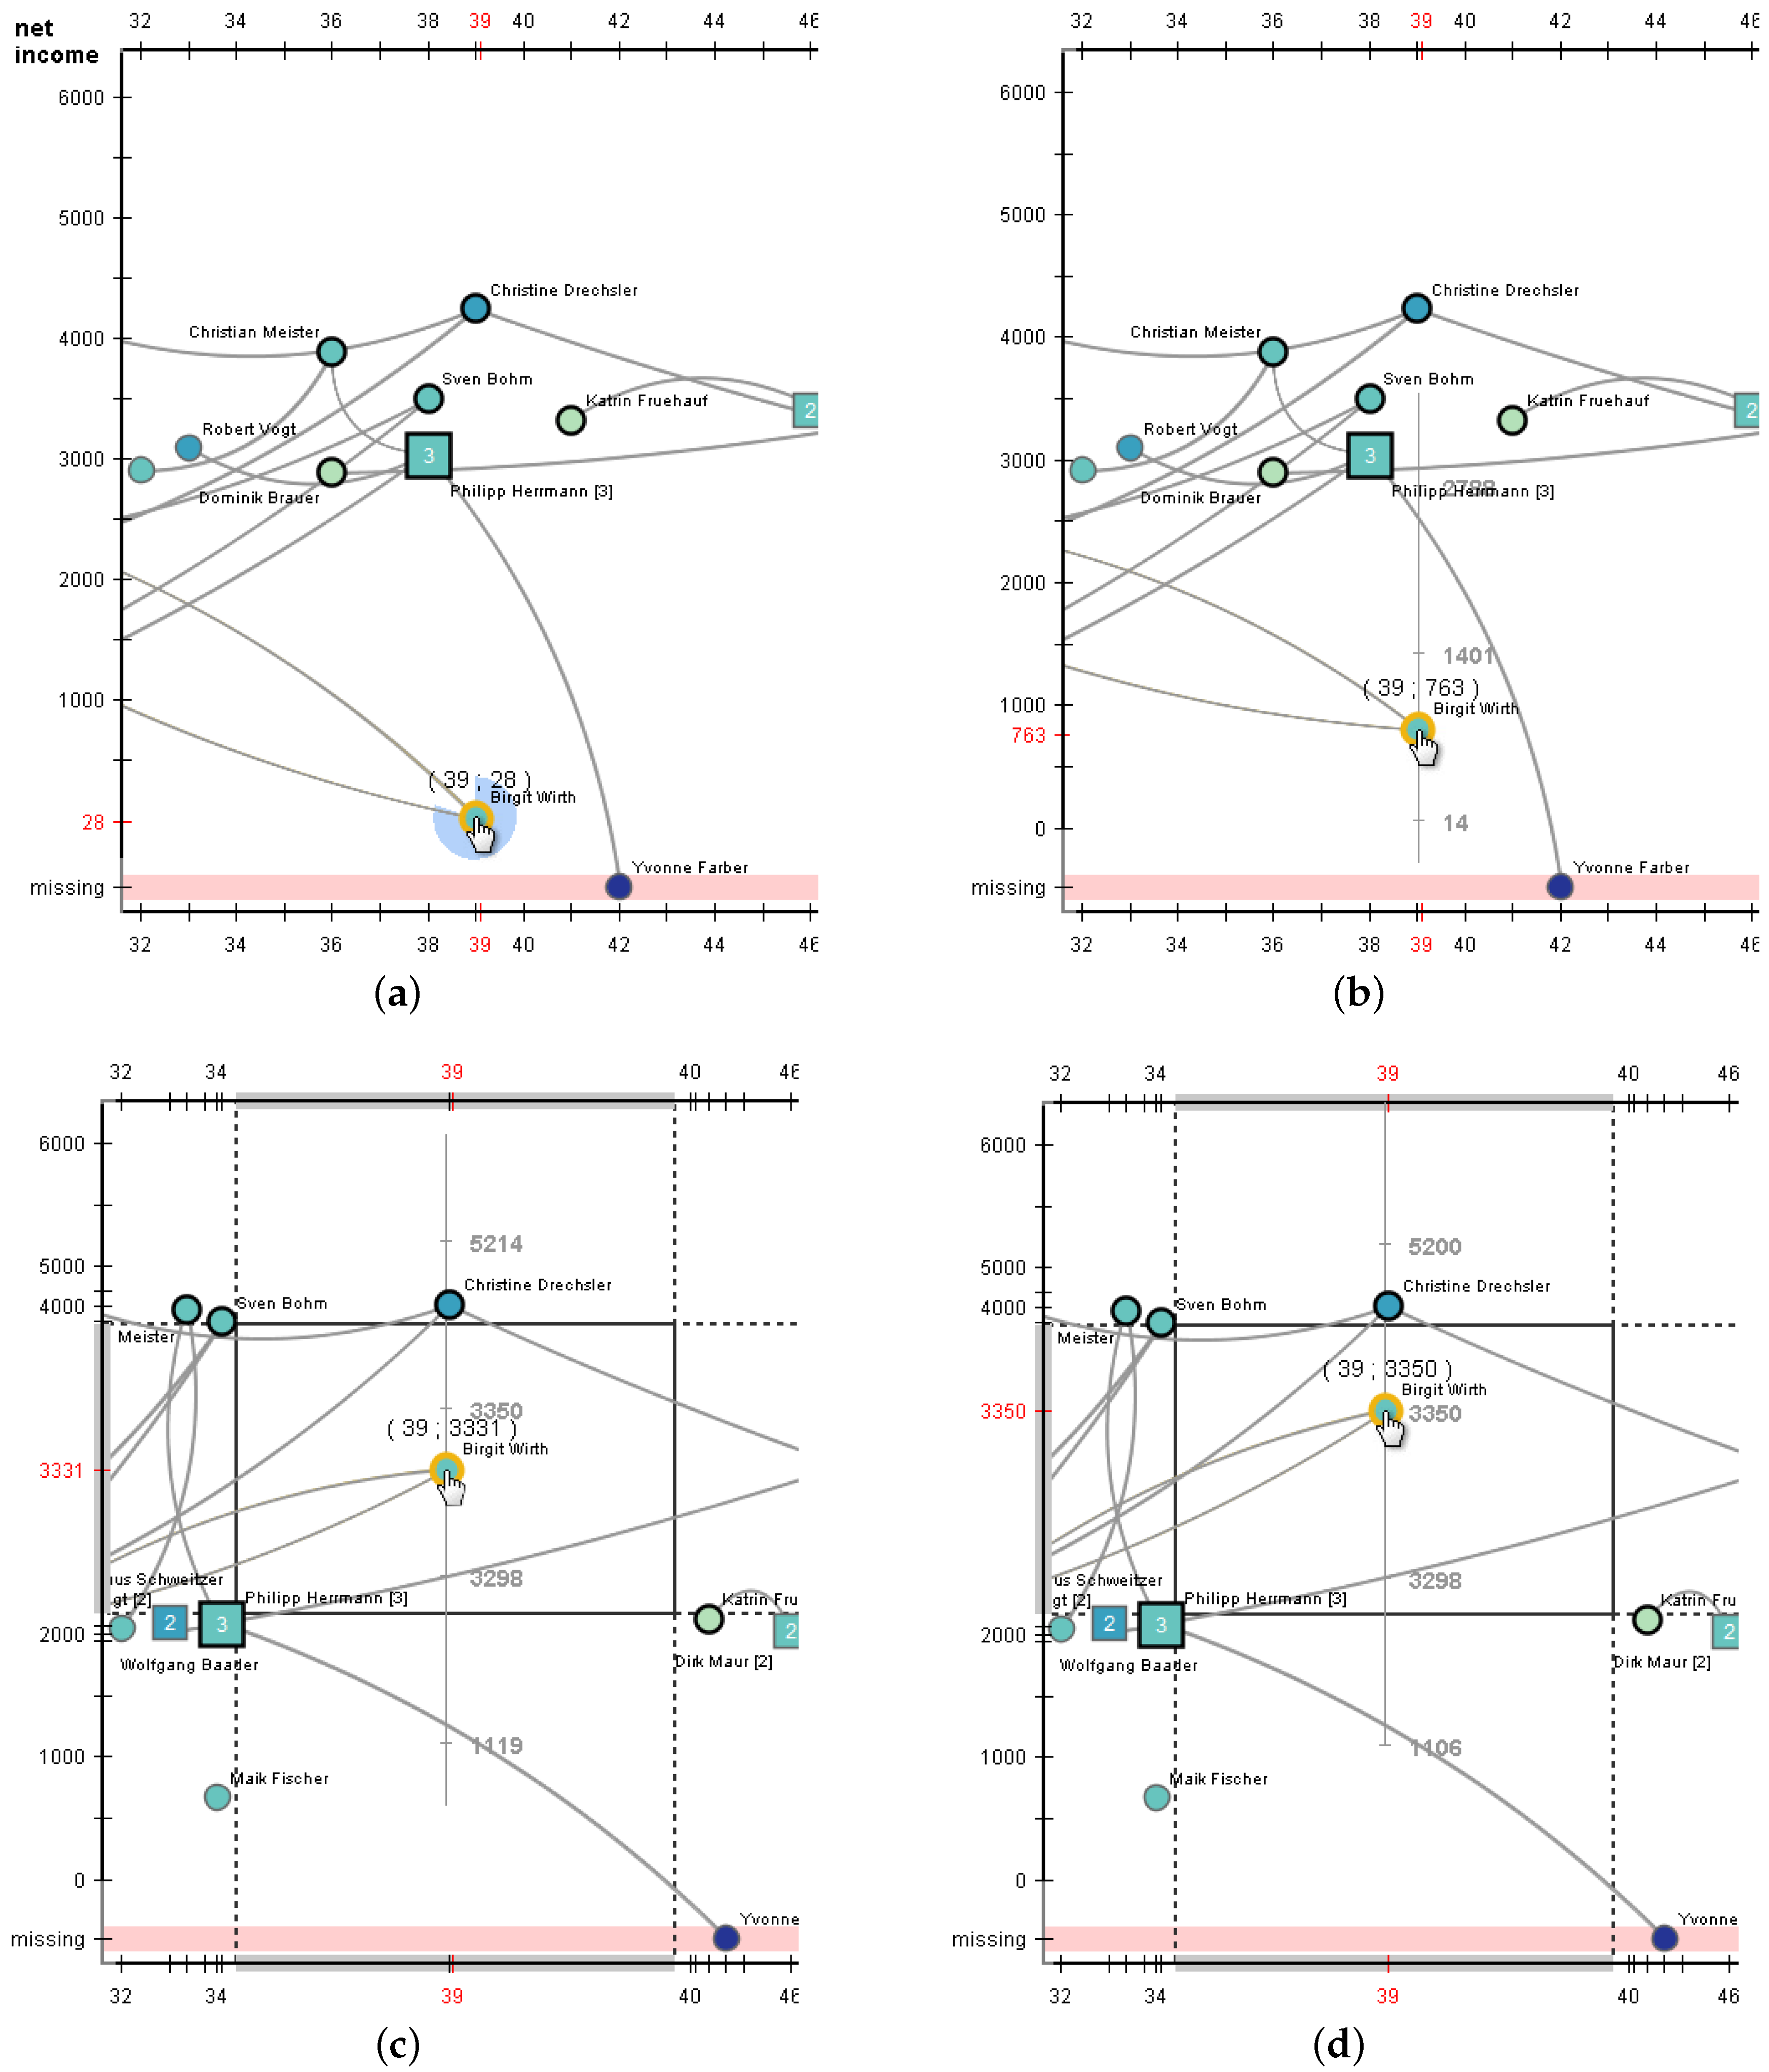
The focus+context magnification is smoothly integrated into the regular editing gesture. As illustrated in Figure 3, precise editing is as easy as:
(a)
Long press to unlock the node for editing.
(b)
Drag the node roughly toward the target position.
(c)
Activate the focus+context transformation and optionally adjust the magnification factor.
(d)
Exploit the increased interaction precision to set the node’s position exactly to the target value.
In addition to improving interaction precision, the focus+context display can also be employed to resolve node occlusion in dense areas of the scatter plot. In this more exploratory mode, the focus+context display is connected to the cursor position to let it automatically follow the user’s exploration interest.
Our approach as described so far focuses on the editing of quantitative values. Yet, it can also be employed to edit qualitative values. To this end, qualitative values must be mapped to a numeric scale. Straightforward approaches use a simple equidistant enumeration of the available values. That is, each value is assigned an integer number (e.g., dog-1, cat-2, bunny-3). More advanced approaches implement mappings of qualitative values to non-equidistant real numbers. They are based on an analysis of the statistical properties of the attributes’ value distributions and can thus achieve a potentially more effective mapping of data values to positions along a scatter plot axis [47].
Therefore, theoretically, it is possible to edit quantitative and qualitative attribute values simultaneously. However, still, considering the specific character of qualitative data, it makes sense to investigate a dedicated visualization and editing strategy.

3.3. Strategy for Qualitative Values

3.3.1. Visualizing Qualitative Node Attributes Using a Semantic Substrates Layout

In general, visualizing qualitative (or categorical) data in a scatter plot can lead to severe over-plotting at exactly the positions associated with the qualitative values. Therefore, a scatter plot layout is not necessarily the best choice for editing qualitative node attributes.
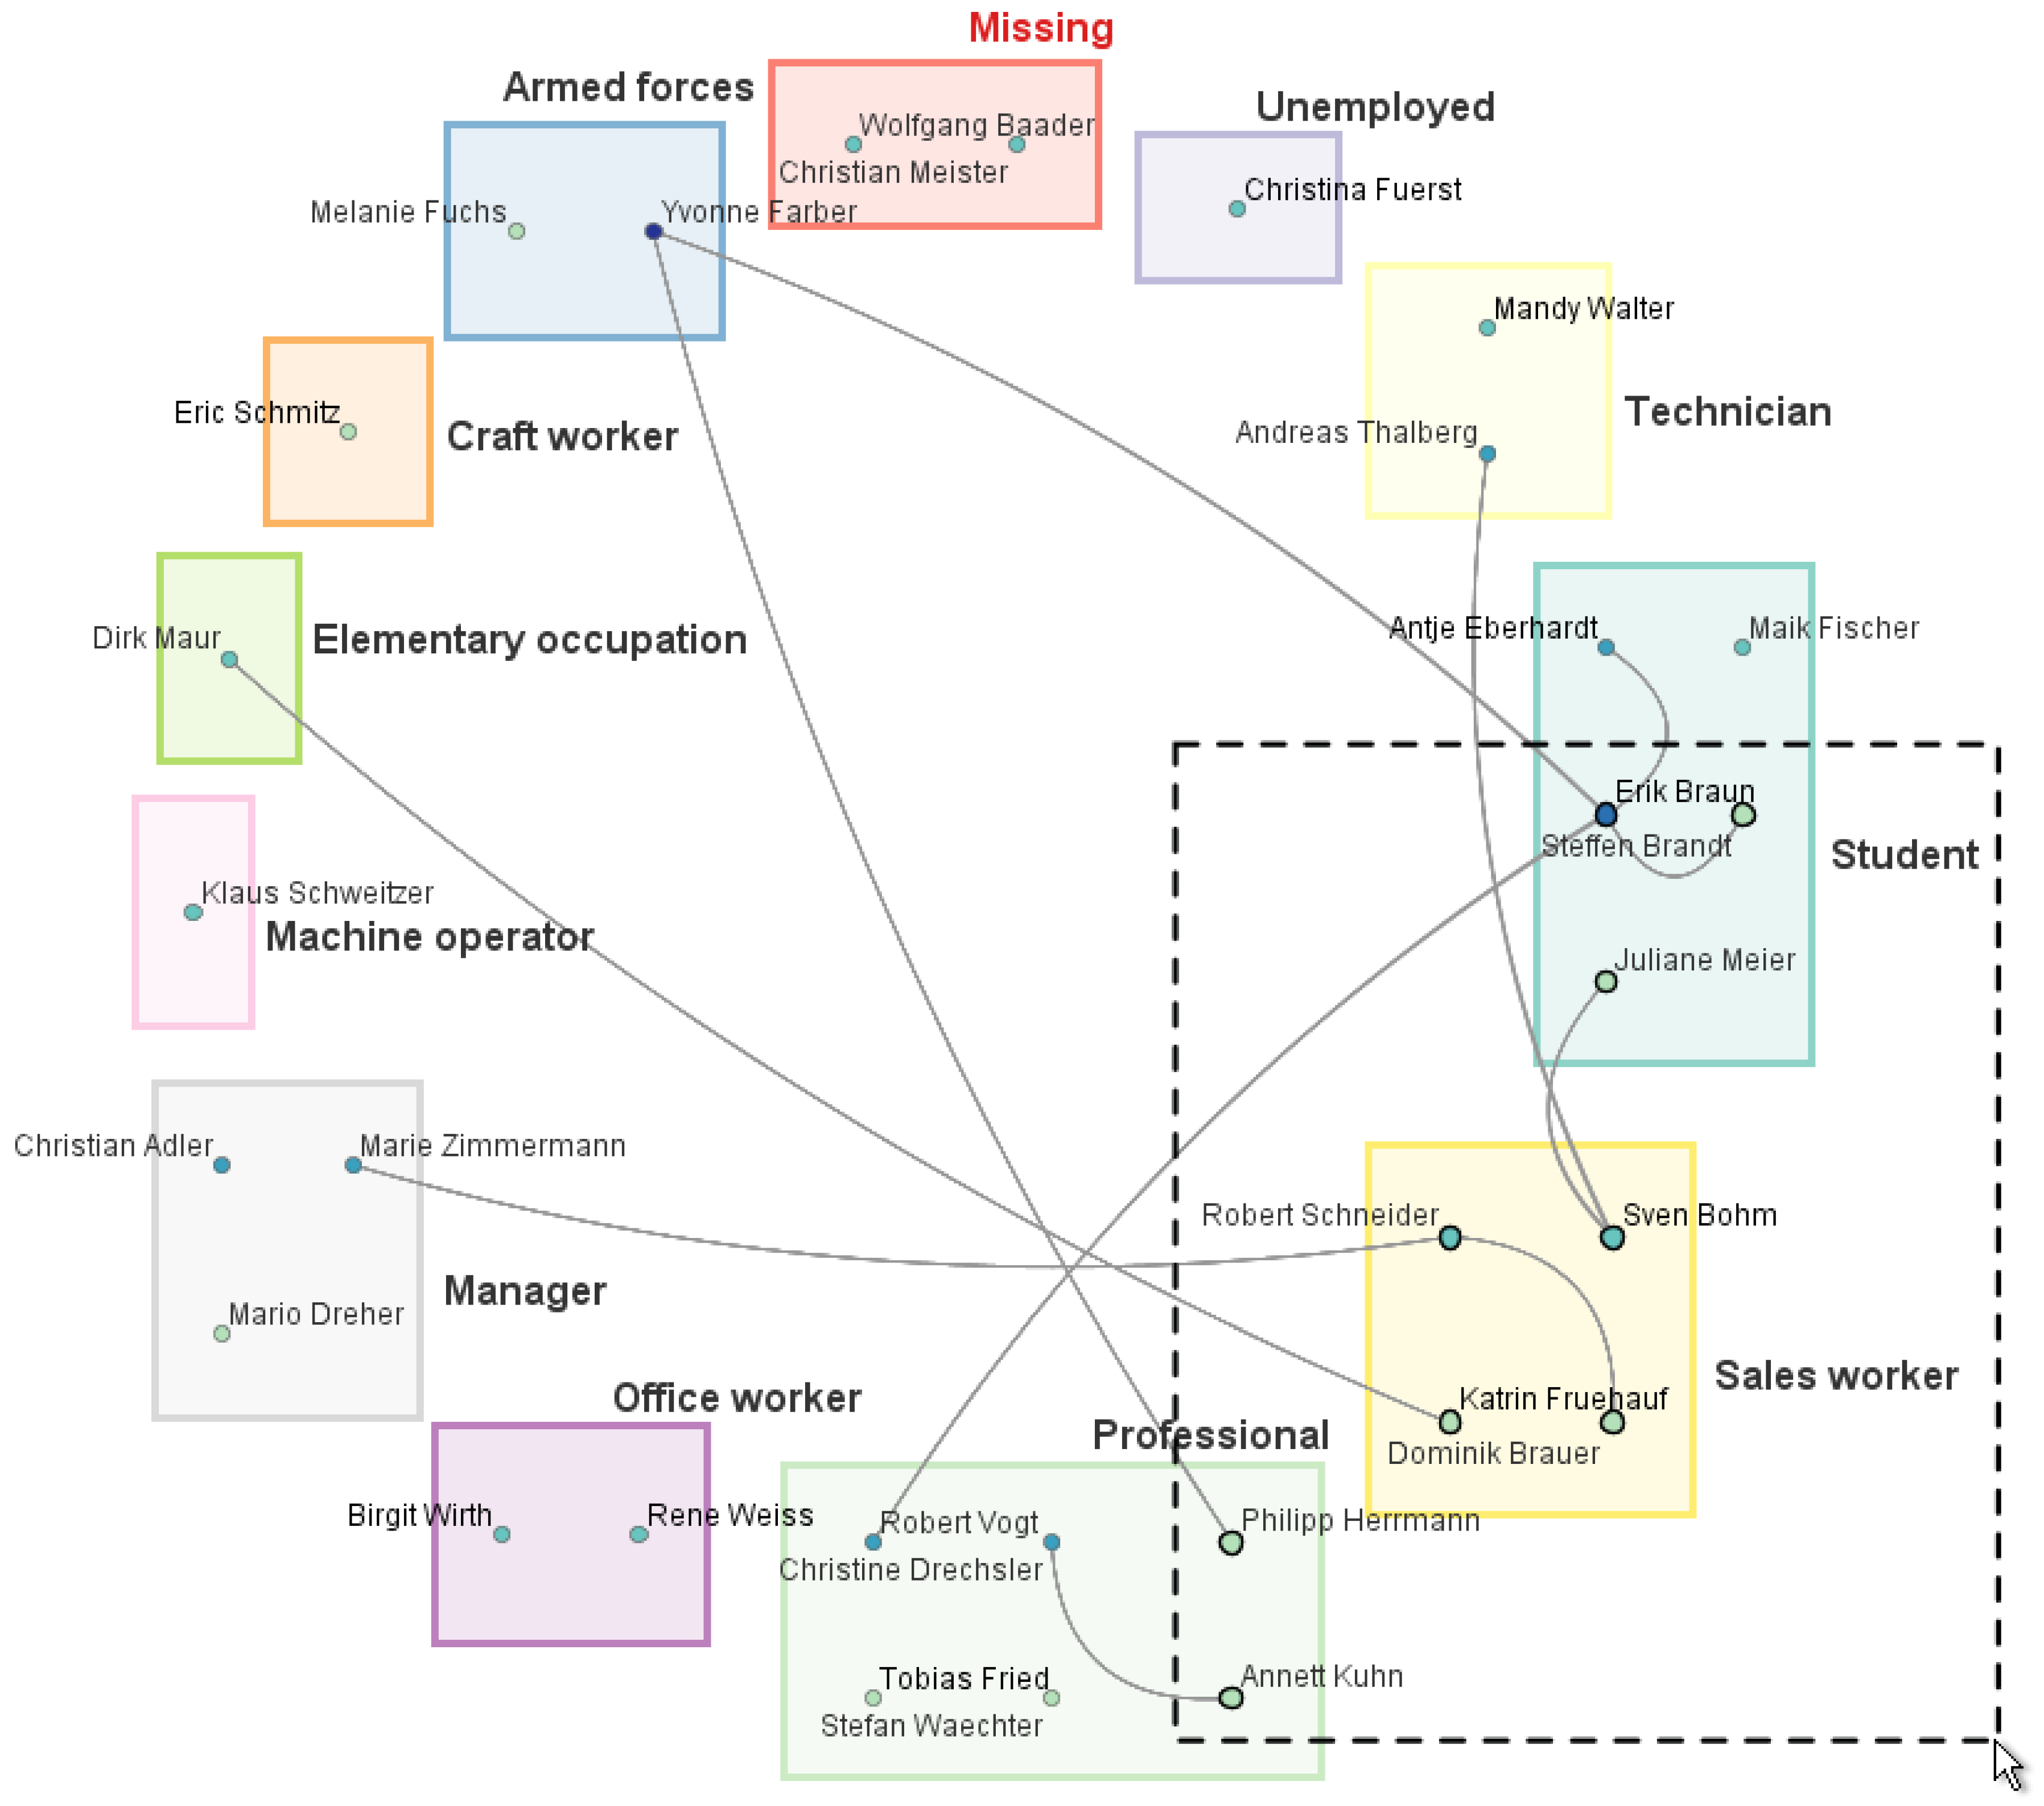
A suitable alternative particularly designed for qualitative data are semantic substrates [16]. The basic idea is to place nodes in distinct spatial regions that correspond to the values of a selected qualitative attribute. Figure 4 shows such a layout for the attribute occupation with eleven qualitative values, including “Technician”, “Student”, “Sales worker”, and “Professional”. Bold labels are used for regions, and smaller labels identify nodes. Nodes whose attribute value is undefined are contained in the dedicated twelfth region labeled “Missing”. With a semantic substrates layout, one can easily estimate the value distribution by looking at the size of regions and the number of nodes contained within them. Very small regions with very few nodes could be interpreted as outliers being subject to editing.
For semantic substrates, there is no fixed mapping of the regions to particular positions on the screen. Neither are the position of nodes within the regions pre-determined. This allows us to optimize the layout of regions as well as that of the nodes within the regions according to data characteristics, graph aesthetic criteria, and application-dependent requirements. For example, for ordinal qualitative attributes, a region layout can be chosen that communicates order. For purely nominal data, for which no order exists, one can focus on graph aesthetics and employ a space-filling partitioning of regions [18] or a force-directed layout [7]. In our examples, we use a circular layout that reduces the number of edge crossings with regions. Within regions, as indicated, we can again choose a suitable layout, for example, based on a force-directed algorithm or simple grid layouts minimizing the average length of intra-region edges.
There is a noteworthy difference between the scatter plot layout introduced earlier and the semantic substrates layout. For the scatter plot layout, attribute values of a node are encoded in the node’s exact position. In contrast to that, for the semantic substrates layout, a node’s qualitative value is shown by the node’s containment in a particular region. This difference motivates a dedicated interaction design for qualitative values, as we will see next.

3.3.2. Direct Editing Interaction and Visual Feedback

As explained earlier, editing quantitative values in the scatter plot layout requires moving a node to an exact position. Now, for qualitative values, editing is more relaxed. It simply requires dragging nodes from one region and dropping them in another; the exact drop position is irrelevant. Again, for the same reasons as already discussed, a long press is required to actually start the editing gesture. Multiple nodes can be dragged simultaneously from multiple regions and be dropped in the region of the qualitative value to be assigned.
Once nodes have been dropped, the result of the editing operation is communicated visually by updating all affected regions. Their sizes and internal node layouts are re-computed such that they correspond to the updated value frequencies. To avoid abrupt changes in the representation, the visual feedback is animated smoothly. To increase the awareness of local and global outliers, we resort to the same highlighting strategy as for quantitative editing. Figure 5 illustrates the basic idea of the interaction.
While the drag-and-drop editing is easy to carry out, a limitation is that only existing values can be assigned directly. If a new qualitative value needs to be added to an attribute’s value range, it has to be entered alphanumerically. However in practice, this is a comparatively infrequent task. In all other cases where node values are edited within the existing value range, the user can benefit from direct visual editing.

3.3.3. Editing Aids

A significant cost factor when editing qualitative attributes is to find and reach the region of the target value. In contrast to quantitative attributes for which it is clear in which direction one will find the target value, the flexible layout of the semantic substrates does not provide such a naturally defined orientation. When not all regions are visible due to previous zoom operations, the user might not even be able to drop a node onto a target.
To keep interaction costs low without imposing any constraints on the layout, we couple the semantic substrates layout with an off-screen visualization. To this end, the semantic substrates display is extended by a border similar to [48,49]. The border is used to show the proxies of those regions that are currently off-screen. A proxy serves three purposes. First, its position and size provides orientation by indicating in which direction and at what distance one could expect to find the corresponding region in the layout. Second, the proxy can be used to display selected nodes based on node importance. Third, a proxy and its nodes can be interacted with, and the result will be the same as if one would interact with the original region or node.
We use a heuristic algorithm to compute proxies and select important nodes to be shown inside the proxies:
  • Approximately determine the position and size of each proxy by projecting its off-screen region to the border.
  • Detect overlaps among the projected proxies and resolve them by iteratively shifting and resizing them.
  • Determine important nodes based on a degree-of-interest function [50].
  • Optimize proxy size and position so that important nodes can be displayed within the proxies while still maintaining the proxies’ purpose of indicating direction and distance.
Once computed, proxies and important nodes are shown at the border of the view as illustrated in Figure 5. Proxies help maintain an overview of the data, and they can also be used for editing. As all qualitative values (regions) are accessible at all times, additional navigation steps to reach off-screen regions are not necessary. If a node must be moved to an off-screen target, it can be dropped on the corresponding proxy, as shown in Figure 5b. The important nodes displayed inside proxies can be edited in the same way as regular nodes. When a user intends to actually visit an off-screen region, the corresponding proxy can be used to trigger an automatic animated navigation.
In summary, we have now presented two distinct strategies for editing node attribute values directly in the graph visualization. We used scatter plot layouts for position-based editing of quantitative values and semantic substrates layouts for region-based editing of qualitative values. Both strategies integrate visual cues to indicate global and local outliers, as well as interaction aids to deal with editing precision and off-screen regions, respectively. In the next section, we will look at preliminary user feedback and an application example.

4. Preliminary User Feedback and Application Examples

In order to test our ideas, we implemented an interactive prototype. The software served as a basis for collecting preliminary user feedback. We also applied our approach to real-world scenarios, which will be briefly described later in this section.

4.1. Preliminary User Feedback

We tested our visualize-and-edit techniques in informal user sessions. Because node-link diagrams and attribute-dependent layouts are quite well accepted as visualization techniques, our primary interest was in testing the interaction facilities for editing node attributes. Our goal was to gather preliminary feedback about general usefulness and usability.

4.1.1. Participants, Data, and Setup

Ten persons (ages 24–58, two female) were recruited among the students and employees of a university. All participants had a computer science background and as such were proficient in using interactive graphical tools. Six of them considered themselves experienced with interactive data visualization. None of the participants had used our editing techniques prior to the test sessions. As test data, we used the same small fictional social network as in the figures in Section 3. The network consisted of 30 nodes (persons) with three quantitative and three qualitative attributes (e.g., a person’s income and occupation). The data had been prepared such that there were a few outliers and several missing values. The nodes were connected via 50 edges to represent social relations among the persons. For our tests, we used a regular desktop computer. The visualization was shown on a 24-inch monitor. All interactions were carried out using a standard mouse device.

4.1.2. Procedure and Tasks

The test sessions were structured into three phases: introduction, tasks, and final comments. First, the participants familiarized themselves with our prototype. Instructions were given on how to use the interaction techniques, and the participants were free to experiment with the tool for about 5 min.
In the second phase, the participants carried out two quantitative and two qualitative editing task. The first task was to set the age of a person to a particular value using the scatter plot layout. For this task, editing precision was not a problem as the value range was narrow. In the second tasks, the income attribute of a person whose value was missing had to be edited. Now, the focus+context transformation had to be used in order to set the value precisely. Then, two qualitative editing tasks had to be carried out using the semantic substrates layout. First, participants were asked to batch-edit the occupation of multiple persons from initially “Student” to “Professional”, where the corresponding regions were visible on-screen. Finally, participants edited nodes where the target category was off-screen. For this test, the participants were forced to use the corresponding proxies at the view border. The phase of carrying out the editing tasks took between 15 and 20 min.
In order to acquire feedback, we asked the participants to express verbally what they were doing and what they were thinking about during the editing procedure. The participants were particularly encouraged to comment on concerns with the editing procedure and on difficulties with the use of the interaction techniques. The experimenter took notes of the participants’ comments during the sessions.
After all of the tasks had been completed, there was a brief third phase. The experimenter checked and discussed the correctness of the notes taken during the task phase. The participants were given the opportunity to articulate any post hoc comments or suggestions for improving the editing approach or the prototype software.

4.1.3. Results

A positive result of our feedback sessions was that all participants were able to successfully complete all editing tasks. None of the participants requested alternative input facilities while carrying out the editing tasks, although a dialog box would have been available for alphanumeric input. This indicates to us that the developed design works in principle.
The most relevant comments that participants made during the feedback sessions are the following. First of all, there was consensus about the usefulness of the techniques in general. Several participants were surprised how precisely they could edit values by using the dynamic focus+context technique. One of them commented “Using the local magnification is an intuitive solution to increase precision.” Additionally, three participants acknowledged the benefit of constraining the drag to either axis for editing a single quantitative attribute value. One participant explicitly said that dragging nodes to different regions for qualitative editing in the semantic substrates layout is intuitive and can be accomplished easily, even for off-screen proxies. Another positive comment was that the qualitative editing avoids setting incorrect data values, which can happen when entering values with the keyboard. One participant criticized that proxy size should encode value frequency, which would be consistent with regular on-screen regions. Two participants suggested to mark entire outlier regions in the background of the scatter plot layout, rather than highlighting individual nodes.
We also received general suggestions for improvement. One participant said that standard undo/redo functionality is a necessity when editing data. This feature is yet to be implemented. Another valuable suggestion was to allow users to collect a number of data changes and to commit them as a single transaction. An interesting implication would be the ability to store annotated diff-files for data provenance.
In summary, the editing techniques were well received. This suggests that our direct visual editing approach can be a useful addition to the toolbox of existing editing solutions. During the feedback sessions, a few items of criticism were brought forward. These, however, do not concern the general approach, but are rather issues of the implementation of the prototype software, which could be remedied easily.

4.2. Application Examples

The overall positive user feedback encouraged us to apply our solution to real-world use cases. In a first scenario, we deployed the prototype to a project that involves maintenance of a larger wireless network. The network consists of 98 access points (nodes) and 56 antenna connections (edges). The access points are associated with two quantitative attributes: channel and transmission power in dBm.
Editing these attributes can become necessary for several reasons. For instance, if the channel of an access point overlaps with the channel of a newly installed wireless router located nearby, it makes sense to adjust the channel to avoid signal noise and low throughput. Another editing scenario arises when access points are removed from the network. To maintain network connectedness, it might be necessary to increase the transmission power of other access points.
Figure 6 visualizes the network as a scatter plot layout. As can be seen, the access points use different channels, and their transmission power is below 30 dBm. However, there is one outlier with a transmission power of 100. After checking this outlier, an administrator of the network found that this value was measured in mW instead of dBm and, thus, was erroneous. He could correct this value directly in the visualization by moving the access point to 20 dBm (which equals 100 mW). In addition to this outlier, access points with missing values are obvious at a glance. Once the owners of these access points report their channels, they can be directly inserted into the data as well.
Even this simple application example illustrates the benefit of integrated visualization and editing. The visualization not only reveals problematic parts in the data, but it also serves to correct them directly without consulting external tools.
In a second example, we apply our approach to dynamically created document networks. We use these networks to semantically organize documents (e.g., pictures, slides, and book pages) being part of a presentation [51]. Documents correspond to the nodes of the network, whereas edges correspond to semantic relationships between documents. As a qualitative attribute, the documents are associated with a certain topic. The topic information is used to quickly identify groups of documents. With multiple users contributing documents to a presentation, the network can quickly grow to more than 100 nodes.
The semantic substrates layout supports users in identifying and correcting document topics. Typically, presentation authors contribute to an existing topic in the document network. Therefore, documents tend to form larger topic groups. The number of documents in such groups is easily recognizable by the size of the regions in the graph layout. Poorly categorized documents mostly end up in regions with only a few nodes. Documents for which no topic has been assigned yet are placed in a separate region for missing values. Figure 7 shows several such documents in the “Missing” region. The document preview thumbnail makes it easy though to recognize the document content. Our integrated visualize-and-edit approach enables the presentation author to correct the document-topic affiliation simply by dragging the dedicated nodes to a suitable topic region. Even if the user has zoomed into the visualization to see details in the thumbnails, topics can still be edited quickly by using the off-screen proxies; expensive back-and-forth navigation is not necessary. Moreover, as the proxies show the nodes with the strongest connection to nodes in visible regions, users are still able to identify the semantically most related documents.
Taken together, both application examples suggest that direct visual editing can have some advantages over non-visual editing of node attributes in plain textual data files. In the next section, we further discuss the benefits and also limitations of our approach.

5. Discussion

In fact, the integration of visualization and editing is a key advantage of our solution. Data can be edited directly with the visualization. There is no need to leave the visualization, resort to an external tool for editing, and return to the visualization to verify the outcome. This spares the user cognitively expensive switches between different working environments.
We opted to use direct spatial manipulation for editing data in attribute-dependent graph layouts. The layouts and the corresponding highlighting of outliers give users hints about attribute values that could be relevant for editing. However, it is not necessarily an easy task for the user to decide on a suitable attribute for the semantic substrates layout or on a semantically useful pairing of attributes for the scatter plot layout. In the future, this problem could be dealt with by including graphical overviews [17] or analytic means, such as scagnostics [52] or class consistency [53].
With the semantic substrates, one attribute can be edited at a time, with scatter plots, even two, which is more than for regular text input. While this is sufficient for many editing tasks, we think it is sensible to extend our approach with other techniques to support the simultaneous editing of multiple attributes as well. For example, radial controls could be embedded locally at the node to be edited [39]. These controls allow for quick access to all attributes of a selected node. However, originally designed for single-node editing, it remains future work to make radial controls fit our multi-node editing.
While we are convinced of the utility of integrated visualization and editing via direct interaction, we also have to admit that it cannot cope with extreme cases. Excessively large or small quantitative values (e.g., 1,234,567,890 or 0.123456789), huge amounts of qualitative values (e.g., family names), or extreme value distributions (e.g., accumulation at singular points) will typically make visual editing difficult, if not impossible. However, this is not a specific difficulty of our editing approach, but a general challenge for visualization and interaction techniques [54].
A related issue in terms of what can be edited is that the proposed solution addresses only graph nodes. Attributes associated with a graph’s edges have not yet been considered. However, they are equally important. Many graphs bear weights at their edges. Yet, there are no methods for their direct visual editing. Developing such methods will certainly require studying alternative visual representations (e.g., matrices [38]) and interaction techniques, where the emphasis is put on edge attribute visibility and layouts that afford the manipulation of edges.
Our solution enables the editing of individual nodes as well as the batch-editing of multiple nodes, whose data values are quantitative or qualitative. Yet, we consider only individual values. In real-world graphs, however, it can very well be that nodes are associated with attributes that allow sets of values. An example could be a document graph similar to that described in Section 4.2. However, instead of each document being assigned to a specific topic (i.e., an individual qualitative value), the documents are tagged with keywords (i.e., sets of qualitative values). How to edit such set-based attribute values remains an open research question.
An intriguing question regards the modality to be best used for editing: direct visual editing or alphanumeric input. We cannot provide a definite answer due to many influencing factors. Alphanumeric input is certainly precise. However, it is difficult to test multiple what-if scenarios, which is a common tasks in data analysis settings. The user would have to enter a series of exact values in order to see their different effects on the data. This is time consuming and cumbersome. Here, our approach can play out its strengths. Direct visual editing allows the user to test many different data values during a single continuous drag gesture. This advantage of continuous interaction is well known in the broader context of direct manipulation [5,24]. We also see potential benefits for applications on interactive surfaces. In such scenarios, the visualization typically occupies the full display, and input is carried out directly on the touch-enabled surface, with no alternative input periphery available.
Certainly, there is a need to further evaluate the pros and cons of direct visual editing. We carried out rather informal sessions to acquire preliminary user feedback. While this feedback confirmed the general usefulness and utility of the approach, many questions remain to be investigated in more formal settings. As indicated, a most pressing issue is to determine situations where users prefer direct visual interaction and when alphanumeric input is more suitable. Longitudinal studies seem to be necessary before valid answers to this question can be derived. A general difficulty for the evaluation is the tight interplay between visualization methods and interaction techniques. Which combinations of visual encodings and interaction techniques should be tested, and how much of the results can be attributed to the visualization and how much to the interaction? Moreover, the result will depend on the data being used. We tested with a rather small graph that exhibited the characteristics of a social network. However, there are many different classes of graphs with different structural properties, different value distributions, and different sizes.
Finally, so far, we have only considered the interactive visual front-end, that is, the interface with the user. We have not studied any consequences on the back-end, that is, the interface to the data. In light of cloud-based multi-user visualization, there are interesting research questions for the future.
In the light of the previous discussion, we understand our approach not as a replacement of existing editing techniques, but as a complement. There are situations where keyboard input will remain the preferred solution (e.g., when inserting a new categorical value or specifying formulas for a computational derivation of attribute values). We are convinced that our integrated visualize-and-edit approach provides users with an interesting alternative in situations where the data value to be set is not known upfront and dependent on the interplay between graph structure and the attributes’ value distributions.

6. Conclusions

In this work, we proposed a novel approach for editing node attribute data directly in a visual graph representation. We employed different attribute-dependent layouts and developed dedicated interaction strategies for editing quantitative and qualitative attributes. The attribute-centric visual representation supports the user in discovering values being relevant for editing. Data modifications can be accomplished by directly interacting with the visual representation. The effects of data manipulations are immediately visible.
Our solution can be applied to diverse editing scenarios. It can help in manual data curation and the analysis of different what-if scenarios. Positive user feedback indicates that our solution can be a promising complement to standard non-visual data editing techniques.
With our work, we hope to initiate more research toward visualization as a tool, not only for viewing data, but for actually working with them.

Supplementary Materials

The following are available online at www.mdpi.com/2227-9709/3/4/17/s1. Video S1: Direct visual editing of node attributes in graphs.

Acknowledgments

This work has been carried out in the scope of the project Graph Exploration and Manipulation of Interactive Surfaces (GEMS) and received financial support by the German Research Foundation (DFG) under Grant Number SCHU 887/14-1.

Author Contributions

C.E., S.G., and C.T. conceived and designed the solution. C.E. implemented the software. S.G. conducted the observational study. S.G. and C.T. wrote the paper. H.S. contributed critical advice; H.S. and C.T. finally approved the published work.

Conflicts of Interest

The authors declare no conflict of interest.

References

  1. Heer, J.; Shneiderman, B. Interactive Dynamics for Visual Analysis. Commun. ACM 2012, 55, 45–54. [Google Scholar] [CrossRef]
  2. Kandel, S.; Heer, J.; Plaisant, C.; Kennedy, J.; van Ham, F.; Riche, N.H.; Weaver, C.; Lee, B.; Brodbeck, D.; Buono, P. Research Directions in Data Wrangling: Visualizations and Transformations for Usable and Credible Data. Inf. Vis. 2011, 10, 271–288. [Google Scholar] [CrossRef]
  3. Baudel, T. From Information Visualization to Direct Manipulation: Extending a Generic Visualization Framework for the Interactive Editing of Large Datasets. In Proceedings of the ACM Symposium on User Interface Software and Technology (UIST), Montreux, Switzerland, 15–18 October 2006; ACM Press: New York, NY, USA, 2006; pp. 67–76. [Google Scholar]
  4. Elmqvist, N.; Moere, A.V.; Jetter, H.C.; Cernea, D.; Reiterer, H.; Jankun-Kelly, T. Fluid Interaction for Information Visualization. Inf. Vis. 2011, 10, 327–340. [Google Scholar] [CrossRef]
  5. Shneiderman, B. Direct Manipulation: A Step Beyond Programming Languages. IEEE Comput. 1983, 16, 57–69. [Google Scholar] [CrossRef]
  6. Hadlak, S.; Schumann, H.; Schulz, H.J. A Survey of Multi-Faceted Graph Visualization. In Proceedings of the Eurographics Conference on Visualization (EuroVis)—STARs, Cagliari, Italy, 25–29 May 2015; Eurographics Association: Geneve, Switzerland, 2015; pp. 1–20. [Google Scholar]
  7. Battista, G.D.; Eades, P.; Tamassia, R.; Tollis, I.G. Graph Drawing: Algorithms for the Visualization of Graphs; Prentice Hall: Upper Saddle River, NJ, USA, 1998. [Google Scholar]
  8. Henry, N. Exploring Large Social Networks with Matrix-Based Representations. Ph.D. Thesis, Université Paris-Sud, Paris, France, University of Sydney, Sydney, Australia, 2008. [Google Scholar]
  9. Henry, N.; Fekete, J.D.; McGuffin, M.J. NodeTrix: A Hybrid Visualization of Social Networks. IEEE Trans. Vis. Comput. Graph. 2007, 13, 1302–1309. [Google Scholar] [CrossRef] [PubMed]
  10. Rao, R.; Card, S.K. The Table Lens: Merging Graphical and Symbolic Representations in an Interactive Focus+Context Visualization for Tabular Information. In Proceedings of the SIGCHI Conference Human Factors in Computing Systems (CHI), Boston, MA, USA, 24–28 April 1994; ACM Press: New York, NY, USA, 1994; pp. 318–322. [Google Scholar]
  11. Cleveland, W.C.; McGill, M.E. Dynamic Graphics for Statistics; CRC Press: Boca Raton, FL, USA, 1988. [Google Scholar]
  12. Inselberg, A.; Dimsdale, B. Parallel Coordinates: A Tool for Visualizing Multi-dimensional Geometry. In Proceedings of the IEEE Visualization Conference (Vis), San Francisco, CA, USA, 23–26 October 1990; IEEE Computer Society Press: Los Alamitos, CA, USA, 1990; pp. 361–378. [Google Scholar]
  13. Kerren, A.; Purchase, H.C.; Ward, M.O. (Eds.) Multivariate Network Visualization. In Lecture Notes in Computer Science; Springer: Berlin, Germany, 2014; Volume 8380.
  14. Crnovrsanin, T.; Muelder, C.; Faris, R.; Felmlee, D.; Ma, K. Visualization Techniques for Categorical Analysis of Social Networks with Multiple Edge Sets. Soc. Netw. 2014, 37, 56–64. [Google Scholar] [CrossRef]
  15. Jusufi, I.; Dingjie, Y.; Kerren, A. The Network Lens: Interactive Exploration of Multivariate Networks Using Visual Filtering. In Proceedings of the International Conference Information Visualisation (IV), London, UK, 26–29 July 2010; IEEE Computer Society Press: Los Alamitos, CA, USA, 2010; pp. 35–42. [Google Scholar]
  16. Shneiderman, B.; Aris, A. Network Visualization by Semantic Substrates. IEEE Trans. Vis. Comput. Graph. 2006, 12, 733–740. [Google Scholar] [CrossRef] [PubMed]
  17. Bezerianos, A.; Chevalier, F.; Dragicevic, P.; Elmqvist, N.; Fekete, J. GraphDice: A System for Exploring Multivariate Social Networks. Comput. Graph. Forum 2010, 29, 863–872. [Google Scholar] [CrossRef]
  18. Rodrigues, E.M.; Milic-Frayling, N.; Smith, M.A.; Shneiderman, B.; Hansen, D.L. Group-in-a-Box Layout for Multi-Faceted Analysis of Communities. In Proceedings of the International Conference on Privacy, Security, Risk and Trust and Inernational Conference on Social Computing (PASSAT/SocialCom), Boston, MA, USA, 9–11 October 2011; IEEE Computer Society Press: Los Alamitos, CA, USA, 2011; pp. 354–361. [Google Scholar]
  19. Van den Elzen, S.; van Wijk, J.J. Multivariate Network Exploration and Presentation: From Detail to Overview via Selections and Aggregations. IEEE Trans. Vis. Comput. Graph. 2014, 20, 2310–2319. [Google Scholar] [CrossRef] [PubMed]
  20. Tominski, C.; Abello, J.; Schumann, H. CGV—An Interactive Graph Visualization System. Comput. Graph. 2009, 33, 660–678. [Google Scholar] [CrossRef]
  21. Wang Baldonado, M.Q.; Woodruff, A.; Kuchinsky, A. Guidelines for Using Multiple Views in Information Visualization. In Proceedings of the Conference on Advanced Visual Interfaces (AVI), Palermo, Italy, 24–26 May 2000; ACM Press: New York, NY, USA, 2000; pp. 110–119. [Google Scholar]
  22. Tominski, C. Interaction for Visualization. In Synthesis Lectures on Visualization; Morgan & Claypool: San Rafael, CA, USA, 2015; Volume 3. [Google Scholar]
  23. Sedig, K.; Parsons, P. Design of Visualizations for Human-Information Interaction: A Pattern-Based Framework. In Synthesis Lectures on Visualization; Morgan & Claypool: San Rafael, CA, USA, 2016; Volume 4. [Google Scholar]
  24. Spence, R. Information Visualization: Design for Interaction, 2nd ed.; Prentice-Hall: Harlow, Essex, UK, 2007. [Google Scholar]
  25. Bederson, B.B. The Promise of Zoomable User Interfaces. Behav. Inf. Technol. 2011, 30, 853–866. [Google Scholar] [CrossRef]
  26. Tominski, C.; Gladisch, S.; Kister, U.; Dachselt, R.; Schumann, H. Interactive Lenses for Visualization: An Extended Survey. Comput. Graph. Forum 2016, in press. [Google Scholar] [CrossRef]
  27. Raisamo, J.; Raisamo, R.; Karkkainnen, P. A Method for Interactive Graph Manipulation. In Proceedings of the International Conference Information Visualisation (IV), London, UK, 16 July 2004; IEEE Computer Society Press: Los Alamitos, CA, USA, 2004; pp. 581–587. [Google Scholar]
  28. Spritzer, A.S.; Freitas, C.M.D.S. A Physics-Based Approach for Interactive Manipulation of Graph Visualizations. In Proceedings of the Conference on Advanced Visual Interfaces (AVI), Naples, Italy, 28–30 May 2008; ACM Press: New York, NY, USA, 2008; pp. 271–278. [Google Scholar]
  29. McGuffin, M.J.; Jurisica, I. Interaction Techniques for Selecting and Manipulating Subgraphs in Network Visualizations. IEEE Trans. Vis. Comput. Graph. 2009, 15, 937–944. [Google Scholar] [CrossRef] [PubMed]
  30. Riche, N.H.; Dwyer, T.; Lee, B.; Carpendale, S. Exploring the Design Space of Interactive Link Curvature in Network Diagrams. In Proceedings of the Conference on Advanced Visual Interfaces (AVI), Capri Island (Naples), Italy, 22–25 May 2012; ACM Press: New York, NY, USA, 2012; pp. 506–513. [Google Scholar]
  31. Shannon, P.; Markiel, A.; Ozier, O.; Baliga, N.S.; Wang, J.T.; Ramage, D.; Amin, N.; Schwikowski, B.; Ideker, T. Cytoscape: A Software Environment for Integrated Models of Biomolecular Interaction Networks. Genome Res. 2003, 13, 2498–2504. [Google Scholar] [CrossRef] [PubMed]
  32. Adar, E. GUESS: A Language and Interface for Graph Exploration. In Proceedings of the SIGCHI Conference Human Factors in Computing Systems (CHI), Montreal, QC, Canada, 22–27 April 2006; ACM Press: New York, NY, USA, 2006; pp. 791–800. [Google Scholar]
  33. Mathieu, B.; Heymann, S.; Jacomy, M. Gephi: An Open Source Software for Exploring and Manipulating Networks. In Proceedings of the Third International Conference on Weblogs and Social Media (ICWSM), San Jose, CA, USA, 17–20 May 2009; AAAI Press: Menlo Park, CA, USA, 2009; pp. 361–362. [Google Scholar]
  34. Auber, D.; Archambault, D.; Bourqui, R.; Lambert, A.; Mathiaut, M.; Mary, P.; Delest, M.; Dubois, J.; Melançon, G. The Tulip 3 Framework: A Scalable Software Library for Information Visualization Applications Based on Relational Data; Research Report RR-7860; INRIA: Rocquencourt, France, 2012. [Google Scholar]
  35. Grundy, J.; Hosking, J. Supporting Generic Sketching-Based Input of Diagrams in a Domain-Specific Visual Language Meta-Tool. In Proceedings of the International Conference on Software Engineering (ICSE), Minneapolis, MN, USA, 20–26 May 2007; IEEE Computer Society Press: Los Alamitos, CA, USA, 2007; pp. 282–291. [Google Scholar]
  36. Frisch, M.; Heydekorn, J.; Dachselt, R. Diagram Editing on Interactive Displays Using Multi-touch and Pen Gestures. In Proceedings of the International Conference on Diagrammatic Representation and Inference (Diagrams), Portland, OR, USA, 9–11 August 2010; Springer: Berlin, Germany, 2010; pp. 182–196. [Google Scholar]
  37. Gladisch, S.; Schumann, H.; Ernst, M.; Füllen, G.; Tominski, C. Semi-Automatic Editing of Graphs with Customized Layouts. Comput. Graph. Forum 2014, 33, 381–390. [Google Scholar] [CrossRef]
  38. Gladisch, S.; Schumann, H.; Luboschik, M.; Tominski, C. Toward Using Matrix Visualizations for Graph Editing. In Poster at IEEE Conference on Information Visualization (InfoVis), Chicago, IL, USA, 25–30 October 2015; 2015. [Google Scholar]
  39. Gladisch, S.; Tominski, C. Toward Integrated Exploration and Manipulation of Data Attributes in Graphs. In Poster at IEEE Conference on Information Visualization (InfoVis), Paris, France, 9–14 November 2014.
  40. Lam, H. A Framework of Interaction Costs in Information Visualization. IEEE Trans. Vis. Comput. Graph. 2008, 14, 1149–1156. [Google Scholar] [CrossRef] [PubMed]
  41. Vermeulen, J.; Luyten, K.; van den Hoven, E.; Coninx, K. Crossing the Bridge over Norman’s Gulf of Execution: Revealing Feedforward’s True Identity. In Proceedings of the SIGCHI Conference Human Factors in Computing Systems (CHI), Paris, France, 27 April–2 May 2013; ACM Press: New York, NY, USA, 2013; pp. 1931–1940. [Google Scholar]
  42. Harrower, M.A.; Brewer, C.A. ColorBrewer.org: An Online Tool for Selecting Color Schemes for Maps. Cartogr. J. 2003, 40, 27–37. [Google Scholar] [CrossRef]
  43. Luboschik, M.; Schumann, H.; Cords, H. Particle-Based Labeling: Fast Point-Feature Labeling without Obscuring Other Visual Features. IEEE Trans. Vis. Comput. Graph. 2008, 14, 1237–1244. [Google Scholar] [CrossRef] [PubMed]
  44. Norman, D.A. The Design of Everyday Things; Basic Books: New York, NY, USA, 2013. [Google Scholar]
  45. Cockburn, A.; Karlson, A.; Bederson, B.B. A Review of Overview+Detail, Zooming, and Focus+Context Interfaces. ACM Comput. Surv. 2008, 41, 2:1–2:31. [Google Scholar] [CrossRef]
  46. Appert, C.; Fekete, J.D. OrthoZoom Scroller: 1D Multi-Scale Navigation. In Proceedings of the SIGCHI Conference Human Factors in Computing Systems (CHI), Montreal, QC, Canada, 22–27 April 2006; ACM Press: New York, NY, USA, 2006; pp. 21–30. [Google Scholar]
  47. Rosario, G.E.; Rundensteiner, E.A.; Brown, D.C.; Ward, M.O.; Huang, S. Mapping Nominal Values to Numbers for Effective Visualization. Inf. Vis. 2004, 3, 80–95. [Google Scholar] [CrossRef]
  48. Jusufi, I.; Klukas, C.; Kerren, A.; Schreiber, F. Guiding the Interactive Exploration of Metabolic Pathway Interconnections. Inf. Vis. 2012, 11, 136–150. [Google Scholar] [CrossRef]
  49. Frisch, M.; Dachselt, R. Visualizing Offscreen Elements of Node-Link Diagrams. Inf. Vis. 2013, 12, 133–162. [Google Scholar] [CrossRef]
  50. Abello, J.; Hadlak, S.; Schumann, H.; Schulz, H.J. A Modular Degree-of-Interest Specification for the Visual Analysis of Large Dynamic Networks. IEEE Trans. Vis. Comput. Graph. 2014, 20, 337–350. [Google Scholar] [CrossRef] [PubMed]
  51. Eichner, C.; Nocke, T.; Schulz, H.J.; Schumann, H. Interactive Presentation of Geo-Spatial Climate Data in Multi-Display Environments. ISPRS Int. J. Geo-Inf. 2015, 4, 493–514. [Google Scholar] [CrossRef]
  52. Wilkinson, L.; Anand, A.; Grossman, R.L. High-Dimensional Visual Analytics: Interactive Exploration Guided by Pairwise Views of Point Distributions. IEEE Trans. Vis. Comput. Graph. 2006, 12, 1363–1372. [Google Scholar] [CrossRef] [PubMed]
  53. Sips, M.; Neubert, B.; Lewis, J.P.; Hanrahan, P. Selecting Good Views of High-Dimensional Data Using Class Consistency. Comput. Graph. Forum 2009, 28, 831–838. [Google Scholar] [CrossRef]
  54. Chevalier, F.; Vuillemot, R.; Gali, G. Using Concrete Scales: A Practical Framework for Effective Visual Depiction of Complex Measures. IEEE Trans. Vis. Comput. Graph. 2013, 19, 2426–2435. [Google Scholar] [CrossRef] [PubMed]
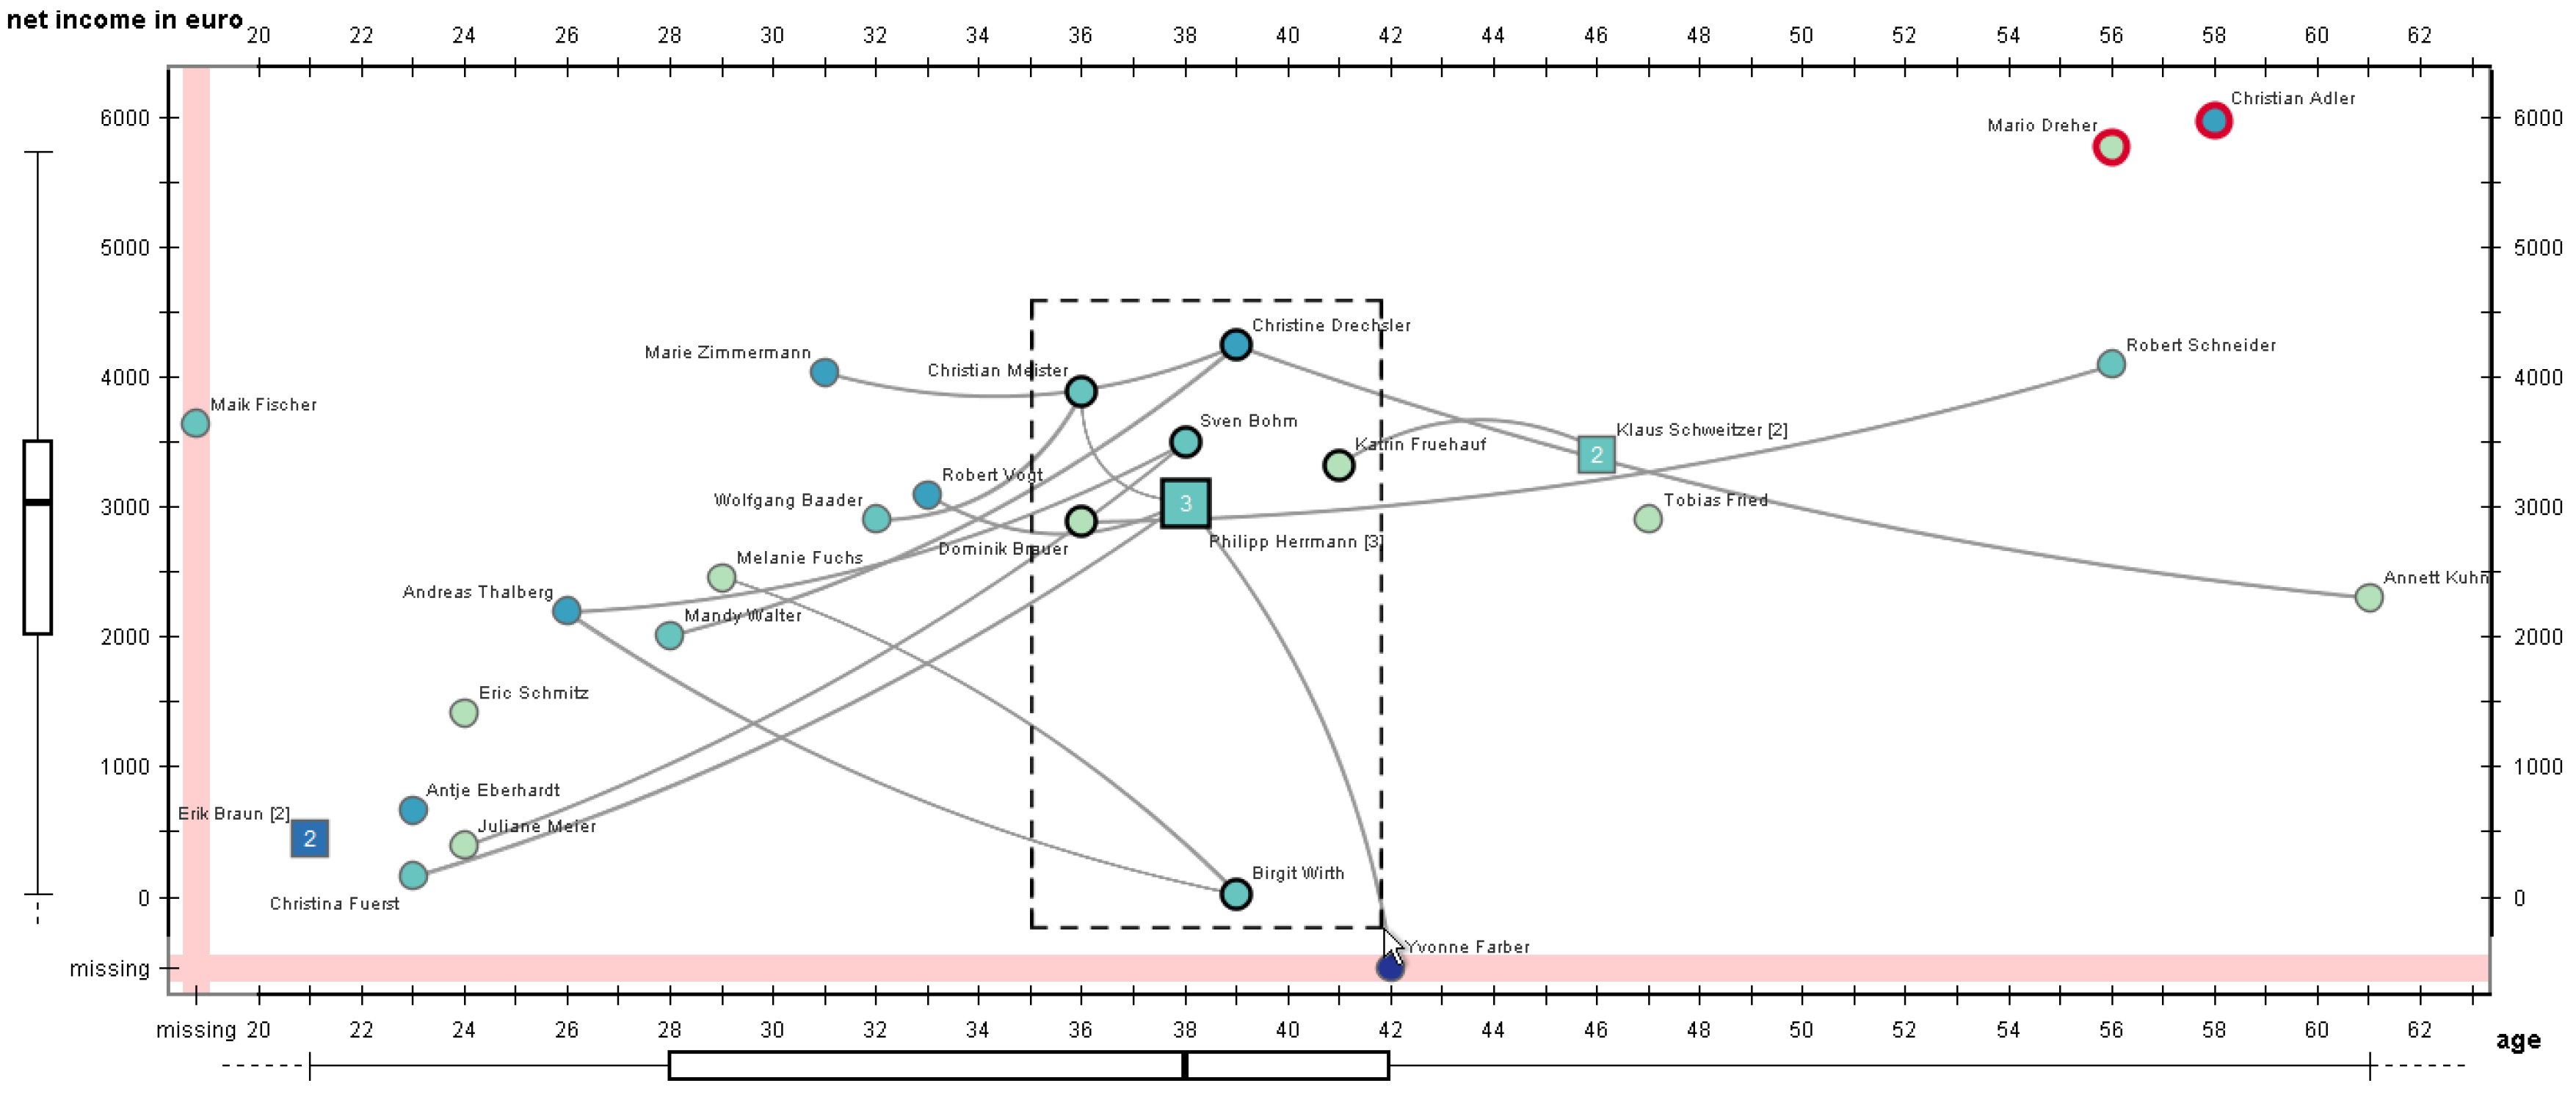
Figure 1. Node-link representation with scatter plot layout. Nodes (persons) are positioned according to two quantitative attributes: net income and age. Nodes with missing values are located in the reddish bars along the axes. Graph edges (friendships) are shown only for selected nodes indicated by a black outline.
Informatics 03 00017 g001
Figure 2. Dynamic node clustering. (a) Cluster node; (b) fan out of individual nodes.
Informatics 03 00017 g002
Figure 3. Editing a quantitative attribute using a drag-and-drop gesture in combination with focus+context. (a) Long press to start editing; (b) drag roughly to target; (c) activate focus+context; (d) drag precisely to target.
Informatics 03 00017 g003
Figure 4. Semantic substrates visualize the node attribute occupation. For each qualitative value, a colored region collects the nodes that exhibit the corresponding value. Edges are shown only for selected nodes.
Informatics 03 00017 g004
Figure 5. Editing the occupation of persons by dragging a node from the region “Sales worker” to (a) the region “Student”; and (b) to a proxy indicating the off-screen region “Machine operator”.
Informatics 03 00017 g005
Figure 6. Visually detecting and directly correcting the erroneous transmission power of an access point of a wireless network.
Informatics 03 00017 g006
Figure 7. A semantic substrates visualization according to document topics of a dynamically created document network. Several missing documents could be directly corrected using our approach.
Informatics 03 00017 g007