Abstract
In wireless sensor networks (WSNs), efficient energy conservation is required to prolong the lifetime of the network. In this work, we have given emphasis on balanced energy consumption and energy holes avoidance. This paper proposes a multi-gateway-based approach to reduce the transmission distance between the sender and the sink node. The area to be monitored is divided into regions and gateway nodes are deployed at optimal positions. We have designed a transmission scheme, in which sensors in the sink region communicate directly to the sink, sensors in the gateway region communicate directly to the gateway, and sensors in the cluster region transmit their data directly to their respective cluster head which transmits data to the gateway in its region. If the distance between a cluster head and the sink is less than the distance between the cluster head and the gateway node, the cluster head transmits data to the sink instead of the gateway node. We have compared the proposed protocol with Low-Energy Adaptive Clustering Hierarchy (LEACH), Gateway Based Energy Aware Multi-Hop Routing (M-GEAR), and Gateway Based Stable Election Protocol (GSEP) protocols. The protocol performs better than other protocols in terms of throughput, stability period, lifetime, residual energy, and the packet transmitted to the sink.
1. Introduction
A wireless sensor network (WSN) contains a large number of densely-deployed sensor nodes that have limited energy and data processing capability. Sensor nodes monitor regions, gather data and transfer data towards the sink [1]. Sensors are being used in many applications, e.g., military area, habitat, and smart home monitoring [2].
Energy efficiency is one of the main concerns in designing of a routing protocol for a WSN. The sensory data is forwarded to the sink node, by using one-hop or multi-hop routing. In the case of multi-hop communication, some nodes transmit only their data while others transmit their own data plus data of other nodes. Therefore, energy depletion of one node varies from another, i.e., nodes nearby the sink node have more energy depletion than other nodes. This gives rise to the creation of energy holes near the sink [3,4]. Due to the energy holes problem further data transmission towards the sink is not possible. If nodes use direct communication or single-hop routing, nodes which are at a far distance from the sink will deplete energy faster than other nodes in the network. It will create energy holes in the outer area of the network and the area will remain uncovered at this place. Therefore, the network lifespan ends shortly and energy of the nodes would be unexploited [5,6].
There are several existing techniques which can improve network lifetime by balancing energy consumption, like clustering [7], data fusion [8], an optimal node deployment [9], and using the assistance of the gateway nodes [10].
We propose a multi-gateway-based energy holes avoidance (MGBEHA) routing protocol for a WSN. In this work we have achieved balanced energy depletion by reducing the transmission distance between the transmitter and the receiver. The network is divided into multiple regions. One gateway node is placed between two regions. Nodes in different regions use different types of communication. Nodes near the sink communicate directly with the sink, nodes near gateways communicate directly with the gateway, and in other regions communicate with cluster heads (CHs). We have compared our protocol with the LEACH [7], the M-GEAR [11], and the gateway-based stable election multi-hop routing protocol for wireless sensor networks (GSEP) [12] protocols.
The MGBEHA protocol is novel, as it provides the solution of the energy holes problem by using gateway nodes. The existing research mainly uses the gateway nodes to improve lifetime of the network, but the use of gateway nodes for energy holes problem is not available until now. Moreover, the MGBEHA protocol deploys the gateway nodes in an optimal way with respect to the size of the area. If the size of the area is large, an additional number of gateways can be deployed in the network. There is no constraint on the number of gateways which can be deployed in the area. The MGBEHA protocol supports scalable networks, whereas the existing related research has fixed the number of gateways and does not provide scalability. We have also computed the throughput improvement ratio per round for all protocols, and it was never provided in the existing related literature.
Nadeem et al., in [11] have proposed a gateway-based model to improve the lifetime of the network. They have deployed sensor nodes in the logical regions on the basis of their location in the sensing field. They have placed the gateway node at the middle of the sensing field. The gateway node collects data from the other nodes in the field and transmits it to the base station (BS). This approach improves the network’s lifetime, but fails when the size of the area increases as there is a single centralized gateway node to assist entire nodes in the area. While, in our approach, the number of gateway nodes increases as the size of the area increases. Moreover, there is no constraint on the number of gateway nodes, which can be deployed in the network area.
Authors in [12] have proposed a gateway-based model in heterogeneous sensor networks (nodes with unequal initial energy). In this method some gateway nodes are placed at the border of the area. Cluster heads, which are inside the network, calculate distance between itself and all gateway nodes and then select the gateway node which is nearest to it. Then cluster heads transmit data to the gateway node. This approach also improves the network’s lifetime, but there are some issues with this protocol. Its major requirement is heterogeneous network which is always not possible; it takes an approximate number of gateway nodes. The number of gateway nodes deployed is not determined in a logical way. A small number of gateway nodes can be inefficient for a larger area and the large number of gateways is unnecessary in a small area. Gateway nodes are positioned at the border of an area; as a result nodes in this area consume less power in transmission but nodes in remote area consume more power. As the size of area increases this situation gets worst.
The rest of the paper is organized as follows: Section 2 presents the related work. A node deployment model has been presented in Section 3. Section 4 describes the energy consumption model. Section 5 explains the proposed protocol. Section 6 provides the proposed algorithm. Section 7 gives the usefulness of the protocol in real life. Section 8 provides an energy consumption analysis of the MGBEHA protocol. Section 9 provides simulation and results analysis. Section 10 gives the details of future work and Section 11 concludes the paper.
2. Related Work
There are various methods available in the literature to maximize the lifetime of the sensor networks [13,14,15,16,17,18], but the lifetime of WSNs is most affected by the energy holes problem. The fewer the number of energy holes present in the network, the longer the lifetime of the network. Therefore, the energy holes should be avoided to the greatest level possible. To facilitate the discussion, we categorize the existing research as follows.
2.1. Node Distribution Strategies
Authors in [5] have given detailed guidelines to avoid energy holes in a uniform node distribution. They have analyzed that the energy holes problem cannot be completely removed from the network. Therefore, efficient mechanisms must be used to minimize the holes problem. Authors in [6] have used a non-uniform distribution of nodes near the sink to avoid energy holes near the sink. They assumed that if the node density is higher in the sink area than the outer part of the network, more nodes will be available to relay data of other nodes. When some nodes die, other nodes are still available for communication. This will increase the network lifetime as the number of data forwarding nodes increases near the sink area. Authors in [19] have used a transmission range-based energy consumption to establish uniform energy consumption among nodes. Node density in different regions of the area varies according to distance of nodes from the sink. Authors have computed the traffic load on sensor nodes and found that load is at a maximum in the innermost corona. As the distance increases from the outermost corona area to the inner area which is nearby the sink, node density also increases. In other words, the authors have used a non-uniform node distribution strategy. Our model follows a uniform node distribution strategy.
2.2. Data Aggregation Based Approaches
Jia et al. [20] have used a transmission based scheme to avoid energy holes. They have restricted the transmission of duplicate messages for any pixel in the area. Reduction in the number of packets transmitted improves network lifetime. An entropy (a measure of the degree of randomness or disorder)-based model to preserve sensor energy has been proposed by Sinha et al. [8]. Sensors periodically sample the data and transmit to the sink; however, the sampling produces useful data as well as useless raw data. The entropy-based model is used to perform data aggregation by extracting high-precision data from the sensors. The entropy is determined by different probability models. They have also proposed an energy efficient clustering process of the sensor nodes in the network. At the beginning, sensors sensing the different type of data were placed within separate clusters. Then, remaining un-clustered sensors assess their deviation with respect to the clustered neighbors and eventually joins the least-deviated cluster in the network. We have also used data aggregation techniques in our model. Data aggregation is performed by cluster heads as well as by the gateway nodes.
2.3. Uneven Clustering Approaches
Ma et al., in [21] have used unequal clustering with non-uniform node distribution to mitigate the energy holes problem. Authors have calculated the energy consumption rate of each node in inter-cluster communication and intra-cluster communication. They concluded that energy consumption rates can be minimized by resizing the cluster size. The energy consumption rate (ECR) per node of each corona is determined. If the ECR is large, then the size of the clusters near the sink is less than the size of the cluster far away from the sink, otherwise not. Soro et al. [22] have studied the hotspot problem in wireless sensor networks. The hot spots are the certain section of the area where the energy of the nodes drains faster as compared to energy of nodes in other areas. If the network follows a single-hop communication, nodes farthest from the sink die soon; on the other hand, if the network follows multi-hop routing, nodes near the sink die soon. Authors have exploited the uneven clustering approach to solve the hotspot problem.
2.4. Other Clustering-Based Approaches
Authors in [23] have done an analysis of different cluster-based protocols for the energy holes problem. They have computed the energy consumption of nodes in different regions at different times and found out that the node density has a small influence on power utilization of cluster-based networks. Bencan et al. [24] have considered heterogeneous clustering schemes where different rings contain sensor nodes with dissimilar initial energy. The cluster heads in inner rings can transmit data directly towards the sink, while cluster heads (CHs) in outer ring forward data to the cluster heads of inner rings.
Singh et al. [25] have proposed an energy-efficient clustering algorithm with load balancing to maximize network lifetime. Initially they have proposed a density-based dynamic clustering (DDC) algorithm for clustering the sensors in the network area. The DDC algorithm uses the subtractive clustering to generate the cluster seeds. The subtractive clustering computes the sufficient number of clusters (seeds) and their position in the network area. The seed node provides a unique cluster id which is used to identify a cluster among all the clusters in the network. The seed node generates a packet with its unique id and broadcasts this packet to all the neighboring nodes. A receiving node examines the packet and accepts it, if it is not already clustered and then broadcasts it to the neighboring nodes. However, if the receiving node is already clustered, it simply discards the packet. This process is repeated until all of the nodes in the network are clustered. They have also designed a distributed independence set discovery (DISD) method for cluster head selection. The independence set provides a maximum possible coverage of area by the selected nodes. They have vigorously set up an optimal sensor cover to control maximum sensors inside a cluster and consequently making an in-dependence set (IDS). In the CH selection, only the members of Cluster Heads are permitted to take part. A mandatory energy level for becoming a cluster head is defined. A node which satisfies this energy level becomes the cluster head.
Authors in [26] have divided the network area into circular regions. The density of nodes in the inner circular region is more than the density of nodes in the outer circular region. Initially CHs are chosen from inner region. When the total residual energy of inner region becomes lower than the outer region, CHs are selected from outer region. The energy of both the regions is calculated at every round. The cluster heads are always selected from the region of higher energy. In this way the energy of the entire area is consumed uniformly, so the chance of energy holes in the area becomes minimal. We have used a LEACH-based clustering method in our protocol.
2.5. Gateway Based Approaches
In the clustering techniques, cluster heads are selected from the normal sensors which may expire rapidly due to fast energy diminution for such an additional workload. Therefore, some researchers [27,28,29] have suggested the use of some extraordinary nodes called gateways or relay nodes, which are equipped with superfluous energy and larger communication range than the normal sensor nodes.
Authors in [30] have proposed a fault tolerance and gateway-based energy-efficient method. In their method, gateway nodes perform the work of cluster heads. Hence, they have considered that the gateways are also energy constrained and can fail during network operation. They have considered the problem of failure of cluster head (CH)/gateway. In clustering-based methods, if a CH node fails, all member nodes will not be able to transmit data. Authors have used a heterogeneous network in which a CH is equipped with more battery power than non-CH nodes and it acts as a gateway node. They have proposed a distributed algorithm for fault tolerance routing (DFTR) which is based on the distance and residual energy parameters. The DFTR selects the next hop gateway in such a manner that energy utilization of the gateways is balanced. It also considers those gateways which have no next hop gateway towards the sink. In our model, gateway nodes are not energy constrained; therefore, there is no need to search the availability of next hop gateway node in each round of the algorithm. There is no possibility of a gateway node’s failure.
Authors in [31] have introduced a gateway node-based load balancing scheme which assigns the sensor nodes to gateways in such a way that load of all gateways is minimized. However, in our method, there is no fixed number of nodes assigned to a gateway node. In our model, there is a region-wise distribution of nodes. A gateway node can handle the data of any number of nodes, within its region.
Kannan et al. [32] have proposed the gateway based distributed cluster head scheduling (DCHS) algorithm. The authors have partitioned the network into primary and secondary tiers by using the received signal strength indicator (RSSI) of the sensors from the base station. Cluster heads are present in the primary tier while cluster nodes are present in the secondary tier. This two tier approach decreases the communication distance between cluster heads and their member nodes. Therefore, similar to our method, this approach also reduces the consumption of transmission energy by reducing the transmission distance. The DCHS reduces the distance between the cluster head and cluster node, while our method reduces the transmission distance between the cluster head and the sink node. In the DCHS, the base station calculates the aggregate RSSI value of all nodes and decides the tier of the nodes. Nodes which have higher RSSI values belong to the primary tier while others belong to the secondary tier. Next, the base station elects three types of nodes in the primary tier, such as CHs (cluster heads) which communicate with cluster nodes, G1 (gateway nodes) which send the data between the primary tier and the base station, and G2 (gateway nodes) which operate as the relay nodes between primary and secondary tiers.
Taruna et al. [33] have proposed a gateway node and multi-hop cluster-based routing protocol. They have assumed unlimited battery power in the gateway nodes. The cluster heads and the gateway nodes form a multi-level hierarchy in the network. This hierarchy is used for data transmission between the sensors and the base station. However, this model restricts the number of cluster heads in a network. If the size of the area increases, the number of cluster heads cannot cover the entire area. Moreover, the number of gateway nodes and their position are fixed. It can create unbalanced energy consumption in the area. In our model, the number of gateway nodes and cluster head are not fixed.
Koteswararao et al. [34] have also proposed multi-hop cluster routing. The authors have used normal sensor nodes as the gateway nodes. They have not provided an unconstrained power supply to the gateway nodes. To avoid quick energy depletion of gateway nodes, each gateway node is associated with only one cluster head. The main drawback of this protocol is the one-to-one relationship between the cluster head and the gateway node. If the number of cluster heads is more than the gateway nodes then the algorithm will fail. Moreover, after some rounds the energy of all gateway nodes will deplete, but there is no provision of a selection of new gateway nodes. In our model, gateway nodes have an unlimited power supply and one gateway node can be associated with any number of cluster heads of its region.
Sheenam et al. [35] have proposed the gateway-based distributed energy efficient clustering (G-DEEC) protocol in a heterogeneous sensor network. The authors have used rechargeable and stationary gateway nodes, which are placed at the center, corners, and the middle of the sensor field. Although the number and position of gateway nodes facilitate the communication between each cluster head and the gateway nodes, but the algorithm does not specify the process of gateway node selection. A cluster head can transmit data to any gateway node. If a cluster head selects a distant gateway node, transmission energy consumption will be high. In our method, a cluster head can only transmit to the gateway node of its region.
In our method, the number of gateways can increase as the size of area increase. Thus, we use gateway nodes and clustering techniques to avoid energy holes and improve the network’s lifetime. Gateway-based sensor networks are also suitable in real-life scenario as shown in [36].
3. Node Deployment Model
We have considered various scenarios of the MGBEHA protocol according to the size of the area; e.g., one with two gateway nodes and another with four gateway nodes as shown in Figure 1a,b. Figure 2a–c shows scenarios with 6 GW, 10 GW, and 20 GW. There are four types of nodes in each scenario; normal sensor nodes, cluster head, cluster members, and the gateway node. In the beginning, other than gateway nodes, all the nodes are normal, but after the clustering process, some nodes are selected as the cluster heads and some as the cluster members. If the node is a cluster member, it consumes power in transmission only, while if the node is a cluster head, it consumes power in transmission, receiving, and aggregating the received data. Basic assumptions are as follows:
- The Surveillance field is a two dimensional area.
- Total N homogeneous sensor nodes equipped with equal initial energy have been deployed randomly and uniformly in the area. All nodes are assigned with a unique identifier (ID) and these are capable of information collection. The sink node is at the center of the area and surrounded by a predefined area.
- One gateway node is deployed between every two regions and it is surrounded by a pre-specified area.
- Sensor nodes, sink node, and gateway nodes are stationary after deployment.
- Sink node and gateway nodes have an unconstrained power supply.
- Location information is accessible to all sensors and gateway nodes either through an embedded GPS device or through some location-finding algorithm.
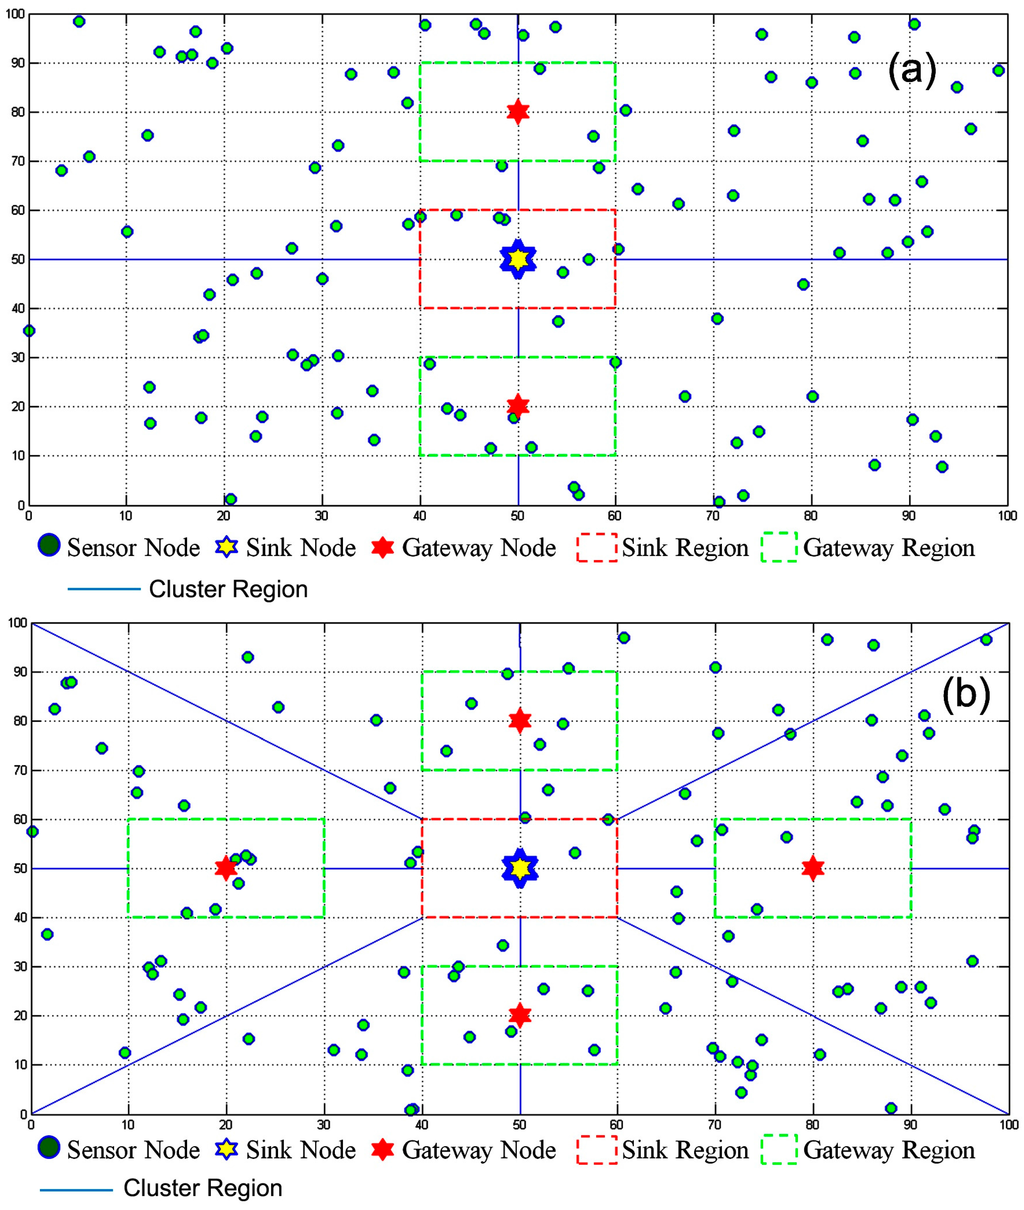
Figure 1.
MATLAB view of the MGBEHA protocol with (a) two gateways; and (b) four gateways.
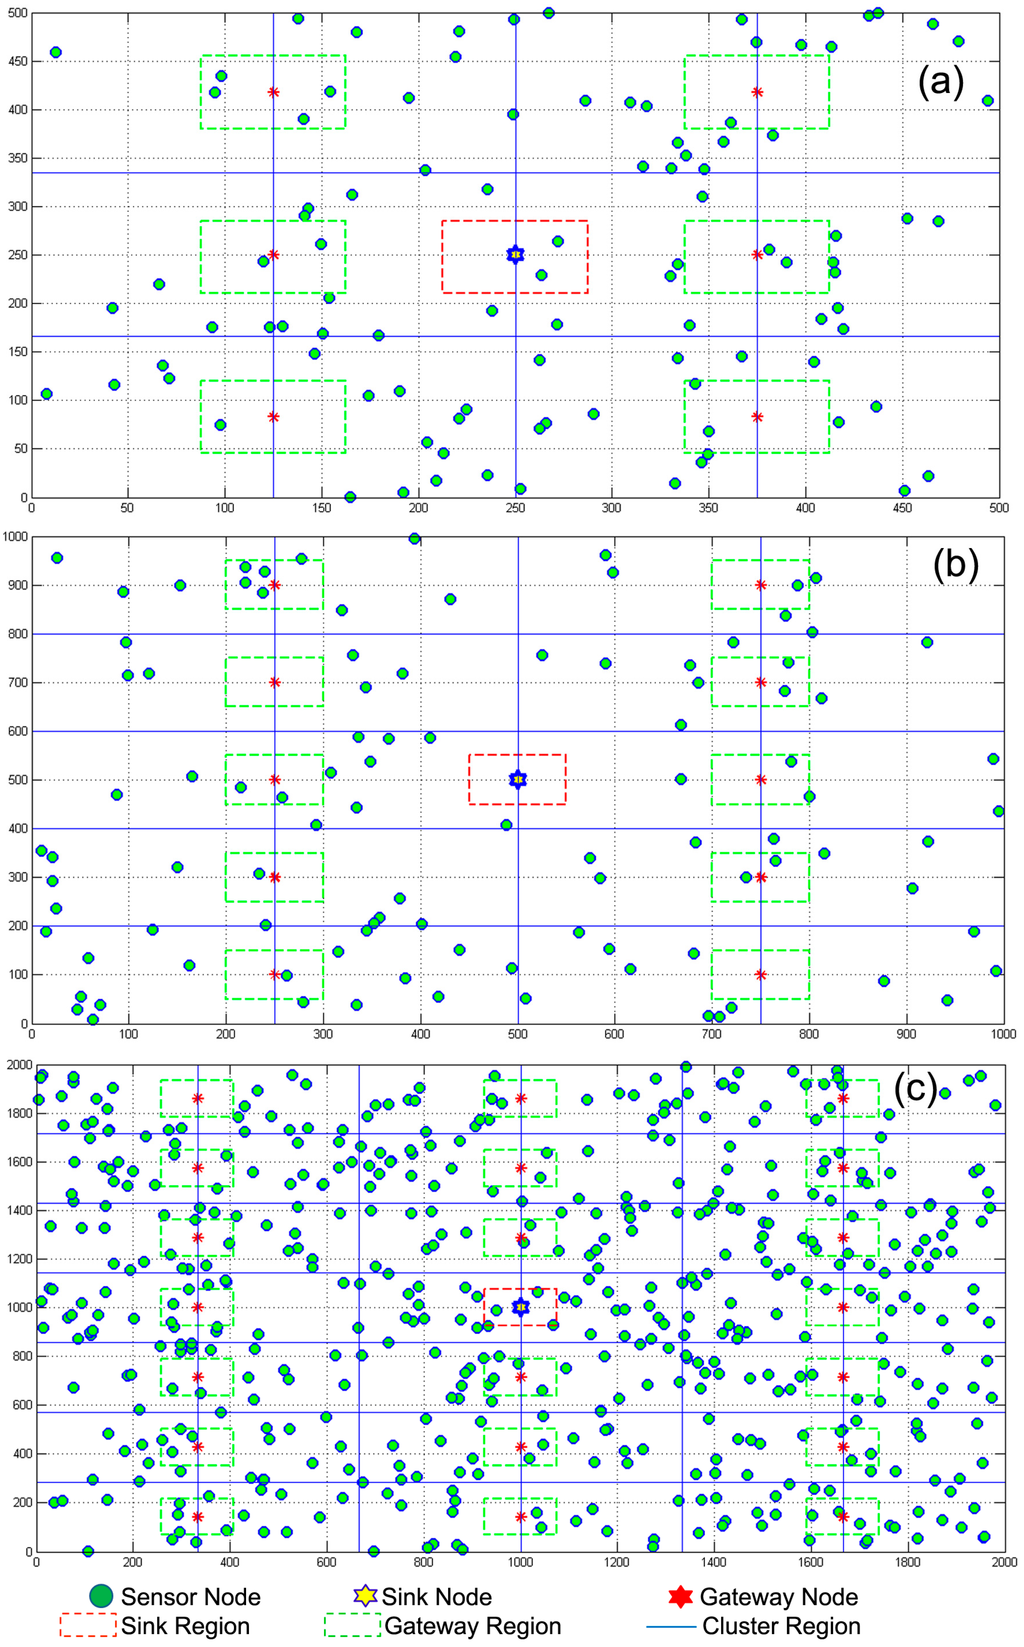
Figure 2.
MATLAB view of the MGBEHA protocol in (a) 500 × 500 m2 area; (b) 1000 × 1000 m2 area; and (c) 2000 × 2000 m2 area.
4. Energy Depletion Model
For a first-order radio model, energy consumed in transmission depends on the distance (d) between the transmitter and receiver [27]. When the distance is comparatively far away, the multiple-path fading channel model (εtwo-ray-amp; d4 power loss) is used, otherwise the free space model (εfriss-amp; d2 power loss) is used. For a k bit message and distance d, transmission energy (ETX) consumption is as follows:
Energy consumed in receiving k bits over distance d is as follows:
where ERX represent the energy consumed in receiving of k data bits and Eelec is the energy used to activate the transmitter and receiver circuit board. εfriss-amp and εtwo-ray-amp are amplifier energies used for free space and multipath fading model, respectively. The distance d0 is a threshold value known as a crossover point [27]. The energy consumed in the aggregation (EDA) of m messages is given by:
where the size of each message is k bits.
5. Multi-Gateway-Based Protocol
The LEACH [5] protocol consumes energy quite efficiently, but there are several drawbacks associated with it that may lead to the energy holes problem in the network. e.g., the size of a cluster is not predetermined in the LEACH protocol. The size of the cluster can be large or small. If the cluster size is large, the distance between the CH and a member node becomes large and the energy consumption for intra-cluster communication will increase. If the large size clusters are formed near the sink, the energy of nodes near the sink area will deplete quickly. After some rounds the energy of these nodes will be completely exhausted and energy holes will emerge in this area. In our protocol, the clustering process is well-organized within the region and clusters are not oversized.
In the LEACH protocol, CHs use direct (single-hop) communication towards the sink; if the distance between CH and sink is larger, more energy will be consumed in transmission. Energy holes will develop in remote areas of the network. We have reduced the transmission distance between CH and the sink by deploying a gateway between them. As the transmission distance is reduced, energy consumption in transmission is also reduced and there is an improvement in network lifetime. In LEACH, the number and position of cluster heads (CHs) are not predetermined, and it is possible that CHs are not uniformly formed over the area and some nodes do not have a nearby CH. We have solved this issue by division of the area into regions and a separate clustering process in each region.
5.1. Division of Area into Regions and Gateway Nodes Deployment
In order to provide uniform distribution of CHs throughout the area, the protocol divides the area into multiple regions. If the area is large, it can be further divided into a larger number of regions. In our protocol number of regions is not fixed as in M-GEAR protocol [6]. Instead, in our protocol, the number of regions more or less depends on the size of the area.
The entire area is divided into three types of regions: sink region (SR), gateway region (GR), and cluster region (CR). Each cluster region has a separate clustering process and has its own CHs; every node in the CR is a member of some nearby cluster. The formation of cluster regions also minimizes the distance from CHs to sensors. This results in a lower communication cost and lower energy depletion. To avoid the formation of energy holes near a receiver node, the clustering process is not performed in the sink and gateway regions. We have taken two scenarios to show how the area can be divided into multiple regions. As shown in Figure 1a, the 100 × 100 m2 area is divided into four cluster regions, two gateway regions, and one sink region. In Figure 1b, the same area has been divided into eight cluster regions, four gateway regions, and one sink region. When the area is divided into eight regions, two additional gateways are deployed in the region. In both types of division, one gateway node is deployed between every two regions.
If the number of regions increases, the number of gateway nodes also increases. There should be an appropriate division of area into regions. If the area is small then it is useless to divide the area into a large number of regions. If the area is large, it can be divided into a greater number of regions. For a 100 × 100 m2 area, deployment of four gateways produces better results than the deployment of two gateways. Therefore, for a 100 × 100 m2 area, an appropriate value of the gateway node is four. Figure 1a shows a multi-gateway-based energy holes avoidance routing protocol with two gateway nodes (MGBEHA 2 GW) and Figure 1b shows a multi-gateway-based energy holes avoidance routing protocol with four gateway nodes (MGBEHA 4 GW). Sizes of all gateway regions are the same. Similarly, sizes of all cluster regions are the same. Gateway regions are at equal distance from the sink. The location information of sink and gateways are used to create regions around the sink and gateway nodes, respectively.
If the area is large (e.g., 500 × 500 m2), it can be divided into 12 cluster regions, 6 gateway regions and one sink region as shown in Figure 2a. A very large area (e.g., 1000 × 1000 m2) can be further divided into 20 cluster regions, 10 gateway regions and one sink region as shown in Figure 2b. The number of sink region is always one and it does not change according to the size of the area. However, the number of gateway regions depends upon the number of cluster regions, and it is half of the number of cluster regions. The computation of number of cluster regions depends upon the size of the area. If the area is big, it will be divided into large number of cluster regions otherwise not. Figure 2c explains the partition of the 2000 × 2000 m2 area.
Moreover, our algorithm has no restriction on the number of regions in an area. It is based upon the user’s choice. If the user has cost constraint than he can use less number of gateways, on the other hand, if the user has no cost constraint and his main goal is extended lifetime, he may use large number of gateways in the area. The area is always divided into equal sized cluster regions. There can be any number of ways to divide a square area into equal parts. However, we have divided the area into equal parts as shown in Figure 1a,b and Figure 2a,b.
5.2. Sensor Node Distribution Phase
Sensors are distributed randomly over the surveillance area to accumulate some interesting phenomenon, like frequency of trembles in an earthquake-prone area or a change in the temperature of the area during the night. A gateway node acts as a central control system within two cluster regions. It initiates a request for accumulating the information. The gateway node broadcasts a control HELLO packet, and in reply, sensor nodes transmit their location information to the gateway. The gateway node calculates the distance of each sensor from itself and from the sink. If the sensor node is within the cluster region which is covered by the gateway node, it is in the range of the gateway node. The gateway node informs the sensor nodes about their region number by using their location information. It saves the resulting information into every sensor data table. The data table includes the sensor’s residual energy, identification number (ID), its distance to the sink and gateway, and its location information. In a hierarchical sensor network CHs are responsible for data retrieving, aggregation, and transmission. All sensors and the gateway node have information about the location of CHs; they send data or a query packet to CH directly instead of flooding the entire network with HELLO packets.
5.3. Cluster Setup and Schedule Creation Phase
According to LEACH [6], nodes choose themselves as CHs in different rounds with a specified probability Pi, which determines the expected number of CHs in current round r. Let k be the number of CHs in a round and N be the total number of nodes in the monitored area.
The probability of a node Ni to be elected as a cluster head at round r is given by:
where S is the set of non-cluster heads in recent (r mod N/k) rounds. P(Ni) is 1 if node Ni is not selected as a CH in recent rounds otherwise P (Ni) is zero. Value of (r mod N/k) determines the number of nodes selected as the CHs in the latest rounds. The total number of sensors which are eligible to be a CH at current round r is given by:
This confirms that energy consumption in all sensors is nearly the same after each round. The cluster heads are chosen in every region independently. CHs broadcast an ADV (advertisement) control packet to neighboring nodes in its region. Neighboring nodes reply with ACK (acknowledgement) to the nearest CH and become members of a cluster. To avoid collision, the cluster head of this cluster sets a time division multiple access mechanism [6] among its member nodes for data transmission. Member nodes of the cluster start transmitting data to the cluster head.
5.4. Data Collection and Transmission Phase
After the CH setup phase, the CH receives data from member nodes, aggregates it, and forwards to the gateway node in its region. Now the gateway aggregates data received from different CHs and from the nodes in the gateway region and forwards it to the sink. If the distance between a cluster head and sink is less than the distance between the cluster head and the gateway, the CH transmits data directly to the sink. Figure 3 illustrates the complete process of the MGBEHA protocol. The complete area division has been divided into eight cluster regions, four gateway regions, and one sink region. There is direct data transmission from nodes to sink in sink region and from nodes to gateways in gateway regions. Nodes in cluster regions transmit data to the cluster heads which, in turn, transmits it to the gateway node which again transmits it to the sink. Thus, there is multi-hop transmission of data for nodes in the cluster region. Nodes which use direct communication (like nodes in SR and GR) deplete less energy because of the smaller number of control packets and reduced distance. To deplete the energy of all nodes in a uniform way, gateway nodes help in reducing the transmission distance between senders (cluster head) and receivers (sink).
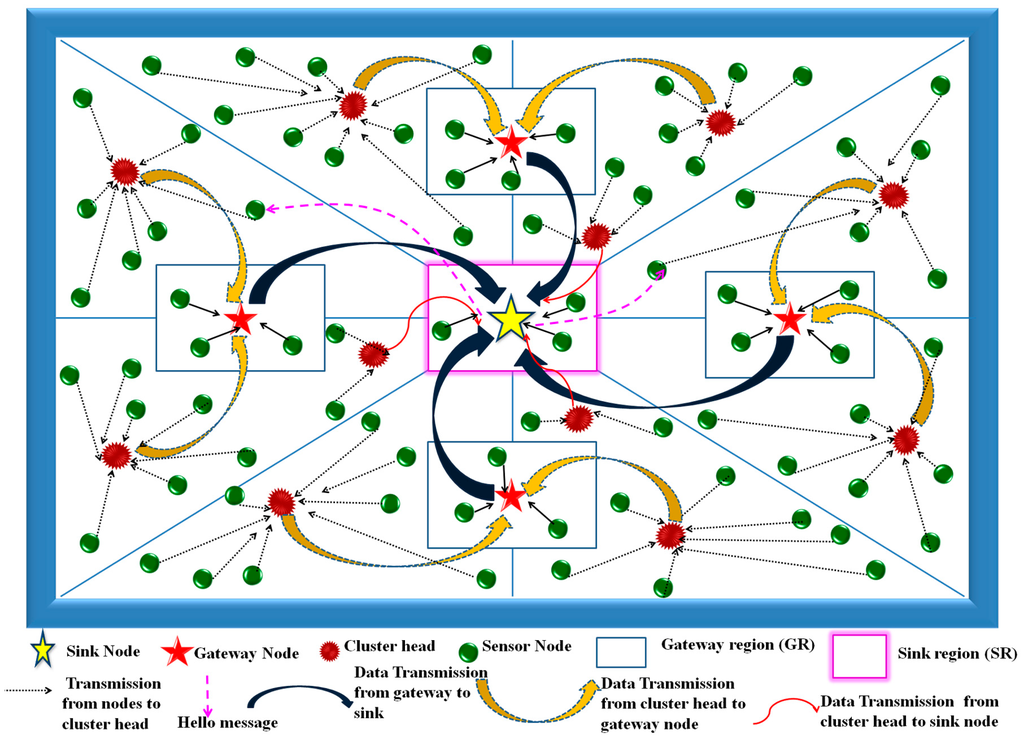
Figure 3.
Schematic diagram showing the complete process of the MGBEHA protocol.
6. Proposed Algorithm
The Algorithm 1 describes the MGBEHA protocol .The notations used in the Algorithm 1 are as follows:
- (a)
- Let N be the number of sensor nodes and R the number of cluster regions.
- (b)
- Einit is the initial energy. Ech is the energy of cluster head. Emem is the energy of a cluster member node. Enorm is the energy of a normal sensor node.
- (c)
- Area is a monitored network area. Area 1 is the area around the sink and Area 2 is the area around the gateway.
- (d)
- ETX, ERX, and EDA are the energies consumed in transmission, receiving, and aggregating, respectively. The size of each message is k bits.
- (e)
- DCG is the distance between a CH and the gateway node of its region. DCS is the distance between the cluster head and the sink node.
| Algorithm 1 |
|
7. Usefulness of Protocol in Real Life Scenario
The proposed protocol can be used in the building automation scenario. To measure the level of carbon monoxide (CO), CO sensors are deployed in the building. The sensors alert a security service if the level of CO exceeds the dangerous level. Let the sensors be deployed in different buildings of a society. A different setup is required for each building to transmit the data to the sink. However, if our proposed protocol is used, there is no need of a separate transmission mechanism for each building, one gateway is sufficient between two buildings. Sensors in two buildings can send data to the common gateway which transmits it to the sink. By reducing the transmission distance, sensors will consume less energy and a larger area can be covered by additional gateways.
8. Energy Consumption Analysis
In order to validate the simulations, we theoretically analyzed the energy consumption in the network and compared the theoretical and simulation results. Let us revisit the first-order radio energy model. The notations used in the analysis are as follows:
- (i)
- The energy (ETX) consumed in the transmission of a packet along a route of s intermediate sensor nodes, is given by:where, dλ| | is the distance between a transmitting and receiving node and value of the λ lies between 2 and 4. Here λ is a path loss component and its value depends on the power loss model. If the value of d < d0, value of λ is 2 (free space: εfs) otherwise value of λ is 4 (εtwo-ray-amp) and k is the number of bits in a packet.
- (ii)
- The sensor network is denoted as an undirected graph G(V, E), such that V represents the set of all nodes and E represents the set of edges as follows:where Lxy is the location information of the sensor node and and are the minimum and the maximum boundary value of the area. The minimum transmission energy threshold is given by . If node transmission energy falls below the threshold value, it can’t transmit.
- (iii)
- After the division of area into multiple regions, the network graph is also partitioned into the R sub graphs. The mth region of the area is represented by and the complete area can be represented as the union of all the regions as follows:
- (iv)
- The vertex set Vm of the region is given by:where, is the ith node of the mth region and the edge set is given by:where, and are the minimum and maximum location values of the mth region excluding the sink and gateway regions.
- (v)
- After the clustering process, few nodes of the mth region, work as the cluster head node of different clusters in the region. The vertex set , represents the set of nodes of the kth cluster of the mth region as follows:where, the node is a node of the kth cluster and there should be at least one cluster in the mth region. However, if the node is a cluster head node, then:where, is the cluster head of the kth cluster.
- (vi)
- The cluster head node of the kth cluster is the destination node for all the cluster members and the members are considered as the source nodes within the cluster. The set of source nodes is given by:
- (vii)
- The cluster members and the head form a spanning tree like structure where the CH is a root and members are leaf nodes.
- (viii)
- If the mth region has total clusters than it can be represented as:where Gk represents the kth cluster. The energy consumed in transmission of k bits between ith node and the cluster head of the kth cluster is given by using the Equation (7) as follows:
- (ix)
- As there is direct communication between CH and its member nodes, the energy consumed by a single cluster member node in the cluster is given by:If there are c member nodes in the kth cluster, the total energy consumed in the cluster is given by using the Equations (2), (3), (7) and (17) as follows:where, ) is the energy consumed in transmission from the CH of the kth cluster to the gateway node of mth region.
- (x)
- The total energy consumed by all the clusters in the mth region is given by:
- (xi)
- The total energy consumption of the area depends upon the energy consumption in cluster regions, sink region, and the gateway regions. The nodes in the gateway region (GR) and sink region (SR) consume energy only in the transmission of their packets. The energy consumed by a node in the gth gateway region is given by:where, and GWg are the ith normal node and gateway node of the of the gth gateway region, respectively. The total energy consumed by all the normal nodes in the gateway region is given by:
If there are ns (normal sensor) nodes nodes in the sink region, then the energy consumed in transmission by a normal sensor nodes to the sink region is given by:
where is the ith normal sensor node within the SR and the sink node is the destination sink. The total energy consumption of all the normal sensor nodes in SR is given by:
The total energy consumed in the network area is as follows:
The energy consumption in GR and SR is much less, as there is much less transmission power consumption because of a very short distance and there is no power consumption in receiving any data. We can consider E(GR) and E(SR) ≈ Eelec. From Equation (24), it is concluded that energy consumption in the network can be reduced by reducing the power consumption of the nodes in the cluster regions. As the transmission is the main reason of power consumption, and we have reduced the transmission distance by installing a gateway between the cluster heads and the sink. Therefore, the proposed method can alleviate the energy holes problem and improve the lifetime of the network.
9. Simulation and Results Analysis
In order to measure the performance of the proposed protocol, we have designed many scenarios with an optimal number of gateways. We have run simulations approximately 25 times and take the 95% confidence interval of values to validate the efficiency of the MGBEHA. Large area sizes have been taken to test the scalability of the protocol. The performance of the protocol is measured in terms of throughput, network lifetime, stability period, residual energy, and the number of packets transmitted to the sink. Parameters and their values used in the simulation have been shown in Table 1. In order to prove the efficiency of the protocol, the LEACH [4], the MGEAR [5] and the GSEP [6] protocols are used for comparison.

Table 1.
Network simulation setup parameters.
An area can be divided into multiple equal cluster regions and gateways can be deployed as shown in Table 2. According to the Table 2, when the size of an area increases, the size of Areas 1 and 2 also increases. However, if the number of gateways increases in the area, the size of Areas 1 and 2 decreases. Through extensive simulations, we have concluded the appropriate domain values for different area sizes, as shown in Table 3.

Table 2.
Area division parameters.

Table 3.
Appropriate domain solution parameters.
In the proposed algorithm, if the initial value of the area is 100 × 100 m2, the initial value of Area 1 = Area 2 is 20 × 20 m2 and the initial value of R is 4, take the midpoint of the x-axis and y-axis and divide the area into R regions by joining the midpoints. Deploy one gateway node at the midpoint of the line which separates two regions. Set Area 1 around the sink and Area 2 around the gateway nodes by using coordinates points (x ± 10, y ± 10) of the sink and gateways, respectively. However, if the initial value of the R is 8, take the midpoint of the x-axis and y-axis and divide the area into four regions by joining the mid points. Next, take the min and max coordinates of the x-axis and y-axis and intersect the area into R regions through the diagonals.
In the proposed algorithm, if the initial value of the area is 500 × 500 m2, the initial value of Area 1 = Area 2 is 100 × 100 m2 and the initial value of R is 4 or R is 8, the area is divided in a similar manner as for Area = 100 × 100 m2. However, if the Area 1 = Area 2 is 75 × 75 m2 and number of regions R is 12, take the min and max values of the x-axis coordinates and divide the area into four equal parts and using the min and max values of the y-axis coordinates again divided the area into 12 regions. Set the Area 1 around the sink and Area 2 around the gateway nodes by using coordinates points (x ± (Area 1 = Area 2)/2, y ± (Area 1 = Area 2)/2) of the sink and gateways, respectively.
Similarly, if the area is 1000 × 1000 m2 and R = 20, divide the area into R regions by using the min and max values of the x-axis and y-axis coordinates. If the area is 2000 × 2000 m2 and R = 42, divide the area into R regions by using the min and max values of the x-axis and y-axis coordinates. In general, as the size of the area and number of regions (R) increase, divided the area into equal sized regions by using the min and max values of the x-axis and y-axis coordinates, respectively.
At each round, every normal sensor node sends data to its respective cluster head. The cluster heads perform data aggregation and send data to the gateway node which, again, aggregates data received from CHs and nodes in the gateway region (GR). After completing the data aggregation process, the gateway node transmits the data to the sink. The data aggregation is performed twice, which reduces the energy consumption to a great extent. Moreover, if some CH is nearer to the sink than a gateway node, it transmits data directly to the sink instead of the gateway node. This reduces the delay and increases the throughput in the network. Therefore, total data packets received by the sink from all gateway nodes and from nearby CHs are known as the throughput of the WSN.
The stability period of the network is defined by the round number when the first node in the network exhausts its energy and dies (FND). The network lifetime is defined by the round number when all nodes of the network die (AND). HND denotes the round number when 50% of the nodes in the network die. Packets transmitted to the sink are the total number of packets sent by all sensor nodes to CHs, from CHs to gateway nodes, and from the gateways to the sink. Residual energy is the total remaining energy in the network per round.
Figure 4a,b describe and compare all protocols’ throughput for 100 sensor nodes in 100 × 100 m2 area and 500 × 500 m2 areas, respectively. By using the optimal number of gateways at proper positions, network throughput can be increased and a larger area can be monitored very well. The MGBEHA protocol outperforms other protocols in small areas as well as large areas. It is capable of producing throughput for a large number of rounds. When the number of gateways increases from 6 to 8, there is no difference in the throughput of the area. Other than LEACH, all protocols are gateway-based protocols. The results show that a gateway between the sink and the sensor nodes reduces transmission distance and, hence, increases the performance of the system.
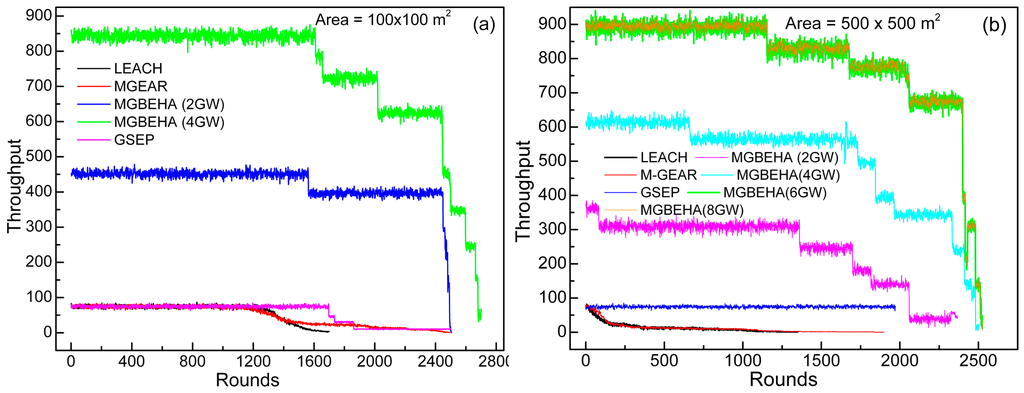
Figure 4.
Variation of throughput for different protocols in (a) 100 m × 100 m; and (b) 500 m × 500 m area.
In the LEACH protocol, data packets are directly transmitted from a CH to the sink. If the distance between the CH and the sink is large, after some time the CH node starts depleting its energy and cannot transmit more data. In a large area some CHs will be distant from the sink node and will exhaust their energy very soon. Cluster members will not be able to transmit their data to sink via the CH. Hence, there is a major decrease in throughput of the network for the LEACH protocol.
The M-GEAR protocol consists of a single gateway at the center of the area; it helps in efficient energy consumption, but it fails as the size of the area increases. The cluster heads, which are far away from the gateway node, consume large amounts of energy in transmission. Therefore, most of the nodes in the remote area die soon. Thus, these nodes are not able to sense any event and cannot transmit any data. A similar problem exists in the GSEP protocol.
It is evident from Figure 4a that the M-GEAR and the GSEP is able to produce throughput until round number 2400, but the amount of throughput is very low as compared to the MGBEHA protocol. GSEP is able to produce more throughput than the M-GEAR, because nodes near the gateway nodes have residual energy until the end of network operation. These nodes can directly communicate with gateway nodes and do not carry the extra load, but nodes which are far away have to use a CH for data transmission towards the gateway node. Furthermore, there is no need of so many gateways at such a small distance from one another. Gateways are not deployed at the required place in the area. All of the gateways are at the same height in an area. For one part of an area many gateways are available and for another part of the area no gateway is available. This kind of gateway placement just increases network cost and reduces its efficiency. The throughput of MGBEHA (2GW and 4 GW) remains stable for a large number of rounds and after that it drops gradually.
We performed an indepth analysis of the throughput improvement ratio per round for all protocols. The throughput improvement ratio is calculated for different scenarios. It is defined as follows:
where X * = {MGBEHA (2 GW/4 GW/6 GW/8 GW)/M-GEAR/GSEP/LEACH} and g is the number of gateways. Results of the throughput improvement ratio per round (TIRPR) are shown in Table 3 and Table 4.

Table 4.
Protocols performance of 100 nodes for 100 m × 100 m area.
- (a)
- CASE 1: Results analysis of 100 nodes in 100 × 100 m2 area (Table 3)
The MGBEHA protocol with 4 GW has 1.9 TIRPR over the MGBEHA with 2 GW because it has two additional gateways and the area is further divided into a greater number of regions. An additional support of two gateways reduces energy consumption and the nodes can work longer, can transmit packets for a longer time, and produce good throughput. The TIRPR of the MGBEHA protocol over LEACH is 26.7, as LEACH does not use the gateway node to reduce power consumption. The TIRPR of the MGBEHA over M-GEAR is the greatest as compared to other protocols because, for the M-GEAR protocol, the first node dies very soon in the network and connectivity of the network start declining. Although AND for M-GEAR are 2500 rounds, the value of throughput becomes low when connectivity of the region gets lost. Nodes are not able to forward other nodes’ data and most of the packets transmitted with nodes get lost. Only nodes near the gateway nodes remain alive and keep producing throughput up to the 2500th round.
In the case of the GSEP protocol FND at round 983, its stability period is more than M-GEAR and LEACH protocols and, hence, the network remains connected for 983 rounds and produces throughput, but after 50% nodes of the network die, throughput keeps on decreasing, although AND at round 2500, but very few nodes remain alive in the network after round 1300 as shown in Figure 5. Large numbers of rounds and lesser throughput in the last rounds reduce TIRPR of GSEP as compared to MGBEHA protocol.
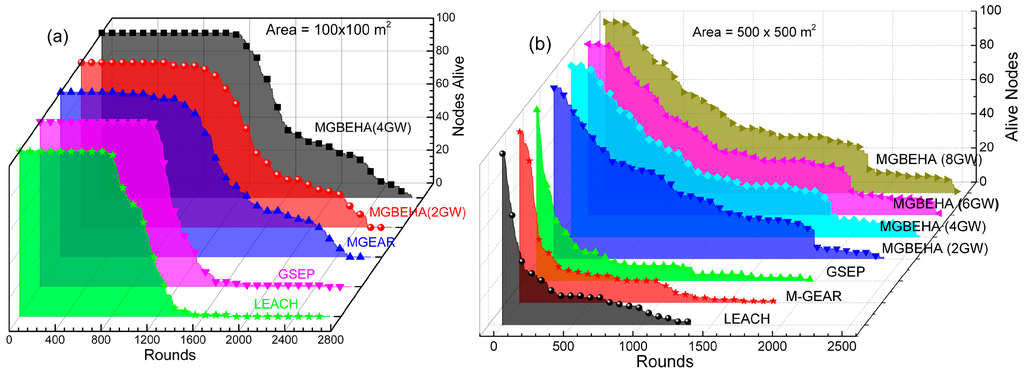
Figure 5.
Number of nodes alive per round for different protocols in (a) 100 m × 100 m; and (b) 500 m × 500 m area.
- (b)
- CASE 2: Results analysis of 100 nodes in 200 × 200 m2 area/300 ×300 m2 area/500 ×500 m2 area (Table 4)
As the size of the area increases, the first node dies very soon in all protocols. However, the value of AND drops slowly for MGBEHA protocol and rapidly for other protocols. In case of LEACH, for a small area (100 × 100 m2), value of AND is round 1800, but for large area (500 × 500 m2) it drops below round 1300. For the M-GEAR protocol value of AND drops up to 1838 and for the GSEP, it drops up to 1972. The TIRPR of the MGBEHA protocol increases as compared to other protocols for large areas. Optimal number and correct position of gateways also improves network lifetime as shown in Figure 5a and Table 4.
In a large area the MGBEHA protocol has a lifetime more than other protocols as shown in Table 5 and Figure 5b. By increasing the number of gateways in a large area, the stability period and the lifetime of the network improves, as shown in Table 5. When the number of gateways increased from 4 to 6 in the 500 × 500 m2 area, its stability period increased from 87 to 102 and its lifetime improved from 2490 to 2525, and the TIRP also improved from the previous value. However, when the number of gateways was further increased from 6 to 8, there was no improvement in the performance metrics, which implies that there are an appropriate number of gateways for each area size, after which there is no improvement in the network lifetime.

Table 5.
Protocol performance of 100 nodes for different area sizes.
The M-GEAR protocol has a single gateway in the center of the area; if the area increases, the distance between CH and the gateway node also increases, so it is not capable of handling distant node communication. Moreover, if there is any CH near the sink area, it does not consider the distance between itself and the sink, CH will always transmit to the gateway node. This results in doubling the communication power consumption. As a result, residual energy in the network will be very low, as shown in Figure 6a,b. More energy can be saved if the distance between CH and the sink node is also considered.
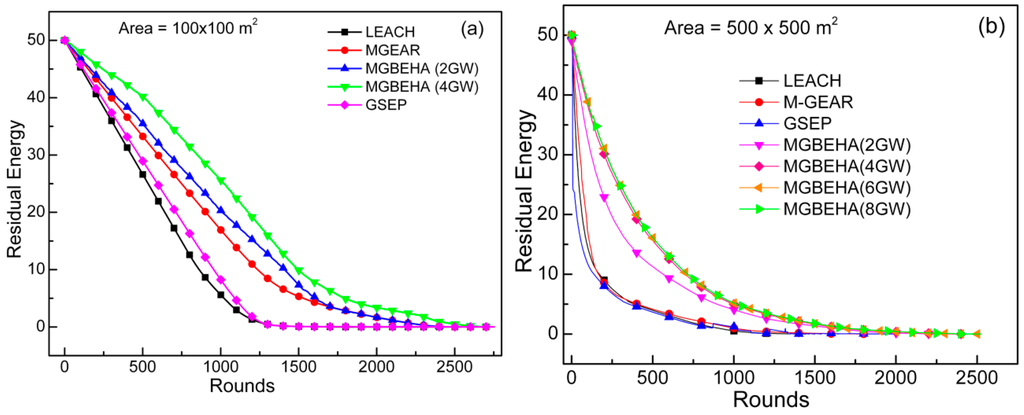
Figure 6.
Residual energy per round for different protocols in (a) 100 m × 100 m; and (b) 500 m × 500 m area.
In the GSEP protocol, before initiating the transmission, a node always computes the distance between itself and all gateways and then chooses the gateway with the minimum distance. This method increases the lifetime in a small area, but in a large area most of the nodes have a large distance from all gateways. Although the total number of gateways in the GSEP protocol is much higher than the MGBEHA protocol, but the residual energy (shown in Figure 6a,b) of GSEP is much lower than the MGBEHA because all of the gateways are at the edge of the network. Nodes which are distant will deplete their energy faster. The number of live nodes becomes less in the network and they have to find alternative paths for data transmission. Further, in each round a node has to compute the distance between itself and all gateways, increasing the computation overhead. In our experiment, we have tested the GSEP protocol in a homogeneous (all nodes with equal initial energy) environment.
In case of the MGBEHA protocol, gateways are not concentrated in an area; a separate gateway node is present to cover a part of the area, so the distance between CH and gateway nodes is always less, as a result less energy is consumed in communication and sufficient live nodes are present in the network. The number of live nodes in the network affects the number of packets transmitted to the sink. With more live nodes present in the network, more packets will be transmitted to the sink. The MGBEHA protocol has a higher number of live nodes for a higher number of rounds; therefore, the number of packets transmitted to the sink by the MGBEHA protocol is greater than other protocols, as shown in Figure 7a,b. However, there is a very small difference in the number of packets transmitted to the sink for 4 GW, 6 GW, and 8 GW in 500 × 500 m2 area.
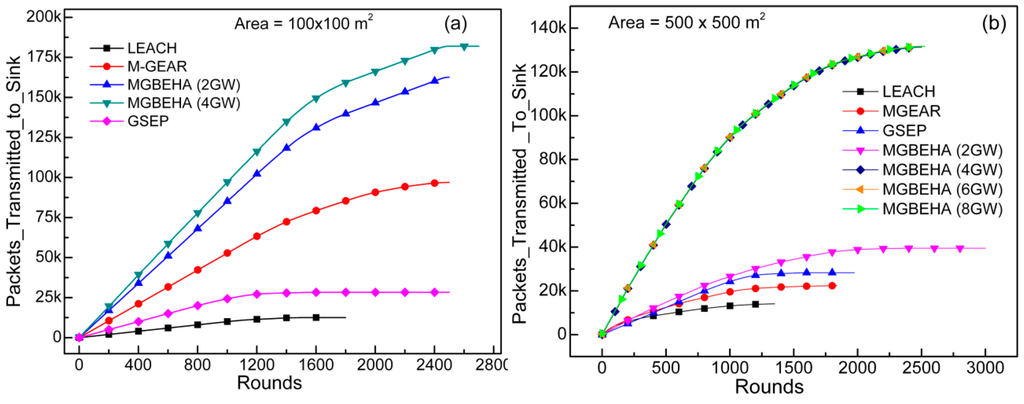
Figure 7.
Total packets sent towards the sink in different protocols for (a) 100 m × 100 m; and (b) 500 m × 500 m area.
A variation in simulation results is represented by the 95% confidence interval and is shown in Figure 8a. In LEACH, energy holes can be created around the sink if large size clusters are formed near the sink. The energy of cluster members and CH will deplete with prolonged communication. Holes can also be created in remote areas if CHs are formed there, as CHs in remote area need more power to transmit data. The MGBEHA protocol avoids the energy holes problem as follows: holes cannot be created in the sink area, as nodes near the sink node do not transmit other node’s data and these are not involved in cluster setup phase, which further saves their energy. Similarly, holes cannot be created in a gateway region, as nodes here transmit only their data to the gateway and do not act as a relay node. Instead a gateway node acts as a relay node for CHs and reduces power depletion of the CHs.
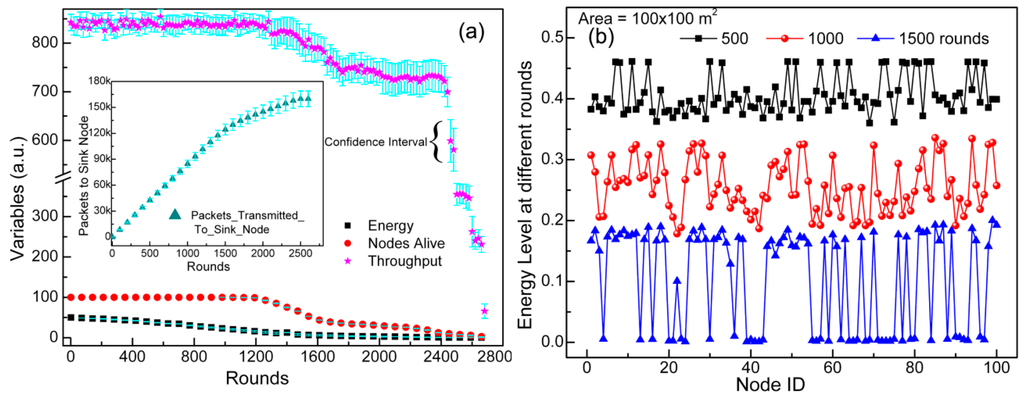
Figure 8.
(a) 95% confidence interval of each point for all metrics of the MGBEHA protocol; and (b)energy map of the whole topology at different rounds for the MGBEHA protocol.
This well-adjusted energy consumption maintains an energy level in the network per round as shown in Figure 8b. All nodes exhaust their energy in a uniform way. Figure 8b shows an energy map of whole topology at different rounds. The initial energy of all nodes is 0.5 J. After 500 rounds, the energy of all nodes lies between 0.46 J and 0.38 J, after 1000 rounds, the energy lies between 0.33 and 0.18 J. This concludes that none of the nodes die in the network, up to 1000 rounds. The network remains stable until the first node dies and energy holes are not created until the 1083 round.
In order to test the efficiency of the protocol in very large areas, we have designed two scenarios, one with a 1000 × 1000 m2 area and another with a 2000 × 2000 m2 area. We have also analyzed the performance metrics for different node densities (λ = Number of nodes/area) in the area. Figure 9a shows the number of alive nodes in a 1000 m × 1000 m area. The maximum lifetime and the stability period of the network are approximately 1700 rounds and 10 rounds, respectively. A high node density does not affect the performance of the network. Figure 9b illustrates the effect of different node densities on the MGBEHA protocol in the 2000 × 2000 m2 area. The maximum lifetime in this area is 600 rounds. Node density does not have a significant impact on the lifetime of the network. Although the number of gateways has been increased in the network, the lifetime is reduced with an increase in the size of the area.
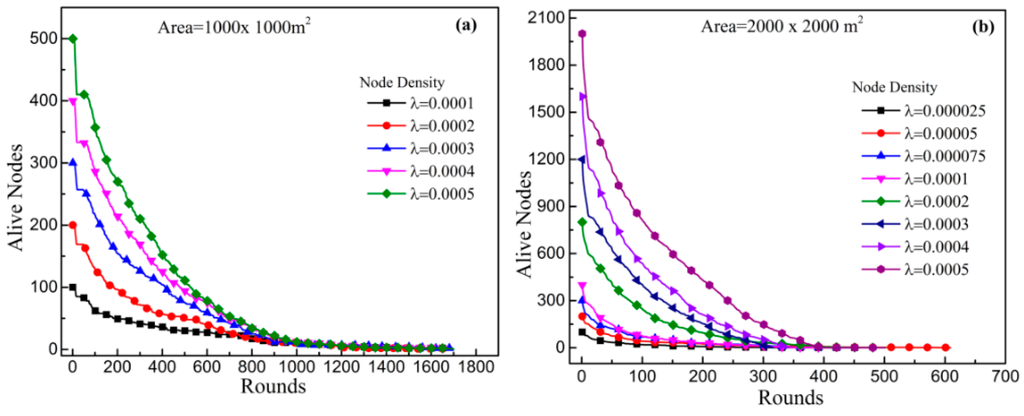
Figure 9.
Number of nodes alive per round for MGBEHA protocol for different densities in (a) 1000 m × 1000 m; and (b) 2000 m × 2000 m area.
Figure 10a,b illustrates the residual energy of the network in a 1000 × 1000 m2 area and in a 2000 × 2000 m2 area, respectively. In a large area, energy is available in the network, but the lifetime of the network is reached very early.
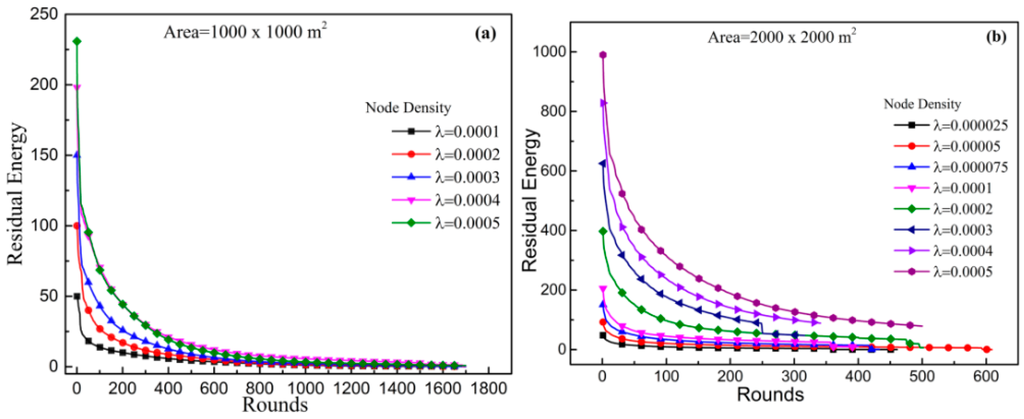
Figure 10.
Residual energy per round of MGBEHA protocol for different node density in (a) 1000 m × 1000 m; and (b) 2000 m × 2000 m area.
Figure 11a,b illustrates the total throughput of the network in a 1000 × 1000 m2 area and in a 2000 × 2000 m2 area, respectively. For a high node density, throughput of the network is very high, but it falls sharply in later rounds. Total throughput in a large area is much less than the throughput of the MGBEHA protocol in small areas.
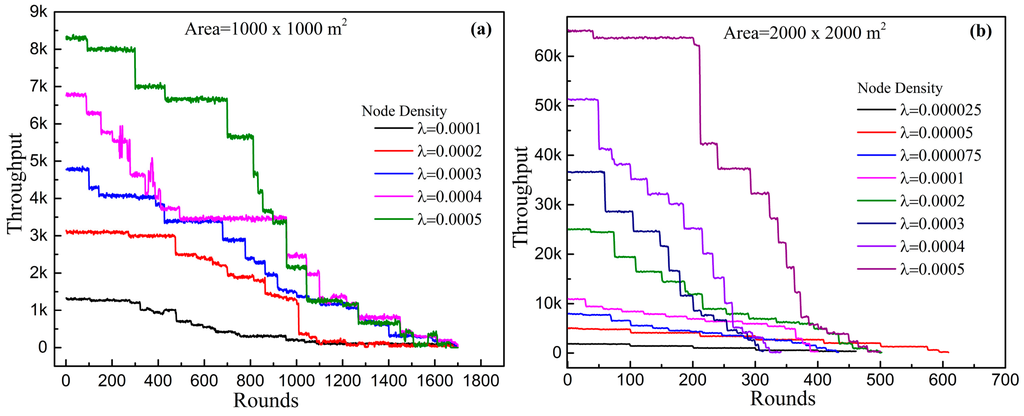
Figure 11.
Variation of throughput for different node density in (a) 1000 m × 1000 m; and (b) 2000 m × 2000 m area.
Figure 12a,b illustrate the total number of packets transmitted towards the sink in 1000 × 1000 m2 area and in 2000 × 2000 m2 area, respectively. The number of packets transmitted for high density is much more than the number of packets for the low density. However, transmission of packets halts after the 17,000 rounds in 1000 m2 area, and after approximately 500 rounds in the 2000 m2 area.
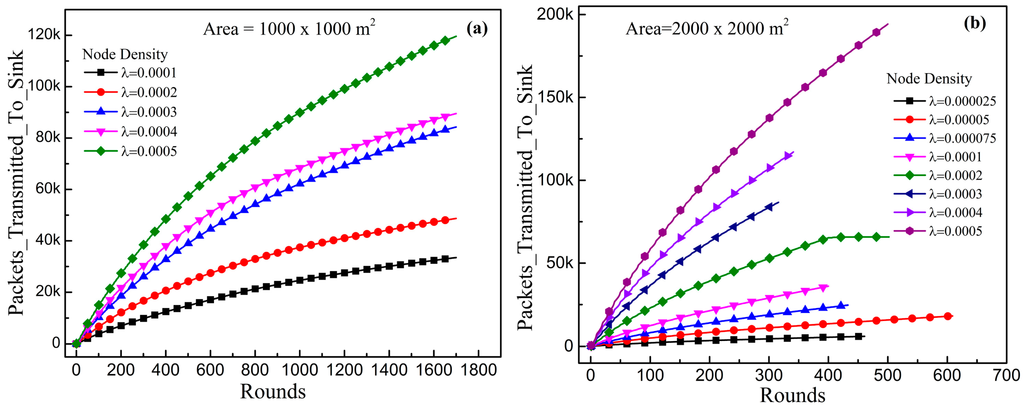
Figure 12.
Total packets sent towards the sink in (a) 1000 m × 1000 m; and (b) 2000 m × 2000 m area.
Figure 13a,b give the validation of simulation results against the theoretical analysis of energy consumption of the network for the MGBEHA protocol. According to the figure, our simulation results are very close to the theoretical results. It proves that average energy consumption of the network in the presence of different number of gateways. The number of alive nodes is directly related to the available energy in the network. The total number of packets transmitted to the sink and received throughput of the network depends on the number of alive nodes in the network.
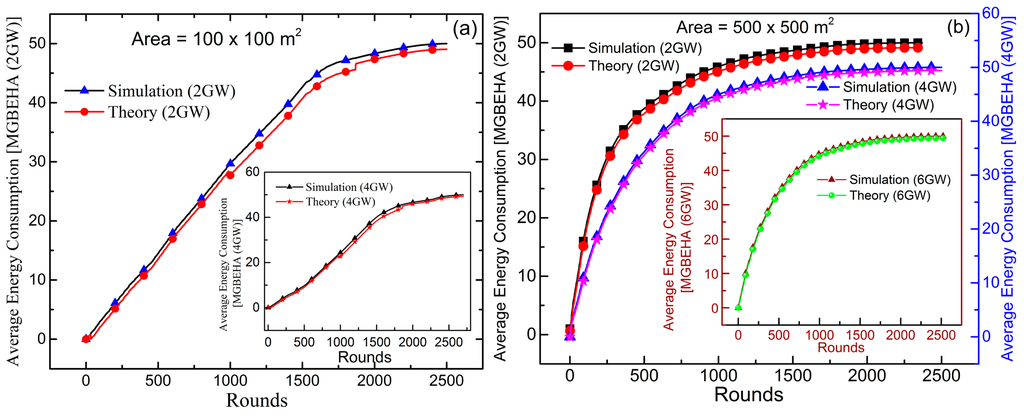
Figure 13.
Average energy consumption in (a) 100 m2 area with 2 GW and 4 GW and (b) in 500 m2 with 2 GW, 4 GW, and 6 GW.
10. Future Work
A deterministic algorithm for mathematical computation of the number of regions in an area will be provided in the future work.
11. Conclusions
In order to avoid energy holes and improve energy efficiency of a sensor network, we have proposed an energy-balanced MGBEHA protocol. The division of the area into regions and use of gateway nodes at optimal positions have a considerable effect on the lifetime of the network. Nodes are able to transmit their packets over long distance. Distance-based selection of destination (gateway or sink) by a cluster head saves transmission energy and it increases network performance as compared to other protocols (LEACH, M-GEAR, and GSEP). Energy consumption is decreased by reducing the transmission distance between the transmitter and receiver. Energy holes are avoided near the sink, by reducing the communication load of the nodes in the sink region. Energy holes are also avoided in remote areas by using gateway nodes in between CH and the sink node. Cluster heads are formed in all parts of an area, so member nodes do not choose a remote cluster head. This saves energy of cluster member nodes. This protocol has a better stability period, lifetime, and throughput as compared to other protocols. It has good TIRPR over other protocols in different area sizes. It has uniform energy consumption and, therefore, it has much residual energy available for a large number of rounds. MGBEHA can cover a large area without lowering the performance of the network. Simulation results are very close to the theoretical results.
Acknowledgments
Rohini Sharma is thankful to the Council of Scientific and Industrial Research, Human Resource Development Group, India for providing necessary fellowship.
Author Contributions
Rohini sharma has developed the model and wrote the manuscript under the guidance of Daya krishan Lobiya.
Conflicts of Interest
The authors declare no conflict of interest.
Abbreviations
The following abbreviations are used in this manuscript:
| MGBEHA | Multi-Gateway Based Energy Holes Avoidance Routing Protocol |
| WSN | Wireless Sensor Network |
| GSEP | Gateway Based Stable Election Multi Hop Routing Protocol |
| M-GEAR | Gateway-Based Energy-Aware Multi-Hop Routing Protocol |
| LEACH | Low Energy Adaptive Clustering Hierarchy Routing Protocol |
| CHs | Cluster Heads |
| ACO | Ant Colony Optimization |
| RSSI | Received Signal Strength Indicator |
References
- Akyildiz, I.F.; Su, W.; Sankarasubramaniam, Y.; Cayirci, E. A survey on sensor networks. IEEE Commun. Mag. 2002, 40, 102–114. [Google Scholar] [CrossRef]
- Shen, C.-C.; Srisathapornphat, C.; Jaikaeo, C. Sensor information networking architecture and applications. IEEE Personal Commun. 2001, 8, 52–59. [Google Scholar] [CrossRef]
- Sharma, R. Energy holes avoiding techniques in sensor networks: A survey. Int. J. Eng. Trends Technol. 2015, 20, 204–208. [Google Scholar] [CrossRef]
- Sharma, R.; Lobiyal, D.K. In Proficiency analysis of AODV, DSR and TORA ad-hoc routing protocols for energy holes problem in wireless sensor networks. Proced. Comput. Sci. 2015, 57, 1057–1066. [Google Scholar] [CrossRef]
- Olariu, S.; Stojmenovic, I. Design guidelines for maximizing lifetime and avoiding energy holes in sensor networks with uniform distribution and uniform reporting. In Proceedings of the 25th IEEE International Conference on Computer Communications, IEEE INFOCOM 2006, Barcelona, Spain, 23–29 April 2006; pp. 1–12.
- Wu, X.; Chen, G.; Das, S.K. Avoiding energy holes in wireless sensor networks with nonuniform node distribution. IEEE Trans. Parallel Distrib. Syst. 2008, 19, 710–720. [Google Scholar]
- Heinzelman, W.R.; Chandrakasan, A.; Balakrishnan, H. Energy-efficient communication protocol for wireless microsensor networks. In Proceedings of the 33rd Annual Hawaii International Conference on System Sciences, Maui, HI, USA, 4–7 January 2000; Volume 12, p. 10.
- Sinha, A.; Lobiyal, D.K. Performance evaluation of data aggregation for cluster-based wireless sensor network. Hum. Centric Comput. Inform. Sci. 2013, 3, 1–17. [Google Scholar] [CrossRef]
- Subir, H.; Amrita, G.; Sanjib, S.; Avishek, D.; Sipra, D. A Lifetime Enhancing Node Deployment Strategy in WSN. In Future Generation Information Technology; Springer-Verlag: Berlin Heidelberg, Germany, 2009; pp. 295–307. [Google Scholar]
- Gupta, S.K.; Jana, P.K. Energy efficient clustering and routing algorithms for wireless sensor networks: GA based approach. Wirel. Pers. Commun. 2015, 83, 2403–2423. [Google Scholar] [CrossRef]
- Nadeem, Q.; Rasheed, M.; Javaid, N.; Khan, Z.A.; Maqsood, Y.; Din, A. M-GEAR: Gateway-based energy-aware multi-hop routing protocol for WSNs. In Proceedings of the 2013 Eighth International Conference on Broadband and Wireless Computing, Communication and Applications (BWCCA), Compiegne, France, 28–30 October 2013; pp. 164–169.
- Jain, P.; Kaur, H. Gateway based stable election multi hop routing protocol for wireless sensor networks. Int. J. Mobile Netw. Commun. Telemat. 2014, 4, 19–33. [Google Scholar] [CrossRef] [Green Version]
- Han, G.; Guo, H.; Zhang, C.; Shu, L. Parameter optimisation in duty-cycled wireless sensor networks under expected network lifetime. Int. J. Ad Hoc Ubiq. Comput. 2014, 15, 57–67. [Google Scholar] [CrossRef]
- Wu, Y.; Liu, P.; Qiu, J.; Dai, G. Enable sustainable sensor networks with non-contact charging: Efficient deployment of energy hubs. Int. J. Sens. Netw. 2015, 18, 172–181. [Google Scholar] [CrossRef]
- Dhivya, M.; Sundarambal, M. Hybrid AODV protocol for energy efficient routing in wireless sensor networks. Int. J. Mobile Netw. Des. Innovat. 2012, 4, 59–64. [Google Scholar] [CrossRef]
- Sharma, R.; Lobiyal, D.K. Energy based proficiency analysis of ad-hoc routing protocols in wireless sensor networks. In Proceedings of the International Conference on Advances in Computer Engineering and Applications (ICACEA), Ghaziabad, India, 19–20 March 2015; pp. 882–886.
- Gong, D.; Yang, Y.; Pan, Z. Energy-efficient clustering in lossy wireless sensor networks. J. Parallel Distrib. Comput. 2013, 73, 1323–1336. [Google Scholar] [CrossRef]
- Watfa, M.K.; Al-Hassanieh, H.; Salmen, S. A novel solution to the energy hole problem in sensor networks. J. Netw. Comput. Appl. 2013, 36, 949–958. [Google Scholar] [CrossRef]
- Liu, A.; Jin, X.; Cui, G.; Chen, Z. Deployment guidelines for achieving maximum lifetime and avoiding energy holes in sensor network. Inform. Sci. 2013, 230, 197–226. [Google Scholar] [CrossRef]
- Jia, J.; Chen, J.; Wang, X.; Zhao, L. Energy-balanced density control to avoid energy hole for wireless sensor networks. Int. J. Distrib. Sens. Netw. 2012, 2012, 812013. [Google Scholar] [CrossRef]
- Ma, G.; Tao, Z. A nonuniform sensor distribution strategy for avoiding energy holes in wireless sensor networks. Int. J. Distrib. Sens. Netw. 2013, 2013, 564386. [Google Scholar] [CrossRef]
- Soro, S.; Heinzelman, W.B. Prolonging the lifetime of wireless sensor networks via unequal clustering. In Proceedings of the 19th IEEE International Parallel and Distributed Processing Symposium, Denver, CA, USA, 4–8 April 2005; p. 8.
- Liu, A.-F.; Zhang, P.-H.; Chen, Z.-G. Theoretical analysis of the lifetime and energy hole in cluster based wireless sensor networks. J. Parallel Distrib. Comput. 2011, 71, 1327–1355. [Google Scholar] [CrossRef]
- Bencan, G.; Tingyao, J.; Shouzhi, X.; Peng, C. An energy-heterogeneous clustering scheme to avoid energy holes in wireless sensor networks. Int. J. Distrib. Sens. Netw. 2013, 2013, 796549. [Google Scholar] [CrossRef]
- Singh, B.; Lobiyal, D. An energy-efficient adaptive clustering algorithm with load balancing for wireless sensor network. Int. J. Sens. Netw. 2012, 12, 37–52. [Google Scholar] [CrossRef]
- Sharma, R.; Lobiyal, D.K. Region based energy balanced inter-cluster communication protocol for sensor networks. In Proceedings of the National Conference on Computing, Communication and Information Processing (NCCCIP-2015), Nirjuli, India, 2–3 May 2015; pp. 185–195.
- Kuila, P.; Jana, P.K. Approximation schemes for load balanced clustering in wireless sensor networks. J. Supercomput. 2014, 68, 87–105. [Google Scholar] [CrossRef]
- Kuila, P.; Jana, P.K. Improved load balanced clustering algorithm for wireless sensor networks. In Advanced Computing, Networking and Security; Springer: Verlag Berlin Heidelberg, Germany, 2011; pp. 399–404. [Google Scholar]
- Kimençe, Ş.; Bekmezci, I. Weighted relay node placement for wireless sensor network connectivity. Wirel. Netw. 2014, 20, 553–562. [Google Scholar] [CrossRef]
- Azharuddin, M.; Jana, P.K. A distributed algorithm for energy efficient and fault tolerant routing in wireless sensor networks. Wirel. Netw. 2015, 21, 251–267. [Google Scholar] [CrossRef]
- Kuila, P.; Gupta, S.K.; Jana, P.K. A novel evolutionary approach for load balanced clustering problem for wireless sensor networks. Swarm Evol. Comput. 2013, 12, 48–56. [Google Scholar] [CrossRef]
- Kannan, G.; Raja, T.S.R. Energy efficient distributed cluster head scheduling scheme for two tiered wireless sensor network. Egypt. Inform. J. 2015, 16, 167–174. [Google Scholar] [CrossRef]
- Taruna, S.; Kumawat, R.; Purohit, G. Multi-hop clustering protocol using gateway nodes in wireless sensor network. Int. J. Wirel. Mobile Netw. 2012, 4, 169–180. [Google Scholar] [CrossRef]
- Koteswararao, S.; Sailaja, M.; Madhu, T. Implementation of multi-hop cluster based routing protocol for wireless sensor networks. Int. J. Comput. Appl. 2012, 59, 1–5. [Google Scholar] [CrossRef]
- Sheenam; Rupinder, K. Gateway Based Multi-Hop Distributed Energy Efficient Clustering Protocol for Heterogeneous Wireless Sensor Networks. Int. J. UbiComp. 2015, 6. [Google Scholar] [CrossRef]
- Ibrahim, S.; Liu, J.; Al-Bzoor, M.; Cui, J.-H.; Ammar, R. Towards efficient dynamic surface gateway deployment for underwater network. Ad Hoc Netw. 2013, 11, 2301–2312. [Google Scholar] [CrossRef]
© 2016 by the authors; licensee MDPI, Basel, Switzerland. This article is an open access article distributed under the terms and conditions of the Creative Commons Attribution license ( http://creativecommons.org/licenses/by/4.0/).