Article

CHaRT: An Autoregressive Transformer for Joint Forecasting of Clinical Events and Continuous Values


by
Michael Walz
1,* and
Thomas F. Byrd IV
2,3,4
1
University of Minnesota Medical School, Twin Cities Campus, 420 Delaware Street SE, Minneapolis, MN 55455, USA
2
Division of Hospital Medicine, Department of Medicine, University of Minnesota Medical School, Mayo Mail Code 741, 420 Delaware Street SE, Minneapolis, MN 55455, USA
3
Center for Learning Health System Sciences, University of Minnesota, Mayo Mail Code 293, Mayo Memorial Building, 420 Delaware Street SE, Minneapolis, MN 55455, USA
4
Institute for Health Informatics, University of Minnesota, 8-100 Phillips-Wangensteen Building, 516 Delaware Street SE, Minneapolis, MN 55455, USA
*
Author to whom correspondence should be addressed.
Informatics 2026, 13(7), 99; https://doi.org/10.3390/informatics13070099
Submission received: 1 May 2026 / Revised: 12 June 2026 / Accepted: 18 June 2026 / Published: 23 June 2026
(This article belongs to the Special Issue From Data to Evidence: Transformative AI for Real-World Data)

Abstract

Modern inpatient care generates irregular streams of heterogeneous clinical events, yet most predictive models require fixed feature matrices, predefined time windows, or discretization of continuous measurements. We developed CHaRT, a decoder-only autoregressive transformer designed to jointly forecast the identity of the next clinical event and, when applicable, its associated continuous value. CHaRT was trained and internally validated on structured electronic health record data from adult acute-care encounters across a 12-hospital health system in Minnesota from 2001 to 2025. The final corpus included 4,447,625 encounters from 1,301,502 patients and 701,556,877 non-padding clinical event tokens spanning vital signs, laboratory values, medications, diagnoses, microbiology, virology, imaging, fluids, and outcomes (ICU transfer or death). Encounters were split into training, validation, and test sets before vocabulary construction, normalization, and windowing. On the held-out test set, CHaRT achieved Top-1, Top-5, and Top-10 next-event accuracies of 51.61%, 87.34%, and 93.22%, respectively, with perplexity 4.50 and expected calibration error 0.0109. For numeric prediction, z-score MSE was 0.3812 for vital signs and 0.5713 for laboratory values. Seeded examples generated clinically coherent trajectories. Using model representations, a linear probe predicted deterioration (ICU transfer or in-hospital death) at a 6 h landmark with AUROC 0.95–0.97, indicating that learned representations transfer to downstream clinical risk prediction.

1. Introduction

Modern hospital admissions generate a dense, heterogeneous, and irregularly sampled stream of clinical data spanning diagnoses, medications, laboratory measurements, vital signs, microbiology, imaging, procedures, and disposition events. Converting this evolving event stream into clinically useful predictions remains difficult. Traditional tabular or regularly sampled time-series approaches offer a simpler data structure, but recent reviews argue that event-stream representations more faithfully preserve the temporal sparsity, modality shifts, and mixed discrete-continuous character of real clinical care [1,2].
Machine-learning approaches improved on score-based systems by incorporating larger feature spaces and a more flexible nonlinear structure. Gradient-boosted models and similar engineered-feature approaches have achieved strong discrimination for specific clinical outcomes, including 24 h deterioration prediction, but they still depend on manually curated representations and fixed prediction targets [3]. Recurrent neural networks moved the field toward sequence-aware prediction. They showed that temporal EHR data could support forecasting of future diagnoses, mortality, and acute kidney injury without extensive manual feature engineering [4,5,6]. However, recurrent architectures remain constrained by sequential processing, compressed hidden-state representations, and limited efficiency in handling very long contexts, all of which are problematic when modeling the prolonged, irregular trajectories typical of hospitalized patients [7,8].
Transformer architectures addressed several of these limitations by using self-attention to model long-range dependencies and parallelize sequence processing [9]. In clinical informatics, early transformer applications largely adopted encoder-style pretraining or masked-language objectives to learn patient representations for downstream classification tasks. Models such as BEHRT, Med-BERT, and CEHR-BERT showed that structured EHR pretraining could improve disease and risk prediction [10,11,12]. Subsequent work broadened this paradigm to generative and decoder-based modeling of longitudinal patient trajectories. Recent autoregressive and generative transformer studies have shown that clinical event streams can support realistic timeline generation, zero-shot forecasting, next-event prediction, and multi-task foundation-model behavior [13,14,15,16,17,18].
Despite this progress, an important representational gap remains. The inpatient record is not composed solely of discrete events. Many crucial clinical observations are numeric and event-conditioned: a blood pressure measurement is not only the occurrence of a vital-sign event, but also the realized systolic and diastolic values; a laboratory event is defined not only by the test ordered or resulted, but by the magnitude and direction of the measured value. For example, a systolic blood-pressure of 85 mmHg signals hypotension, whereas 130 mmHg is unremarkable; a serum lactate of 1.0 mmol/L signals clinical stability, whereas 6.0 mmol/L suggests septic shock.
While large-scale clinical foundation models trained on health-system records have demonstrated the feasibility of autoregressive event modeling at scale, their developers have largely emphasized discrete medical events, next-visit content, or downstream task transfer rather than direct next-event value prediction in inpatient data streams [16,17,19]. These types of transformer models still operate primarily over discrete vocabularies, reducing continuous measurements to bins, quantiles, digits, or other tokenized surrogates, or else excluding them from the core autoregressive objective [15,17,18]. This design choice simplifies training but discards within-bin precision and weakens the connection between event identity and physiologic magnitude.
Here, we describe the development and internal validation of CHaRT (Clinical Heterogeneous auto-Regressive Transformer), a decoder-only transformer designed to jointly model the heterogeneous event stream of inpatient care while preserving numeric precision. CHaRT, motivated by the multivariateGPT framework, extends the autoregressive next-event framework by predicting both the identity of the next clinical event and, when applicable, its associated continuous value, without discretizing the value into bins or auxiliary tokens [20]. CHaRT therefore expands the autoregressive objective from predicting the next-event type alone to predicting the paired event type and its continuous value. The model receives paired token and value inputs, projects numeric magnitude directly into the latent space, and uses a dual-head output for event classification and Gaussian value regression. We show that CHaRT, trained on roughly 700 million non-padding tokens drawn from 4.4 million clinical sequences spanning more than two decades of inpatient and emergency admissions at a large academic health system, achieves accurate and well-calibrated next-event prediction while preserving the numeric precision of vital signs and laboratory values. Seeded with only a brief clinical context, CHaRT generates coherent event sequences with clinically plausible values. We further show that the model’s learned representations are clinically transferable. Without any task-specific modification of the autoregressive model, a linear probe applied to CHaRT’s frozen hidden states discriminates impending clinical deterioration (ICU transfer or death) while significantly outperforming gradient-boosted and logistic-regression baselines.

2. Materials and Methods

2.1. Study Setting

This research was conducted using clinical data from a large U.S. academic health system comprising 12 hospitals across the state of Minnesota, serving a mix of academic and community settings and spanning a statewide catchment area. The study was conducted in accordance with the Declaration of Helsinki, and the protocol was approved by the University of Minnesota Institutional Review Board (STUDY00017419) on 2 December 2022. A waiver of informed consent was granted because the research involved no more than minimal risk to participants, did not adversely affect their rights or welfare, and could not practically be conducted without the waiver and the use of identifiable information.

2.2. Data Source and Extraction

Eligible records were structured electronic health record events from adult acute-care encounters from 2001 to 2025. Acute-care eligibility was defined as an emergency department encounter, an inpatient hospitalization, a surgical admission, or an observation encounter. Encounters were sorted via encounter metadata to ensure only acute-care encounters were included. Administrative encounters were excluded. Inpatient hospice was also excluded. We extracted vital signs, laboratory results, blood products, medication orders, microbiology cultures, virology results, imaging orders, intravenous fluid administration, chief complaints, diagnosis, and clinical outcomes (in-hospital mortality or ICU transfer). All available events within these domains were included without predictor pre-selection, allowing the training corpus to reflect routine care as captured in the health system EHR.

2.3. Outcome Definition

CHaRT’s primary prediction target is the next clinical event in the sequence, both its identity (classification) and, for numeric events, the associated continuous value. The model learns the conditional probability distribution over all possible next events given preceding context, rather than predicting a single endpoint at a fixed time horizon.

2.4. Data Preprocessing

The full data preprocessing pipeline is shown in Figure 1. Each data source was cleaned and standardized into a uniform schema of (patient_encounter_id, timestamp, event_type, event_subtype, value). Preprocessing was applied uniformly without stratification by demographic group. For numeric sources, values were cast to double-precision floating point. Categorical, binary, and ordinal events were represented by token identity plus a scalar value (usually 1.0 or 0.0). Medication rows with null order timestamps were excluded, as were medication statuses of Discontinued, Canceled, and Suspended.
Outcomes of ICU transfer and in-hospital mortality were represented as binary event tokens with value = 1.0. Virology, microbiology, and imaging events were tokenized using source-specific mappings for result category, organism/specimen information, and anatomic/imaging context. Token frequency filtering was not performed globally before splitting; rather, rare-token handling was controlled by the training-derived vocabulary minimum count (min = 1) threshold for the final run. Unmapped vocabulary in validation and test tokens was mapped to the unknown token. Records without usable identifiers, timestamps, token labels, or values were excluded during cleaning or shard construction. No imputation was performed because the model requires precise temporal ordering and token-value pairs.

2.5. Tokenization and Normalization

Cleaned events were combined into a unified stream sorted by encounter and timestamp. A vocabulary of 4289 unique tokens was constructed and mapped to a unique integer. The vocabulary included 142 numeric tokens with per-token z-score normalization and 4147 categorical tokens. Each event was represented as (time, event_type, event_subtype, value). Per-token z-score normalization parameters were computed exclusively from the training set. Categorical tokens retained mapped numeric representations (e.g., positive → 1.0) without further normalization. Each sequence, therefore, contained all the event tokens for one patient’s hospital encounter.

2.6. Dataset Construction

Encounters were assigned to training (80%), validation (10%), and test (10%) splits deterministically by each patient’s linked identifier before vocabulary construction, numeric scaling, windowing, or sharding. The token vocabulary and per-token z-score normalization parameters were computed exclusively from training-split encounters. Validation and test splits were tokenized using training-derived artifacts. Within each split, each encounter stream was segmented into 128-token windows with stride 64, right-padded when shorter, and serialized into compressed shards of 50,000 windows. Patients, and their encounters, were deterministically split into training, validation, and testing sets via a patient’s linked identifier, so that no patient or their encounters appeared in more than one split. Patients with ambiguous identifiers (i.e., multiple IDs per encounter) were excluded.

2.7. Model Architecture

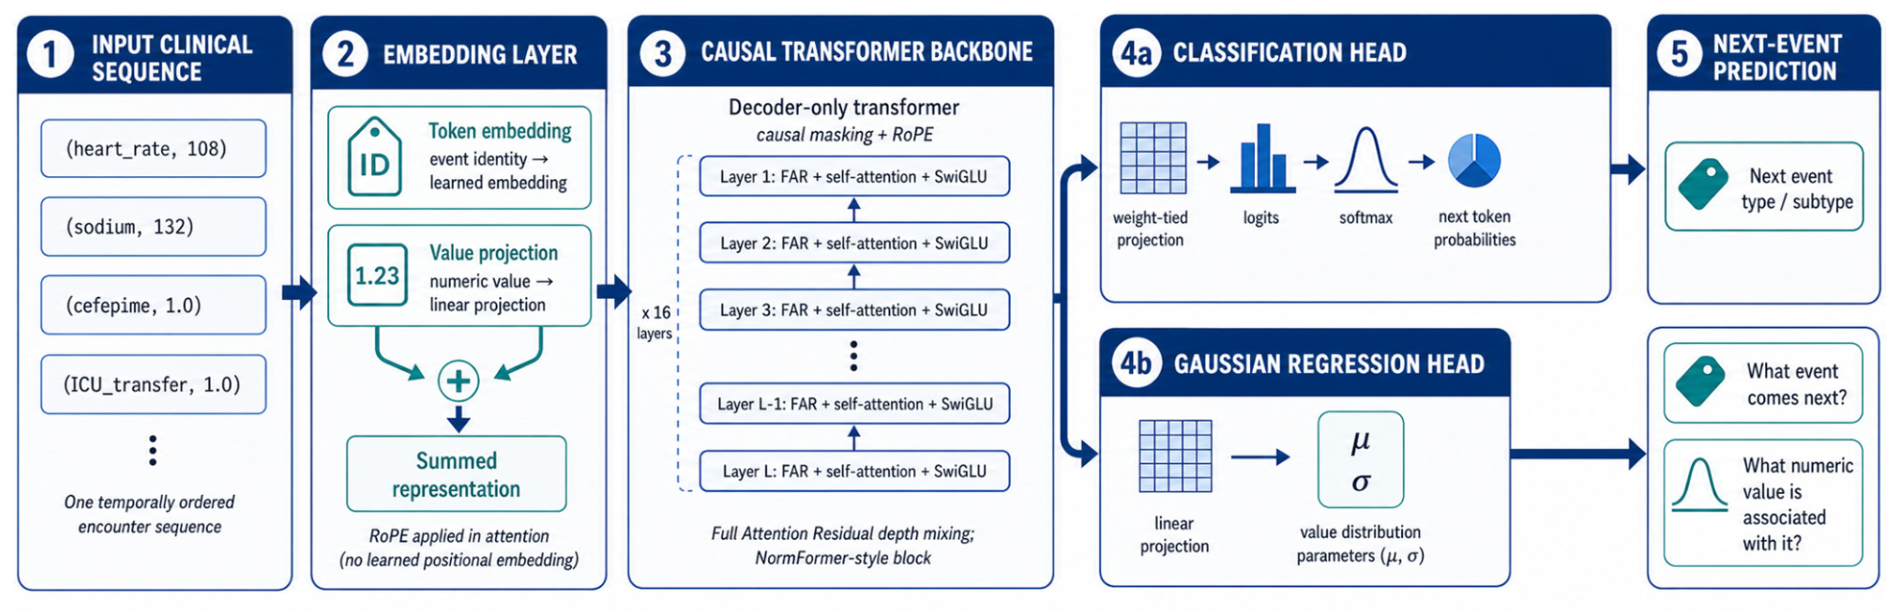
CHaRT is a decoder-only transformer that closely mirrors clinical reasoning, where each new observation is interpreted in the context of all preceding events [9,13]. As shown in Figure 2, CHaRT receives two parallel inputs at each position: a token class identifier and an associated continuous value. The identifier maps to a learned embedding (dimension = 512); the value projects into the same space via a linear layer (1 → 512, no bias) [20]. These two representations are summed and passed through a dropout (p = 0.1). Positional information is encoded with rotary position embeddings (RoPE) applied to the attention query and key projections [21].
The backbone consists of 16 transformer decoder layers, each with 8-head causal self-attention. Compared with a standard transformer stack, CHaRT replaces the additive residual connection with Full Attention Residuals, in which each layer’s input is a learned softmax-weighted combination of all preceding layer outputs and the token embedding [22]. Each layer applies pre-LayerNorm self-attention, followed by a SwiGLU feed-forward network (hidden dimension = 1408) with dropout of 0.1. NormFormer-style normalization is applied throughout: post-attention LayerNorm, per-attention-head scaling, and an additional LayerNorm on the SwiGLU’s gated hidden state, applied between the gated product and the down-projection [23,24].
The output branches into two heads. The classification head maps the final hidden state to logits over the full vocabulary, with weights tied to the input token embedding. The regression head parameterizes a class-conditional Gaussian distribution for each token class. Specifically, for each token class, the head predicts the parameters of a Gaussian distribution—a mean (μ) and a standard deviation (σ)—over that token’s associated continuous value, rather than a single point estimate. The head is trained by minimizing the Gaussian negative log-likelihood of the observed value under those parameters. At inference, the μ of the selected token serves as the continuous-value point estimate and σ expresses the model’s predictive uncertainty. This allows a single architecture to emit both a discrete next-event prediction and a calibrated continuous value with associated uncertainty, given the clinical context. At inference, the class-conditional mean corresponding to the selected token provides the continuous-value point estimate, while the standard deviation encodes uncertainty. No classification threshold is applied at the foundation-model level.

2.8. Loss Functions

The total loss is the sum of next-token classification cross-entropy and Gaussian negative log-likelihood for numeric values. Classification loss uses a smart padding mask that retains the first padding token after an encounter as an end-of-sequence signal while masking subsequent padding positions. For numeric prediction, the model computes the Gaussian parameters for the true target token and applies the negative log-likelihood only where the numeric-token mask is active. The predicted standard deviation is stabilized with softplus transformation and bounded to avoid degenerate variance estimates. Gaussian variance is computed with a small offset (ε = 10−6), and extreme numeric losses are clamped to reduce domination by outliers. Thus, all tokens contribute to next-token classification, whereas regression loss backpropagates only through numeric targets.

2.9. Training Procedure

Optimization used AdamW (beta1 = 0.9, beta2 = 0.95, weight decay 0.1 on 2D + parameters). Learning rate followed warmup-cosine annealing (warmup to 5 × 10⁻⁴ over 1000 iterations, cosine decay to 5 × 10⁻⁵). Training ran for 250,000 iterations with a batch size of 512 using bfloat16 mixed precision, gradient clipping at 1.0, on four A100 80 GB NVIDIA GPUs (Nvidia Corporation, Santa Clara, CA, USA). Validation loss was evaluated every 1000 iterations, with the best validation loss achieved at iteration 239,000 (2.0717). No hyperparameter search was conducted.

2.10. Sample Size and Class Imbalance

No formal sample size calculation was performed because the objective was health-system-scale foundation-model training rather than hypothesis testing for a single clinical endpoint. All eligible encounters that met the cohort inclusion/exclusion and preprocessing criteria were included. The event vocabulary was expected to be highly imbalanced, with routine vital signs and laboratory measurements occurring far more frequently than rare outcomes or specialized interventions. No class rebalancing or loss reweighting was applied because the foundation model was intended to learn the natural conditional event distribution of the observed EHR stream.

2.11. Evaluation Design

Training, validation, and test sets were drawn from the same institutional source and time period with no external evaluation data. Performance was evaluated on the held-out test set across classification and regression tasks. For classification, we measured Top-1, Top-5, Top-10 accuracy, perplexity, and expected calibration error (ECE) over 10 bins [25,26]. We selected these metrics because top-k accuracy captures clinically relevant event ranking, perplexity captures the model’s uncertainty about the next clinical event, and ECE provides a scalar summary statistic of model calibration. For regression, we measured MSE and MAE on z-score normalized scales. All metrics used the training padding mask, scoring the first pad as end-of-sequence and masking subsequent padding. Ninety-five percent confidence intervals were obtained by nonparametric bootstrap over evaluation-batch aggregates. Domain-stratified classification metrics were calculated by token-prefix groupings.

2.12. Deterioration Prediction

To test whether CHaRT’s learned representations could support downstream clinical prediction, we used the trained model as a frozen feature extractor and fit a separate linear probe to predict deterioration, defined as ICU transfer or in-hospital mortality. CHaRT itself was not modified for this task, and event sampling and ordering were unchanged. Because CHaRT reads a stream of clinical-event tokens rather than fixed time steps, we needed a consistent point in each encounter at which to make a prediction. We call this point the anchor: the token reached at a target amount of elapsed time since the start of the encounter. Anchors are defined on an encounter basis. We evaluated anchors at 1, 3, 6, and 12 h of elapsed time, treating the 6 h anchor as the primary analysis.
For each anchor, we defined a prediction horizon as a fixed number of tokens immediately following it (16, 32, or 64 tokens), and an encounter was labeled positive if a deterioration token occurred within that horizon. To ensure each prediction concerned a future event, encounters were included in the analysis only if no deterioration token occurred at or before the anchor. Many short encounters ended before the full horizon was reached; we labeled them based on whether a deterioration token appeared anywhere in the remaining sequence, despite truncation, so that an encounter ending without ICU transfer or death was labeled negative.
For each eligible encounter, the model processed the window of up to 128 tokens ending at the anchor, and the final-layer hidden state at the anchor position was taken as a feature vector. An L2-regularized logistic regression probe mapped this vector to a deterioration probability. The probe was fit on the train set, and its regularization strength and class weighting were selected on the validation set by AUROC. The probe was then applied once to the test set to evaluate the architecture’s ability to predict deterioration. As contextual comparators, we fit logistic regression and gradient-boosted-tree models on the last observed vital signs and laboratory values within the same window. Discrimination was summarized with AUROC and AUPRC with 95% confidence intervals from a non-parametric bootstrap of 1000 resamples over encounters. Calibration was assessed with Brier score, calibration slope and intercept, and reliability curves, and operating characteristics were summarized at 90% sensitivity. AUROC comparisons used the DeLong test [27].

3. Results

3.1. Data Characteristics

The source pool contained 63 million adult encounters, most of which were administrative one-token encounters (91.4%). After applying adult acute-care eligibility criteria and excluding inpatient hospice encounters, the final analytic corpus comprised 4,447,625 encounters from 1,301,502 unique patients, generating 701,556,877 non-padding clinical event tokens. Encounters were predominantly emergency department encounters (87.7%), followed by inpatient hospitalizations (7.8%), surgical admissions (3.9%), and observation encounters (0.6%).
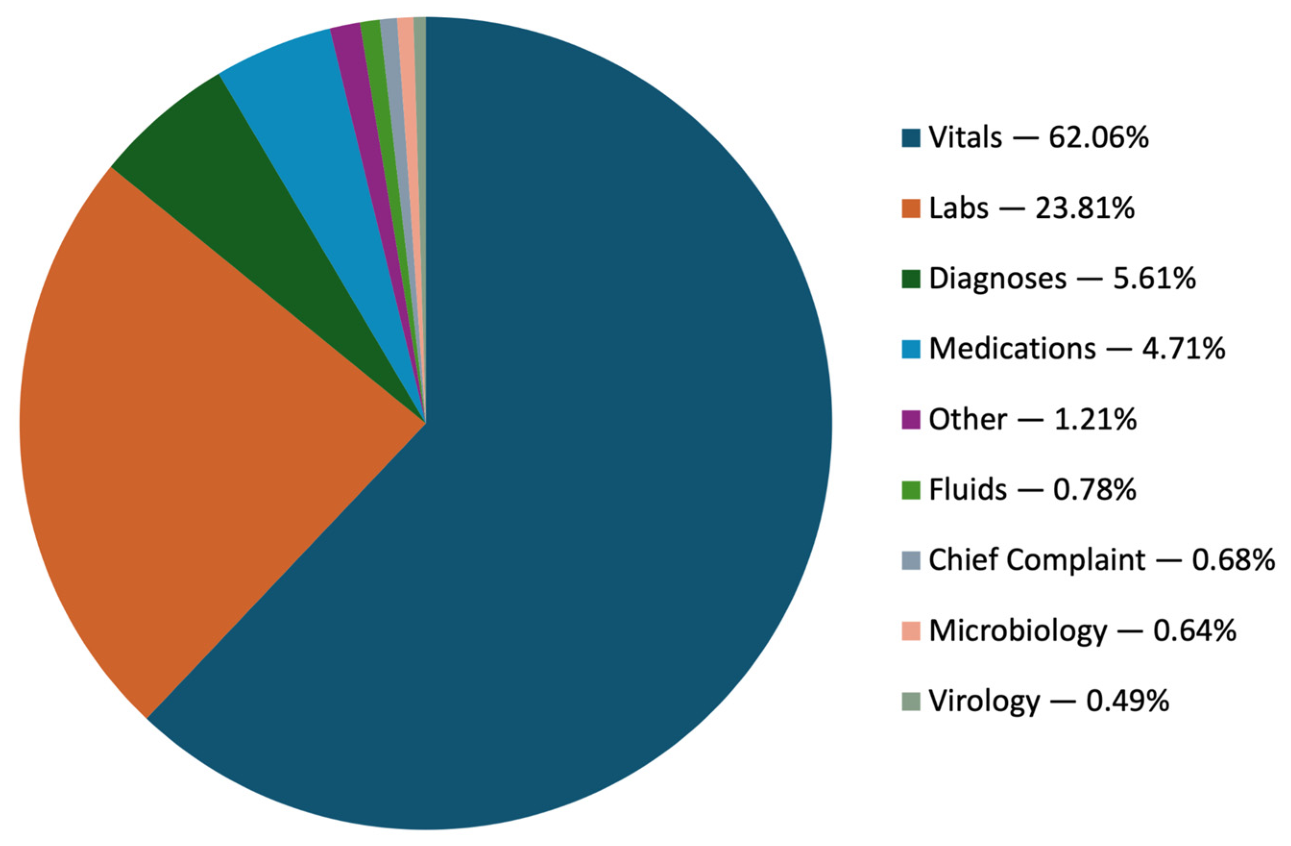
Vitals accounted for the majority of the tokens at 62.06% of the sample. Labs comprised 23.81% of tokens. Diagnoses and medication orders accounted for 5.61% and 4.71% of the sample, respectively (Figure 3). Sequence length was right-skewed, with a median of 56 tokens per encounter (IQR: 21–146) and a mean of 158.0 tokens. Tokens were split 80/10/10 for training/validation/testing. The train set contained 3.6 million encounters and 560 million tokens across 8.9 million windows. The test set contained 444,973 encounters and 71 million tokens across 1.1 million windows. The validation set contained 445,165 encounters and 71 million tokens across 1.1 million windows.

3.2. Participant Characteristics

Patient characteristics are shown in Table 1. Median age was 48.8 years (IQR 32.5–66.9), and age was missing for 353 encounters. Sex female in 58.4% and male in 41.6% of encounters, with 1165 missing/unknown. Recorded race was most commonly White (76.4%), Black or African American (12.3%), and Asian (4.5%). Ethnicity was most commonly not Hispanic or Latino (71.3%), with 25.5% missing/unknown and 3.3% Hispanic or Latino. ICU transfer occurred in 148,493 encounters, while in-hospital mortality occurred in 26,795.

3.3. Model Performance

CHaRT achieved Top-1, Top-5, and Top-10 next-event accuracies of 51.61% (95% CI, 51.54–51.67%), 87.34% (95% CI, 87.28–87.39%), and 93.22% (95% CI, 93.18–93.25%), respectively. Perplexity was 4.50 (95% CI, 4.49–4.52), and ECE was 0.0109 (95% CI, 0.0107–0.0111).
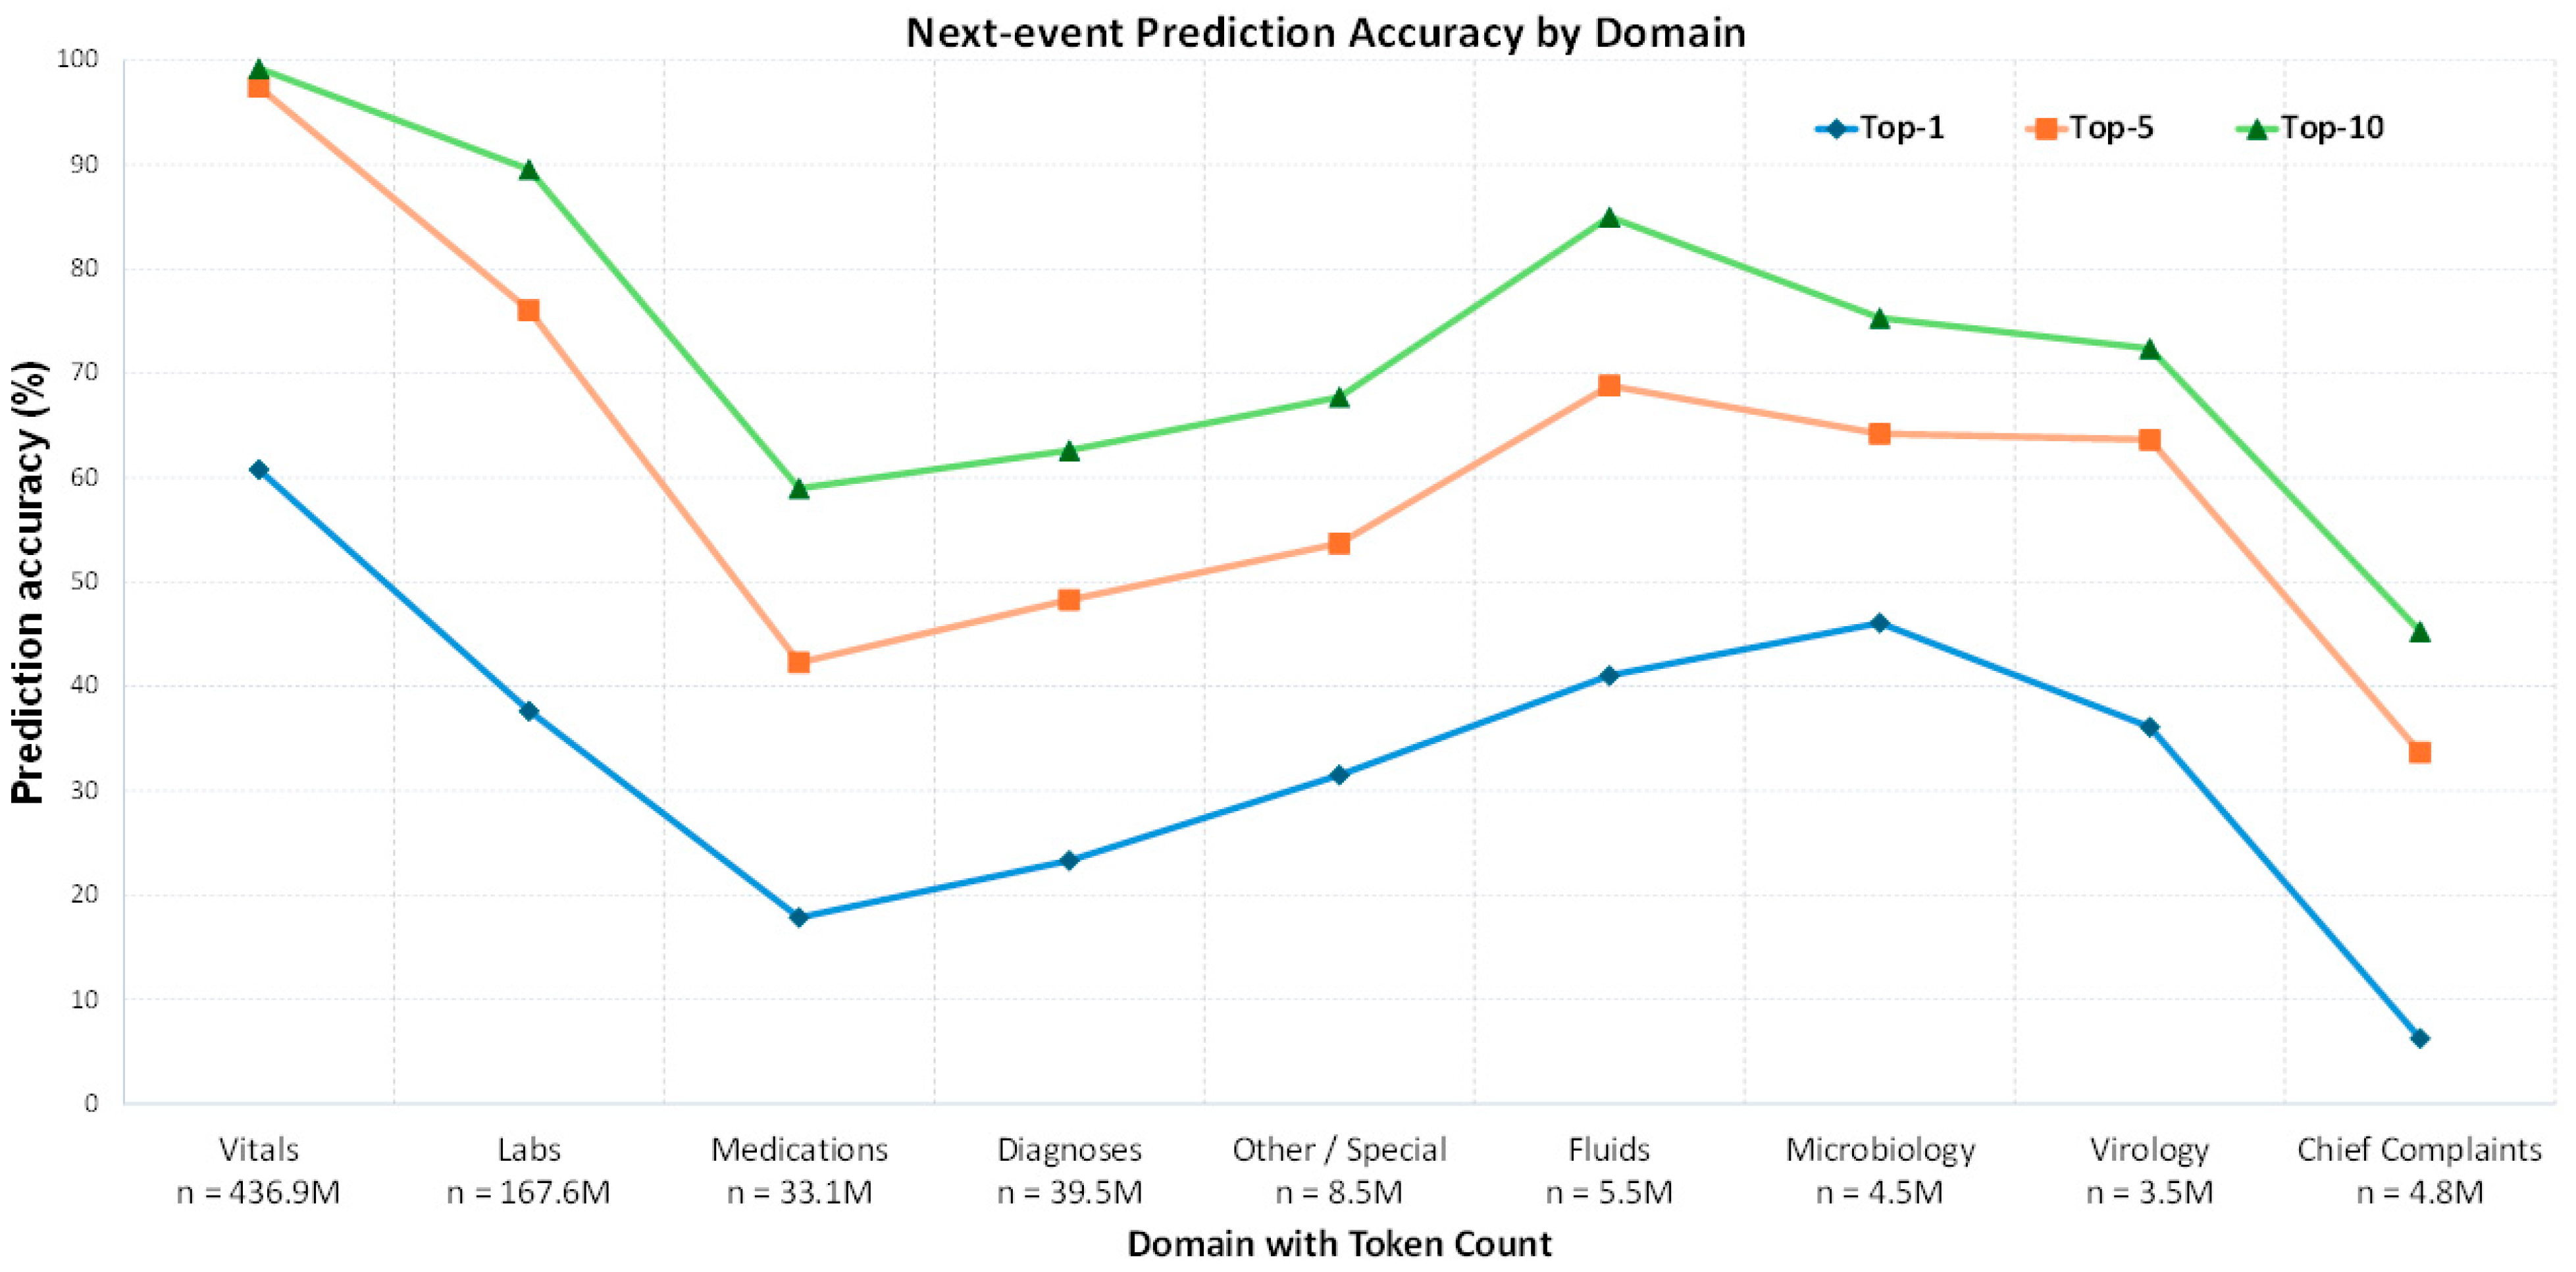
Next-event prediction performance varied substantially by clinical domain (Figure 4). Vitals showed the strongest next-event discrimination (Top-1 60.8%, Top-5 97.4%, Top-10 99.2%), followed by microbiology (46.1%, 64.2%, 75.3%), fluids (41.1%, 68.8%, 85.0%), labs (37.7%, 76.0%, 89.5%), and virology (36.1%, 63.6%, 72.4%). Diagnosis and medication-stratified next-event discrimination was lower (23.3%, 48.3%, 62.6% and 17.9%, 42.3%, 59.0%, respectively). Chief complaint performance was lowest for defined events (6.3%, 33.7%, 45.3%). Other/special tokens were moderately predictable (Top-1 31.5%).
For continuous values, vitals achieved MSE 0.3812 (95% CI, 0.3781–0.3841) and MAE 0.3819 (95% CI, 0.3809–0.3828), while labs achieved MSE 0.5713 (95% CI, 0.4788–0.6906) and MAE 0.3481 (95% CI, 0.3469–0.3493) on z-score normalized scales.

3.4. Qualitative Trajectory Evaluation

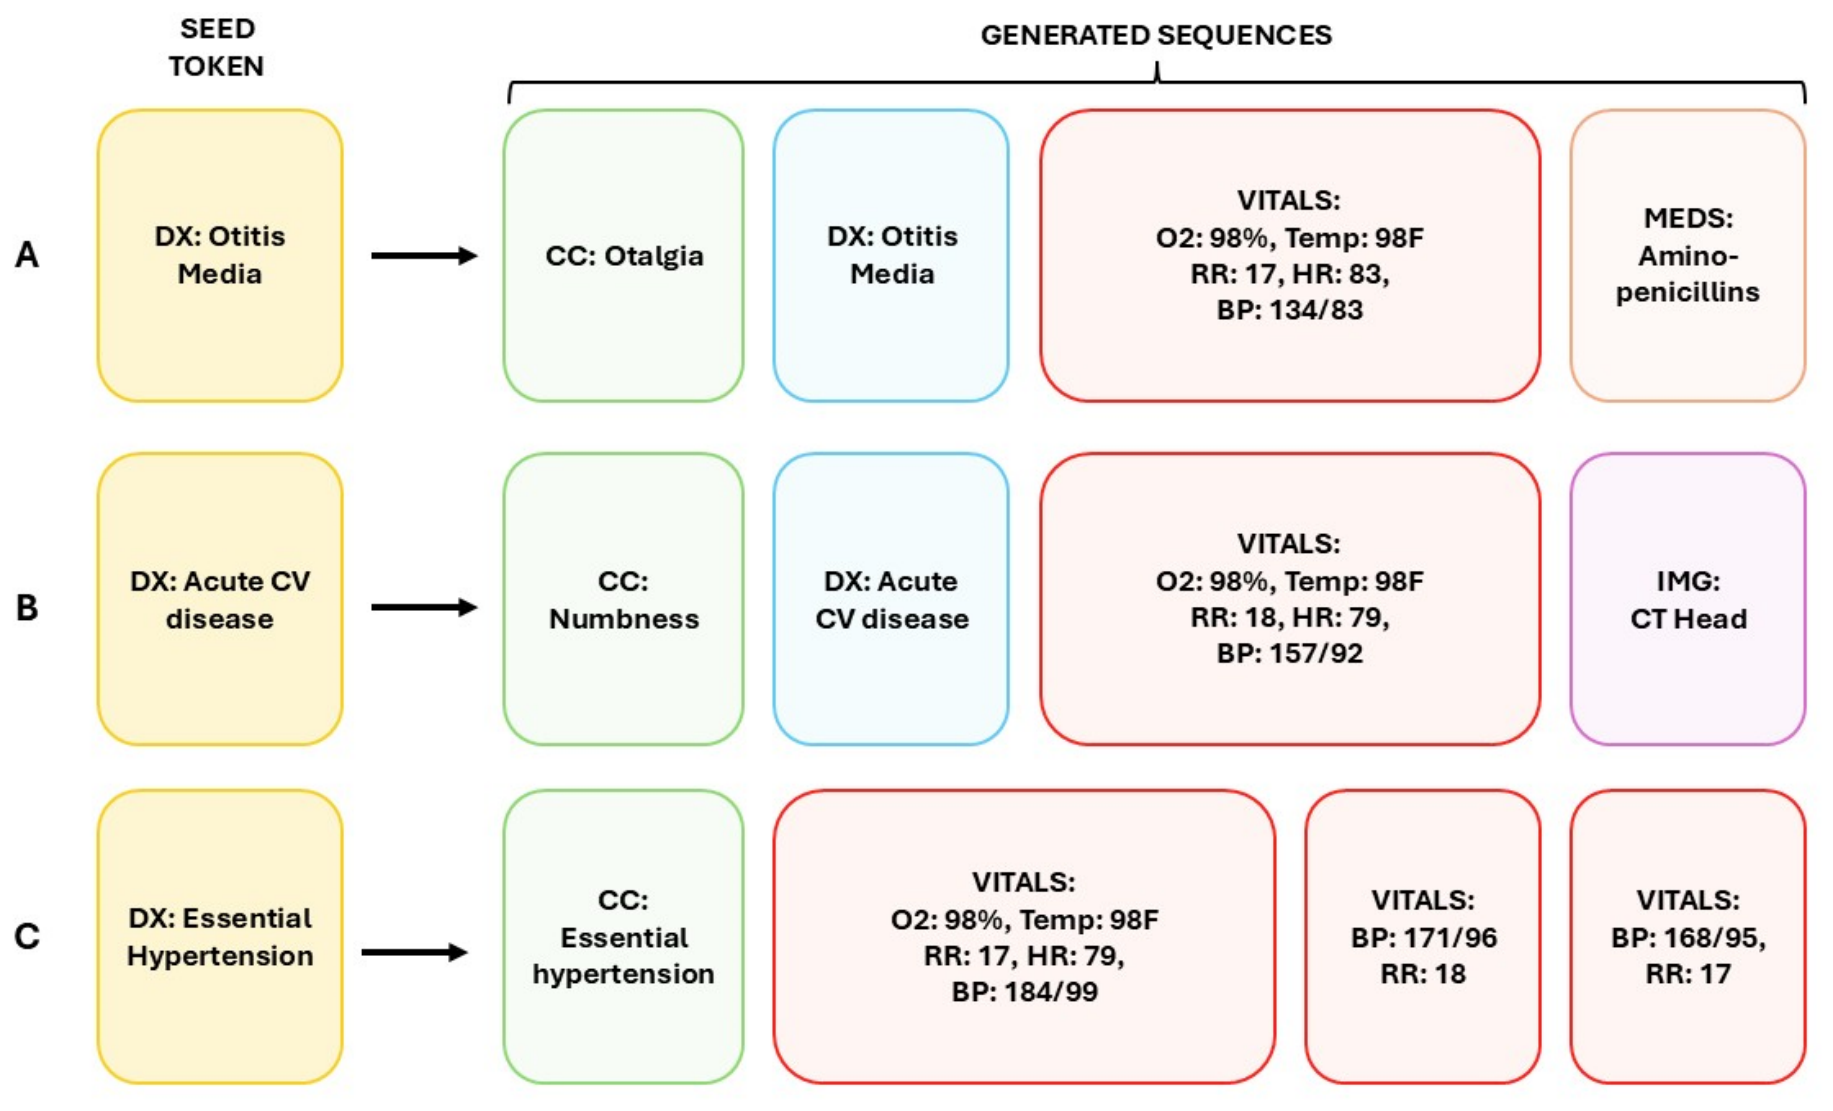
To assess clinical coherence, we seeded CHaRT with a single diagnosis token and allowed it to autoregressively generate the subsequent event sequence. Figure 5 shows generated continuations for three representative diagnoses: (A) otitis media, (B) acute cerebrovascular disease, and (C) essential hypertension. In A, after being seeded otitis media, CHaRT generated a chief complaint of otalgia, produced a coherent near-normal vital-sign panel, and selected an aminopenicillin—demonstrating not only the contextual understanding that otitis media is treated with antibiotics, but specifically the agent class most providers favor as first-line therapy. In B, CHaRT generated numbness as a plausible presenting complaint, produced the mild but abnormal vital-sign derangements characteristic of an acute cerebrovascular event (notably an elevated blood pressure of 157/92 mmHg), and ordered a head CT, an appropriate initial imaging study for an acute cerebrovascular workup. In C, CHaRT reproduced the hypertensive vital-sign abnormalities expected in essential hypertension and held these elevated pressures across successive measurements (systolic of 184, 171, and 168 mmHg). Notably, it repeated vital-sign acquisition three times rather than introducing a pharmacologic or diagnostic intervention, reflecting an appropriate recognition that active intervention is not necessarily indicated for a clinical problem often treated with observation. Across cases, CHaRT produced clinically plausible event sequences with numerically reasonable values and transitioned naturally across diagnoses, chief complaints, vital signs, medications, and imaging.

3.5. Deterioration Prediction

On the held-out test set, the linear probe on CHaRT’s representations discriminated deterioration with high accuracy and outperformed both contextual baselines at every landmark. At the primary 6 h anchor with a 16-token horizon (n = 25,000; 106 deterioration events; prevalence 0.4%), the probe achieved an AUROC of 0.964 (95% CI, 0.947–0.977) and AUPRC of 0.234 (95% CI, 0.168–0.317), compared with AUROC 0.718 for gradient-boosted baseline and 0.572 for logistic regression on last-observed vital signs and laboratory results. The probe’s AUROC advantage over the stronger gradient-boosted model was 0.246 (95% CI, 0.205–0.288; DeLong p = 3.5 × 10⁻³¹). The probe was well calibrated at this anchor (Brier 0.004; calibration slope 1.27, intercept 0.98) and, at a fixed sensitivity of 90%, achieved 89% specificity.
Discrimination was stable across the anchor and horizon sweep. Probe AUROC ranged from 0.950 to 0.987 across all twelve permutations (anchors at 1, 3, 6, and 12 h; horizons of 16, 32, and 64 tokens), versus 0.698–0.842 for the gradient-boosted baseline and 0.539–0.632 for logistic regression. No deterioration tokens appeared in any context window, confirming the absence of label leakage. Approximately 59% of encounters in the primary 6 h anchor, 16-token analysis ended before the full prediction horizon.

4. Discussion

CHaRT demonstrates that a single decoder-only transformer can jointly model the heterogeneous event streams of inpatient care while preserving the numeric precision of vital signs and laboratory values. The model achieved Top-10 next-event accuracy of 93.22% and an expected calibration error of 0.0109 across a vocabulary of 4289 tokens spanning medications, laboratory results (MAE 0.3481), vital signs (MAE 0.3819), imaging, microbiology, virology, diagnoses, and outcomes (ICU transfer and in-hospital mortality). Seeded with a single diagnosis token, CHaRT generated clinically coherent trajectories integrating discrete clinical actions with plausible continuous measurements. These findings establish the feasibility of unified autoregressive modeling of inpatient clinical event streams in which the model predicts not only what event is likely to occur next, but also the numeric value associated with that event.

4.1. Relationship to Prior Work

Prior clinical sequence models have shown that transformers can learn meaningful representations from longitudinal EHR data, including encoder-based pretraining models (BEHRT, Med-BERT, CEHR-BERT) and decoder-only or generative models (Foresight, ETHOS, CEHR-GPT, PRISM, Curiosity) [10,11,12,13,14,15,18,19]. Most either restrict modeling to discrete events or discretize continuous values into bins, precluding an event-conditioned continuous-value forecast. CHaRT addresses this gap by jointly modeling event identity and continuous value within a single autoregressive framework.
The architectural concept underlying CHaRT, autoregressive decomposition of mixed categorical and numeric data into a joint distribution over the next token’s class and value, was proposed by Loza et al. in their multivariateGPT framework [20]. That work established feasibility on ICU benchmark datasets that included clinical data from 68,517 patients, with a maximum model vocabulary size of 36. CHaRT extends this work by expanding the vocabulary from 36 to 4289 tokens, scaling the corpus from 68,517 to over 1.3 million patients with 4.4 million sequences, and including ward and emergency department data (which are sparser than ICU data but reflect where most hospitalized patients receive care).

4.2. Clinical Interpretation of Numeric Predictions

CHaRT’s numeric performance can be understood by translating its z-score MSE into native clinical units. For vital signs, an MSE of 0.3812 corresponds to a root mean squared error of 0.617 standard deviations. Applied to inter-patient SDs reported in large hospitalized-adult cohorts, this corresponds to RMSE-equivalent next-value errors of roughly 7 to 10 beats per minute for heart rate, 1.5 to 2.1 breaths per minute for respiratory rate, 9 to 13 mmHg for systolic blood pressure, and 0.28 °C (0.5 °F) for temperature [28,29]. The laboratory MSE of 0.5713 yields an analogous RMSE of 0.756 z-units, although translation into absolute units is necessarily analyte-specific. Taking serum sodium as one example, the adult population serum sodium interquartile range of 2.8 mmol/L (mean 139.2 mmol/L) gives an SD of 2.08 mmol/L and thus an RMSE-equivalent serum sodium error of approximately 1.57 mmol/L [30].
These errors approach the practical resolution of routine inpatient measurement. Systolic blood pressure can vary by 5 to 15 mmHg due to factors such as crossing legs and insufficient back support [31]. Documented inpatient vital signs show substantial terminal-digit bias, including overrepresentation of heart rates at even numbers and at multiples of 5 and 10, suggesting CHaRT’s vital sign error is close to existing variation in vital sign documentation practices [29].

4.3. Performance Variation Across Clinical Domains

Prediction accuracy varied substantially across clinical domains and was not explained solely by token frequency. Although vital signs were the most frequent and most predictable domain, lower-frequency domains such as fluids, microbiology, and virology outperformed medications, indicating that CHaRT learned more than marginal token prevalence. Vital signs and laboratories likely benefit from local grouping structure: a heart rate usually appears alongside other vital signs, and one laboratory analyte often implies adjacent components of the same panel. Medications, by contrast, are intrinsically higher entropy because they encode clinician decisions shaped by indication, formulary, dose selection, prescriber preference, and workflow; in this context, CHaRT’s top-10 medication accuracy of 59% is clinically notable. Chief complaints were least predictable, consistent with their sparse, early-encounter, free-text-derived structure.

4.4. Imputation-Free Modeling and Trajectory-Based Forecasting

CHaRT’s event-stream formulation avoids forcing the clinical record into a fixed-length feature matrix or regular time grid, thereby reducing reliance on explicit imputation for observations that were never recorded. This matters because missingness in EHR time series is often informative rather than random, and converting irregular event-level data into predefined matrix features can discard temporal, contextual, and measurement-frequency information before imputation is even applied [32,33]. By representing observed clinical events in the order they occurred, CHaRT allows the absence, timing, and repetition of measurements to remain part of the clinical sequence rather than treating them as nuisance artifacts to be filled in; these patterns may themselves encode acuity, clinician concern, and workflow.
This trajectory-based framing also offers a more clinically meaningful approach to interpretability. Current local explainability methods are often unreliable or superficial for patient-level decision support and may fail to justify whether an individual AI recommendation is clinically appropriate [34]. Rather than relying solely on static feature-attribution summaries, CHaRT could support outcome-conditioned trajectory analysis. Given a current patient state and a target outcome, one could sample trajectories, isolate those reaching the outcome, and summarize recurrent intervening patterns, effectively simulating future patient trajectories to future outcomes, with Monte Carlo sampling providing a natural basis for quantifying uncertainty around those estimates [35]. A trajectory such as unexpected hypotension followed by ICU transfer, without resuscitative medications being given, would make the model’s forecast clinically legible and identify candidate points for counterfactual testing, prospective validation, and intervention.

4.5. Deterioration Prediction

Our deterioration analysis directly evaluates this premise and constitutes the empirical core of the paper’s central claim: that CHaRT functions not merely as a bedside alerting system, but as a general clinical sequence model whose learned representations transfer with minimal adaptation. Without retraining or task-specific feature engineering, a linear probe applied to CHaRT’s frozen hidden states identified impending ICU transfer or death with an AUROC of 0.964 at the primary six-hour anchor and 0.950–0.987 across all anchor-horizon combinations. This exceeded gradient-boosted and logistic-regression baselines derived from the most recent vital signs and laboratory values by approximately 0.25 AUROC relative to the stronger gradient-boosted baseline (DeLong p < 10−30). This single linear layer, applied to a frozen, task-agnostic representation, outperformed engineered-feature models and approached the discrimination reported for dedicated early warning systems [36], suggesting that CHaRT has learned clinically meaningful structure rather than merely reproducing marginal event distributions.

4.6. Limitations

Several limitations qualify these findings and define the next phase of CHaRT development. All training, validation, and test data were drawn from a single academic health system, and the corpus reflects local documentation practices, order sets, formularies, EHR configuration, and patient population characteristics. External validation across institutions is a precondition for any claim of generalizability and for any responsible deployment. The 25-year span of the corpus also introduces substantial temporal heterogeneity, as clinical practice, drug formularies, ICD coding systems, laboratory assays, reference ranges, and documentation workflows all evolved over the study period; CHaRT learns across this drift rather than explicitly modeling it. Future work will quantify temporal performance decay and evaluate temporally held-out test sets.
CHaRT currently models event order without considering elapsed or absolute time, so it cannot directly address horizon-specific clinical questions. However, its architecture can be adapted to include artificial time tokens to enable this functionality [15,18,20].

5. Conclusions

CHaRT establishes that a single decoder-only transformer can jointly model the categorical and numeric event streams of inpatient EHRs at health-system scale, predicting both the identity and the numeric value of the next clinical event with clinically interpretable precision. Beyond next-event prediction, the same model autoregressively generates coherent multi-step clinical trajectories. Its internal representations capture higher-order clinical patterns, including death or ICU transfer, and can be extracted and repurposed for downstream prediction and risk stratification without modification to the underlying model, suggesting CHaRT’s potential to serve as a foundational model.

Author Contributions

Conceptualization, T.F.B.IV and M.W.; methodology, T.F.B.IV and M.W.; software, M.W.; validation, T.F.B.IV and M.W.; formal analysis, M.W.; investigation, T.F.B.IV and M.W.; resources, T.F.B.IV; data curation, M.W. and T.F.B.IV; writing, original draft preparation, M.W.; writing, review and editing, T.F.B.IV and M.W.; visualization, M.W.; supervision, T.F.B.IV; project administration, T.F.B.IV. All authors have read and agreed to the published version of the manuscript.

Funding

This research was supported by the National Institutes of Health’s National Center for Advancing Translational Sciences, grant UM1 TR004405. The content is solely the responsibility of the authors and does not necessarily represent the official views of the National Institutes of Health’s National Center for Advancing Translational Sciences.

Institutional Review Board Statement

The study was conducted in accordance with the Declaration of Helsinki and approved by the University of Minnesota Institutional Review Board (protocol code STUDY00017419; approved 2 December 2022).

Informed Consent Statement

Patient consent was waived by the University of Minnesota Institutional Review Board because the study involved no more than minimal risk to participants, did not adversely affect their rights or welfare, and could not practicably be conducted without the waiver and the use of identifiable information.

Data Availability Statement

The data used in this study are not publicly available because they contain protected health information.

Acknowledgments

During the preparation of this manuscript, the authors used ChatGPT (GPT-5.5, OpenAI) and Claude (Opus 4.7, Anthropic) for the purposes of generating graphics, developing textual outlines, and grammatical refinement. The authors have reviewed and edited the output and take full responsibility for the content of this publication.

Conflicts of Interest

The authors declare no conflicts of interest.

References

  1. Amirahmadi, A.; Ohlsson, M.; Etminani, K. Deep learning prediction models based on EHR trajectories: A systematic review. J. Biomed. Inform. 2023, 144, 104430. [Google Scholar] [CrossRef] [Scilit] [PubMed]
  2. Zhu, M.; Liu, Y.; Luo, Z.; Zhu, T. The Taxonomies, Training, and Applications of Event Stream Modelling for Electronic Health Records. arXiv 2026, arXiv:2603.14003. [Google Scholar] [CrossRef] [Scilit]
  3. Romero-Brufau, S.; Whitford, D.; Johnson, M.G.; Hickman, J.; Morlan, B.W.; Therneau, T.; Naessens, J.; Huddleston, J.M. Using machine learning to improve the accuracy of patient deterioration predictions: Mayo Clinic Early Warning Score (MC-EWS). J. Am. Med. Inform. Assoc. 2021, 28, 1207–1215. [Google Scholar] [CrossRef] [Scilit] [PubMed]
  4. Choi, E.; Bahadori, M.T.; Schuetz, A.; Stewart, W.F.; Sun, J. Doctor AI: Predicting Clinical Events via Recurrent Neural Networks. JMLR Workshop Conf. Proc. 2016, 56, 301–318. [Google Scholar] [PubMed]
  5. Rajkomar, A.; Oren, E.; Chen, K.; Dai, A.M.; Hajaj, N.; Hardt, M.; Liu, P.J.; Liu, X.; Marcus, J.; Sun, M.; et al. Scalable and accurate deep learning with electronic health records. npj Digit. Med. 2018, 1, 18. [Google Scholar] [CrossRef] [Scilit] [PubMed]
  6. Tomašev, N.; Glorot, X.; Rae, J.W.; Zielinski, M.; Askham, H.; Saraiva, A.; Mottram, A.; Meyer, C.; Ravuri, S.; Protsyuk, I.; et al. A clinically applicable approach to continuous prediction of future acute kidney injury. Nature 2019, 572, 116–119. [Google Scholar] [CrossRef] [Scilit] [PubMed]
  7. Harutyunyan, H.; Khachatrian, H.; Kale, D.C.; Ver Steeg, G.; Galstyan, A. Multitask learning and benchmarking with clinical time series data. Sci. Data 2019, 6, 96. [Google Scholar] [CrossRef] [Scilit] [PubMed]
  8. Shickel, B.; Tighe, P.J.; Bihorac, A.; Rashidi, P. Deep EHR: A Survey of Recent Advances in Deep Learning Techniques for Electronic Health Record (EHR) Analysis. IEEE J. Biomed. Health Inf. 2018, 22, 1589–1604. [Google Scholar] [CrossRef] [Scilit] [PubMed]
  9. Vaswani, A.; Shazeer, N.; Parmar, N.; Uszkoreit, J.; Jones, L.; Gomez, A.N.; Kaiser, L.; Polosukhin, I. Attention Is All You Need. arXiv 2023, arXiv:1706.03762. [Google Scholar] [CrossRef] [Scilit]
  10. Li, Y.; Rao, S.; Solares, J.R.A.; Hassaine, A.; Ramakrishnan, R.; Canoy, D.; Zhu, Y.; Rahimi, K.; Salimi-Khorshidi, G. BEHRT: Transformer for Electronic Health Records. Sci. Rep. 2020, 10, 7155. [Google Scholar] [CrossRef] [Scilit] [PubMed]
  11. Pang, C.; Jiang, X.; Kalluri, K.S.; Spotnitz, M.; Chen, R.; Perotte, A.; Natarajan, K. CEHR-BERT: Incorporating temporal information from structured EHR data to improve prediction tasks. arXiv 2021, arXiv:2111.08585. [Google Scholar] [CrossRef] [Scilit]
  12. Rasmy, L.; Xiang, Y.; Xie, Z.; Tao, C.; Zhi, D. Med-BERT: Pretrained contextualized embeddings on large-scale structured electronic health records for disease prediction. npj Digit. Med. 2021, 4, 86. [Google Scholar] [CrossRef] [Scilit] [PubMed]
  13. Kraljevic, Z.; Bean, D.; Shek, A.; Bendayan, R.; Hemingway, H.; Yeung, J.A.; Deng, A.; Balston, A.; Ross, J.; Idowu, E.; et al. Foresight—A generative pretrained transformer for modelling of patient timelines using electronic health records: A retrospective modelling study. Lancet Digit. Health 2024, 6, e281–e290. [Google Scholar] [CrossRef] [Scilit] [PubMed]
  14. Levine, L.; Santerre, J.; Young, A.S.; Levine, T.B.; Campion, F.; Sarrafzadeh, M. PRISM: A Transformer-based Language Model of Structured Clinical Event Data. arXiv 2025, arXiv:2506.11082. [Google Scholar] [CrossRef] [Scilit]
  15. Pang, C.; Jiang, X.; Pavinkurve, N.P.; Kalluri, K.S.; Minto, E.L.; Patterson, J.; Zhang, L.; Hripcsak, G.; Gürsoy, G.; Elhadad, N.; et al. CEHR-GPT: Generating Electronic Health Records with Chronological Patient Timelines. arXiv 2024, arXiv:2402.04400. [Google Scholar] [CrossRef] [Scilit]
  16. Rajamohan, H.R.; Gao, X.; Zhu, W.; Huang, S.-L.; Chen, L.; Cho, K.; Deniz, C.M.; Razavian, N. Foundation Models for Clinical Records at Health System Scale. arXiv 2025, arXiv:2507.00574. [Google Scholar] [CrossRef] [Scilit]
  17. Redekop, E.; Wang, Z.; Kulkarni, R.; Pleasure, M.; Chin, A.; Hassanzadeh, H.R.; Hill, B.L.; Emami, M.; Speier, W.F.; Arnold, C.W. Zero-shot medical event prediction using a generative pretrained transformer on electronic health records. J. Am. Med. Inform. Assoc. 2025, 32, 1833–1842. [Google Scholar] [CrossRef] [Scilit] [PubMed]
  18. Renc, P.; Jia, Y.; Samir, A.E.; Was, J.; Li, Q.; Bates, D.W.; Sitek, A. Zero shot health trajectory prediction using transformer. npj Digit. Med. 2024, 7, 256. [Google Scholar] [CrossRef] [Scilit] [PubMed]
  19. Waxler, S.; Blazek, P.; White, D.; Sneider, D.; Chung, K.; Nagarathnam, M.; Williams, P.; Voeller, H.; Wong, K.; Swanhorst, M.; et al. Generative Medical Event Models Improve with Scale. arXiv 2025, arXiv:2508.12104. [Google Scholar] [CrossRef] [Scilit]
  20. Loza, A.J.; Kim, J.Y.; Song, S.; Liu, Y.; Sung, J.J.Y.; Taylor, R.A.; Shung, D.L. multivariateGPT: A decoder-only transformer for multivariate categorical and numeric data. arXiv 2025, arXiv:2505.21680. [Google Scholar] [CrossRef] [Scilit]
  21. Su, J.; Lu, Y.; Pan, S.; Murtadha, A.; Wen, B.; Liu, Y. RoFormer: Enhanced Transformer with Rotary Position Embedding. arXiv 2021, arXiv:2104.09864. [Google Scholar] [CrossRef] [Scilit]
  22. Kimi Team; Chen, G.; Zhang, Y.; Su, J.; Xu, W.; Pan, S.; Wang, Y.; Wang, Y.; Chen, G.; Yin, B.; et al. Attention Residuals. arXiv 2026. [Google Scholar] [CrossRef] [Scilit]
  23. Shazeer, N. GLU Variants Improve Transformer. arXiv 2020, arXiv:2002.05202. [Google Scholar] [CrossRef] [Scilit]
  24. Shleifer, S.; Weston, J.; Ott, M. NormFormer: Improved Transformer Pretraining with Extra Normalization. arXiv 2021, arXiv:2110.09456. [Google Scholar] [CrossRef] [Scilit]
  25. Ankner, Z.; Blakeney, C.; Sreenivasan, K.; Marion, M.; Leavitt, M.L.; Paul, M. Perplexed by Perplexity: Perplexity-Based Data Pruning with Small Reference Models. arXiv 2024, arXiv:2405.20541. [Google Scholar] [CrossRef] [Scilit]
  26. Guo, C.; Pleiss, G.; Sun, Y.; Weinberger, K.Q. On Calibration of Modern Neural Networks. arXiv 2017, arXiv:1706.04599. [Google Scholar] [CrossRef] [Scilit]
  27. DeLong, E.R.; DeLong, D.M.; Clarke-Pearson, D.L. Comparing the areas under two or more correlated receiver operating characteristic curves: A nonparametric approach. Biometrics 1988, 44, 837–845. [Google Scholar] [CrossRef] [Scilit] [PubMed]
  28. Han, H.M.; Choi, S.J.; Park, E.; Chang, J.; Jung, H.H.; Im, G.J. A big data analysis of fever threshold and vital sign characteristics using tympanic temperature in hospitalized patients. Sci. Rep. 2024, 14, 27470. [Google Scholar] [CrossRef] [Scilit] [PubMed]
  29. Kleinig, O.; To, M.S.; Ovenden, C.D.; Kovoor, J.G.; Goh, R.; Lam, L.; Wenzel, T.; Tan, Y.; Harish, H.; Gupta, A.K.; et al. Vital sign measurements demonstrate terminal digit bias and boundary effects. Emerg. Med. Australas. 2024, 36, 543–546. [Google Scholar] [CrossRef] [Scilit] [PubMed]
  30. Overwyk, K.J.; Pfeiffer, C.M.; Storandt, R.J.; Zhao, L.; Zhang, Z.; Campbell, N.R.C.; Wiltz, J.L.; Merritt, R.K.; Cogswell, M.E. Serum Sodium and Potassium Distribution and Characteristics in the US Population, National Health and Nutrition Examination Survey 2009–2016. J. Appl. Lab. Med. 2021, 6, 63–78. [Google Scholar] [CrossRef] [Scilit] [PubMed]
  31. Muntner, P.; Shimbo, D.; Carey, R.M.; Charleston, J.B.; Gaillard, T.; Misra, S.; Myers, M.G.; Ogedegbe, G.; Schwartz, J.E.; Townsend, R.R.; et al. Measurement of Blood Pressure in Humans: A Scientific Statement from the American Heart Association. Hypertension 2019, 73, e35–e66. [Google Scholar] [CrossRef] [Scilit] [PubMed]
  32. Che, Z.; Purushotham, S.; Cho, K.; Sontag, D.; Liu, Y. Recurrent Neural Networks for Multivariate Time Series with Missing Values. Sci. Rep. 2018, 8, 6085. [Google Scholar] [CrossRef] [Scilit] [PubMed]
  33. Getzen, E.; Ungar, L.; Mowery, D.; Jiang, X.; Long, Q. Mining for equitable health: Assessing the impact of missing data in electronic health records. J. Biomed. Inform. 2023, 139, 104269. [Google Scholar] [CrossRef] [Scilit] [PubMed]
  34. Ghassemi, M.; Oakden-Rayner, L.; Beam, A.L. The false hope of current approaches to explainable artificial intelligence in health care. Lancet Digit. Health 2021, 3, e745–e750. [Google Scholar] [CrossRef] [Scilit] [PubMed]
  35. Renc, P.; Grzeszczyk, M.K.; Oufattole, N.; Goode, D.; Jia, Y.; Bieganski, S.; McDermott, M.B.A.; Was, J.; Samir, A.E.; Cunningham, J.W.; et al. Foundation model of electronic medical records for adaptive risk estimation. Gigascience 2025, 14, giaf107. [Google Scholar] [CrossRef] [Scilit] [PubMed]
  36. Edelson, D.P.; Churpek, M.M.; Carey, K.A.; Lin, Z.; Huang, C.; Siner, J.M.; Johnson, J.; Krumholz, H.M.; Rhodes, D.J. Early Warning Scores with and Without Artificial Intelligence. JAMA Netw. Open 2024, 7, e2438986. [Google Scholar] [CrossRef] [Scilit] [PubMed]
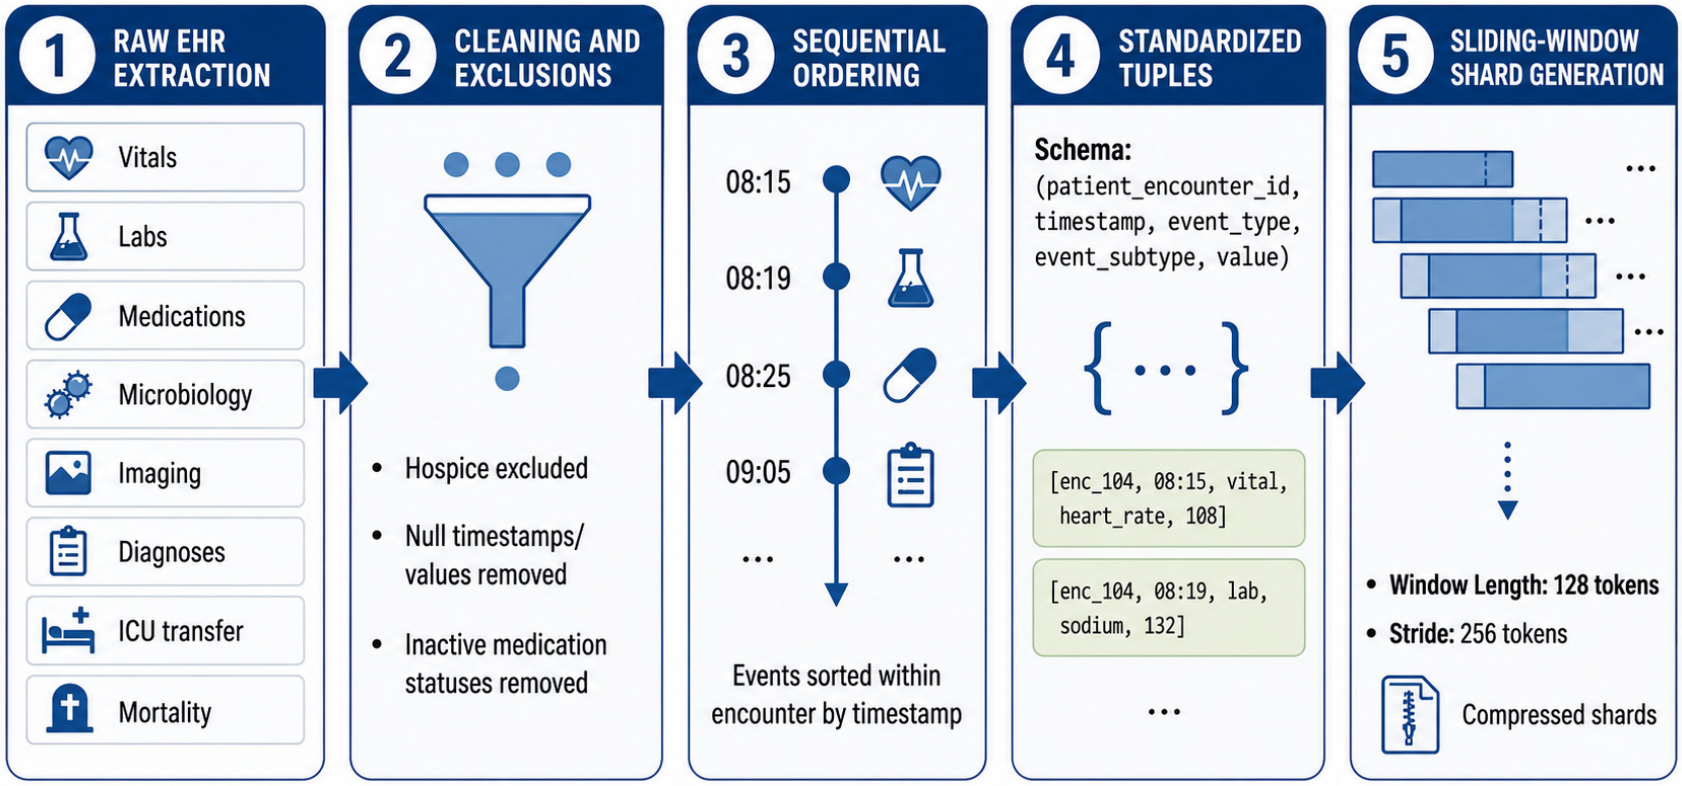
Figure 1. Data preprocessing and tokenization pipeline from raw EHR extraction through cleaning, harmonization into tuples, and sliding-window shard generation.
Informatics 13 00099 g001
Figure 2. CHaRT architecture showing token and value embeddings, the causal transformer backbone, the classification head, and the Gaussian regression head.
Informatics 13 00099 g002
Figure 3. Final corpus token composition.
Informatics 13 00099 g003
Figure 4. Accuracy of next-event prediction, stratified by domain with respective token counts.
Informatics 13 00099 g004
Figure 5. CHaRT-generated clinical trajectories seeded from a single diagnosis token. (A) otitis media, (B) acute cerebrovascular disease, and (C) essential hypertension. In each row, the amber token is the seed diagnosis provided to the model; the remaining tokens are the CHaRT-generated continuation. Abbreviations: DX, diagnosis; CC, chief complaint; MEDS, medication; IMG, imaging; CV, cerebrovascular; SBP/DBP, systolic/diastolic blood pressure (mmHg); O2, peripheral oxygen saturation (%); HR, heart rate (bpm); RR, respiratory rate (breaths/min); Temp, temperature (°F); CT, computed tomography.
Informatics 13 00099 g005
Table 1. Patient demographics and encounter-level characteristics for the final analytic cohort.
      CharacteristicFinal Analytic Cohort
Cohort and data volume
      Final adult acute-care encounters, n4,447,625
      Unique patients, n1,301,502
      Non-padding clinical event tokens, n701,556,877
Encounter class
      Emergency3,900,771 (87.7%)
      Inpatient346,762 (7.8%)
      Surgical admit173,386 (3.9%)
      Observation26,706 (0.6%)
Sequence characteristics
      Median length (IQR), tokens56 (21–146)
      Mean length, tokens158.0
Age and legal sex
      Age, median (IQR), years48.8 (32.5–66.9)
      Age missing, n (%)353 (0.01%)
      Female, n (%)2,595,791 (58.4%)
      Male, n (%)1,850,284 (41.6%)
      Legal sex missing/unknown, n (%)1550 (0.03%)
Race
      White76.4%
      Black or African American12.3%
      Asian4.5%
      Other6.8%
Ethnicity
      Not Hispanic or Latino71.3%
      Hispanic or Latino3.3%
      Missing/unknown25.5%
Clinical outcomes
      In-hospital mortality, n (%)26,795 (0.60%)
      ICU transfer, n (%)148,493 (3.34%)
Train/validation/test split
      Train encounters, n (%)3,557,487 (80.0%)
      Train tokens/windows560 million/8.9 million
      Validation encounters, n (%)445,165 (10.0%)
      Validation tokens/windows71 million/1.1 million
      Test encounters, n (%)444,973 (10.0%)
      Test tokens/windows71 million/1.1 million
Disclaimer/Publisher’s Note: The statements, opinions and data contained in all publications are solely those of the individual author(s) and contributor(s) and not of MDPI and/or the editor(s). MDPI and/or the editor(s) disclaim responsibility for any injury to people or property resulting from any ideas, methods, instructions or products referred to in the content.