
A Data-Driven Informatics Framework for Evaluating Thai Provinces Using an Additive Weighting-Based Variant Assessment Algorithm and Two-Stage DEA


Abstract
1. Introduction
- (1)
- To develop an informatics-oriented framework for screening and evaluating Thai provinces using AWVAA and CCR-based DEA;
- (2)
- To identify representative decision-making units from the national provincial dataset through a structured multi-criteria screening procedure;
- (3)
- To assess and benchmark the relative performance of the selected provinces using overall CCR efficiency and super-efficiency evaluation.
2. Literature Review
3. Related Methods
3.1. Simple Additive Weighting (SAW)
3.2. Additive Weighting-Based Variant Assessment Algorithm (AWVAA)
3.3. Two-Stage Data Envelopment Analysis (TSDEA)
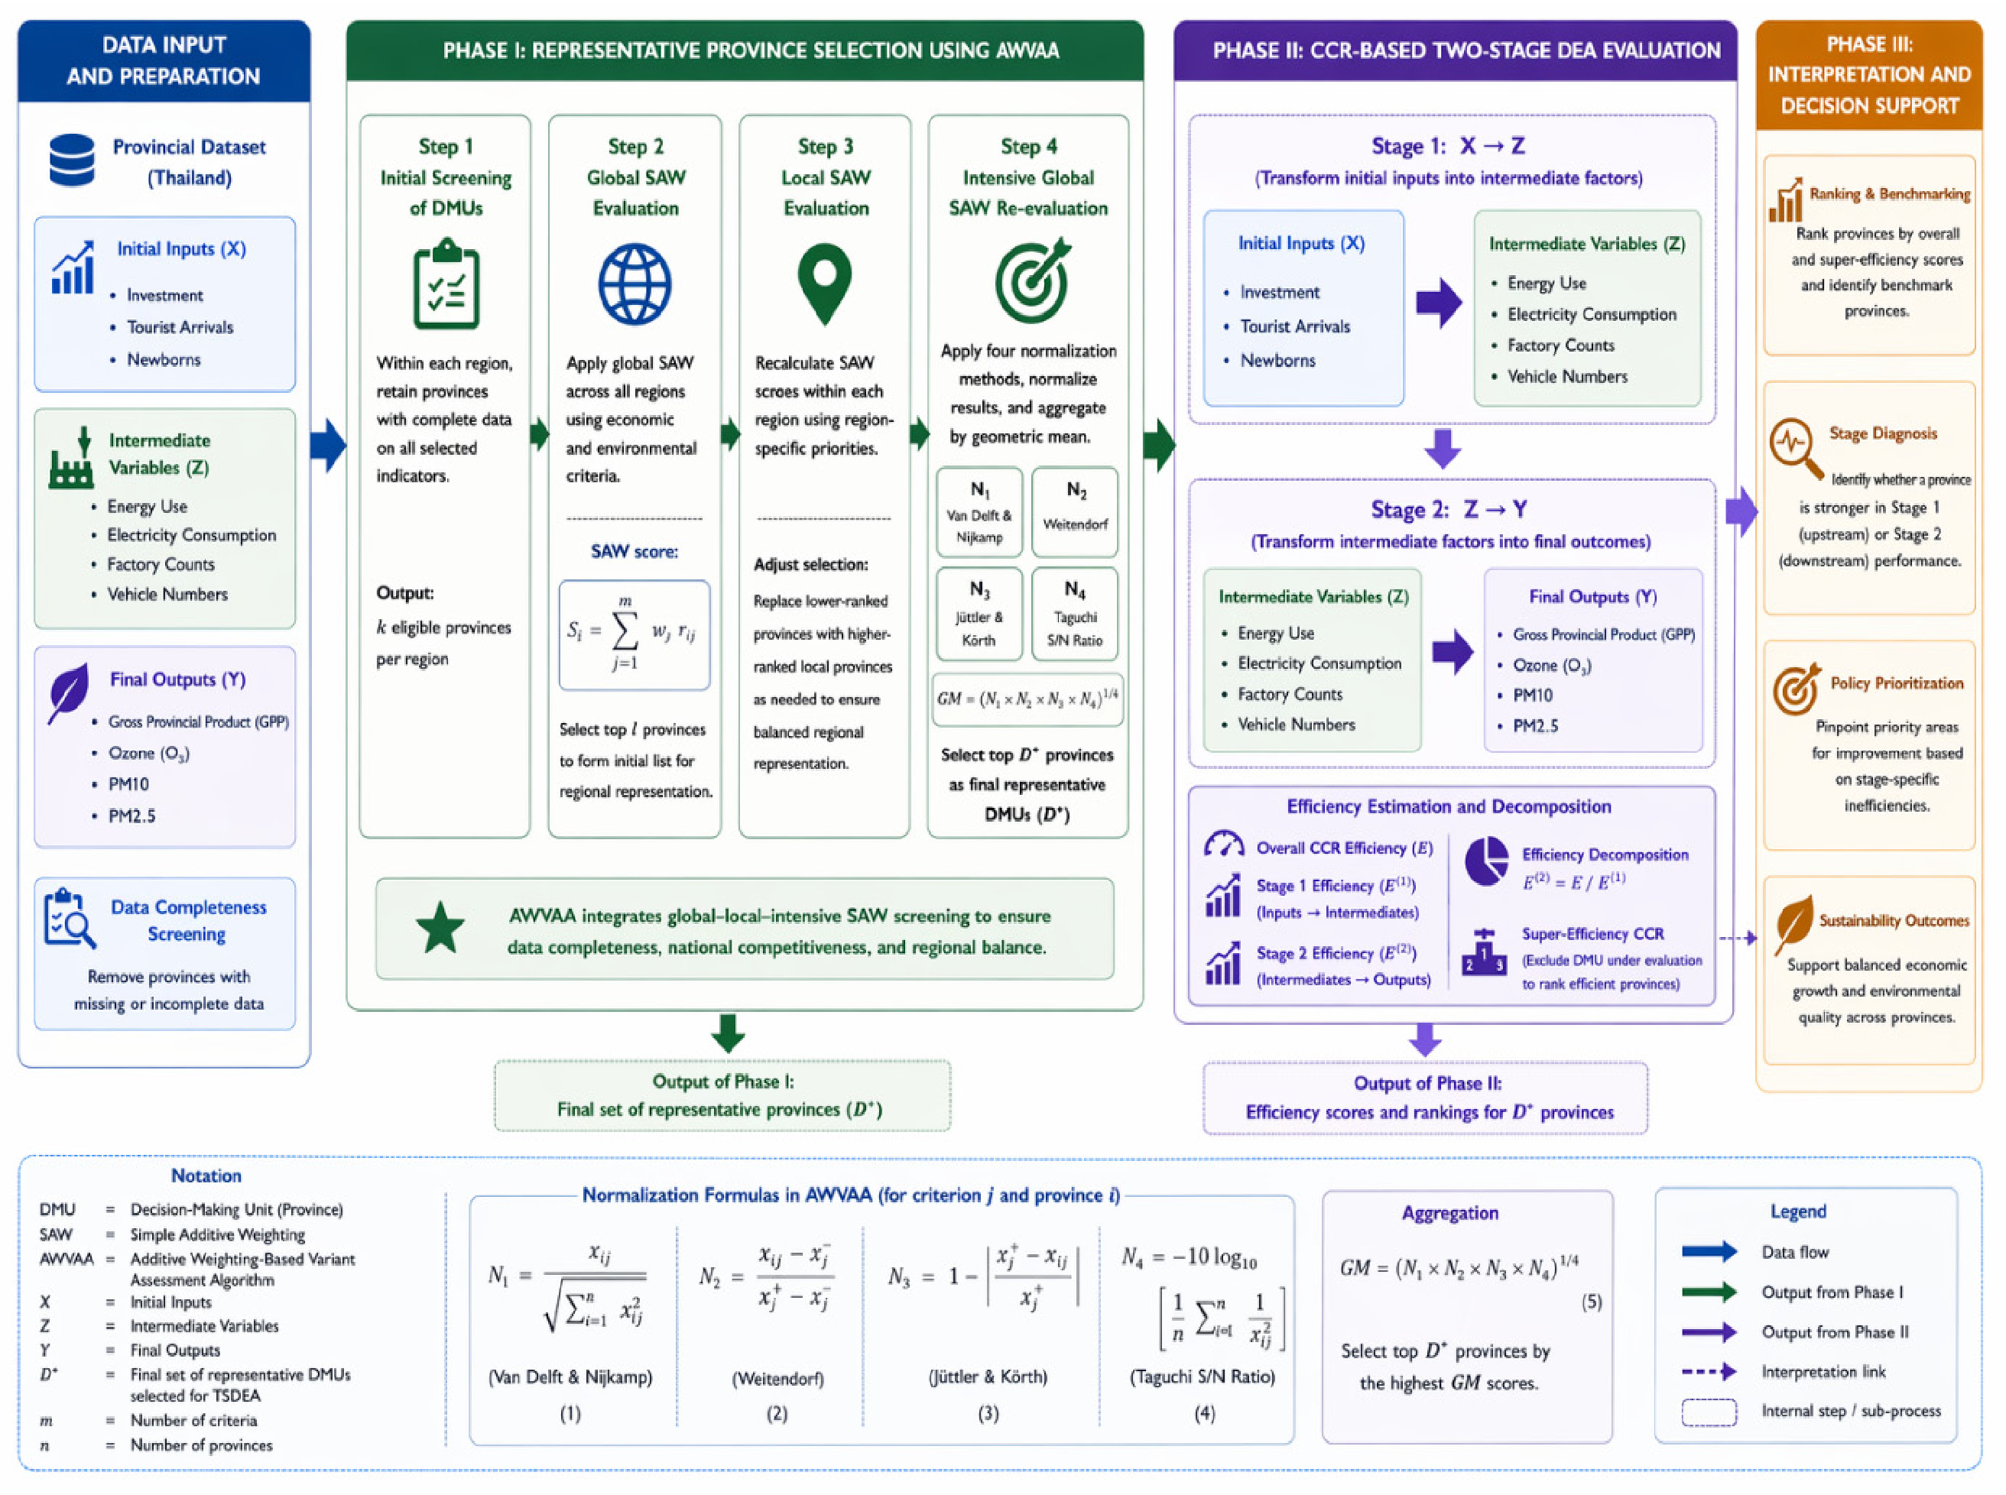
3.4. Data Normalization and Integrated Evaluation Logic
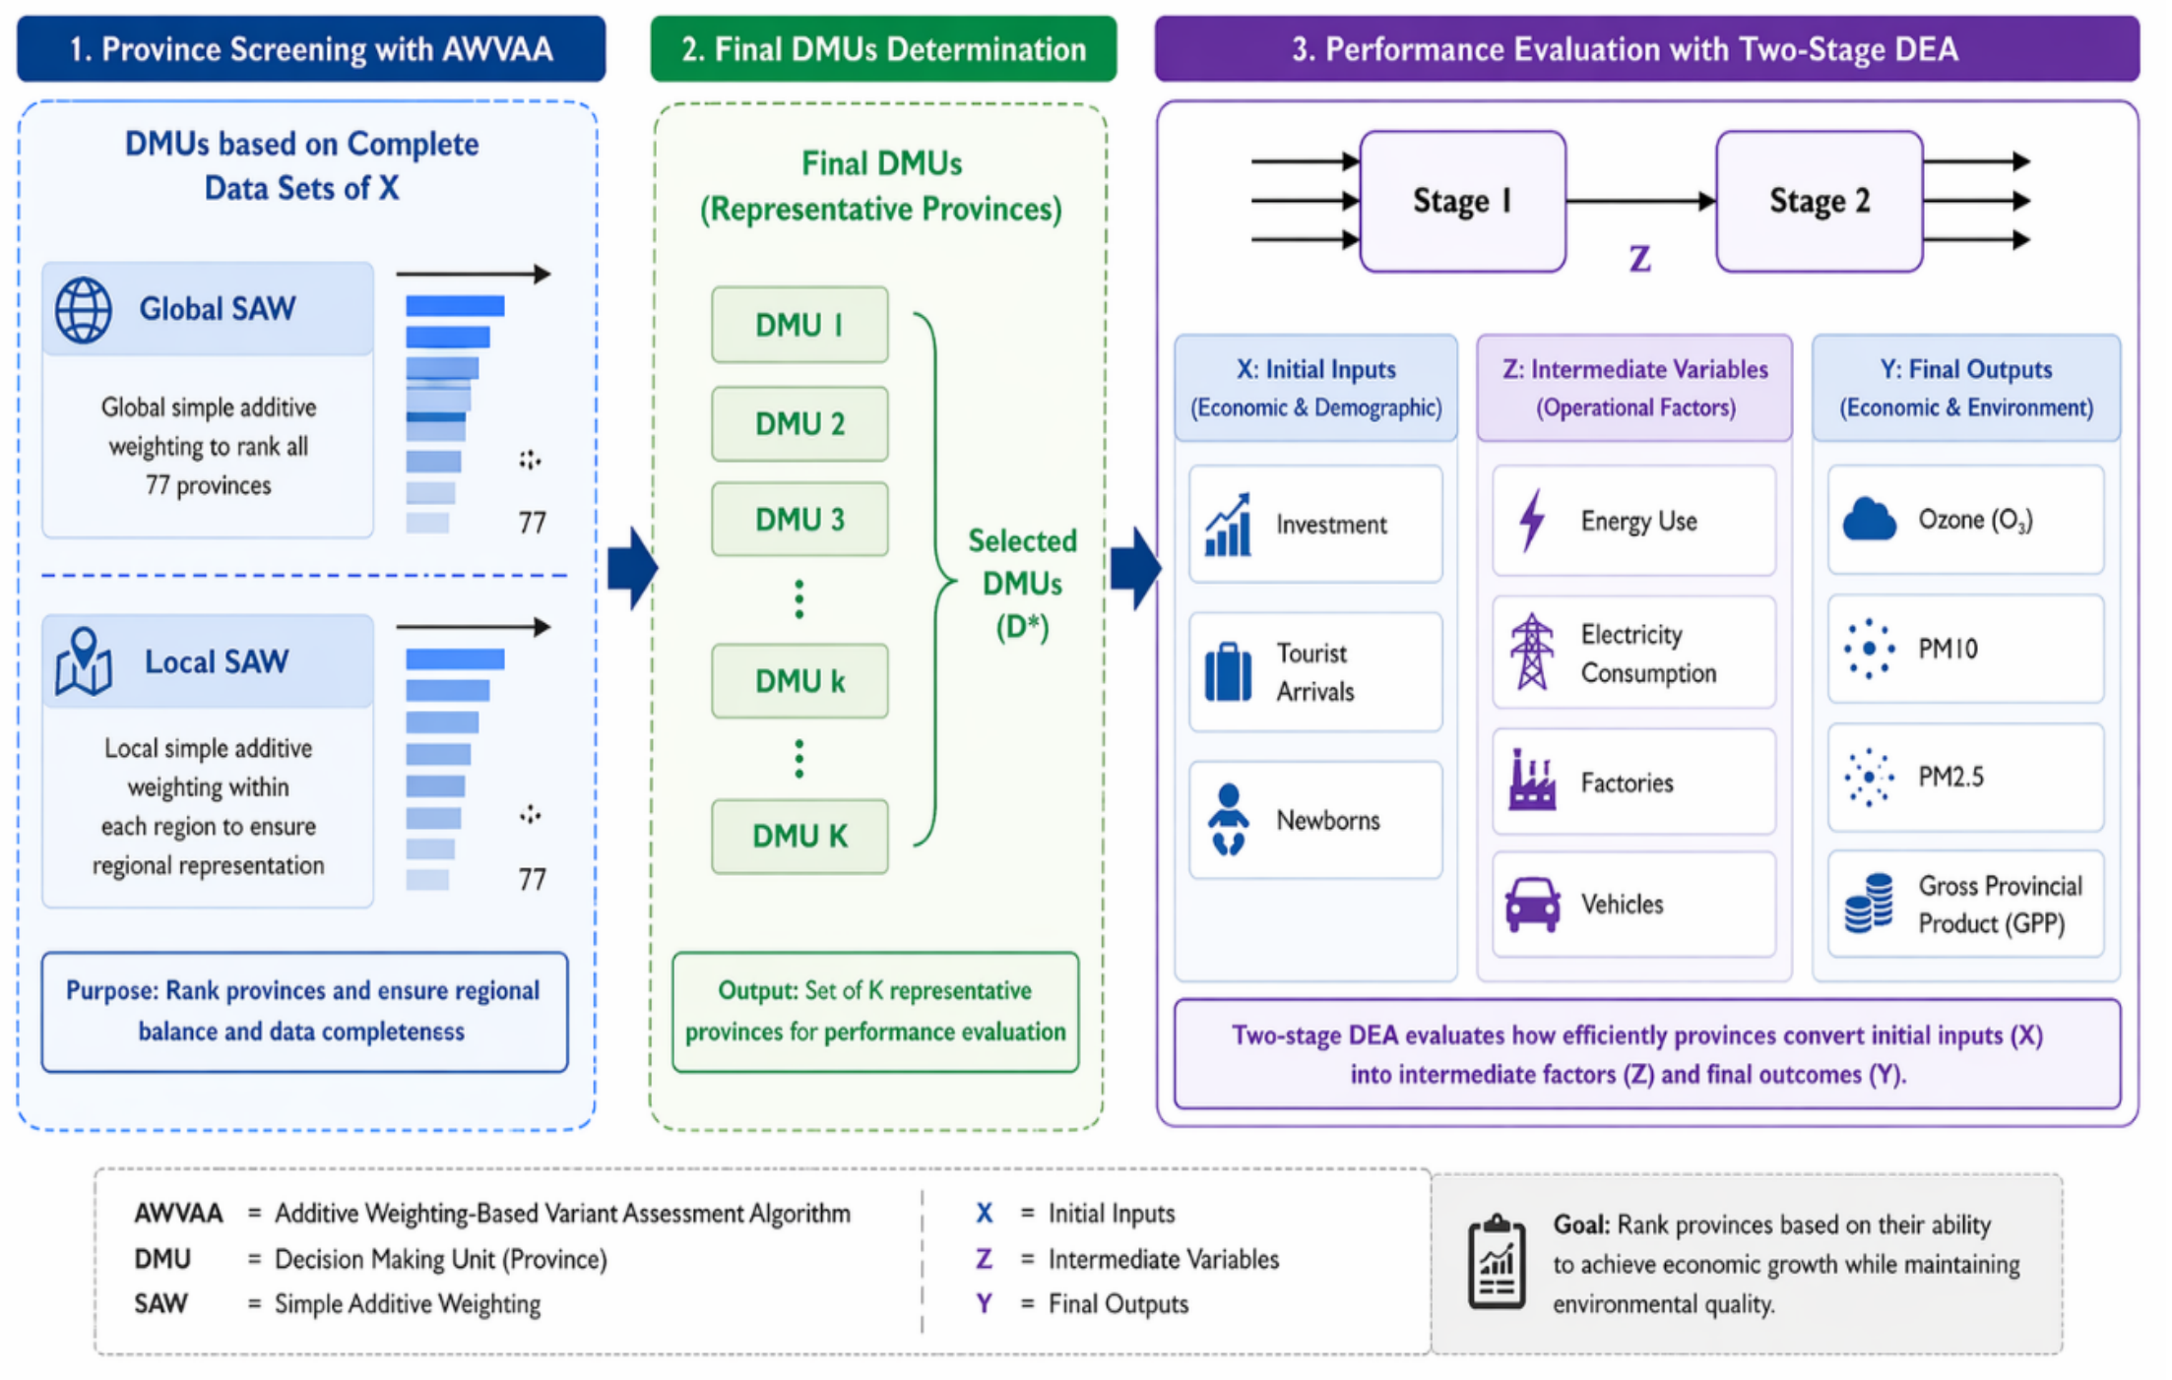
4. The Proposed Data-Driven Informatics Framework
4.1. AWVAA-Based Screening of Representative Provinces
4.2. CCR-Based Two-Stage DEA Evaluation
4.3. CCR Super-Efficiency Extension for Ranking Efficient Provinces
4.4. Analytical Workflow and Interpretation Logic
5. Results and Discussion
5.1. Results of AWVAA-Based Screening of Representative Provinces
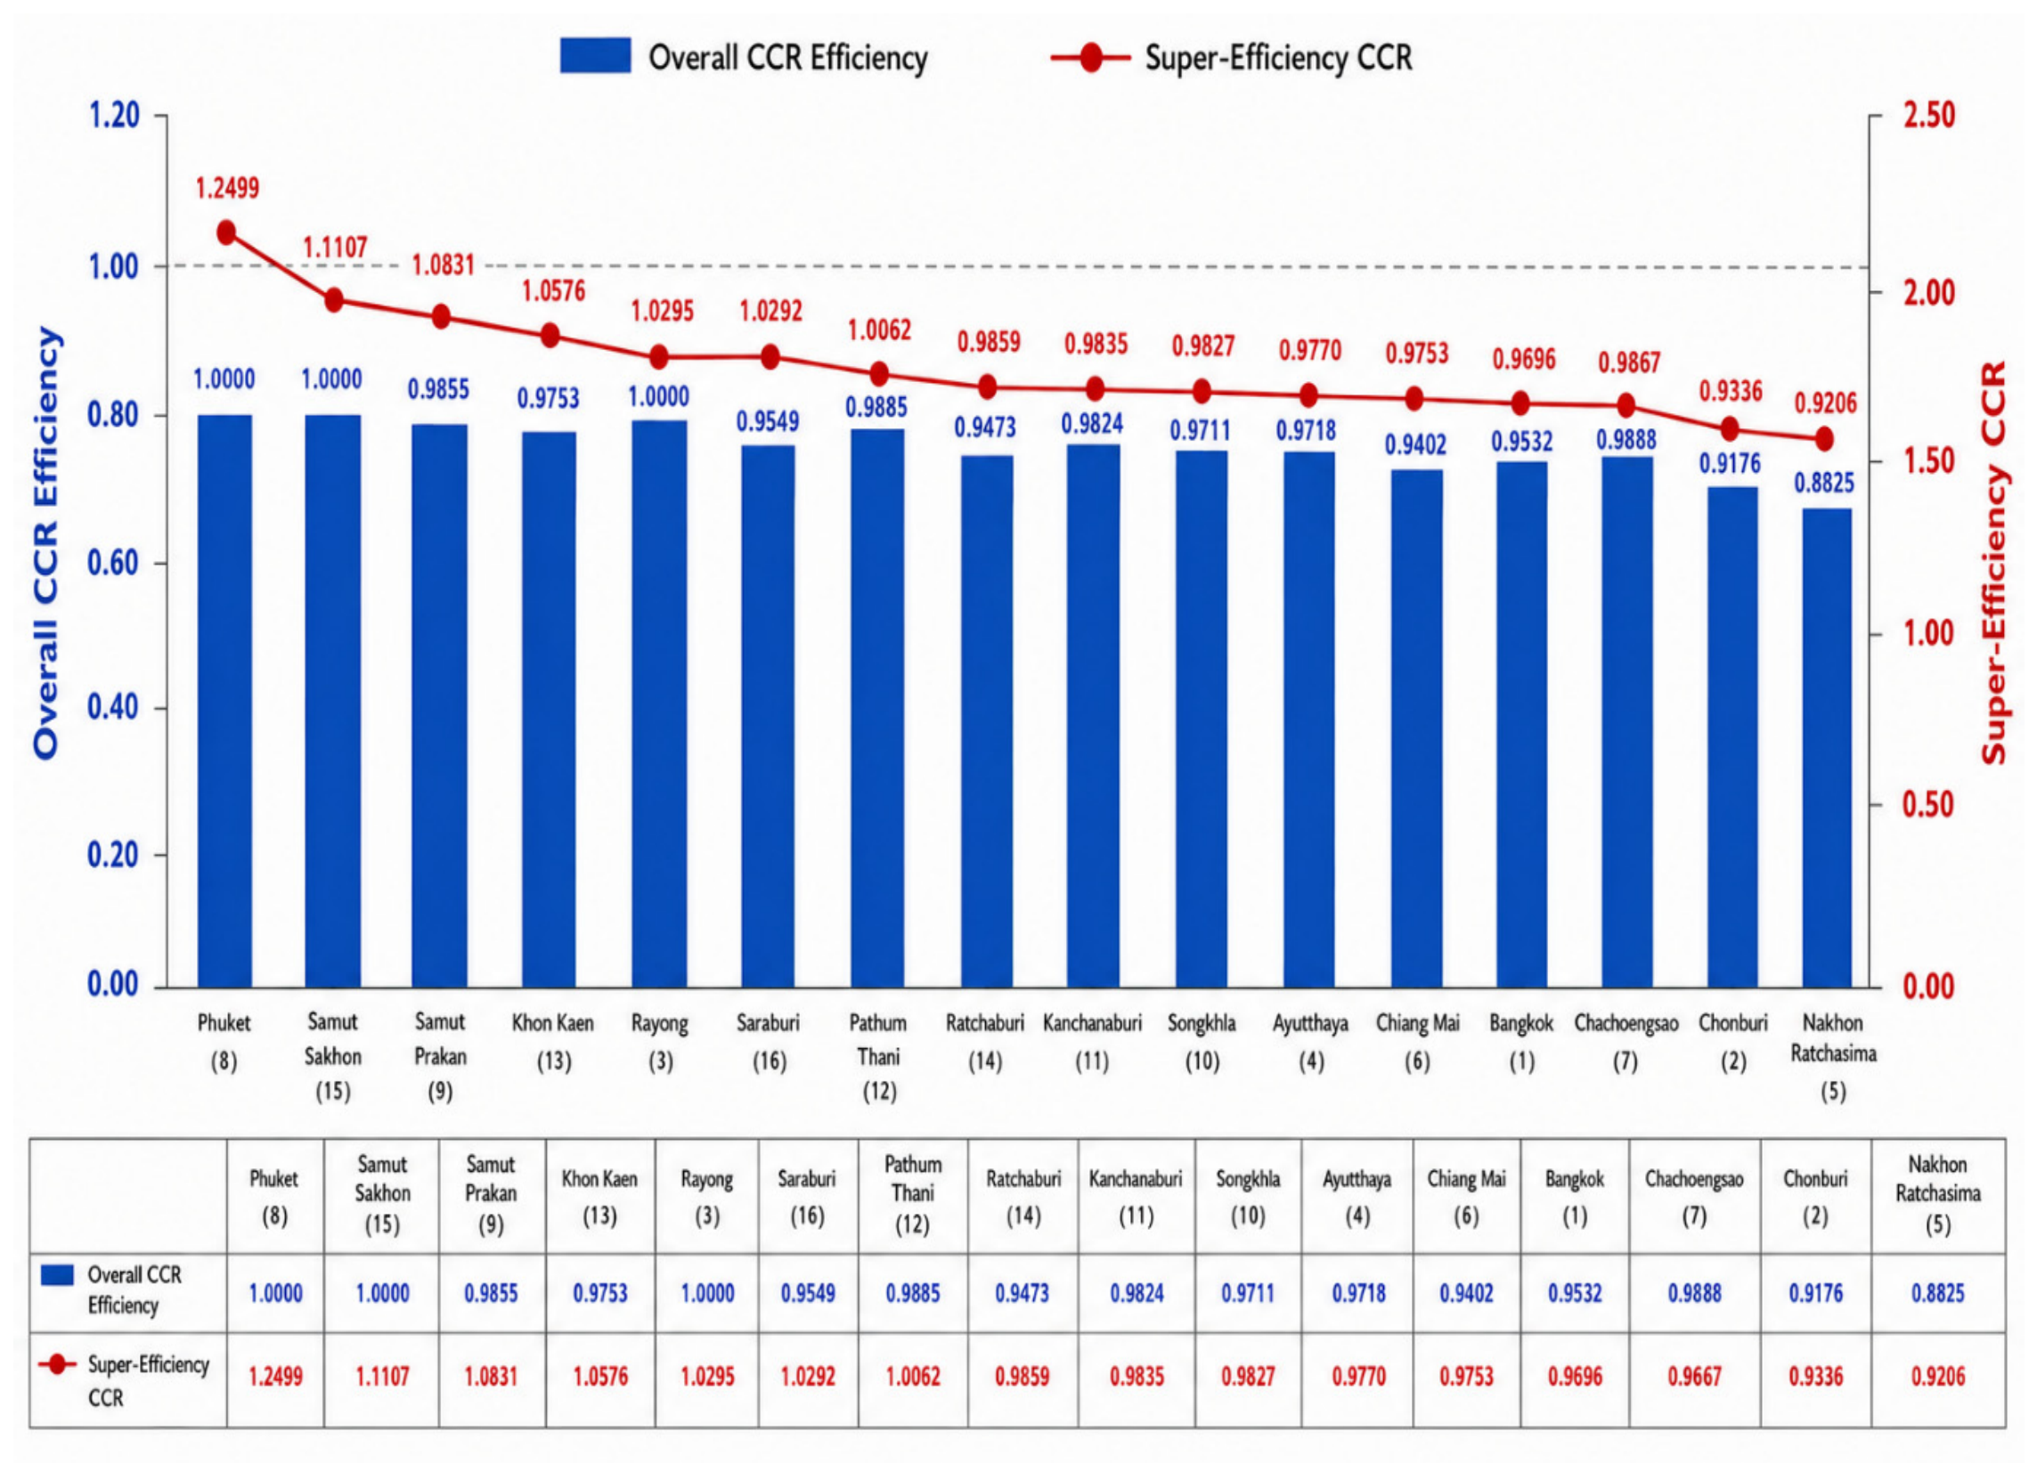
5.2. Results of CCR-Based Two-Stage DEA Evaluation
5.3. Interpretation of Overall Efficiency and Super-Efficiency Results
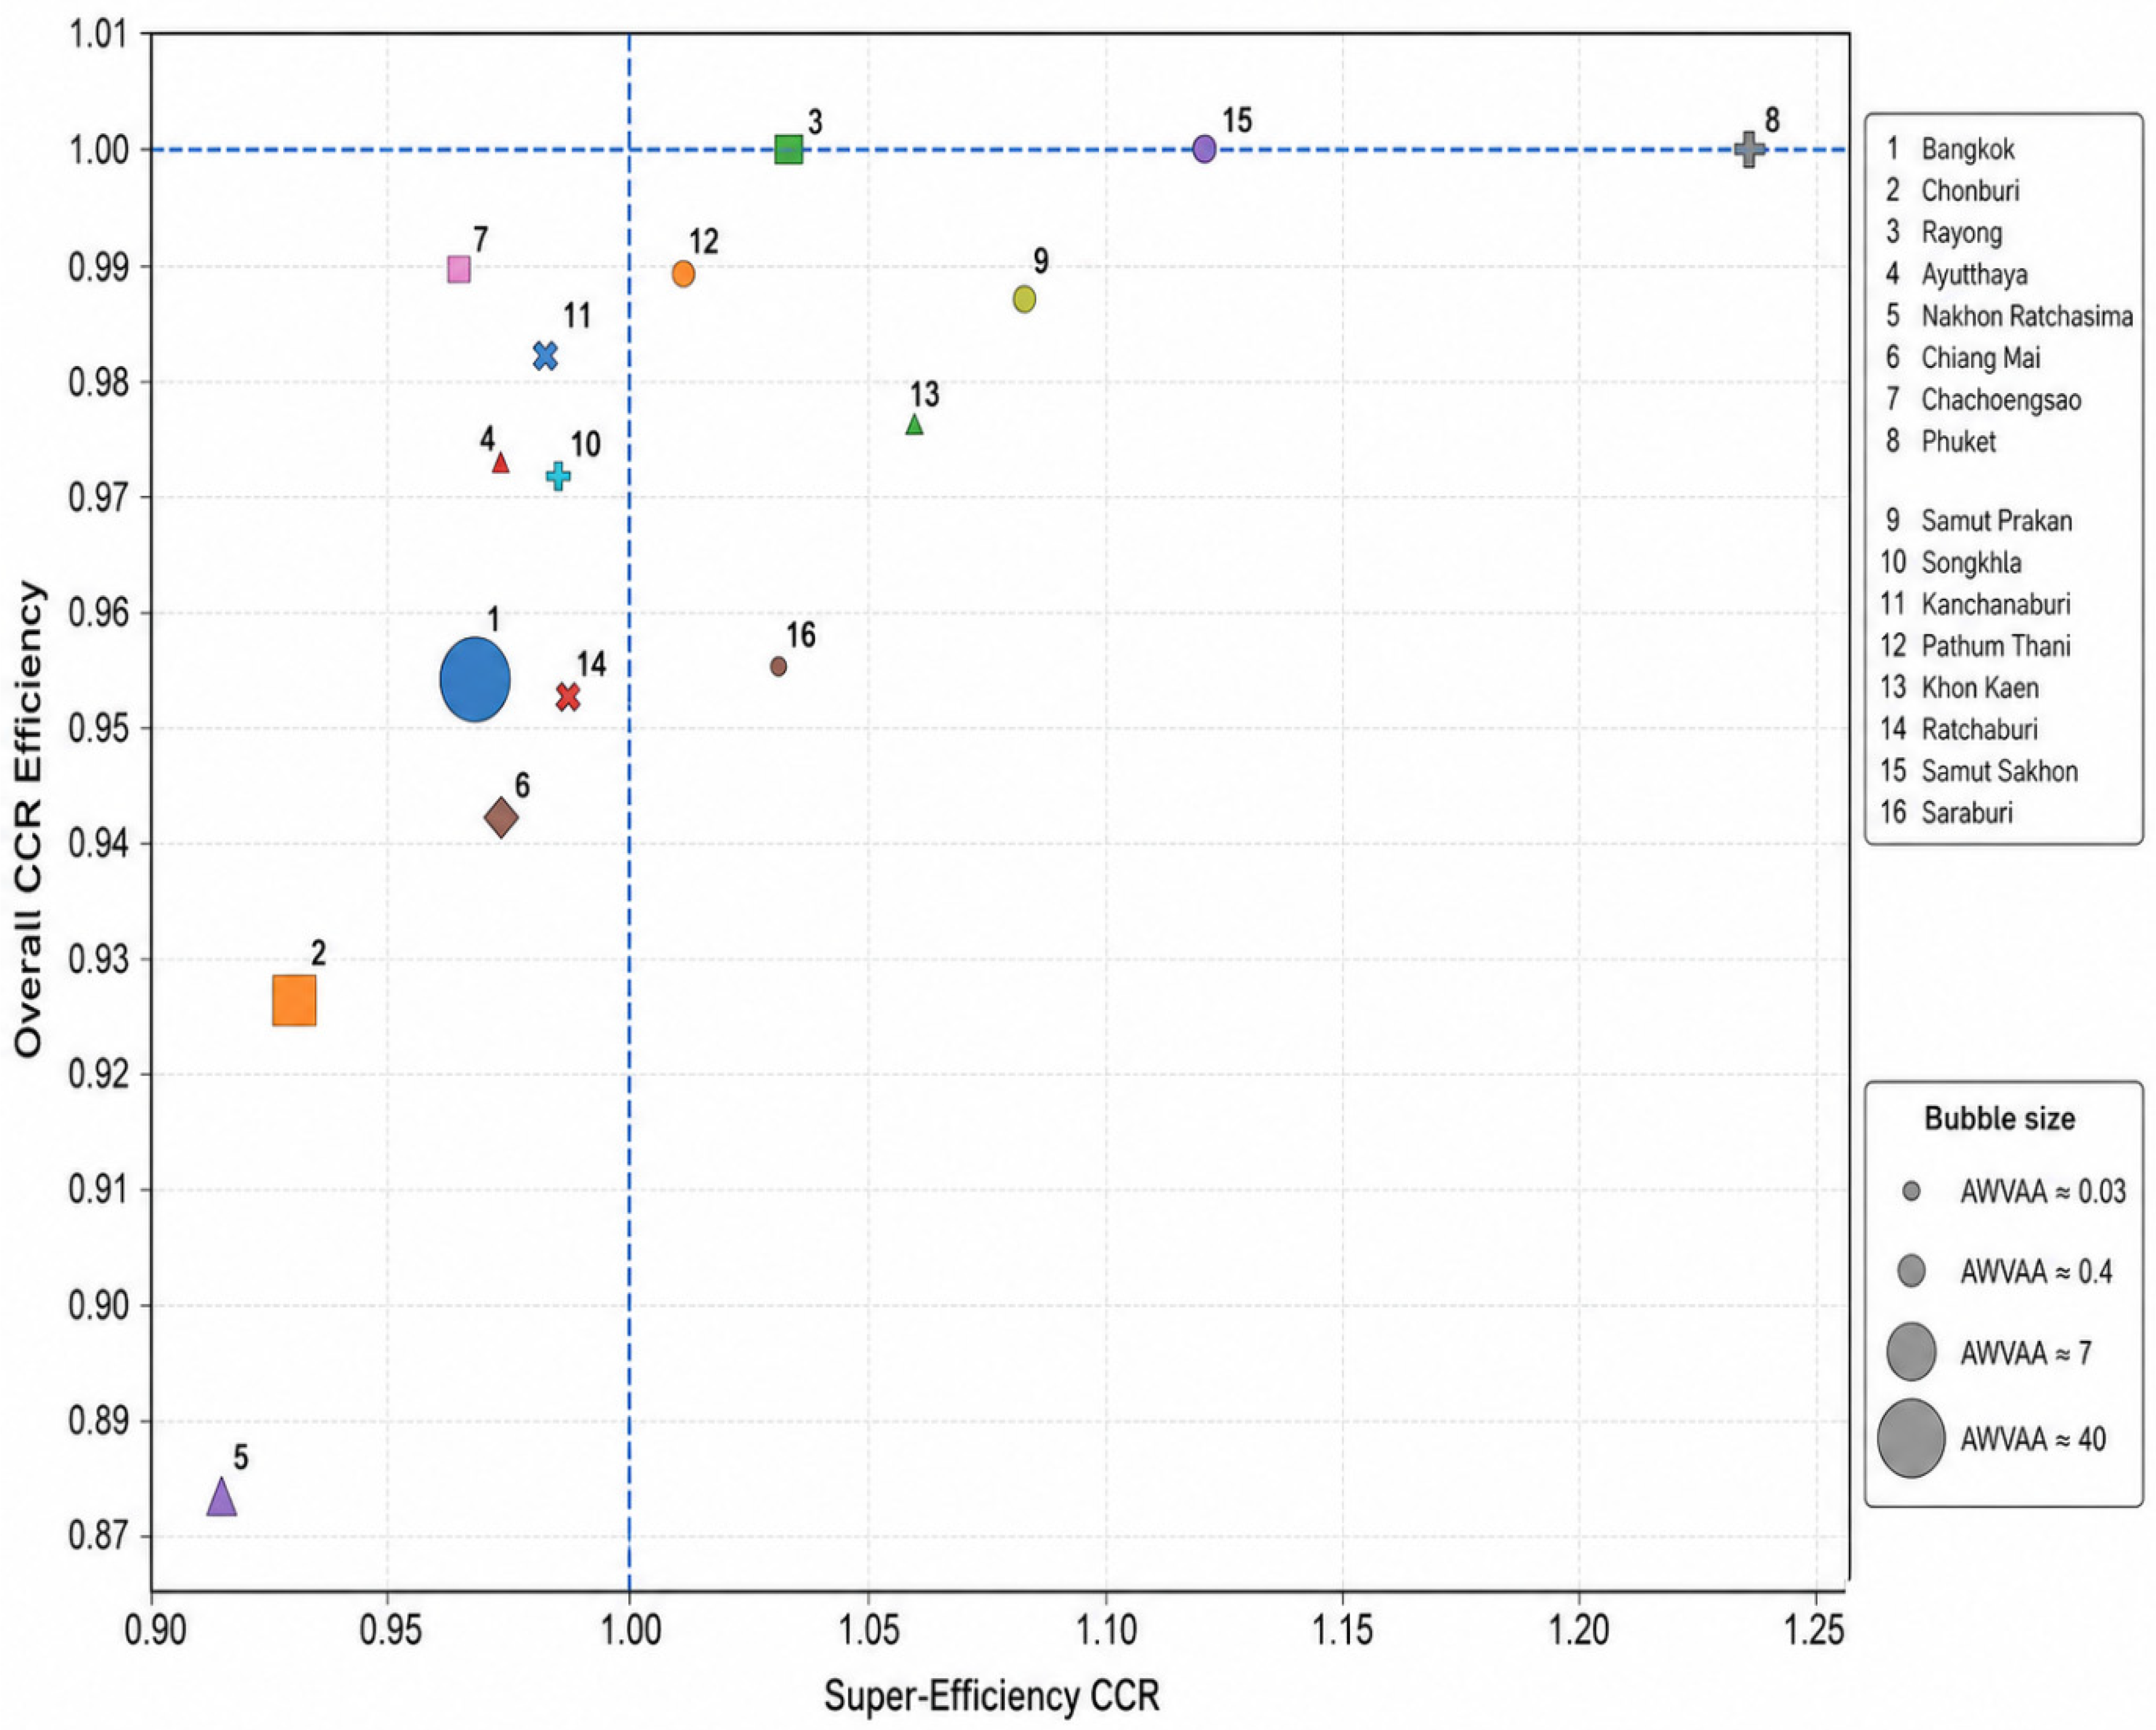
5.4. Relationship Between Screening Strength and Efficiency Performance
5.5. Policy Interpretation and Benchmarking Implications
5.6. Discussion in Relation to the Proposed Framework
5.7. Limitations of the Empirical Analysis
6. Conclusions, Limitations, and Future Studies
Author Contributions
Funding
Institutional Review Board Statement
Informed Consent Statement
Data Availability Statement
Acknowledgments
Conflicts of Interest
References
- Wang, S.Y.; Wu, F.; Zhou, P. Measuring urban environmental performance in China: A Euclidean distance function approach. J. Environ. Manag. 2024, 361, 121272. [Google Scholar] [CrossRef]
- Krmac, E.; Djordjević, B. Port environmental efficiency assessment using the one-stage and two-stage model DEA: Comparison of Koper and Dublin ports. Environ. Dev. Sustain. 2024, 26, 10397–10427. [Google Scholar]
- Othman, M.; Latif, M.T.; Abdul Halim, N.D. Environmental performance of Malaysia’s air pollutants based on data envelopment analysis with slack-based measure and Malmquist productivity index. Environ. Res. Lett. 2023, 18, 124049. [Google Scholar] [CrossRef]
- Yang, S.; Zhang, L.; Chen, Z.; Li, N. Efficiency evaluation of government investment for air pollution control in city clusters: A case from the Beijing-Tianjin-Hebei areas in China. Front. Eng. Manag. 2023, 10, 612–624. [Google Scholar] [CrossRef]
- Zheng, Z.; Xiao, W.; Cheng, Z. China’s green total factor energy efficiency assessment based on coordinated reduction in pollution and carbon emission: From the 11th to the 13th five-year plan. Sustainability 2023, 15, 7301. [Google Scholar] [CrossRef]
- Ghaemi-Zadeh, N.; Eghbali-Zarch, M. Evaluation of business strategies based on the financial performance of the corporation and investors’ behavior using D-CRITIC and fuzzy MULTI-MOORA techniques: A real case study. Expert Syst. Appl. 2024, 247, 123183. [Google Scholar] [CrossRef]
- Wati, M.; Hasanah, S.U.; Jamil, M.; Tejawati, A.; Hatta, H.R. Comparison SAW, TOPSIS and MOORA to evaluation socio-economic welfare. In Proceedings of the 6th International Conference on Computing and Applied Informatics 2022; AIP Publishing: Melville, NY, USA, 2024; Volume 2987, p. 020025. [Google Scholar]
- Tirkolaee, E.B.; Simic, V.; Ghobakhloo, M.; Foroughi, B.; Asadi, S.; Iranmanesh, M. Integrated design of a sustainable waste management system with co-modal transportation network: A robust bi-level decision support system. J. Clean. Prod. 2024, 449, 141760. [Google Scholar] [CrossRef]
- Ruiz-Vélez, A.; García, J.; Alcalá, J.; Yepes, V. Sustainable road infrastructure decision-making: Custom NSGA-II with repair operators for multi-objective optimization. Mathematics 2024, 12, 730. [Google Scholar] [CrossRef]
- Shahidin, M.; Mohd Razif, N. Integration of multi criteria decision making (MCDM) method with Weighted Floyd Warshall Algorithm (WFWA) in order picking route optimisation: A case study. In Proceedings of the 29th National Symposium on Mathematical Sciences; AIP Publishing: Melville, NY, USA, 2024; Volume 2905, p. 030015. [Google Scholar]
- Trung, D.D.; Giang, N.T.P.; Duc, D.V.; Dua, T.V.; Thinh, H.X. The Use of SAW, RAM and PIV decision methods in determining the optimal choice of materials for the manufacture of screw gearbox acceleration boxes. Int. J. Mech. Eng. Robot. Res. 2024, 13, 338–347. [Google Scholar] [CrossRef]
- Nuriyev, M.; Nuriyev, A.; Mammadov, J. Renewable energy transition task solution for the oil countries using scenario-driven fuzzy multiple-criteria decision-making models: The case of Azerbaijan. Energies 2023, 16, 8068. [Google Scholar] [CrossRef]
- Mhana, K.H.; Awad, H.A. An ideal location selection of electric vehicle charging stations: Employment of integrated analytical hierarchy process with geographical information system. Sustain. Cities Soc. 2024, 107, 105456. [Google Scholar] [CrossRef]
- Sorkhan, F.M.; Roumi, S.; Zarandi, M.S.; Ganjouei, M.A.A. The impact of indoor environmental quality on occupant satisfaction in commercial buildings: A comparison of building expert opinions and residents’ experiences. Energies 2024, 17, 1473. [Google Scholar] [CrossRef]
- Mohamed Nusaf, A.; Kumaravel, R. Assessment of polluted region using an integrated weighting approach and fuzzy VIKOR method. J. Intell. Fuzzy Syst. 2024, 46, 2649–2663. [Google Scholar] [CrossRef]
- Wang, L.; Su, Y. Economic loss and financial risk assessment of ecological environment caused by environmental pollution under big data. Sustainability 2023, 15, 3834. [Google Scholar] [CrossRef]
- Zhang, L.; Peng, N.; Zhu, R. Research on the evaluation of ecological environment quality based on Fuzzy and PCA-AHP. In Proceedings of SPIE—The International Society for Optical Engineering; SPIE: Bellingham, WA, USA, 2023; Volume 12804, p. 1280406. [Google Scholar]
- Abdullah, G.; Dwitasari, N.A.; Setiorini, A.H.; Hakim, D.L. Comparative analysis of AHP and fuzzy AHP for solar power plant site selection. J. Eng. Sci. Technol. 2021, 16, 3505–3520. [Google Scholar]
- Wu, D.; Li, H.; Huang, Q.; Li, C.; Liang, S. Measurement and determinants of smart destinations’ sustainable performance: A two-stage analysis using DEA-Tobit model. Curr. Issues Tour. 2024, 27, 529–545. [Google Scholar]
- Huang, K.-Y.; Chiu, Y.-H.; Chang, T.-H.; Lin, T.-Y. The effect of extreme temperature on electricity consumption, air pollution, and gross domestic product. Energy Environ. 2024, 35, 372–394. [Google Scholar]
- He, K.; Zhu, N. Efficiency evaluation of Chinese provincial industry systems: A dynamic two-stage slacks-based measure with shared inputs. J. Ind. Manag. Optim. 2023, 19, 4959–4988. [Google Scholar] [CrossRef]
- Zhang, L.; Zhao, L.; Zha, Y. Efficiency evaluation of Chinese regional industrial systems using a dynamic two-stage DEA approach. Socio-Econ. Plan. Sci. 2021, 77, 101031. [Google Scholar] [CrossRef]
- Halkos, G.; Argyropoulou, G. Modeling energy and air pollution health damaging: A two-stage DEA approach. Air Qual. Atmos. Health 2021, 14, 1221–1231. [Google Scholar] [CrossRef]
- Moutinho, V.; Madaleno, M. A two-stage DEA model to evaluate the technical eco-efficiency indicator in the EU countries. Int. J. Environ. Res. Public Health 2021, 18, 3038. [Google Scholar] [CrossRef] [PubMed]
- Kao, C.; Hwang, S.N. Efficiency decomposition in two-stage data envelopment analysis: An application to non-life insurance companies in Taiwan. Eur. J. Oper. Res. 2008, 185, 418–429. [Google Scholar] [CrossRef]
- Chen, Y.; Cook, W.D.; Li, N.; Zhu, J. Additive efficiency decomposition in two-stage DEA. Eur. J. Oper. Res. 2009, 196, 1170–1176. [Google Scholar] [CrossRef]
- Liang, L.; Yang, F.; Cook, W.D.; Zhu, J. DEA models for two-stage processes: Game approach and efficiency decomposition. Nav. Res. Logist. 2008, 55, 643–653. [Google Scholar] [CrossRef]
- Li, H.; Chen, C.; Cook, W.D.; Zhang, J.; Zhu, J. Two-stage network DEA: Who is the leader? Omega 2018, 74, 15–19. [Google Scholar] [CrossRef]
- Anandarao, S.; Durai, S.R.S.; Goyari, P. Efficiency Decomposition in two-stage Data Envelopment Analysis: An application to Life Insurance companies in India. J. Quant. Econ. 2019, 17, 271–285. [Google Scholar]
- Aungkulanon, P.; Montemanni, R.; Nanphang, A.; Luangpaiboon, P. Data-Driven Informatics Framework for Regional Sustainability: Integrating Twin Mean-Variance Two-Stage DEA with Decision Analytics. Informatics 2025, 12, 92. [Google Scholar] [CrossRef]
- Charnes, A.; Cooper, W.W.; Rhodes, E. Measuring the efficiency of decision making units. Eur. J. Oper. Res. 1978, 2, 429–444. [Google Scholar] [CrossRef]
- Gardziejczyk, W.; Zabicki, P. Normalization and variant assessment methods in selection of road alignment variants: Case study. J. Civ. Eng. Manag. 2017, 23, 510–523. [Google Scholar] [CrossRef]
- Banker, R.D.; Charnes, A.; Cooper, W.W. Some models for estimating technical and scale inefficiencies in data envelopment analysis. Manag. Sci. 1984, 30, 1078–1092. [Google Scholar] [CrossRef]



| Study | Application Focus | Analytical Approach | Key Contribution | Relevance to the Present Study |
|---|---|---|---|---|
| Wang et al. (2024) [1] | Urban environmental performance in China | Euclidean distance function | Examines the balance between economic production and environmental protection | Supports the need to jointly evaluate economic and environmental outcomes |
| Krmac and Djordjević (2024) [2] | Port environmental efficiency | One-stage and two-stage DEA | Compares single-stage and multi-stage efficiency structures | Shows the value of two-stage modeling for environmental performance analysis |
| Othman et al. (2023) [3] | Air pollutant performance in Malaysia | DEA, SBM, MPI, PCA | Integrates efficiency and environmental indicators in pollution-related analysis | Demonstrates the relevance of DEA for environmental assessment |
| Yang et al. (2023) [4] | Government investment in air pollution control | Three-stage DEA-Malmquist model | Evaluates public investment efficiency in pollution control | Supports the use of DEA in policy-oriented environmental evaluation |
| Zheng et al. (2023) [5] | Green energy efficiency and pollution reduction | Non-radial DEA | Assesses coordinated environmental and energy performance | Reinforces the importance of multi-output sustainability assessment |
| Ghaemi-Zadeh and Eghbali-Zarch (2024) [6] | Business strategy evaluation | D-CRITIC, fuzzy MULTI-MOORA, SAW, TOPSIS, VIKOR | Compares multiple ranking methods in a decision-making setting | Illustrates the continuing usefulness of SAW in structured screening |
| Wati et al. (2024) [7] | Socio-economic welfare evaluation | SAW, TOPSIS, MOORA | Compares alternative MCDM methods for ranking welfare performance | Supports the use of SAW as a transparent screening method |
| Tirkolaee et al. (2024) [8] | Sustainable waste management design | Robust optimization, weighted goal programming, SAW | Integrates MCDM into a sustainability-oriented planning framework | Shows that SAW can support complex sustainability decisions |
| Ruiz-Vélez et al. (2024) [9] | Sustainable transport infrastructure | NSGA-II, SAW, FUCA, LCA | Combines optimization and sustainability assessment methods | Highlights the role of multi-criteria screening in infrastructure decisions |
| Shahidin and Mohd Razif (2024) [10] | Warehouse route optimization | Entropy, SAW, WFWA | Uses SAW for practical ranking and route selection | Supports SAW’s interpretability in applied decision contexts |
| Trung et al. (2024) [11] | Engineering material selection | SAW, RAM, PIV, Entropy, LOPCOW | Applies SAW in technical selection and ranking problems | Confirms the flexibility of SAW across domains |
| Nuriyev et al. (2023) [12] | Renewable energy transition | Fuzzy SAW, fuzzy TOPSIS, fuzzy MOORA, fuzzy VIKOR | Incorporates uncertainty into MCDM-based energy planning | Shows extensions of weighting-based ranking under uncertain conditions |
| Mhana and Awad (2024) [13] | EV charging station siting | AHP, FAHP, GIS, MCDA | Integrates spatial analysis and multi-criteria decision tools | Relevant to regional and location-based sustainability assessment |
| Mokhtariyan Sorkhan et al. (2024) [14] | Indoor environmental quality | FAHP | Uses fuzzy prioritization for environmental quality evaluation | Demonstrates the use of weighted judgment in environmental studies |
| Mohamed Nusaf and Kumaravel (2024) [15] | Polluted region assessment | FAHP, Entropy, fuzzy VIKOR | Combines weighting and environmental risk evaluation | Supports multi-criteria approaches to environmental assessment |
| Wang and Su (2023) [16] | Environmental pollution risk | Improved AHP | Evaluates economic loss and financial risk from pollution | Links environmental quality with broader economic implications |
| Zhang et al. (2023) [17] | Ecological environment quality | Fuzzy evaluation, PCA-AHP | Integrates multiple indicators into ecological quality assessment | Relevant to composite regional sustainability measurement |
| Abdullah et al. (2021) [18] | Solar power plant site selection | AHP, Fuzzy AHP | Compares structured decision approaches for location selection | Supports multi-criteria screening logic in sustainability planning |
| Wu et al. (2024) [19] | Smart tourism sustainability | DEA-Tobit model | Examines sustainable destination performance using DEA | Shows DEA’s usefulness in digital and sustainability contexts |
| Huang et al. (2024) [20] | GDP, temperature, and pollution | Two-stage meta undesirable EBM | Models economic and environmental interactions in a multi-stage structure | Supports the use of two-stage models for linked sustainability outcomes |
| He and Zhu (2023) [21] | Industrial pollution control | Dynamic two-stage SBM with shared inputs | Evaluates industrial systems with environmental carry-over effects | Reinforces the value of multi-stage DEA in pollution control |
| Zhang, Zhao, and Zha (2021) [22] | Regional industrial systems | Dynamic two-stage DEA | Assesses production and abatement efficiency jointly | Shows the importance of linked-stage efficiency analysis |
| Halkos and Argyropoulou (2021) [23] | Energy use and air pollution health impacts | Modified multiplicative two-stage DEA | Connects energy, pollution, and health impacts through two-stage efficiency analysis | Closely related to joint economic-environmental assessment |
| Moutinho and Madaleno (2021) [24] | Eco-efficiency in EU countries | Two-stage DEA and fractional regression | Evaluates environmental and economic performance together | Supports two-stage DEA for regional sustainability studies |
| Kao and Hwang (2008) [25] | Two-stage efficiency decomposition | Relational two-stage DEA | Provides a foundation for decomposing system and stage efficiencies | Forms the theoretical basis for the two-stage DEA structure used here |
| Chen et al. (2009) [26] | Additive efficiency decomposition | Two-stage DEA | Defines overall efficiency as a weighted combination of stage efficiencies | Supports the interpretation of linked-stage performance |
| Liang et al. (2008) [27] | Two-stage DEA with game structure | DEA game approach | Models leader-follower relationships between stages | Relevant background for stage interaction, though not central in the revised paper |
| Li et al. (2018) [28] | Stage leadership in two-stage network DEA | Network DEA | Examines which stage dominates overall system performance | Provides context for inter-stage efficiency interpretation |
| Anandarao et al. (2019) [29] | Life insurance company performance | Two-stage DEA decomposition | Applies stage-based decomposition in practice | Demonstrates the practical use of two-stage efficiency analysis |
| Aungkulanon et al. (2025) [30] | Regional sustainability assessment in Thai provinces | Twin mean-variance two-stage DEA integrated with desirability-based decision analytics | Develops an informatics-oriented framework that evaluates both efficiency and stability in economic and environmental performance across regions | Demonstrates the growing use of informatics-driven DEA frameworks for Thai provincial sustainability benchmarking and supports the present study’s emphasis on data-driven regional evaluation |
| Component | Conventional SAW-Based Screening | Proposed AWVAA |
|---|---|---|
| Main purpose | Ranking alternatives based on weighted normalized scores | Selecting representative and DEA-ready DMUs from a heterogeneous provincial dataset |
| Comparison structure | Usually one global comparison across all alternatives | Combined global comparison and local regional comparison |
| Regional representation | Not explicitly considered | Explicitly incorporated through local SAW screening within regions |
| Normalization approach | Usually relies on one normalization method | Uses multiple normalization variants for intensive re-evaluation |
| Aggregation logic | Weighted summation of normalized criteria | Weighted scoring followed by geometric-mean aggregation across normalization variants |
| Final output | Ranked list of alternatives | Representative DMU set for subsequent CCR-based TSDEA benchmarking |
| Methodological contribution | Transparent and simple ranking | Integrated screening protocol linking data completeness, regional balance, normalization robustness, and DEA readiness |
| Normalization Metric | Normalization Metric | Normalization Metric | Normalization Metric |
|---|---|---|---|
| Van Delft and Nijkamp’s metric | Relative position between observed best and worst values | Captures each province’s relative standing within the full performance range | Useful for comparing alternatives against observed bounds |
| Weitendorf’s metric | Linear range-based scaling | Provides a transparent and interpretable MCDM normalization structure | Supports comparability across criteria measured in different units |
| Jüttler and Körth’s metric | Alternative range-based normalization | Reduces dependence on a single min–max transformation | Adds robustness to the screening process |
| Vector normalization metric | Rescaling by the Euclidean norm of alternatives under each criterion | Preserves proportional relationships while removing measurement scale effects | Useful for criteria with different magnitudes, but applied with other metrics to reduce sensitivity to extreme values |
| Geometric mean aggregation | Multiplicative synthesis of normalized metric scores | Combines multiple normalization results into a final composite score | Rewards consistency across metrics and reduces excessive compensation |
| DEA Role | Variable | Theoretical Meaning | Justification |
|---|---|---|---|
| Initial input | Investment | Capital and development resource | Represents financial capacity supporting provincial economic activity |
| Initial input | Tourist arrivals | Economic mobility and service demand | Captures tourism-related activity, consumption, and pressure on local systems |
| Initial input | Newborns | Demographic demand | Reflects population dynamics and future service/resource demand |
| Intermediate | Energy use | Resource consumption intensity | Represents operational activity generated by development inputs |
| Intermediate | Electricity consumption | Production and service intensity | Captures electricity-dependent economic and urban activity |
| Intermediate | Factory counts | Industrial concentration | Reflects manufacturing and industrial operating structure |
| Intermediate | Vehicle numbers | Transportation intensity | Captures mobility, logistics activity, and transport-related pressure |
| Final output | GPP | Desirable economic outcome | Represents provincial economic production |
| Final output | Ozone | Environmental air quality outcome | Reflects air pollution condition associated with development activity |
| Final output | PM10 | Environmental air-quality outcome | Captures particulate pollution and environmental burden |
| Final output | PM2.5 | Environmental air quality outcome | Captures fine particulate pollution relevant to sustainability and public health |
| DMU | Province | Region | AWVAA Score |
|---|---|---|---|
| 1 | Bangkok | Central | 39.5049 |
| 2 | Chonburi | Eastern | 21.8479 |
| 3 | Rayong | Eastern | 6.9520 |
| 4 | Ayutthaya | Central | 0.4293 |
| 5 | Nakhon Ratchasima | Northeastern | 0.3873 |
| 6 | Chiang Mai | Northern | 0.1843 |
| 7 | Chachoengsao | Eastern | 0.1825 |
| 8 | Phuket | Southern | 0.1818 |
| 9 | Samut Prakan | Central | 0.1236 |
| 10 | Songkhla | Southern | 0.1223 |
| 11 | Kanchanaburi | Western | 0.0798 |
| 12 | Pathum Thani | Central | 0.0584 |
| 13 | Khon Kaen | Northeastern | 0.0383 |
| 14 | Ratchaburi | Western | 0.0375 |
| 15 | Samut Sakhon | Central | 0.0256 |
| 16 | Saraburi | Central | 0.0219 |
| Rank | DMU | Province | Overall CCR Efficiency | CCR Super-Efficiency |
|---|---|---|---|---|
| 1 | 8 | Phuket | 1.0000 | 1.2499 |
| 2 | 15 | Samut Sakhon | 1.0000 | 1.1107 |
| 3 | 9 | Samut Prakan | 0.9855 | 1.0831 |
| 4 | 13 | Khon Kaen | 0.9753 | 1.0576 |
| 5 | 3 | Rayong | 1.0000 | 1.0295 |
| 6 | 16 | Saraburi | 0.9549 | 1.0292 |
| 7 | 12 | Pathum Thani | 0.9885 | 1.0062 |
| 8 | 14 | Ratchaburi | 0.9473 | 0.9859 |
| 9 | 11 | Kanchanaburi | 0.9824 | 0.9835 |
| 10 | 10 | Songkhla | 0.9711 | 0.9827 |
| 11 | 4 | Ayutthaya | 0.9718 | 0.9770 |
| 12 | 6 | Chiang Mai | 0.9402 | 0.9753 |
| 13 | 1 | Bangkok | 0.9532 | 0.9696 |
| 14 | 7 | Chachoengsao | 0.9888 | 0.9667 |
| 15 | 2 | Chonburi | 0.9176 | 0.9336 |
| 16 | 5 | Nakhon Ratchasima | 0.8825 | 0.9206 |
| Province | Performance Pattern | Interpretation | Policy Implication |
|---|---|---|---|
| Bangkok | Strong screening but moderate DEA ranking | Very high AWVAA score indicates strong screening-stage prominence, but efficiency performance is more moderate relative to frontier provinces | Important policy reference province but not the strongest DEA benchmark |
| Phuket | Strong DEA benchmark with modest AWVAA screening score | Modest screening score, but excellent overall CCR efficiency and super-efficiency performance | Benchmark for high relative sustainability efficiency, especially in tourism-oriented contexts |
| Samut Prakan | Strong DEA performer with modest screening score | Retained through representative-unit logic and performs strongly in the DEA stage | Benchmark for industrial sustainability and downstream provincial benchmarking |
| Performance Group | Province | Performance Profile | Main Implication | Suggested Policy Direction |
|---|---|---|---|---|
| DEA benchmark provinces | Phuket | Strong overall CCR efficiency and highest CCR super-efficiency, despite a modest AWVAA screening score | Demonstrates strong relative efficiency within the selected DMU set | Use as a benchmark for sustainability-oriented tourism development and efficient provincial management |
| DEA benchmark provinces | Samut Sakhon | Strong DEA performance with high super-efficiency, despite a relatively small AWVAA screening score | Illustrates that strong benchmarking value may emerge beyond the most prominent screening-stage provinces | Use as a benchmark for industrial sustainability and operational efficiency improvement |
| DEA benchmark provinces | Samut Prakan | Strong DEA performance with high super-efficiency and moderate screening-stage prominence | Combines representative selection with strong comparative efficiency | Use as a benchmark for coordinated industrial-environmental development |
| Screening-prominent but moderate DEA performers | Bangkok | Highest AWVAA screening score but more moderate super-efficiency position than leading DEA benchmark provinces | Strong relevance in the screening stage does not automatically imply strongest comparative efficiency | Maintain role as a major reference province while identifying gaps between development prominence and relative efficiency |
| Screening-prominent but moderate DEA performers | Chonburi | Very strong AWVAA score but weaker DEA ranking relative to leading benchmark provinces | Strong provincial prominence at the screening stage is not fully matched by DEA performance | Improve efficiency-oriented management and environmental performance relative to development scale |
| Screening-prominent and competitive performers | Rayong | Strong AWVAA score and high DEA ranking | Demonstrates consistency between screening-stage strength and DEA-based performance | Use as a benchmark for integrated industrial and sustainability policy planning |
| Mid-ranked benchmark-support provinces | Pathum Thani | Moderate AWVAA score and strong overall CCR performance | Supports the view that provinces with modest screening prominence may still perform strongly in DEA evaluation | Use as a supporting benchmark for balanced provincial planning |
| Mid-ranked benchmark-support provinces | Khon Kaen | Low AWVAA score but strong super-efficiency ranking | Reveals the value of the framework in identifying less prominent but highly efficient provinces | Examine as a benchmark for hidden or underrecognized provincial efficiency |
| Mid-ranked benchmark-support provinces | Saraburi | Low AWVAA score but relatively strong super-efficiency performance | Shows that smaller screening-stage presence does not prevent competitive DEA outcomes | Use as a comparative case for improvement-oriented benchmarking |
| Transitional provinces | Ayutthaya | Moderate DEA performance with stronger policy relevance than efficiency leadership | Competitive but not frontier-leading | Strengthen efficiency management while preserving balanced development performance |
| Transitional provinces | Songkhla | Moderate overall CCR efficiency and lower super-efficiency performance | Retained as a representative province but not a leading benchmark | Improve regional management and sustainability-oriented performance efficiency |
| Transitional provinces | Kanchanaburi | Moderate DEA position with limited screening prominence | Useful as a representative case but not a frontier benchmark | Improve operational efficiency and policy implementation capacity |
| Priority-improvement provinces | Chiang Mai | Lower DEA performance despite selection as a representative province | Indicates need for improvement in relative sustainability efficiency | Focus on strengthening comparative efficiency in development and environmental management |
| Priority-improvement provinces | Chachoengsao | Lower super-efficiency despite acceptable overall CCR efficiency performance | Suggests weaker relative discrimination under frontier analysis | Improve performance consistency and benchmarking competitiveness |
| Priority-improvement provinces | Ratchaburi | Lower DEA position and limited screening-stage prominence | Weak benchmarking position under both screening and evaluation logic | Prioritize efficiency improvement and targeted provincial development support |
| Priority-improvement provinces | Nakhon Ratchasima | Lowest DEA performance among the selected provinces | Represents the clearest case for policy attention under the integrated framework | Prioritize structural reform, investment efficiency, and sustainability-oriented performance improvement |
Disclaimer/Publisher’s Note: The statements, opinions and data contained in all publications are solely those of the individual author(s) and contributor(s) and not of MDPI and/or the editor(s). MDPI and/or the editor(s) disclaim responsibility for any injury to people or property resulting from any ideas, methods, instructions or products referred to in the content. |
© 2026 by the authors. Licensee MDPI, Basel, Switzerland. This article is an open access article distributed under the terms and conditions of the Creative Commons Attribution (CC BY) license.
Share and Cite
Aungkulanon, P.; Montemanni, R.; Luangpaiboon, P. A Data-Driven Informatics Framework for Evaluating Thai Provinces Using an Additive Weighting-Based Variant Assessment Algorithm and Two-Stage DEA. Informatics 2026, 13, 111. https://doi.org/10.3390/informatics13070111
Aungkulanon P, Montemanni R, Luangpaiboon P. A Data-Driven Informatics Framework for Evaluating Thai Provinces Using an Additive Weighting-Based Variant Assessment Algorithm and Two-Stage DEA. Informatics. 2026; 13(7):111. https://doi.org/10.3390/informatics13070111
Chicago/Turabian StyleAungkulanon, Pasura, Roberto Montemanni, and Pongchanun Luangpaiboon. 2026. "A Data-Driven Informatics Framework for Evaluating Thai Provinces Using an Additive Weighting-Based Variant Assessment Algorithm and Two-Stage DEA" Informatics 13, no. 7: 111. https://doi.org/10.3390/informatics13070111
APA StyleAungkulanon, P., Montemanni, R., & Luangpaiboon, P. (2026). A Data-Driven Informatics Framework for Evaluating Thai Provinces Using an Additive Weighting-Based Variant Assessment Algorithm and Two-Stage DEA. Informatics, 13(7), 111. https://doi.org/10.3390/informatics13070111