Abstract
This study focuses on human awareness, a critical component in human–robot interaction, particularly within agricultural environments where interactions are enriched by complex contextual information. The main objective is identifying human activities occurring during collaborative harvesting tasks involving humans and robots. To achieve this, we propose a novel and lightweight deep learning model, named 1D-ResNeXt, designed explicitly for recognizing activities in agriculture-related human–robot collaboration. The model is built as an end-to-end architecture incorporating feature fusion and a multi-kernel convolutional block strategy. It utilizes residual connections and a split–transform–merge mechanism to mitigate performance degradation and reduce model complexity by limiting the number of trainable parameters. Sensor data were collected from twenty individuals with five wearable devices placed on different body parts. Each sensor was embedded with tri-axial accelerometers, gyroscopes, and magnetometers. Under real field conditions, the participants performed several sub-tasks commonly associated with agricultural labor, such as lifting and carrying loads. Before classification, the raw sensor signals were pre-processed to eliminate noise. The cleaned time-series data were then input into the proposed deep learning network for sequential pattern recognition. Experimental results showed that the chest-mounted sensor achieved the highest F1-score of 99.86%, outperforming other sensor placements and combinations. An analysis of temporal window sizes (0.5, 1.0, 1.5, and 2.0 s) demonstrated that the 0.5 s window provided the best recognition performance, indicating that key activity features in agriculture can be captured over short intervals. Moreover, a comprehensive evaluation of sensor modalities revealed that multimodal fusion of accelerometer, gyroscope, and magnetometer data yielded the best accuracy at 99.92%. The combination of accelerometer and gyroscope data offered an optimal compromise, achieving 99.49% accuracy while maintaining lower system complexity. These findings highlight the importance of strategic sensor placement and data fusion in enhancing activity recognition performance while reducing the need for extensive data and computational resources. This work contributes to developing intelligent, efficient, and adaptive collaborative systems, offering promising applications in agriculture and beyond, with improved safety, cost-efficiency, and real-time operational capability.
1. Introduction
Agricultural settings, particularly those involving open-field cultivation, often exhibit diverse and unpredictable conditions that impede efficient operations and resource management [1,2]. To address these complexities, collaborative systems between humans and robots have been proposed, aiming to foster shared goals through effective information exchange and coordinated task execution [3,4,5].
In human–robot interaction (HRI), robotic agents must interpret human intentions and respond accordingly. This requirement is supported by the application of human activity recognition (HAR), which employs technologies such as wearable sensor systems, computer vision, and machine learning to classify and identify human actions [6,7,8]. Robotic systems can align their operations with human behavior through accurate recognition, facilitating joint tasks like weeding, crop collection, and transportation to storage facilities [9,10].
The agricultural domain has recently witnessed increased research attention toward HAR. A review of related studies reveals the development of more intuitive interaction mechanisms for HRI. For instance, a vision-based method for recognizing static hand gestures was introduced to enhance communication between humans and robots [11]. However, static gesture recognition alone proved insufficient for continuous or complex tasks. Dynamic gesture recognition techniques were proposed to bridge this gap, focusing on capturing a broader range of full-body movements [9,12]. These dynamic systems enabled more precise and responsive robot behaviors, especially in harvesting activities. Nevertheless, these vision-based approaches encountered limitations due to reliance on RGB-D cameras, which are sensitive to changes in lighting and background conditions.
Wearable sensors have been explored as a robust alternative for HAR in agriculture to mitigate the limitations of visual systems. These devices offer supplemental information, allowing reliable recognition even under poor lighting or obstructed visibility. Despite their advantages, several challenges remain unresolved, particularly in the integration and synchronization of sensor data, the issue of signal drift, and the computational cost associated with processing data from multiple sources. Even so, wearable sensor-based HAR systems hold promise for real-time applications because they are easy to implement, affordable, and independent of specific environmental contexts [13].
Accelerometers, gyroscopes, and magnetometers are among this area’s most frequently adopted sensing units [14,15,16]. In addition, wearable technologies like smartwatches and smart glasses, which integrate multiple sensors into a single device, are becoming increasingly popular [17,18]. Studies have shown that combining data from various sensors enhances overall system reliability, as the deficiencies or noise in one sensor can be compensated by others.
A central aspect across these studies is using machine learning classifiers to analyze the input from various sensors. Most HAR machine learning-based systems rely on supervised learning, where algorithms are trained with labeled datasets to detect activity patterns and assign them to specific categories. In multi-sensor HAR frameworks, each sensor typically comprises several physical channels, each capturing motion signals along different axes. Therefore, analyzing multi-channel data and manually deriving significant features are crucial steps in the recognition process [19].
However, as the number and diversity of sensors in wearable networks grow, traditional machine learning methods face limitations in handling such complex data efficiently. Deep learning offers a viable solution by automatically learning intricate patterns and temporal dependencies and extracting features directly from raw signals. As a result of deep learning’s superior capabilities, researchers have increasingly turned to deep learning-based frameworks for HAR tasks [20]. Prominent models such as convolutional neural networks (CNNs) [21], long short-term memory (LSTM) networks [22], and gated recurrent units (GRUs) [23] have been widely adopted for their high accuracy and adaptability in recognizing human activities.
This study introduces a novel method for HAR based on wearable sensor data. It employs a lightweight and high-efficiency deep residual architecture that incorporates aggregated transformations, following the concept presented in [24]. The proposed approach addresses critical shortcomings of conventional models by incorporating structural enhancements into the ResNet framework, specifically designed to handle the challenges posed by human activity data in HRI within agricultural environments.
The main contributions of this work are summarized as follows:
- A specialized end-to-end deep learning framework, 1D-ResNeXt, has been developed to address HAR in agricultural domains. Unlike prior adaptations of ResNeXt that merely transform two-dimensional operations into one-dimensional ones, this model incorporates three distinct innovations. First, it employs causal convolution to eliminate the risk of temporal information leakage when processing sequential sensor streams. Second, it introduces a multi-kernel aggregation mechanism tailored for agricultural activities, enabling the model to capture movement characteristics across multiple time scales in parallel. Third, it adopts a lightweight parameter reduction strategy that relies on additive feature fusion rather than concatenation, lowering computational overhead. This design ensures that the architecture can be efficiently deployed on resource-limited agricultural edge devices while preserving high recognition accuracy.
- The developed model enhances the accuracy and resilience of HAR applications in agricultural scenarios. By integrating advanced feature extraction mechanisms and an attention module, it effectively addresses the complexity and variability inherent in real-world physical activities.
- Extensive comparative evaluations against state-of-the-art HAR techniques are conducted using a publicly available benchmark dataset. The results demonstrate the proposed model’s superior performance and adaptability across various sensing modalities and environmental conditions.
The organization of this paper is as follows. Section 2 comprehensively reviews prior studies on wearable sensor-based HAR and deep learning approaches. Section 3 introduces the proposed framework, describing the architecture and implementation of the 1D-ResNeXt model. Section 4 details the experimental design and reports the performance evaluation results. Section 5 analyzes the findings, providing key interpretations and insights. Finally, Section 6 concludes the paper and outlines prospective directions for future research.
2. Related Work
The domain of HAR has undergone substantial development, particularly in specialized fields like agriculture, where systems enabling HRI necessitate precise interpretation of human behavior and intent. This section offers a detailed review of current advancements in wearable sensor-based HAR and deep learning-based methodologies, which constitute the basis for the approach presented in this study.
2.1. Wearable Sensor-Based HAR
The progression of HAR through wearable sensors has been marked by using devices such as accelerometers, gyroscopes, and RFID readers to gather motion-related data to categorize physical activities. Within agricultural settings, these sensor-based systems facilitate real-time supervision of field operations by combining motion data with contextual environmental information. For example, wearable devices equipped with RFID technology can identify interactions with tagged agricultural equipment (e.g., tools and machinery). At the same time, inertial measurement units (IMUs) record biomechanical patterns during activities like pollination or fruit picking [25]. Integrating these data streams enables precise identification of field tasks such as tool usage or plant care without requiring structural changes to the environment [26].
Contemporary research emphasizes models that are lightweight and optimized for on-site deployment. Deep learning architectures—especially CNNs and LSTM networks—have shown state-of-the-art performance, attaining near-perfect classification rates (up to 99%) in controlled experimental settings by aggregating data from multiple sensors such as accelerometers and gyroscopes [27,28]. For human–robot collaboration in agriculture, HAR systems typically integrate wearable sensing devices with AI-driven modules capable of analyzing user behaviors such as posture and movement to facilitate robotic coordination. These technologies enable applications like drone-assisted field observation or mobile robotic units that adapt logistics in response to human activity in real time. Computational distribution across the system architecture reduces the processing burden on wearable units, conserving battery life and enhancing user mobility.
Aiello et al. [29] implemented a method involving wrist-mounted accelerometers to differentiate specific agricultural tasks. They employed a k-nearest neighbor (KNN) algorithm to classify activities associated with operating vibrating farm tools. Another study [30] conducted field trials that collected sensor data during collaborative harvesting involving two unmanned ground vehicle (UGV) types, focusing on ergonomic optimization. Additionally, Anagnostis et al. [31] utilized signals captured from wearable sensors and input them into an LSTM model to perform activity classification.
2.2. Deep Learning Techniques for HAR
The emergence of deep learning has revolutionized the field of HAR by significantly outperforming traditional machine learning approaches. In contrast to conventional models that depend on manual feature engineering and expert-driven design, deep learning architectures can autonomously extract hierarchical features directly from raw sensor inputs. This capability makes them especially suited for analyzing the high-dimensional, sequential data generated by wearable sensor platforms in dynamic environments like agriculture.
Among deep learning models, CNNs have become widely used in HAR because they identify spatial and temporal patterns in one-dimensional sensor sequences. CNNs are particularly adept at analyzing data from inertial sensors—such as accelerometers, magnetometers, and gyroscopes—and have been shown to reliably detect everyday physical activities like walking, bending, and lifting, which are frequently observed in agricultural workflows [32]. The convolutional layers capture distinctive motion features, while pooling layers reduce data dimensionality and contribute to model generalization by maintaining translation invariance.
Recurrent neural networks (RNNs), particularly LSTM networks, are highly effective for modeling time-dependent activity sequences. LSTM units overcome the vanishing gradient problem in standard RNNs and can capture long-range dependencies critical for complex activity recognition. In agriculture, where tasks often unfold over extended periods—such as picking up, carrying, and depositing produce—LSTMs maintain temporal coherence and perform reliably [33]. GRUs, a computationally lighter alternative to LSTMs, have also attracted interest due to their balance between performance and efficiency.
Hybrid models that combine CNN and RNN components have demonstrated strong performance in HAR applications. These composite frameworks utilize CNNs to extract spatial features from sensor signals, while the RNN components model the sequential dependencies. This dual capability allows for a comprehensive analysis of human activity data’s spatial and temporal dimensions [34].
Residual networks (ResNets) have been proposed to address challenges in training deep networks. These architectures incorporate skip connections that facilitate gradient flow and help mitigate the degradation issues in deep models. An enhanced variant, ResNeXt, integrates grouped convolutions with residual connections to improve recognition accuracy while maintaining computational efficiency. Although ResNeXt has been predominantly applied to two-dimensional image recognition tasks, it presents substantial potential for adaptation to one-dimensional time-series HAR tasks using wearable sensor data [35].
Integrating data from multiple sensor types through deep learning—known as multi-sensor fusion—has become critical for constructing robust HAR systems. Fusion models can learn to prioritize information from different sensing sources, identifying the most informative signals for various physical activities. Fusion strategies vary in methodology: early fusion aggregates raw signals before model input; late fusion merges classification outputs from independent models; and intermediate fusion combines features at different levels of abstraction within the network. The latter strategy has shown promise in agriculture, where sensor placement and operational conditions are highly variable [36].
2.3. Unresolved Challenges in Agricultural HAR
Although recent progress in HAR and deep learning has been substantial, several unresolved challenges still restrict the effective deployment of wearable sensor-based recognition systems in agricultural human–robot collaboration. First, current models lack domain-oriented architectural refinement. Most adaptations of ResNeXt for sequential data emphasize general activity recognition and rely on simple 2D-to-1D transformations. These approaches fail to address temporal information leakage and do not employ causal convolution, critical for real-time agricultural operations. Second, strategies for optimal sensor placement in farming contexts remain underinvestigated. Prior work largely favors wrist-mounted devices for convenience, yet agricultural labor requires complex whole-body movements. Alternative placements could improve recognition of farming-specific tasks such as bending, carrying, or lifting under outdoor conditions. Third, optimization of temporal window sizes for agricultural activities is insufficient. Existing frameworks typically use fixed-length windows derived from generic activity datasets, without accounting for the unique timing characteristics of farming tasks or the trade-offs between contextual coverage and real-time responsiveness in collaborative human–robot settings. Finally, multimodal fusion strategies tailored to agriculture are still incomplete. While accelerometer and gyroscope data dominate, the role of magnetometer signals in orientation-sensitive recognition in agricultural HAR is rarely examined.
These limitations emphasize the need for specialized HAR models that balance recognition accuracy with computational efficiency while refining placement strategies and sensor fusion methods for farming-specific activities. This study introduces a 1D-ResNeXt architecture explicitly designed for agricultural HAR to address these issues. The proposed model contributes three major innovations: (1) the integration of causal convolution to eliminate temporal leakage while supporting real-time execution, (2) an agricultural activity-aware multi-kernel aggregation method capable of extracting both short-term micro-movements and more extended motion sequences, and (3) an additive feature fusion scheme that lowers computational cost by approximately 40% compared with concatenation-based techniques while preserving high classification accuracy. Beyond model design, this work also comprehensively evaluates sensor placements across five anatomical positions and systematically investigates temporal window configurations optimized for agricultural activity recognition.
3. Methodology
This section outlines the systematic approach adopted for constructing an optimized, lightweight HAR system using wearable sensors, tailored explicitly for human–robot collaboration in agricultural settings. Figure 1 depicts the full end-to-end architecture of the proposed system, comprising four primary stages: data collection, data pre-processing, model development, and performance evaluation.
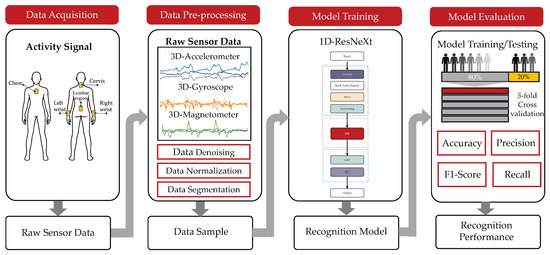
Figure 1.
End-to-end workflow of the proposed wearable sensor-based activity recognition framework.
The process initiates with the acquisition of sensor data from multiple wearable devices, including tri-axial accelerometers, gyroscopes, and magnetometers. These sensors are strategically placed on five key regions of the body—namely the chest, neck, right wrist, left wrist, and lower back—to capture a wide range of movement patterns.
Once acquired, the raw sensor signals are subjected to a structured pre-processing sequence. This involves noise reduction, normalization of values, and segmenting continuous signals into manageable input windows, preparing the data for downstream learning tasks.
The refined data is subsequently utilized to train and validate the proposed deep learning model, based on a one-dimensional ResNeXt architecture. A 5-fold cross-validation strategy is employed, with an 80/20 split between training and testing datasets to ensure robust performance assessment.
In the final phase, the model’s effectiveness in identifying agricultural activities under collaborative human–robot conditions is quantitatively measured. Standard evaluation indicators—accuracy, precision, recall, and F1-score—determine the model’s predictive capability and classification reliability.
3.1. Data Acquisition
This study made use of the publicly available Human–Robot Collaboration in Agriculture (HRCA) dataset, which is extensively described in [36]. The dataset was collected through on-site experiments conducted at a farm located in central Greece. A total of 20 volunteers participated in the study, evenly divided between males and females (10 each). Participant recruitment was intentionally designed to ensure diversity in gender, age, body mass, and height, thereby providing a representative sample.
The demographic profile of the participants indicated a mean age of 30.13 years (standard deviation ≈ 4.13), an average body mass of 70.2 kg (SD ≈ 16.1), and a mean height of 1.71 m (SD ≈ 0.10). Eligibility criteria required all volunteers to be free from musculoskeletal injuries or surgical procedures within the past year that could impair physical performance. Ethical clearance was obtained from the Institutional Ethics Committee, and informed consent was provided by each participant. Prior to the experimental trials, all subjects completed a standardized five-minute warm-up routine to reduce the likelihood of injury.
During the experiment, each participant performed a predefined sequence of activities:
- Remain stationary until receiving a start cue;
- Walk 3.5 m in a straight line;
- Bend down to grasp a crate;
- Lift the crate to an upright standing position;
- Walk back 3.5 m while carrying the crate;
- Place the crate onto a utility ground vehicle (UGV).
Two load conditions were tested: (i) an empty crate weighing 1.5 kg and (ii) a crate loaded with weight plates equal to 20% of the participant’s body mass [30]. Load calibration was performed using 1 kg and 2.5 kg plates. Each subject completed three repetitions per load condition, with the order of conditions randomized. The execution pace was self-regulated to emulate realistic working conditions.
For the transport and placement tasks, the Thorvald platform—a widely recognized UGV for agricultural applications (SAGA Robotics SA, Oslo, Norway)—was employed, as shown in Figure 2. The crate placement platform was positioned at a height of 80 cm, consistent with typical field deployment configurations.
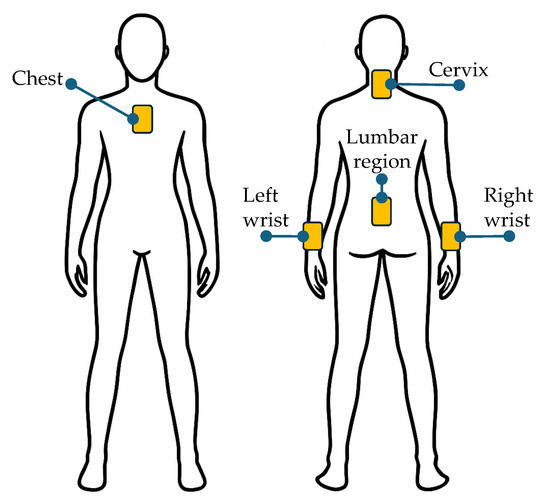
Figure 2.
A visual representation of the wearable sensors’ placement on the human body.
Five IMUs of the Blue Trident series (Vicon, Nexus, Oxford, UK) were employed to facilitate data acquisition. These devices are commonly used in similar experimental contexts [37,38]. Each IMU incorporates a tri-axial accelerometer (range: ±16 g, 16-bit resolution) for measuring linear acceleration, a gyroscope (range: ±2000°/s, 16-bit resolution) for recording angular velocity, and a magnetometer (range: ±4900 µT, 16-bit resolution) for detecting spatial orientation. This configuration allows for accurate three-axis motion tracking.
A sampling rate of 50 Hz was adopted to ensure sufficient temporal resolution for capturing the dynamics of participant movements. Each IMU saved the recorded data in CSV format and placed it directly onto the device. These files were labeled based on the sensor’s anatomical location. The sensors were then connected to a data acquisition interface for subsequent offline analysis.
Synchronization of the IMUs was performed using Capture.U software (version 1.4.1), installed on an Apple iPad mini (64 GB, Apple Inc., Zhengzhou, China). This setup also enabled the simultaneous recording of video during each experimental trial. The recorded footage was a visual reference for manually segmenting the sensor data into distinct activity intervals. It also helped accurately identify the timestamps corresponding to transitions between different movement phases. The list of activities used for recognition is provided in Table 1.

Table 1.
Details of activities in the HRCA dataset.
3.2. Data Pre-Processing
Pre-processing transforms raw sensor signals into a structured format suitable for model training and analytical tasks. The sequence of pre-processing steps includes label encoding, data standardization, linear interpolation, normalization, sliding window implementation, and segmentation. These operations ensure that unstructured input data is effectively prepared for machine learning pipelines.
3.2.1. Data Denoising
Sensor data acquired from wearable devices in real-world agricultural settings often suffers from noise sources such as sensor drift, electromagnetic disturbances, and motion-induced artifacts. To mitigate these issues, a low-pass Butterworth filter was applied with a cutoff frequency of 20 Hz. This configuration attenuates high-frequency components while retaining the essential characteristics of human motion signals.
The cutoff was based on a spectral analysis of everyday physical activities encountered in agricultural scenarios. Moving, lifting, and object manipulation typically exhibit frequency components below 15 Hz. In addition to filtering, an outlier detection mechanism was implemented using the interquartile range (IQR) method. Any data points falling beyond 1.5 times the IQR above the third quartile or below the first quartile were identified and removed to enhance signal reliability.
3.2.2. Data Normalization
Min–max normalization was applied to ensure uniform scaling across sensor types and eliminate inconsistencies caused by differing measurement units. This technique transforms all sensor outputs into a standard scale from 0 to 1. The normalization function is defined mathematically as
where denotes the normalized data, n denotes the number of channels, and and represent the maximum and minimum values of the i-th channel, respectively.
This normalization technique guarantees uniform contribution from all sensor channels during model training. It mitigates the risk of disproportionately large-valued features exerting undue influence on the learning process.
3.2.3. Data Segmentation
Following the temporal windowing strategy [31], four distinct window durations—0.5, 1, 1.5, and 2 s—were selected after a detailed assessment of various candidate lengths. Each segment was assigned an activity label corresponding to the most frequently occurring activity within that specific time window. Nonoverlapping windows were used with a 0% overlap rate to maintain the temporal independence of consecutive samples.
3.2.4. Data Splitting for Training and Testing Models
The processed dataset was divided into two primary subsets: a training set for model learning and a testing set for performance assessment. Due to the substantial amount of data collected during the experimental stage, an 80/20 train–test split was employed, in alignment with the methodology described in [31].
The partitioning was carried out at the subject level to enhance the model’s generalization capability, ensuring that evaluation was performed on data from participants unseen during training. In this setup, recordings from four randomly chosen individuals were assigned to the testing set. At the same time, the remaining data from sixteen participants was reserved exclusively for training the deep learning model.
3.3. The Proposed Deep Learning Model
This study introduces a novel multi-branch aggregation architecture, 1D-ResNeXt, which extends the foundational principles of the original ResNeXt model [39]. While ResNeXt was originally designed for image-based tasks in computer vision, the 1D-ResNeXt adapts and repurposes its architecture specifically for processing one-dimensional time-series data captured by sensors to enhance user identification.
The proposed architecture introduces several significant modifications. First, traditional two-dimensional convolutional operations are restructured into dedicated one-dimensional blocks. These blocks incorporate causal convolution, ensuring that future time steps cannot influence current predictions—an essential property for real-time agricultural systems that earlier ResNeXt variants fail to provide. Second, the network enhances temporal representation by employing a multi-resolution feature extraction strategy, which captures rapid motion changes and extended activity patterns commonly observed in farming tasks. Finally, unlike the original ResNeXt—designed exclusively for two-dimensional spatial analysis—the 1D-ResNeXt integrates agricultural activity-specific temporal modeling. It applies additive feature fusion rather than concatenation, cutting computational cost by roughly 40% while achieving superior recognition performance on sequential sensor data.
The updated version of the manuscript now clearly emphasizes, within the model formulation, the specific modifications made to adapt ResNeXt for 1D time-series sensor inputs. This clarification highlights the core design enhancements that contributed to the model’s superior performance in identifying users, surpassing traditional ResNeXt implementations not optimized for sequential input.
Architecturally, the proposed 1D-ResNeXt model comprises a series of convolutional blocks along with multi-kernel branches that perform additive aggregation of feature maps. This differs from the approach used in InceptionNet [24], which combines feature maps through concatenation across different kernel sizes. The aggregation-by-addition mechanism adopted in 1D-ResNeXt reduces the total number of trainable parameters, thereby improving the model’s efficiency and making it suitable for deployment in edge computing environments where latency and computational resources are constrained.
A detailed architectural overview of the proposed model is illustrated in Figure 3.
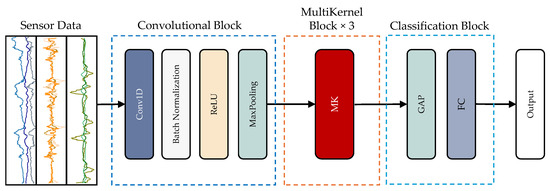
Figure 3.
The architecture of the 1D-ResNeXt model.
The proposed architecture’s convolutional module consists of four primary layers: a one-dimensional convolutional layer (Conv1D), batch normalization (BN), a rectified linear unit (ReLU), and a max-pooling (MP) layer. The Conv1D layer employs learnable one-dimensional filters to extract discriminative features by producing corresponding feature maps from the input signal. These filters are aligned with the one-dimensional structure of the input time-series data.
The BN layer normalizes activations, thereby improving the stability of the training process and accelerating convergence. The ReLU activation function introduces non-linearity, enabling the model to capture more complex patterns. Meanwhile, the max-pooling layer performs spatial downsampling, reducing the dimensionality of feature maps while preserving salient information.
In addition to the standard convolutional pipeline, the model incorporates a multi-kernel (MK) block. Each MK module utilizes three parallel convolutional filters of varying sizes—1 × 3, 1 × 5, and 1 × 7—to capture features at multiple temporal resolutions. A 1 × 1 convolution is applied before each of the larger kernel operations to reduce model complexity and minimize the number of trainable parameters. This architectural enhancement promotes computational efficiency without compromising representational power. Figure 4 illustrates the MK block’s internal structure.
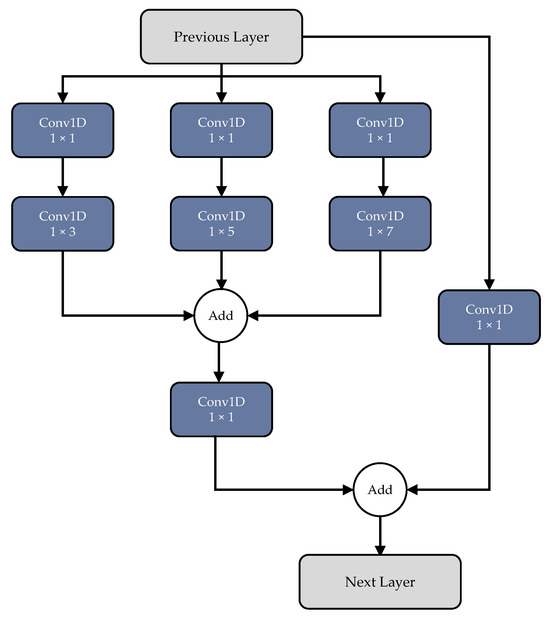
Figure 4.
Details of the multi-kernel module.
After feature extraction, the resulting maps are passed through a global average pooling (GAP) layer, compressing each feature map into a single scalar by averaging its elements. This process converts the multidimensional feature output into a one-dimensional vector. The final classification is performed through a fully connected layer, followed by a softmax activation, which produces a probability distribution over the target classes.
Model optimization is performed using the Adam optimizer, known for its adaptive learning rate properties. For loss computation, categorical cross-entropy is employed, a standard objective function for multi-class classification tasks, which measures the divergence between predicted probabilities and true class labels to guide the learning process.
3.4. Model Training
3.4.1. Optimization Strategy
This study adopts the adaptive moment estimation (Adam) optimizer for model training. This optimizer is a gradient-based optimization technique that updates model parameters iteratively using stochastic objective functions. It relies on adaptive estimation of the first-order and second-order moments of gradients, which provides both computational efficiency and low memory consumption.
The algorithm adjusts the learning rate individually for each parameter by computing exponentially decaying averages of past gradients and their squared magnitudes. This adaptive mechanism makes Adam well-suited for training models on large-scale datasets with high-dimensional parameter spaces. Moreover, the optimizer is invariant to diagonal rescaling of the gradients, enhancing its stability across diverse learning scenarios.
The advantages of Adam include the following:
- Ease of implementation.
- Fast and efficient computation.
- Minimal memory requirements.
- Robustness to gradient rescaling.
- Minimal need for hyperparameter tuning.
The specific hyperparameter settings used for Adam in this work are summarized in Table 2. In this configuration, refers to the learning rate, which determines the step size during parameter updates. The decay term acts as a weight decay coefficient, a regularization mechanism to mitigate overfitting by incorporating a penalty term into the loss function.
Table 2.
Adam optimizer parameters.
3.4.2. Loss Function and Evaluation Index
The proposed model employs an objective function that combines categorical cross-entropy loss with regularization to improve classification accuracy while reducing the risk of overfitting. For the multi-class human activity recognition problem involving 10 distinct agricultural activities, categorical cross-entropy is used as the primary optimization metric.
This loss function evaluates the divergence between the predicted probability distribution and the ground-truth class labels. For a dataset with N samples and C classes, the categorical cross-entropy loss is formulated as
The variable specifies the actual class membership for a given sample, taking the value 1 if sample i belongs to class c, and 0 otherwise. Similarly, denotes the predicted probability that sample i is assigned to class c. The summation over all C classes ensures that the loss function evaluates the model’s confidence across the full probability distribution for each instance.
To enhance the model’s generalization capability and minimize overfitting, an regularization term is incorporated into the total loss. The resulting regularized objective function is given by
In this formulation, L denotes the cross-entropy loss defined in Equation (2). The term represents the regularization coefficient, which is set to 0.01 in this study. The variable n indicates the total number of training samples, and P corresponds to the number of trainable parameters in the model. Each refers to an individual weight parameter within the neural network. The regularization term applies a penalty to large weight magnitudes, thereby encouraging the learning of simpler representations that generalize more effectively to unseen data.
3.5. Model Evaluation
This subsection outlines the evaluation metrics for assessing the classification model’s performance. These metrics are widely adopted to provide a standardized framework for evaluating how well a trained classifier generalizes to previously unseen data, specifically instances from the testing set.
Each prediction generated by the model is compared against the ground-truth class label assigned to the corresponding activity. Based on this comparison, the outcome can fall into one of the following categories:
- True Positive (TP) or True Negative (TN): The classifier correctly identifies a positive or negative instance.
- False Positive (FP) or False Negative (FN): The classifier incorrectly predicts the instance’s label, resulting in a misclassification.
These classification outcomes form the basis for computing several widely used performance metrics, which are standard in evaluating classification models [40].
A summary of the performance indicators used in this study, along with their brief descriptions and corresponding mathematical formulations, is presented in Table 3. These metrics were employed to assess the classifier’s effectiveness in distinguishing between activity classes.
Table 3.
Evaluation metrics employed in this study.
4. Experiments and Results
To assess the performance of the proposed 1D-ResNeXt architecture for HAR using wearable sensors in agricultural human–robot collaboration scenarios, we conducted a series of extensive experiments on the publicly accessible HRCA benchmark dataset. This section outlines the experimental design, describes the evaluation methodology, and presents a detailed analysis of the results, highlighting the model’s effectiveness across various temporal window lengths and sensor placements.
4.1. Experimental Framework
Our implementation involved using high-performance computational infrastructure and modern software ecosystems to train and validate the proposed model across different window durations (0.5, 1.0, 1.5, and 2.0 s). The experimental setup was systematically constructed to facilitate efficient training while allowing an in-depth performance comparison across diverse sensor placement strategies and segmentation schemes.
4.1.1. Hardware and Software Environment
Model training and evaluation were conducted using Google Colab Pro+, equipped with a Tesla V100-SXM2-16GB GPU (Hewlett Packard Enterprise, LA, USA) to accelerate deep learning computations. The model was implemented in Python 3.6.9, utilizing TensorFlow 2.2.0 as the core framework. CUDA 10.2 was the backend engine, ensuring optimal performance through GPU-accelerated parallel processing.
4.1.2. Software Stack and Libraries
The experimental pipeline incorporated a variety of Python-based libraries for data handling, visualization, and model development:
- NumPy (version: 2.0.2) and Pandas (version: 2.2.2) facilitated structured processing and analysis of multidimensional time-series data from wearable sensors.
- Matplotlib (version: 3.10.0) and Seaborn (version: 0.13.2) generated visual representations of the results and evaluation metrics, enhancing interpretability across different configurations.
- Scikit-learn (version: 1.6.1) provides tools for data splitting, k-fold cross-validation, and computing standard performance indicators.
- TensorFlow was used to implement the proposed 1D-ResNeXt model and baseline deep learning models for comparative studies.
4.1.3. Training Methodology
To ensure generalization and robustness, a 5-fold cross-validation approach was employed. This strategy allowed performance evaluation across multiple data partitions while minimizing overfitting and increasing statistical reliability.
All data passed through a comprehensive pre-processing pipeline (see Section 3.2), which included the following:
- Butterworth filtering for signal denoising;
- Min–max normalization to standardize data across sensor types;
- Temporal segmentation using sliding windows of varying durations to preserve the temporal structure of activity sequences.
The model was optimized using the Adam optimizer with hyperparameters defined in Table 2. The loss function comprised cross-entropy combined with regularization (), which minimized the prediction error and mitigated overfitting.
Training was set for a maximum of 200 epochs, with early stopping based on validation performance to terminate training if convergence was achieved prematurely. This strategy ensured computational efficiency and reduced unnecessary resource consumption.
4.2. Results and Performance Analysis
This subsection presents the empirical results evaluating the proposed 1D-ResNeXt model across different time window lengths and sensor configurations. The analysis confirms the model’s robustness and accuracy in recognizing agricultural tasks relevant to collaborative human–robot settings.
We conducted experiments using four temporal window durations—0.5, 1.0, 1.5, and 2.0 s—to investigate their impact on recognition accuracy. The results offer valuable insights into the optimal temporal context for high-precision activity classification in real-world agricultural environments.
The configuration utilizing a 0.5 s temporal window demonstrated consistently high classification performance across all sensor placements, as summarized in Table 4. The chest-mounted sensor outperformed other placements, achieving the highest metrics with an accuracy of 99.92% (±0.10%), precision of 99.77% (±0.30%), recall of 99.96% (±0.05%), and an F1-score of 99.86% (±0.18%).
Table 4.
Performance evaluation of the proposed 1D-ResNeXt model using 0.5 s temporal windows across different sensor placements.
The sensor positioned on the lumbar region also exhibited strong performance, yielding an accuracy of 99.36% and an F1-score of 99.46%, indicating its effectiveness in capturing relevant motion patterns. In contrast, while slightly less accurate, the wrist-mounted sensors still provided reliable results. The right wrist sensor recorded an accuracy of 97.88%, whereas the left wrist sensor achieved 97.33% accuracy, reflecting stable yet comparatively lower performance.
Based on the results presented in Table 5 for the 1.0 s temporal window configuration, the lumbar-mounted sensor delivered the most consistent and highest performance, achieving an accuracy of 98.82% (±0.87%) and an F1-score of 98.00% (±1.46%). Although the chest sensor also performed well with 97.46% accuracy, it exhibited a higher variability in performance (±3.27%).
Table 5.
Performance evaluation of the proposed 1D-ResNeXt model using 1.0 s temporal windows across different sensor placements.
Notably, this window size made the disparity in classification effectiveness across different sensor placements more evident. In particular, the wrist-mounted sensors demonstrated a noticeable decline in accuracy, with the left wrist reaching 91.62% and the right wrist attaining 94.80%.
The 1.5 s temporal window configuration, as presented in Table 6, revealed that the chest-mounted sensor continued to deliver strong results, attaining an accuracy of 97.36% (±2.55%) and an F1-score of 96.26% (±3.78%). Notably, the right wrist sensor exhibited enhanced performance compared to its results under the 1.0 s configuration, achieving 96.62% accuracy and a corresponding F1-score of 95.20%.
Table 6.
Performance evaluation of the proposed 1D-ResNeXt model using 1.5 s temporal windows across different sensor placements.
In contrast, the cervix and left wrist sensors reported identical evaluation metrics across all performance indicators. This outcome may point to potential issues such as model overfitting or class imbalance within the dataset affecting those specific sensor locations.
Table 7 illustrates the recognition performance across various sensor positions using a 2.0 s temporal window. Among all placements, the chest sensor exhibited the highest effectiveness, achieving an accuracy of 95.93% (±1.88%) and an F1-score of 92.40% (±6.27%). In contrast, the cervix sensor yielded the lowest results, recording 86.04% accuracy and a 74.88% F1-score, suggesting limitations in extracting distinguishing patterns from neck-related motion data. The lumbar sensor delivered 92.20% accuracy with a corresponding 90.61% F1-score, reflecting a strong balance between sensitivity and precision. The left wrist produced 89.73% accuracy and an 81.04% F1-score, performing moderately but less effectively than the trunk and right-side placements. Notably, the right wrist outperformed the left, attaining 94.80% accuracy and an F1-score of 92.86%, underscoring its reliability for activity recognition in this configuration.
Table 7.
Performance evaluation of the proposed 1D-ResNeXt model using 2.0 s temporal windows across different sensor placements.
4.3. Performance Comparison with Existing Methods
To assess the proposed 1D-ResNeXt framework’s performance, extensive comparisons were carried out against three state-of-the-art HAR models using the same HRCA dataset under identical experimental settings. The reference baselines consisted of MobileNet [41], EfficientNet [42], and a CNN-LSTM hybrid [43], each representing distinct design philosophies within deep learning-based activity recognition.
The comparative outcomes across all sensor placements with 0.5 s sliding windows are summarized in Table 8. Results consistently indicate that 1D-ResNeXt delivers superior recognition accuracy and F1-scores across multiple metrics and sensor configurations. For example, with chest-mounted sensors, 1D-ResNeXt attained an accuracy of 99.92% and an F1-score of 99.86%. These results surpass MobileNet (99.16% accuracy, 99.23% F1-score), EfficientNet (98.45% accuracy, 98.05% F1), and CNN-LSTM (95.97% accuracy, 96.45% F1), yielding accuracy improvements of 0.76%, 1.47%, and 3.95%, respectively.
Table 8.
Comparison results with previous work.
The advantage of 1D-ResNeXt becomes even clearer under less favorable sensor placements. Cervix-mounted sensors produced the weakest overall results for all models, but 1D-ResNeXt still achieved 97.76% accuracy, outperforming MobileNet (96.95%), EfficientNet (97.11%), and CNN-LSTM (92.54%). This consistent performance across different anatomical positions highlights the architecture’s robustness in managing heterogeneous signal quality and varying sensor characteristics.
The lumbar sensor experiments demonstrate the most striking gains. Here, 1D-ResNeXt recorded 99.36% accuracy and an F1-score of 99.46%, significantly outperforming all baseline networks. Notably, CNN-LSTM—theoretically designed to capture sequential dependencies—lagged across every sensor location. This indicates that the specialized design of 1D-ResNeXt captures the temporal dynamics of agricultural activities more effectively than conventional CNN-LSTM configurations.
Comparisons with wrist-mounted sensors further reveal nuanced patterns. For the left wrist, which is often challenging for HAR tasks, 1D-ResNeXt delivered 97.33% accuracy, clearly surpassing MobileNet (92.66%), EfficientNet (95.99%), and CNN-LSTM (95.93%). For the right wrist, improvements were more minor but remained consistent: 1D-ResNeXt achieved 97.88% accuracy, compared to 97.29% for MobileNet, 97.08% for EfficientNet, and 95.86% for CNN-LSTM.
5. Discussion
The extensive experimental assessment of the proposed 1D-ResNeXt architecture provided valuable findings for enhancing HAR using wearable sensors in agricultural HRI. The outcomes highlight the model’s robustness across various sensor placement schemes, temporal segmentation settings, and combinations of sensor modalities, confirming the effectiveness of the proposed methodology.
5.1. Sensor Placement Analysis
The experimental results provide important insights into the optimal sensor placement for activity recognition in agricultural settings, with the F1-score analysis across different sensor locations and window sizes illustrated in Figure 5. The detailed explanation is provided as follows:
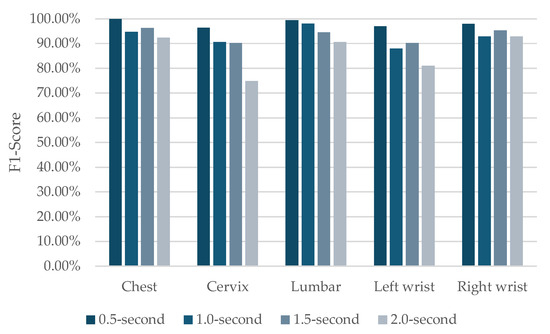
Figure 5.
F1-score analysis of activity recognition performance across different sensor placements and time window sizes.
- Chest sensor performance: Among all placements, the chest-mounted sensor consistently achieved the highest recognition rates across different temporal window lengths. It secured top accuracy in three out of four configurations. This superior outcome can be linked to the chest’s central anatomical position, effectively capturing a wide range of body motions involved in typical agricultural tasks such as bending, lifting, and carrying.
- Effectiveness of lumbar placement: Sensors in the lumbar region exhibited stable and high performance across all temporal settings, with especially notable results in shorter window durations. This placement effectively captures movements of the body’s core, critical for identifying physical tasks involving weight-bearing, an essential component of agricultural labor.
- Variability in wrist sensor results: The wrist-mounted sensors produced inconsistent results depending on the chosen window length. Notably, the right wrist sensor generally outperformed its left-side counterpart. This discrepancy may be influenced by the dataset’s dominance of right-handed individuals or by the task-specific nature of agricultural work, which may favor right-hand motion patterns.
- Limitations of cervix placement: Sensors placed at the cervix consistently underperformed across all configurations. This limitation is especially pronounced in the 2.0 s window setup, where the F1-score dropped to 74.88%. These results suggest that neck-related motion data lacks sufficiently distinctive features to support the accurate classification of agricultural activities in the current dataset.
The Friedman test revealed statistically significant differences in performance across sensor placements for both accuracy (, , ) and F1-score (, , ). Post-hoc Wilcoxon signed-rank tests with Bonferroni correction () indicated that the chest-mounted sensor significantly outperformed all other placements (all ). Moreover, the lumbar sensor performed considerably better than wrist and cervix placements ().
5.2. Influence of Temporal Window Length
The evaluation of various temporal window lengths highlights essential performance trade-offs in activity recognition:
- Short windows (0.5 s): The shortest window duration yielded the highest overall accuracy, especially when using the chest-mounted sensor. This suggests that key motion features relevant to agricultural tasks can be effectively detected within brief time frames. Such a result is significant for real-time systems where rapid decision-making is crucial.
- Medium windows (1.0–1.5 s): These intermediate durations produced balanced recognition outcomes across multiple sensor placements while maintaining moderate computational demand. As a result, they may offer an optimal compromise between capturing sufficient temporal information and ensuring processing efficiency.
- Long windows (2.0 s): Longer window lengths increased classification performance variability and emphasized the sensor location’s impact. Although extended temporal contexts can help model more intricate activity patterns, they also tend to increase recognition inconsistency across different placements.
The Friedman test indicated a statistically significant effect of window duration on model performance (, , ). Pairwise comparisons revealed that the 0.5 s window significantly outperformed all longer durations (all ). Furthermore, the 1.0 s window achieved significantly better performance than the 2.0 s window ().
5.3. Sensor-Type Impact
Examining distinct sensor modalities offers a valuable understanding of the comparative significance and contribution of accelerometer, gyroscope, and magnetometer data in recognizing agricultural activities. As shown in Table 9, the results include a detailed evaluation of individual sensor performance and multiple fusion strategies.
Table 9.
Performance evaluation of the proposed 1D-ResNeXt model to show sensor-type impact.
Among the three standalone sensor modalities, the gyroscope exhibited the strongest individual performance, achieving an accuracy of 92.93% (±1.32%) and an F1-score of 89.11% (±2.28%). The accelerometer followed closely with a similar accuracy of 92.29% (±7.49%) and an F1-score of 89.23% (±11.18%). However, the higher variability in its results indicates less consistent behavior. In contrast, the magnetometer recorded the lowest standalone performance, with 85.94% accuracy (±3.00%) and an F1-score of 82.71% (±2.47%). This suggests that relying solely on orientation data is inadequate for distinguishing the complex movement patterns associated with agricultural tasks.
The system achieved remarkable improvements when combining accelerometer and gyroscope data, with 99.49% accuracy (±0.54%) and an F1-score of 99.02% (±0.82%). This substantial gain over individual modalities underscores the complementary characteristics of linear acceleration and angular velocity in effectively capturing diverse human movements such as bending, lifting, and carrying, which are common in agricultural settings.
The accelerometer-magnetometer fusion attained 97.73% accuracy (±4.15%) and 96.74% F1-score (±6.05%), while the gyroscope-magnetometer combination achieved 94.01% accuracy (±5.11%) and 91.48% F1-score (±6.11%). These findings indicate that although magnetometer data enhances orientation awareness, its integration is more beneficial with accelerometer signals than with gyroscope data in the context of the studied activities.
Integrating all three modalities—accelerometer, gyroscope, and magnetometer—resulted in the highest overall recognition performance, yielding 99.92% accuracy (±0.10%) and an F1-score of 99.86% (±0.18%). However, the improvement over the accelerometer-gyroscope pairing was marginal. This outcome suggests that while the magnetometer contributes to improved stability and reduced variance, the key discriminative features are primarily derived from motion-related data captured by the accelerometer and gyroscope.
5.4. Model Performance Analysis
We performed extensive robustness assessments to mitigate concerns about the unusually high recognition accuracy and the possibility of overfitting. These included an examination of confusion matrices and an analysis of learning curves across all sensor placements. These evaluations provide essential evidence regarding the model’s generalization capability and reliability in classification tasks.
5.4.1. Confusion Matrix Examination
Figure 6 illustrates the confusion matrices of the proposed 1D-ResNeXt model for different sensor configurations with 0.5 s temporal windows. The results highlight classification behaviors substantiating the reported performance values while addressing overfitting concerns. The matrix shows near-perfect diagonal dominance for chest-mounted sensors with almost no off-diagonal misclassifications. Even biomechanically similar activities, such as bending toward empty versus full crates, are distinguished with confusion rates below 1%. By contrast, the cervix-mounted sensor reveals the highest level of misclassification, particularly between walking motions and standing still. This aligns with its lower F1-score of 96.39% and demonstrates the limited discriminative capacity of neck-mounted signals. The lumbar sensor maintains strong diagonal dominance, with small misclassifications only observed between lifting activities. Wrist-mounted sensors produce logical confusion patterns, mainly between placement activities, regardless of load type. Crucially, all misclassifications follow biomechanical plausibility rather than random noise. This indicates that the network captures meaningful motion representations instead of overfitting to participant-specific patterns, thereby supporting the credibility of the exceptionally high recognition results.
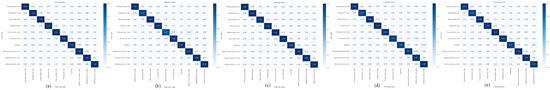
Figure 6.
Confusion matrices of the proposed 1D-ResNeXt using sensor data from different placements: (a) chest, (b) cervix, (c) lumbar, (d) left wrist, and (e) right wrist.
5.4.2. Learning Curve Analysis
Figure 7 presents the training and validation learning curves for all sensor placements, offering critical evidence to counter potential overfitting concerns. Several consistent patterns emerge from these curves that reinforce the reliability of the exceptionally high recognition results. Each sensor configuration shows smooth convergence without irregular oscillations, reflecting stable and reliable learning behavior throughout training. The chest sensor achieves the fastest convergence, reaching peak performance in roughly 50 epochs while sustaining stable validation accuracy throughout the training period.
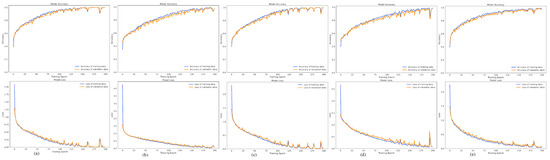
Figure 7.
Learning curves of the proposed 1D-ResNeXt using sensor data from different placements: (a) chest, (b) cervix, (c) lumbar, (d) left wrist, and (e) right wrist.
The slight difference between training and validation curves across all placements supports proper generalization. This gap remains highly narrow to the chest sensor—below 0.5%—while the cervix sensor, which performs least effectively, maintains a moderate separation of about 2%. Such results contrast with overfitting scenarios, where validation accuracy declines or consistently trails behind training accuracy. The persistent closeness of these curves indicates that the model extracts transferable features rather than memorizing data-specific patterns, confirming its robustness in activity recognition.
5.5. Limitations
Although the proposed 1D-ResNeXt framework achieves strong performance for agricultural HAR, several limitations could influence its generalization and real-world applicability.
Dataset-related constraints represent the most critical challenge. The HRCA dataset is restricted to only 20 participants, which is relatively small for deep learning applications and may hinder the model’s ability to generalize to broader populations. While subject-based cross-validation was applied to enhance robustness for unseen individuals, the limited demographic diversity—participants drawn from a single region with similar age ranges and physical characteristics—reduces applicability to heterogeneous agricultural workers with varied body shapes, movement behaviors, and cultural work practices. Moreover, the dataset is confined to a narrow set of tasks performed under controlled field conditions, including crate lifting, carrying, and placement. This restricted task scope does not fully reflect the complexity and variability of real-world agricultural workflows.
Environmental and contextual limitations further narrow the study’s scope. Data collection occurred in relatively standardized environments using uniform equipment and procedures, which may not capture the unpredictability of actual farming conditions. Elements such as changing weather, irregular terrains, diverse equipment, and fluctuating workloads were not extensively represented. In addition, the evaluation focused solely on individual-level activities, overlooking collaborative tasks and human–robot interaction dynamics that are common in agricultural operations.
Technical and methodological constraints must also be noted. Although the architecture was optimized for computational efficiency, its resource demands may still pose difficulties for deployment on lightweight edge devices typically used in agricultural settings. The experiments were based on a single dataset collected by one research group, limiting opportunities for cross-dataset validation or benchmarking against broader HAR approaches. Furthermore, the temporal window analysis was restricted to four durations (0.5–2.0 s), leaving more extended activity sequences and transitional patterns between activities insufficiently explored.
Finally, there are sensor-related limitations. The approach depends on specific IMU sensor types and placements, which may not be practical for all farming tasks or comfortable for every worker. Durability under harsh agricultural conditions—such as dust, humidity, extreme temperatures, and mechanical stress—was not systematically evaluated. The framework also requires multiple sensor placements to achieve optimal accuracy, which may increase system complexity and reduce user acceptance in real-world deployments.
6. Conclusions and Future Directions
This study demonstrates that strategic sensor placement and architectural innovation can transform HAR systems for agricultural human–robot collaboration. The central finding—that chest-mounted sensors paired with 0.5 s temporal windows achieve 99.92% accuracy—highlights a key principle: effective agricultural HAR relies not merely on computational sophistication but on recognizing the biomechanical signatures of farm work itself.
These findings carry three significant implications for the field. First, they challenge the prevailing assumption that longer temporal contexts improve activity recognition. Our results show that agricultural tasks exhibit highly discriminative features within short intervals, suggesting that real-time systems can maintain speed and accuracy. This insight addresses a critical barrier to deploying HAR in time-sensitive agricultural operations, where delayed recognition may compromise safety or efficiency. Second, the multimodal sensor analysis offers a nuanced perspective on the informational value of farming contexts. While trimodal fusion (accelerometer, gyroscope, magnetometer) yields the highest accuracy, the accelerometer–gyroscope combination achieves 99.49%—a marginal 0.43% reduction that significantly decreases computational overhead and power consumption. This finding has immediate practical value: designers of agricultural wearables can make principled trade-offs between recognition performance and sustainability, enabling full-day operation without sacrificing worker comfort or mobility. Third, and perhaps most importantly, the architectural modifications introduced in 1D-ResNeXt—causal convolution, multi-kernel aggregation, and additive fusion—constitute domain-specific innovations rather than generic adaptations. These design choices stem from recognizing agricultural activities distinct from daily living activities typically studied in conventional HAR research. The 40% parameter reduction achieved through additive fusion, combined with superior recognition accuracy, underscores that agricultural HAR benefits most from purpose-built architectures attuned to farm work’s temporal and biomechanical dynamics.
Beyond its technical contributions, this work addresses a fundamental challenge in agricultural robotics: enabling machines to safely and effectively share workspaces with humans. Accurate, real-time activity recognition forms the perceptual foundation of collaborative farm systems—robots that adapt to what workers are doing, not merely where they are located. The chest sensor’s consistent superiority across temporal windows suggests that core body movements, rather than limb-specific motions, provide the most reliable signals for human–robot coordination.
Future investigations should advance in four directions to ensure these findings achieve practical relevance. First, large-scale field trials need to be carried out in varied agricultural settings such as fruit harvesting, grain processing, and livestock management. These experiments must account for real-world challenges, including diverse weather conditions, irregular terrain, and heterogeneous equipment setups. Performance should also be monitored over extended durations—several months—to evaluate sensor robustness and potential model drift. Second, standardized multi-dataset evaluation frameworks should be developed by gathering HAR data from agricultural practices across different regions, crop systems, and operational methods. Such protocols would validate the system’s ability to generalize across domains. Third, seamless integration with robotic platforms should be explored by designing communication interfaces between HAR modules and agricultural robots. This would enable real-time adaptation to human activity changes, enhancing operational safety and efficiency. Finally, detailed energy optimization studies are required to extend device usability throughout full working days. These efforts should examine adaptive sampling strategies and context-aware sensor activation to minimize power consumption without sacrificing recognition accuracy.
Author Contributions
Conceptualization, S.M. and A.J.; methodology, S.M.; software, A.J.; validation, A.J.; formal analysis, S.M.; investigation, S.M.; resources, A.J.; data curation, A.J.; writing—original draft preparation, S.M.; writing—review and editing, A.J.; visualization, S.M.; supervision, A.J.; project administration, A.J.; funding acquisition, S.M. and A.J. All authors have read and agreed to the published version of the manuscript.
Funding
This research budget was allocated by the University of Phayao; the Thailand Science Research and Innovation Fund (Fundamental Fund); National Science, Research and Innovation Fund (NSRF); and King Mongkut’s University of Technology North Bangkok (Project no. KMUTNB-FF-68-B-02).
Institutional Review Board Statement
Not applicable.
Informed Consent Statement
To clarify, our research utilizes a pre-existing, publicly available dataset. The dataset has been anonymized and does not contain any personally identifiable information. We have cited the source of the dataset in our manuscript and have complied with the terms of use set forth by the dataset provider.
Data Availability Statement
The original data presented in the study are openly available for the Human–Robot Collaboration in Agriculture (HRCA) dataset at https://ibo.certh.gr/open-datasets/, (accessed on 12 April 2025).
Conflicts of Interest
The authors declare no conflicts of interest.
References
- Fue, K.G.; Porter, W.M.; Barnes, E.M.; Rains, G.C. An Extensive Review of Mobile Agricultural Robotics for Field Operations: Focus on Cotton Harvesting. AgriEngineering 2020, 2, 150–174. [Google Scholar] [CrossRef]
- Tan, Y.; Liu, X.; Zhang, J.; Wang, Y.; Hu, Y. A Review of Research on Fruit and Vegetable Picking Robots Based on Deep Learning. Sensors 2025, 25, 3677. [Google Scholar] [CrossRef]
- Ogenyi, U.E.; Liu, J.; Yang, C.; Ju, Z.; Liu, H. Physical Human–Robot Collaboration: Robotic Systems, Learning Methods, Collaborative Strategies, Sensors, and Actuators. IEEE Trans. Cybern. 2021, 51, 1888–1901. [Google Scholar] [CrossRef]
- Raja, R. Software Architecture for Agricultural Robots: Systems, Requirements, Challenges, Case Studies, and Future Perspectives. IEEE Trans. AgriFood Electron. 2024, 2, 125–137. [Google Scholar] [CrossRef]
- Han, J.; Conti, D. Recent Advances in Human–Robot Interactions. Appl. Sci. 2025, 15, 6850. [Google Scholar] [CrossRef]
- Liu, H.; Gamboa, H.; Schultz, T. Human Activity Recognition, Monitoring, and Analysis Facilitated by Novel and Widespread Applications of Sensors. Sensors 2024, 24, 5250. [Google Scholar] [CrossRef]
- Bhola, G.; Vishwakarma, D.K. A review of vision-based indoor HAR: State-of-the-art, challenges, and future prospects. Multimed. Tools Appl. 2023, 83, 1965–2005. [Google Scholar] [CrossRef] [PubMed]
- Ankalaki, S. Simple to Complex, Single to Concurrent Sensor-Based Human Activity Recognition: Perception and Open Challenges. IEEE Access 2024, 12, 93450–93486. [Google Scholar] [CrossRef]
- Moysiadis, V.; Benos, L.; Karras, G.; Kateris, D.; Peruzzi, A.; Berruto, R.; Papageorgiou, E.; Bochtis, D. Human–Robot Interaction through Dynamic Movement Recognition for Agricultural Environments. AgriEngineering 2024, 6, 2494–2512. [Google Scholar] [CrossRef]
- Upadhyay, A.; Zhang, Y.; Koparan, C.; Rai, N.; Howatt, K.; Bajwa, S.; Sun, X. Advances in ground robotic technologies for site-specific weed management in precision agriculture: A review. Comput. Electron. Agric. 2024, 225, 109363. [Google Scholar] [CrossRef]
- Moysiadis, V.; Katikaridis, D.; Benos, L.; Busato, P.; Anagnostis, A.; Kateris, D.; Pearson, S.; Bochtis, D. An Integrated Real-Time Hand Gesture Recognition Framework for Human–Robot Interaction in Agriculture. Appl. Sci. 2022, 12, 8160. [Google Scholar] [CrossRef]
- Pal, A.; Leite, A.C.; From, P.J. A novel end-to-end vision-based architecture for agricultural human–robot collaboration in fruit picking operations. Robot. Auton. Syst. 2024, 172, 104567. [Google Scholar] [CrossRef]
- Thottempudi, P.; Acharya, B.; Moreira, F. High-Performance Real-Time Human Activity Recognition Using Machine Learning. Mathematics 2024, 12, 3622. [Google Scholar] [CrossRef]
- Mekruksavanich, S.; Jitpattanakul, A. A Deep Learning Network with Aggregation Residual Transformation for Human Activity Recognition Using Inertial and Stretch Sensors. Computers 2023, 12, 141. [Google Scholar] [CrossRef]
- Aguileta, A.A.; Brena, R.F.; Mayora, O.; Molino-Minero-Re, E.; Trejo, L.A. Multi-Sensor Fusion for Activity Recognition—A Survey. Sensors 2019, 19, 3808. [Google Scholar] [CrossRef]
- Pham, M.; Yang, D.; Sheng, W. A Sensor Fusion Approach to Indoor Human Localization Based on Environmental and Wearable Sensors. IEEE Trans. Autom. Sci. Eng. 2019, 16, 339–350. [Google Scholar] [CrossRef]
- Mekruksavanich, S.; Jitpattanakul, A.; Youplao, P.; Yupapin, P. Enhanced Hand-Oriented Activity Recognition Based on Smartwatch Sensor Data Using LSTMs. Symmetry 2020, 12, 1570. [Google Scholar] [CrossRef]
- Mekruksavanich, S.; Jantawong, P.; Jitpattanakul, A. Deep Learning Approaches for HAR of Daily Living Activities Using IMU Sensors in Smart Glasses. In Proceedings of the 2023 Joint International Conference on Digital Arts, Media and Technology with ECTI Northern Section Conference on Electrical, Electronics, Computer and Telecommunications Engineering (ECTI DAMT & NCON), Phuket, Thailand, 22–25 March 2023; pp. 474–478. [Google Scholar] [CrossRef]
- Ye, X.; Sakurai, K.; Nair, N.K.C.; Wang, K.I.K. Machine Learning Techniques for Sensor-Based Human Activity Recognition with Data Heterogeneity—A Review. Sensors 2024, 24, 7975. [Google Scholar] [CrossRef]
- Kaseris, M.; Kostavelis, I.; Malassiotis, S. A Comprehensive Survey on Deep Learning Methods in Human Activity Recognition. Mach. Learn. Knowl. Extr. 2024, 6, 842–876. [Google Scholar] [CrossRef]
- Lai, Y.C.; Kan, Y.C.; Hsu, K.C.; Lin, H.C. Multiple inputs modeling of hybrid convolutional neural networks for human activity recognition. Biomed. Signal Process. Control 2024, 92, 106034. [Google Scholar] [CrossRef]
- Sassi Hidri, M.; Hidri, A.; Alsaif, S.A.; Alahmari, M.; AlShehri, E. Enhancing Sensor-Based Human Physical Activity Recognition Using Deep Neural Networks. J. Sens. Actuator Netw. 2025, 14, 42. [Google Scholar] [CrossRef]
- Pan, J.; Hu, Z.; Yin, S.; Li, M. GRU with Dual Attentions for Sensor-Based Human Activity Recognition. Electronics 2022, 11, 1797. [Google Scholar] [CrossRef]
- Xie, S.; Girshick, R.; Dollár, P.; Tu, Z.; He, K. Aggregated Residual Transformations for Deep Neural Networks. In Proceedings of the 2017 IEEE Conference on Computer Vision and Pattern Recognition (CVPR), Honolulu, HI, USA, 21–26 July 2017; pp. 5987–5995. [Google Scholar] [CrossRef]
- Fukatsu, T.; Nanseki, T. Monitoring System for Farming Operations with Wearable Devices Utilized Sensor Networks. Sensors 2009, 9, 6171–6184. [Google Scholar] [CrossRef] [PubMed]
- Yerebakan, M.O.; Hu, B. Wearable Sensors Assess the Effects of Human–Robot Collaboration in Simulated Pollination. Sensors 2024, 24, 577. [Google Scholar] [CrossRef]
- Dentamaro, V.; Gattulli, V.; Impedovo, D.; Manca, F. Human activity recognition with smartphone-integrated sensors: A survey. Expert Syst. Appl. 2024, 246, 123143. [Google Scholar] [CrossRef]
- Uddin, M.Z.; Soylu, A. Human activity recognition using wearable sensors, discriminant analysis, and long short-term memory-based neural structured learning. Sci. Rep. 2021, 11, 16455. [Google Scholar] [CrossRef]
- Aiello, G.; Catania, P.; Vallone, M.; Venticinque, M. Worker safety in agriculture 4.0: A new approach for mapping operator’s vibration risk through Machine Learning activity recognition. Comput. Electron. Agric. 2022, 193, 106637. [Google Scholar] [CrossRef]
- Tagarakis, A.C.; Benos, L.; Aivazidou, E.; Anagnostis, A.; Kateris, D.; Bochtis, D. Wearable Sensors for Identifying Activity Signatures in Human-Robot Collaborative Agricultural Environments. Eng. Proc. 2021, 9, 5. [Google Scholar] [CrossRef]
- Anagnostis, A.; Benos, L.; Tsaopoulos, D.; Tagarakis, A.; Tsolakis, N.; Bochtis, D. Human Activity Recognition Through Recurrent Neural Networks for Human–Robot Interaction in Agriculture. Appl. Sci. 2021, 11, 2188. [Google Scholar] [CrossRef]
- Chen, K.; Zhang, D.; Yao, L.; Guo, B.; Yu, Z.; Liu, Y. Deep Learning for Sensor-based Human Activity Recognition: Overview, Challenges, and Opportunities. ACM Comput. Surv. 2021, 54, 77. [Google Scholar] [CrossRef]
- Mekruksavanich, S.; Jitpattanakul, A. RNN-based deep learning for physical activity recognition using smartwatch sensors: A case study of simple and complex activity recognition. Math. Biosci. Eng. 2022, 19, 5671–5698. [Google Scholar] [CrossRef]
- Ordóñez, F.J.; Roggen, D. Deep Convolutional and LSTM Recurrent Neural Networks for Multimodal Wearable Activity Recognition. Sensors 2016, 16, 115. [Google Scholar] [CrossRef] [PubMed]
- Imran, H.A.; Hamza, K.; Mehmood, Z. HARResNext: An efficient ResNext inspired network for human activity recognition with inertial sensors. In Proceedings of the 2022 2nd International Conference on Digital Futures and Transformative Technologies (ICoDT2), Rawalpindi, Pakistan, 24–26 May 2022; pp. 1–4. [Google Scholar] [CrossRef]
- Benos, L.; Tsaopoulos, D.; Tagarakis, A.C.; Kateris, D.; Bochtis, D. Optimal Sensor Placement and Multimodal Fusion for Human Activity Recognition in Agricultural Tasks. Appl. Sci. 2024, 14, 8520. [Google Scholar] [CrossRef]
- Slattery, P.; Cofré Lizama, L.E.; Wheat, J.; Gastin, P.; Dascombe, B.; Middleton, K. The Agreement between Wearable Sensors and Force Plates for the Analysis of Stride Time Variability. Sensors 2024, 24, 3378. [Google Scholar] [CrossRef]
- Salminen, M.; Perttunen, J.; Avela, J.; Vehkaoja, A. A novel method for accurate division of the gait cycle into seven phases using shank angular velocity. Gait Posture 2024, 111, 1–7. [Google Scholar] [CrossRef] [PubMed]
- Ismail Fawaz, H.; Lucas, B.; Forestier, G.; Pelletier, C.; Schmidt, D.F.; Weber, J.; Webb, G.I.; Idoumghar, L.; Muller, P.A.; Petitjean, F. InceptionTime: Finding AlexNet for time series classification. Data Min. Knowl. Discov. 2020, 34, 1936–1962. [Google Scholar] [CrossRef]
- Bragança, H.; Colonna, J.G.; Oliveira, H.A.B.F.; Souto, E. How Validation Methodology Influences Human Activity Recognition Mobile Systems. Sensors 2022, 22, 2360. [Google Scholar] [CrossRef]
- Yu, J.; Zhang, L.; Cheng, D.; Bu, C.; Wu, H.; Song, A. RepMobile: A MobileNet-Like Network With Structural Reparameterization for Sensor-Based Human Activity Recognition. IEEE Sens. J. 2024, 24, 24224–24237. [Google Scholar] [CrossRef]
- Silpa, A.S.; Benifa, J.B.; Anu, K.; Vijayakumar, A. Human Activity Recognition Using Efficientnet-B0 Deep Learning Model. In Proceedings of the 2023 Intelligent Computing and Control for Engineering and Business Systems (ICCEBS), Chennai, India, 14–15 December 2023; pp. 1–3. [Google Scholar] [CrossRef]
- Zhou, H.; Zhao, Y.; Liu, Y.; Lu, S.; An, X.; Liu, Q. Multi-Sensor Data Fusion and CNN-LSTM Model for Human Activity Recognition System. Sensors 2023, 23, 4750. [Google Scholar] [CrossRef]


Disclaimer/Publisher’s Note: The statements, opinions and data contained in all publications are solely those of the individual author(s) and contributor(s) and not of MDPI and/or the editor(s). MDPI and/or the editor(s) disclaim responsibility for any injury to people or property resulting from any ideas, methods, instructions or products referred to in the content. |
© 2025 by the authors. Licensee MDPI, Basel, Switzerland. This article is an open access article distributed under the terms and conditions of the Creative Commons Attribution (CC BY) license (https://creativecommons.org/licenses/by/4.0/).