Article

Heart Attack Risk Prediction via Stacked Ensemble Metamodeling: A Machine Learning Framework for Real-Time Clinical Decision Support

by
Brandon N. Nava-Martinez
,
Sahid S. Hernandez-Hernandez
,
Denzel A. Rodriguez-Ramirez
,
Jose L. Martinez-Rodriguez
,
Ana B. Rios-Alvarado
*,
Alan Diaz-Manriquez
,
Jose R. Martinez-Angulo
and
Tania Y. Guerrero-Melendez
Faculty of Engineering and Science, Autonomous University of Tamaulipas, Ciudad Victoria 87000, Mexico
*
Author to whom correspondence should be addressed.
Informatics 2025, 12(4), 110; https://doi.org/10.3390/informatics12040110
Submission received: 19 August 2025 / Revised: 7 October 2025 / Accepted: 8 October 2025 / Published: 11 October 2025
(This article belongs to the Special Issue Health Data Management in the Age of AI)

Abstract

Cardiovascular diseases claim millions of lives each year, yet timely diagnosis remains a significant challenge due to the high number of patients and associated costs. Although various machine learning solutions have been proposed for this problem, most approaches rely on careful data preprocessing and feature engineering workflows that could benefit from more comprehensive documentation in research publications. To address this issue, this paper presents a machine learning framework for predicting heart attack risk online. Our systematic methodology integrates a unified pipeline featuring advanced data preprocessing, optimized feature selection, and an exhaustive hyperparameter search using cross-validated grid evaluation. We employ a metamodel ensemble strategy, testing and combining six traditional supervised models along with six stacking and voting ensemble models. The proposed system achieves accuracies ranging from 90.2% to 98.9% on three independent clinical datasets, outperforming current state-of-the-art methods. Additionally, it powers a deployable, lightweight web application for real-time decision support. By merging cutting-edge AI with clinical usability, this work offers a scalable solution for early intervention in cardiovascular care.

1. Introduction

Cardiovascular diseases represent one of the greatest threats to global health, claiming an estimated 17.9 million lives each year, according to the World Health Organization [1]. In many healthcare settings, overwhelming patient volumes and scarce specialist availability frequently lead to critical delays in heart attack risk identification. In this context, machine learning-powered predictive tools provide a transformative solution for identifying at-risk patients, enabling early interventions that can save lives [2]. However, implementing such tools in clinical settings faces significant hurdles: inconsistent data quality and availability, complex preprocessing requirements, the need for artificial intelligence expertise, and challenges in translating technical outputs into actionable clinical insights for medical personnel. To achieve real-world impact, these solutions must prioritize accessibility, interpretability, and seamless integration into existing medical workflows [3].
Cardiovascular risk prediction has been extensively explored using traditional machine learning algorithms, with Naive Bayes, Support Vector Machines (SVMs), and Logistic Regression commonly employed in prior studies [4,5,6]. However, these methods typically demand rigorous data preprocessing and feature engineering pipelines that are not always adequately described. This lack of documentation creates challenges for both feature selection and model interpretability—particularly when working with limited clinical datasets where optimal feature representation is essential for predictive performance [5]. In this regard, recent research has demonstrated the efficacy of ensemble-based metamodels for cardiovascular disease prediction [7], highlighting their strong potential for heart attack risk prediction. However, critical gaps persist in two key areas: (1) systematic approaches for optimizing data preprocessing and hyperparameter configuration across different metamodel architectures, and (2) robust methodologies for selecting the most suitable model for specific clinical datasets. Furthermore, the development of deployable solutions capable of real-time prediction remains an essential yet underaddressed challenge in translational applications.
This paper presents an end-to-end methodology for heart attack risk prediction, integrating a comprehensive analysis of multiple machine learning classifiers with clinically deployable decision support. Our framework comprises three key components: (1) a robust data preprocessing pipeline incorporating integrity verification, anomaly detection (e.g., outlier removal and distribution normalization), and optimized feature selection; (2) a model development stage involving comparative evaluation of six supervised learning models as base learners for six ensemble metamodels using stacking and voting strategies; and (3) deployment of top-performing configurations through an interactive web interface for real-time clinical use. Experimental validation on three independent physico-clinical datasets demonstrated strong performance, with accuracies ranging from 90.2% to 98.9%—surpassing some state-of-the-art approaches. The implemented web interface enables healthcare providers (e.g., physicians and nurses) to input key patient parameters (including age, gender, exang, Oldpeak, and thalach) and select optimal models for instant risk stratification and clinical decision-making. With its hospital-ready implementation (featuring an intuitive UI) and benchmark-setting performance, this system represents a viable tool for advancing preventive cardiology practice.
The remainder of this paper is organized as follows: Section 2 reviews related work. Section 3 details the proposed methodology, while Section 4 describes the experimental setup, evaluation metrics, and model comparisons. Section 5 presents and analyzes the results. Section 6 presents the discussion. Finally, Section 7 provides concluding remarks and discusses implications.

2. Related Work

This section reviews the state of the art in heart attack risk prediction using clinical data. It begins with a critical analysis of studies assessing the performance of machine learning models for classifying heart attacks. Subsequently, it synthesizes advancements in software applications developed for heart attack prediction, including mobile health (mHealth) solutions, clinical decision support systems (CDSS), and dedicated AI-based diagnostic platforms.

2.1. Machine Learning Models

Heart attack prediction can be formalized as a binary classification problem that requires the development of a decision function to assign patients to one of two diagnostic categories: positive (at risk) or negative (no risk). Current research explores multiple methodological approaches, ranging from traditional supervised learning techniques to advanced deep learning architectures, each presenting unique advantages, limitations, and considerations for interpretability, scalability, and integration into real-world clinical workflows and healthcare systems [8].
The methodological considerations for diverse heart attack prediction approaches are related to key stages in the data mining pipeline, beginning with the selection of input datasets. In this regard, current studies utilize diverse data modalities, including coronary computed tomography angiography (CTA) scans, electrocardiogram (ECG) signal analysis, myocardial perfusion imaging (MPI), heart sound recordings, clinical biomarkers, and patient histories, among others [9,10,11]. Among these, clinical data is particularly significant for predicting heart attacks, as it provides reliable indicators of cardiovascular health that demonstrate strong predictive value in modeling. Consequently, the research presented in this section primarily focuses on approaches driven by clinical data.
Several recent studies have explored different machine learning approaches for cardiovascular disease prediction, employing techniques ranging from feature selection to class balancing in clinical datasets. Dritsas and Trigka [5] compared and applied six deep learning models, including multi-layer perceptron (MLP), convolutional neural network (CNN), recurrent neural network (RNN), Long Short-Term Memory (LSTM), gated recurrent units (GRU), and a hybrid model (which combines CNN and GRU). Although tested with a limited dataset (297 instances), the hybrid model outperforms the other models by effectively capturing spatiotemporal features. Similar proposals explore other algorithms such as Random Forest (RF) [4,12], Extreme Gradient Boosting (XGB) [13,14], or k-Nearest Neighbors (KNN) [15], to mention a few.
Dafni et al. [6] proposed a heart disease diagnostic system that integrates bioinformatics with machine learning. Their methodology combines chi-squared (CS) feature selection with a Gaussian Naive Bayes (GNB) classifier, validated using k-fold cross-validation. The authors compared their GNB model’s performance against other algorithms, including Support Vector Machines (SVM) and Gradient Boosting. The model was trained on clinical data, comprising variables such as age, blood pressure, heart rate, and troponin levels, which were preprocessed to extract the most relevant features.
Bouqentar et al. [16] presented a pipeline for processing data from the Cleveland dataset. This pipeline includes preprocessing and feature selection, followed by the preparation and configuration of six machine learning models: AdaBoost, Support Vector Machines (SVM), linear regression (LR), KNN, RF, and Decision Trees (DT). Although the dataset used contains limited samples, significant improvements in the F1-score were observed, demonstrating the enhanced robustness of data management in preparing models for real clinical data.
On the other hand, ensemble learning methods have proven particularly effective for heart attack prediction, offering improved accuracy and robustness compared to traditional models [17]. Among these methods, Boosting, Stacking, and Voting techniques have emerged as especially successful strategies.
Studies such as [18,19] utilize base models like linear regression and SVM to develop ensemble systems using Gradient Boosting and RF with a boosting approach. This technique trains models sequentially, with each new model aimed at correcting the errors of its predecessors. In contrast, other approaches such as [20,21,22,23] demonstrates the effectiveness of stacking strategies. These approaches leverage the strengths of diverse base models, combining them through a metamodel to enhance predictive performance. Finally, in the voting strategy, the outputs of various classifiers are considered to make a final decision. Doppala et al. [7] developed an Ensemble Voting strategy composed of seven classifiers (DT, RF, NB, LR, SVM, GBC, XGB) using a majority voting mechanism. This approach employs weighted classifiers, ensuring that more reliable classifiers (with higher weights) have a greater influence on the final decision.
While ensemble methods have proven valuable, several challenges remain in their widespread implementation across different data types. These challenges include risks of overfitting, high computational costs, the complexity of hyperparameter tuning, and issues with model interpretability, among others. Therefore, there is a critical need for adaptive strategies that facilitate informed decisions based on specific data characteristics and the underlying requirements of the models.

2.2. System Applications

In addition to data preparation and learning, deployment represents a further step where trained models are applied to predict the categories of new instances in real-world environments. Consequently, various software applications have been developed to assist medical personnel in making decisions about potential cardiac risks.
Incorporating technologies such as the Internet of Things (IoT) and cloud computing has become attractive for designing systems to anticipate and predict a patient’s risk of cardiac disease [24]. Studies such as [24,25,26,27,28,29] have incorporated sensors and machine learning algorithms to perform this task. Additionally, the need for personal data management and real-time patient data monitoring has led to software applications that enable data visualization and provide recommendations based on the obtained results. Ref. [30] performed heart attack prediction using algorithms such as SVM, KNN, ANN, Logistic Regression, and Gradient Boosting Trees. In this case, users must manually input their medical data, and the application will indicate whether they are at risk of a heart attack. Meanwhile, Ref. [31] describes the HealthFaaS framework, which collects user health data through IoT devices and transmits it to AI models implemented in a serverless computing environment on the Google Cloud Platform. This approach enables cloud-based systems to provide benefits such as dynamic scalability and reduced operational complexity.
Likewise, various approaches have proposed applications for predicting heart attacks, which can be deployed in mobile environments [30] or on web platforms [32,33]. These approaches face several challenges related to model preparation and technical constraints [32,34]. On one hand, there is a limitation in the details necessary for configuring models, partly due to data constraints involving variability in feature sets and sample sizes for training. On the other hand, technical and portability constraints, such as network connectivity type, latency, and platform availability, can also pose challenges. Therefore, an ideal deployment should ensure availability and updatability, support diverse predictive features, and achieve high performance, among other considerations.
This work provides a multifaceted contribution. First, it introduces a robust and reproducible methodological framework through a data preprocessing and feature selection pipeline. Second, it presents a novel comparative analysis within a specific ensemble paradigm, comparing stacking and voting techniques. Finally, it ensures practical impact and verifiability by deploying a functional web application.

3. Proposed Methodology

The proposed framework for heart attack prediction is implemented through a structured, five-phase methodology, as illustrated in Figure 1. This hierarchical design modularizes the pipeline to enhance reproducibility and clarify the sequence of tasks, which encompass data acquisition, exploration and preprocessing (feature engineering), model training and tuning, ensemble metamodeling, evaluation, and system deployment. The following subsections provide a comprehensive description of the materials, techniques, and validation procedures employed at each phase to fulfill the stated research objectives.

3.1. Data Acquisition

This stage aims to acquire and collect the data necessary for analysis and prediction. While multiple data sources can support heart attack predictions, this study focuses mainly on clinical data as a complementary resource to other vital signs in the decision-making process. Cardiovascular diseases, including heart attacks, are among the leading causes of mortality worldwide. For this study, we use three datasets containing clinical records relevant to heart attack prediction:
  • Dataset 1. This dataset was obtained from [35]. It was collected at Zheen Hospital in Erbil, Iraq, from January to May 2019. The dataset contains 1319 instances and includes nine key attributes: age, gender, heart rate, systolic blood pressure, diastolic blood pressure, blood sugar, CK-MB, troponin, and an output label indicating the presence (1) or absence (0) of a heart attack. Some features are normalized; for example, gender is represented as male = 1 and female = 0, while blood sugar is coded as 1 if it exceeds 120 and 0 otherwise. A fragment of Dataset 1 is shown in Table 1.
  • Dataset 2. This dataset was obtained online from [36]. It was compiled from four medical databases (Cleveland, Hungary, Switzerland, and Long Beach V.) and consolidated into a single resource containing 1025 instances. Originally, it included 76 attributes; however, this version comprises a curated subset of 14 key features. Commonly used in cardiovascular studies, the dataset contains variables such as age, sex, chest pain type, resting blood pressure, cholesterol, fasting blood sugar, and electrocardiographic results. The main objective is to predict the likelihood of a patient having a heart attack based on these features, with the “target” attribute indicating the risk level. A fragment of Dataset 2 is shown in Table 2.
  • Dataset 3. This dataset was obtained from [37]. It was collected in 2015 at the Faisalabad Institute of Cardiology and the Allied Hospital in Faisalabad, Punjab, Pakistan. It contains 299 instances and includes 13 features that provide clinical and lifestyle information, such as diabetes, creatinine phosphokinase, and platelet counts, among others. A fragment of Dataset 3 is shown in Table 3.

3.2. Exploration and Preprocessing

The purpose of this stage is to analyze the data for any anomalies that need correction. Additionally, we perform preprocessing to adjust data skewness, verify variable correlations, and select features from the datasets, as performed in other health informatics approaches [38]. The tasks in this stage are:
  • Data verification. A general inspection of the dataset structure was conducted to identify potential data integrity issues, such as columns with missing values or data types incompatible with the classification models. Additionally, the target variable of the Dataset 2 was transformed to achieve binary classification, assigning 1 if its value is ≥50, and 0 otherwise.
  • Deduplication. Duplicate data were identified and removed from the dataset. This technique helps reduce noise by removing repetitive entries, ensuring the dataset remains accurate and optimized for analysis.
  • Data distribution analysis. To better understand the nature of the data and identify possible anomalies, such as outliers, an exploratory analysis was conducted on all the numerical variables in the dataset. Distribution graphs were used to facilitate the observation and detection of aspects such as skewness, outliers, and potential transformations.
  • Data transformation. A data transformation was performed to correct outliers. Two techniques were applied:
    -
    Winsorization. Following Dash et al. [39], we apply Winsorization to detect and manage outliers. This technique limits extreme values in the data by replacing the lowest and highest 1% of data points with the nearest values within that range. It reduces the impact of outliers and minimizes their influence on analyses, resulting in a more robust dataset.
    -
    Log transformation. After winsorization, a log transformation is applied using np.log1p (from numpy package), which calculates the natural logarithm of (1 + value). This technique normalizes skewed distributions, stabilizes variance, and makes features more suitable for modeling algorithms that assume normality [40].
    These techniques were applied exclusively to continuous data attributes to reduce outliers and data skewness. For Dataset 1, the attributes analyzed were heart rate, CK-MB, diastolic blood pressure, blood sugar, and troponin. Figure 2 illustrates the distribution of these attributes before (top) and after (bottom) the transformations.
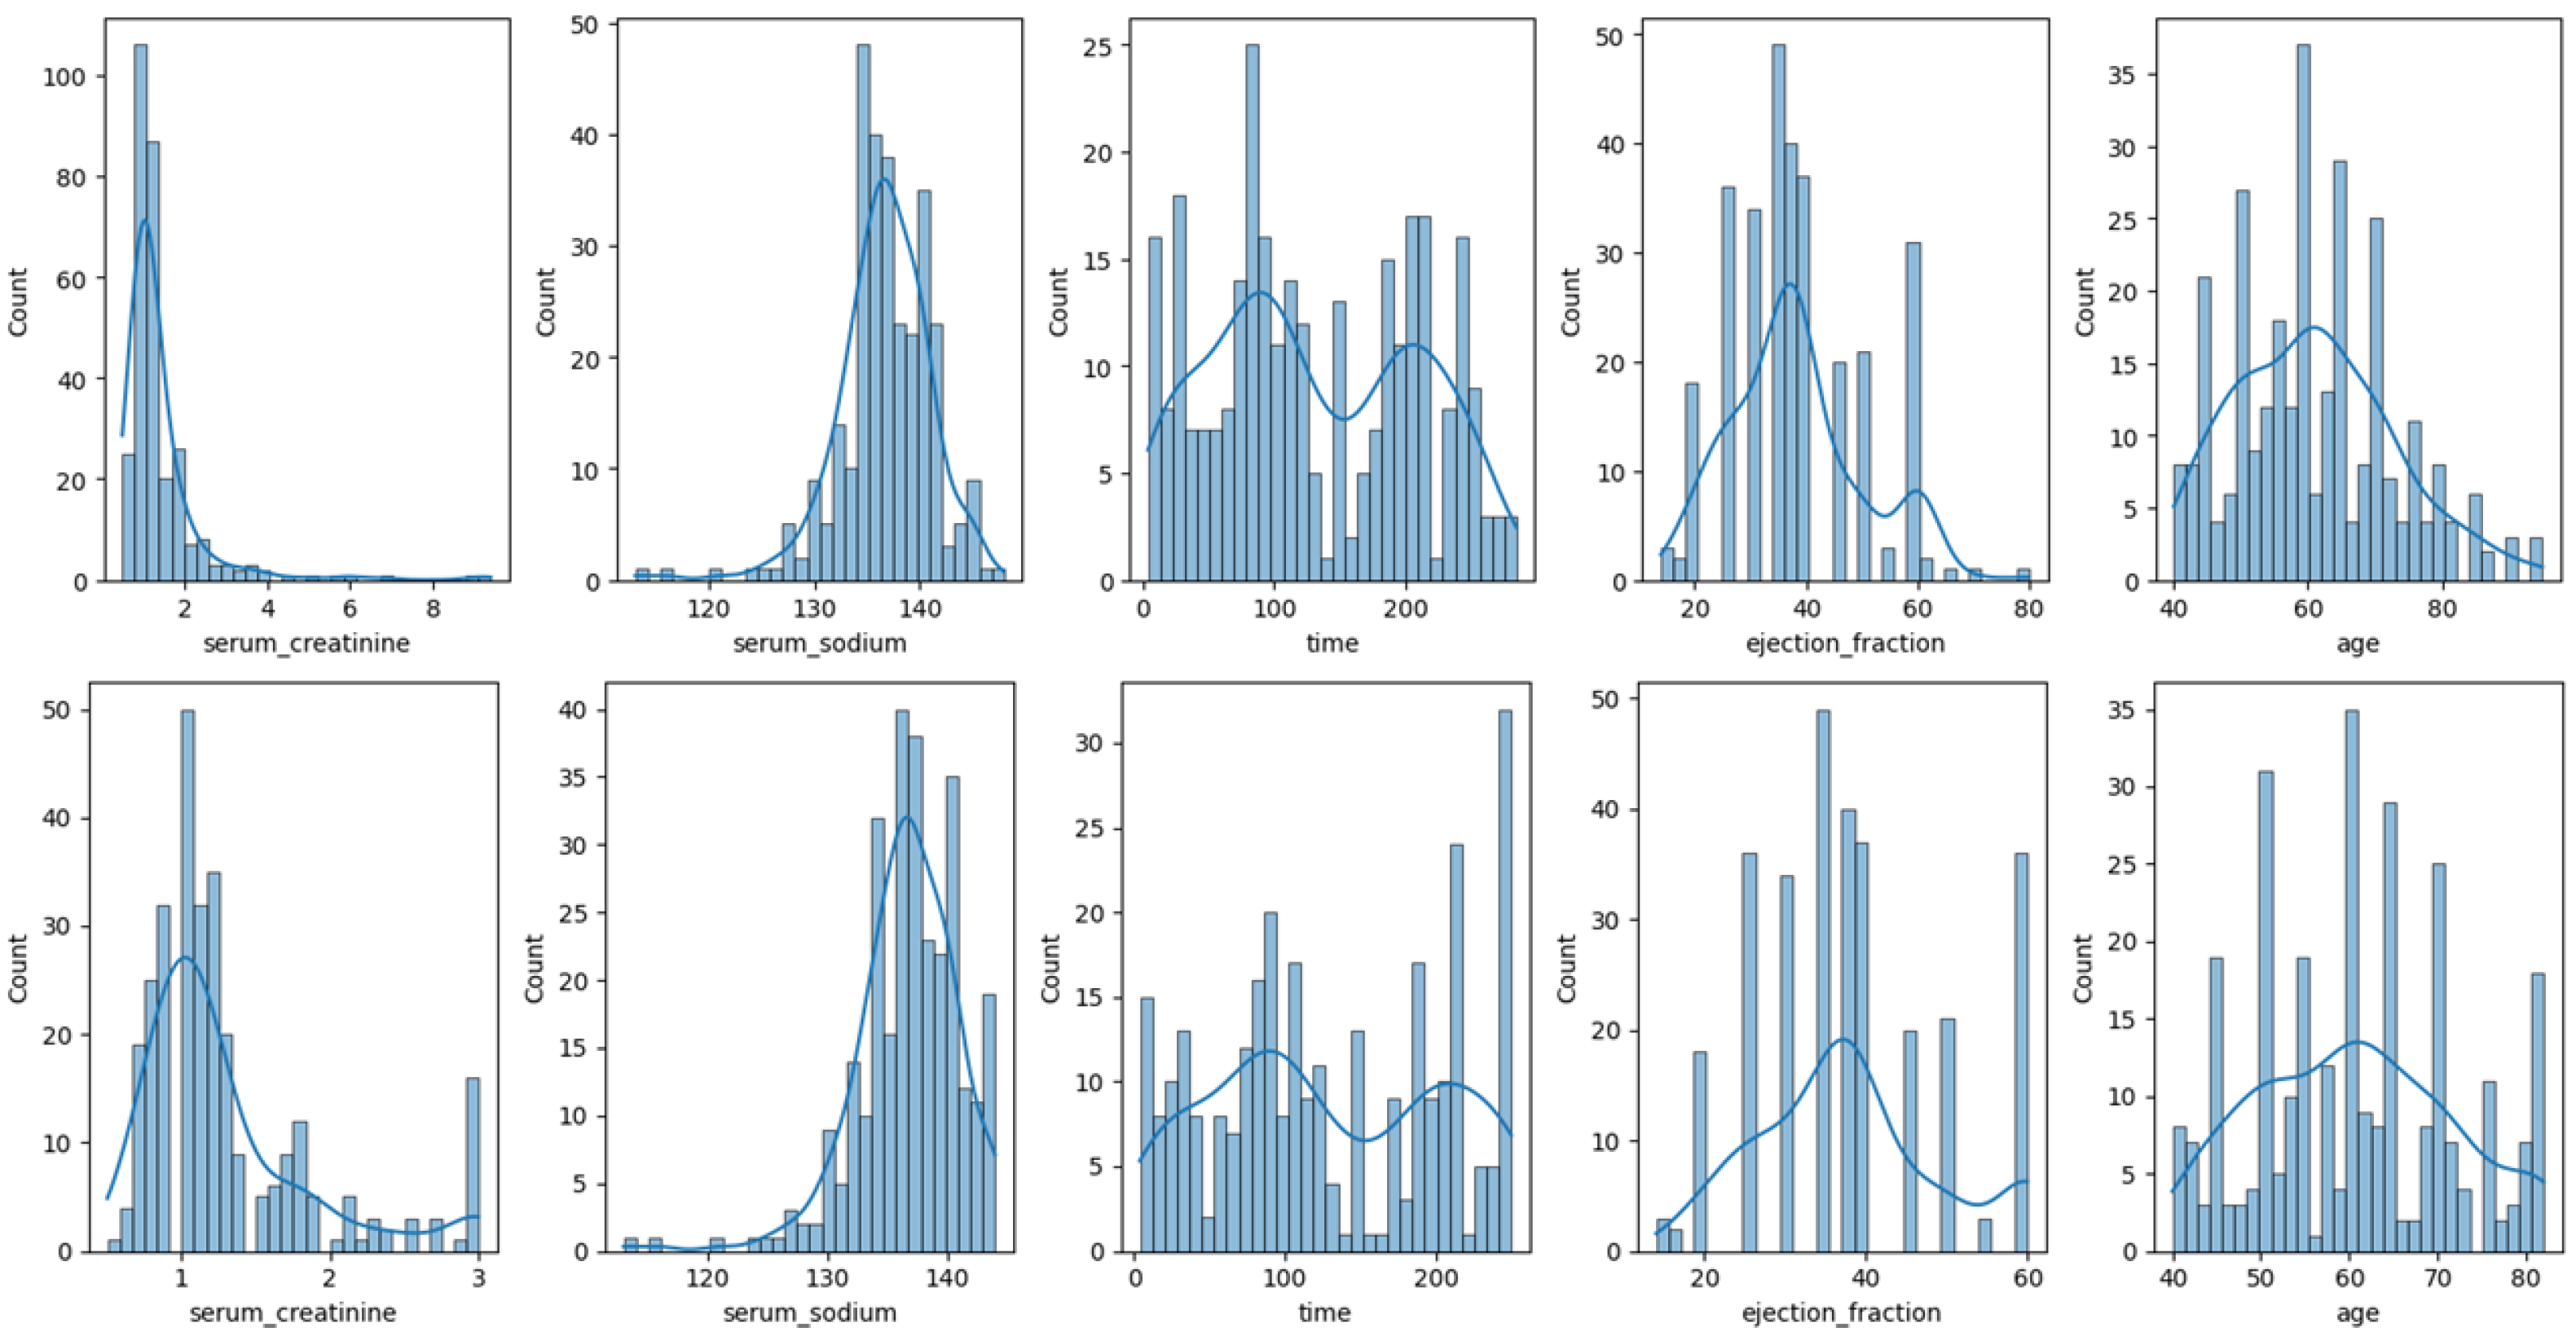
    For Dataset 2, only the log transformation was applied to the trestbps and chol attributes. Figure 3 illustrates the distribution of these attributes before (top) and after (bottom) the transformation. For Dataset 3, transformations were applied to the time, ejection fraction, serum creatinine, serum sodium, and age features. Figure 4 illustrates the distribution of these attributes before (top) and after (bottom) the transformation.
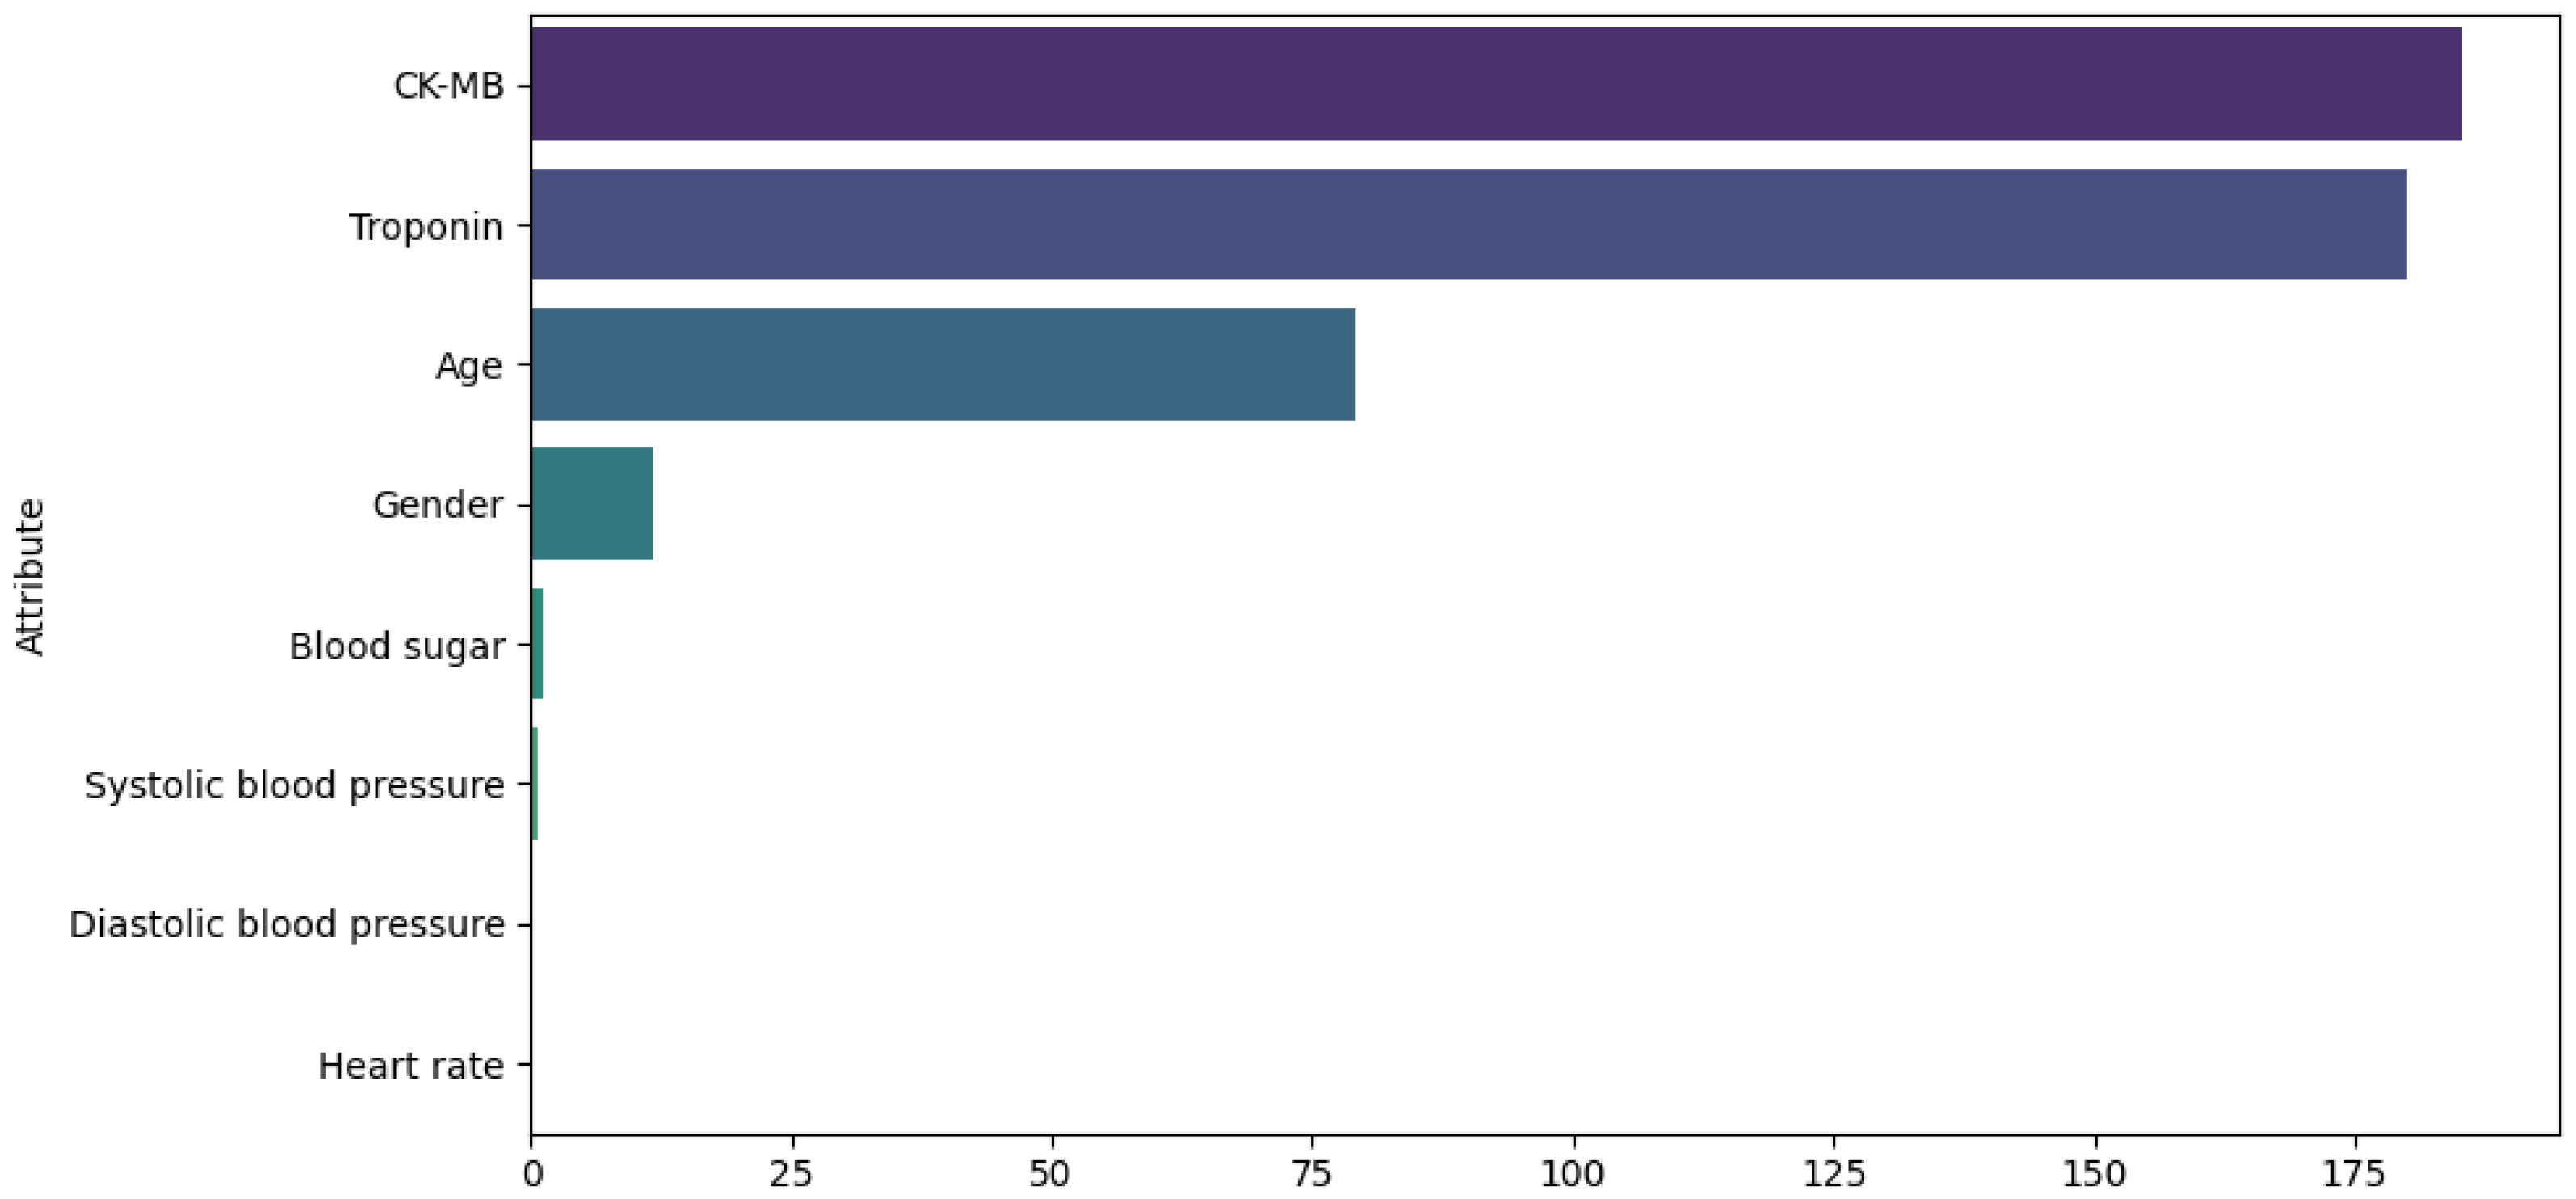
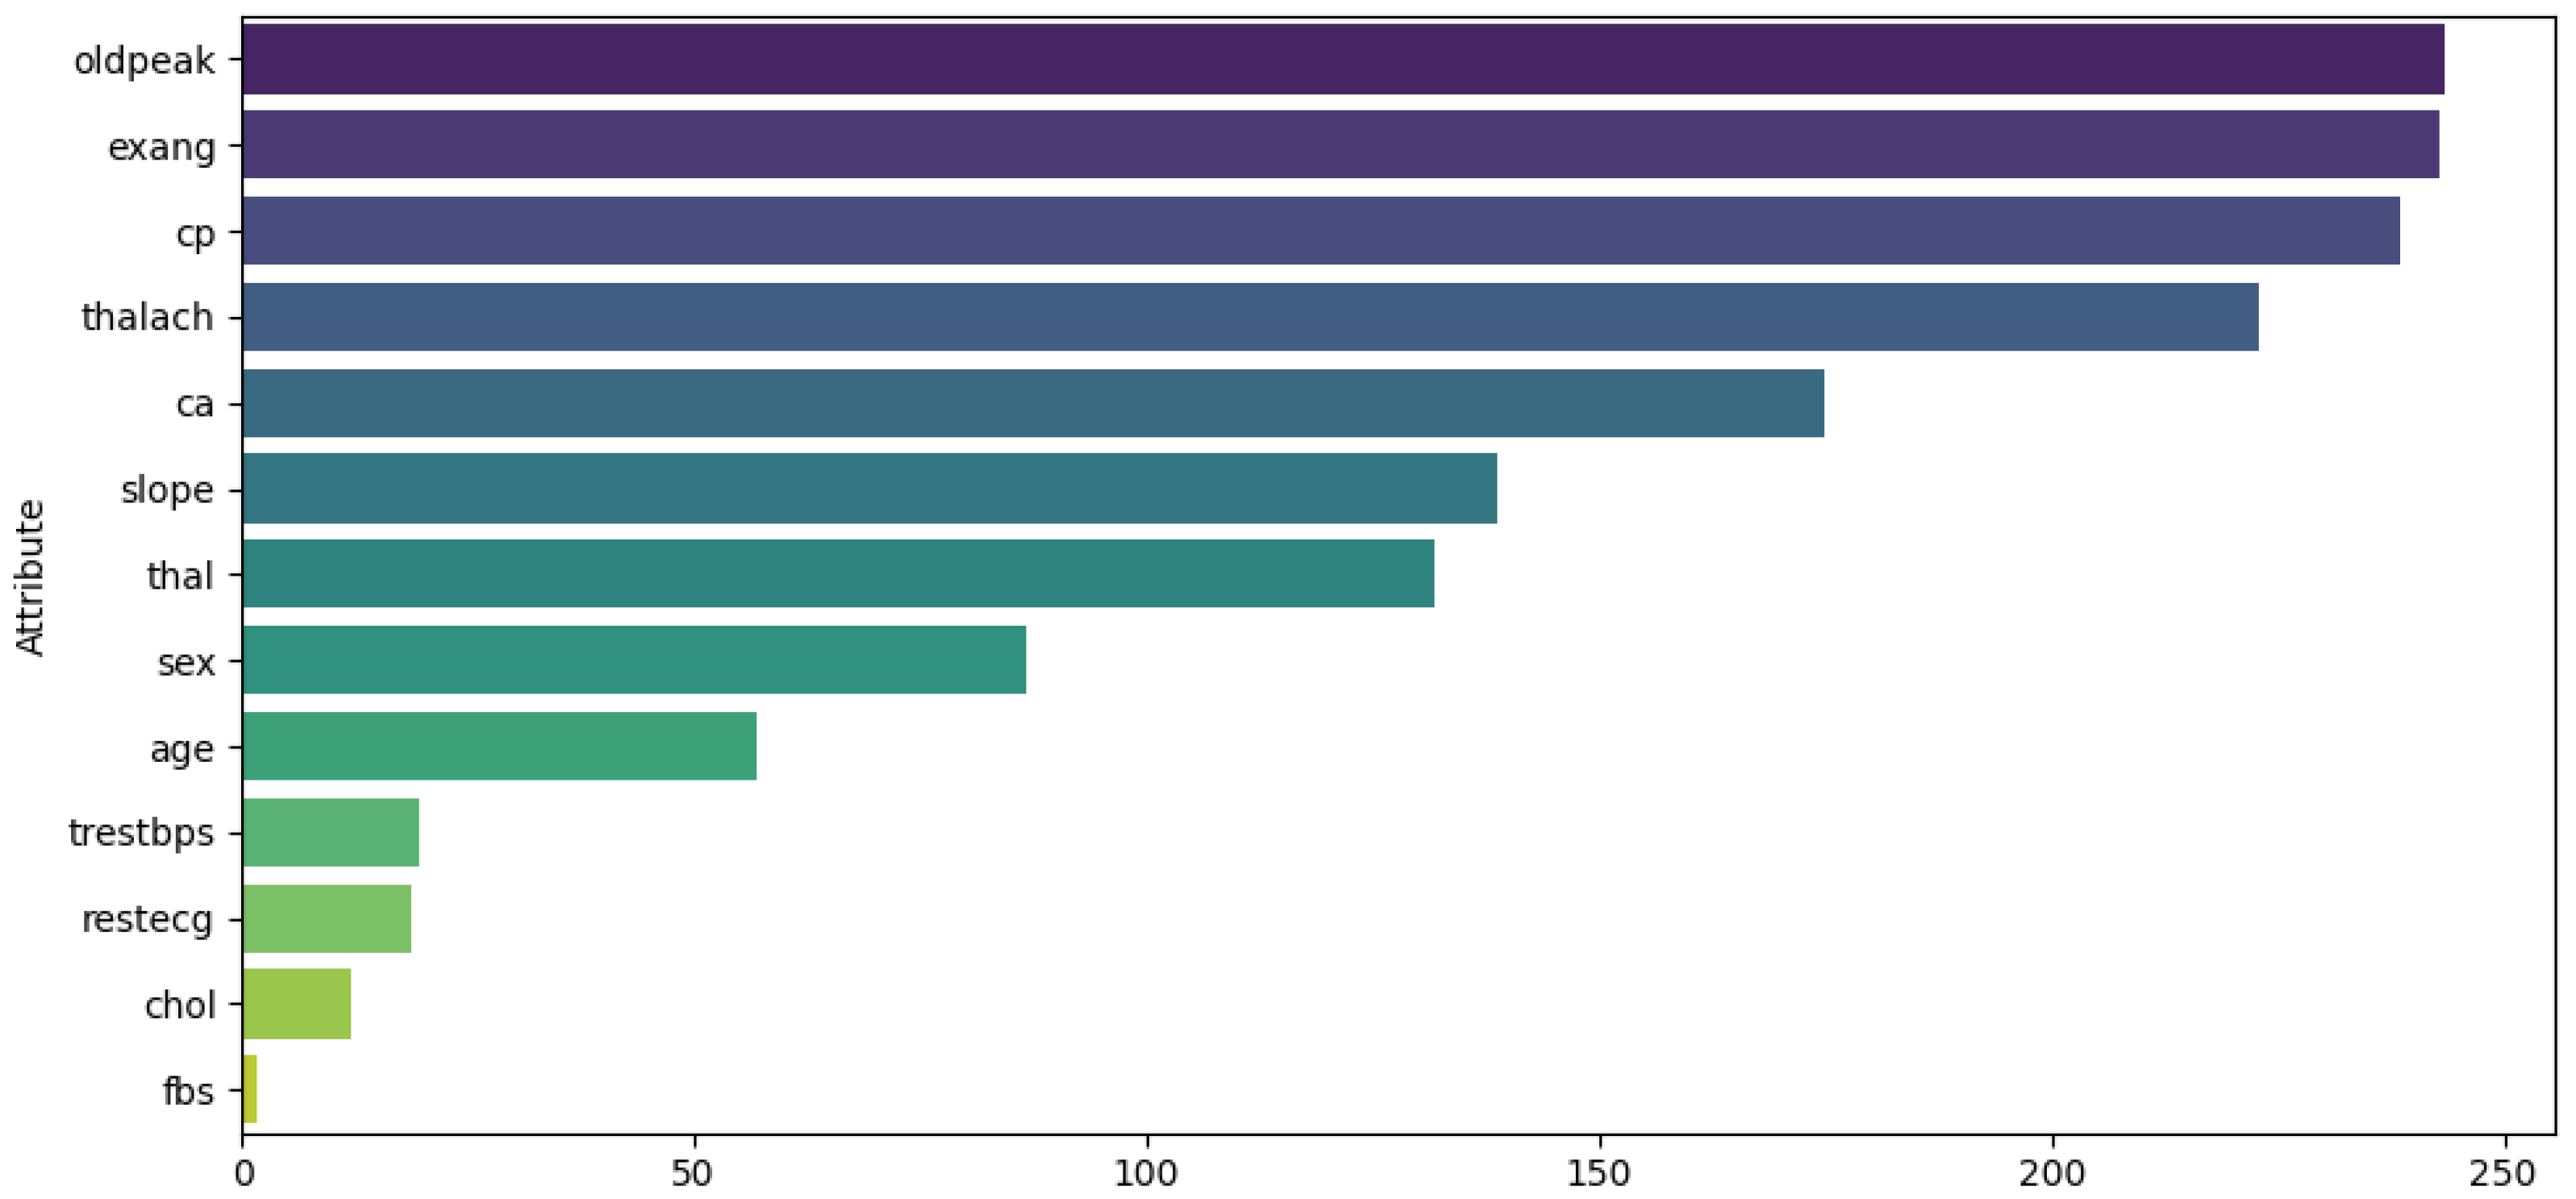
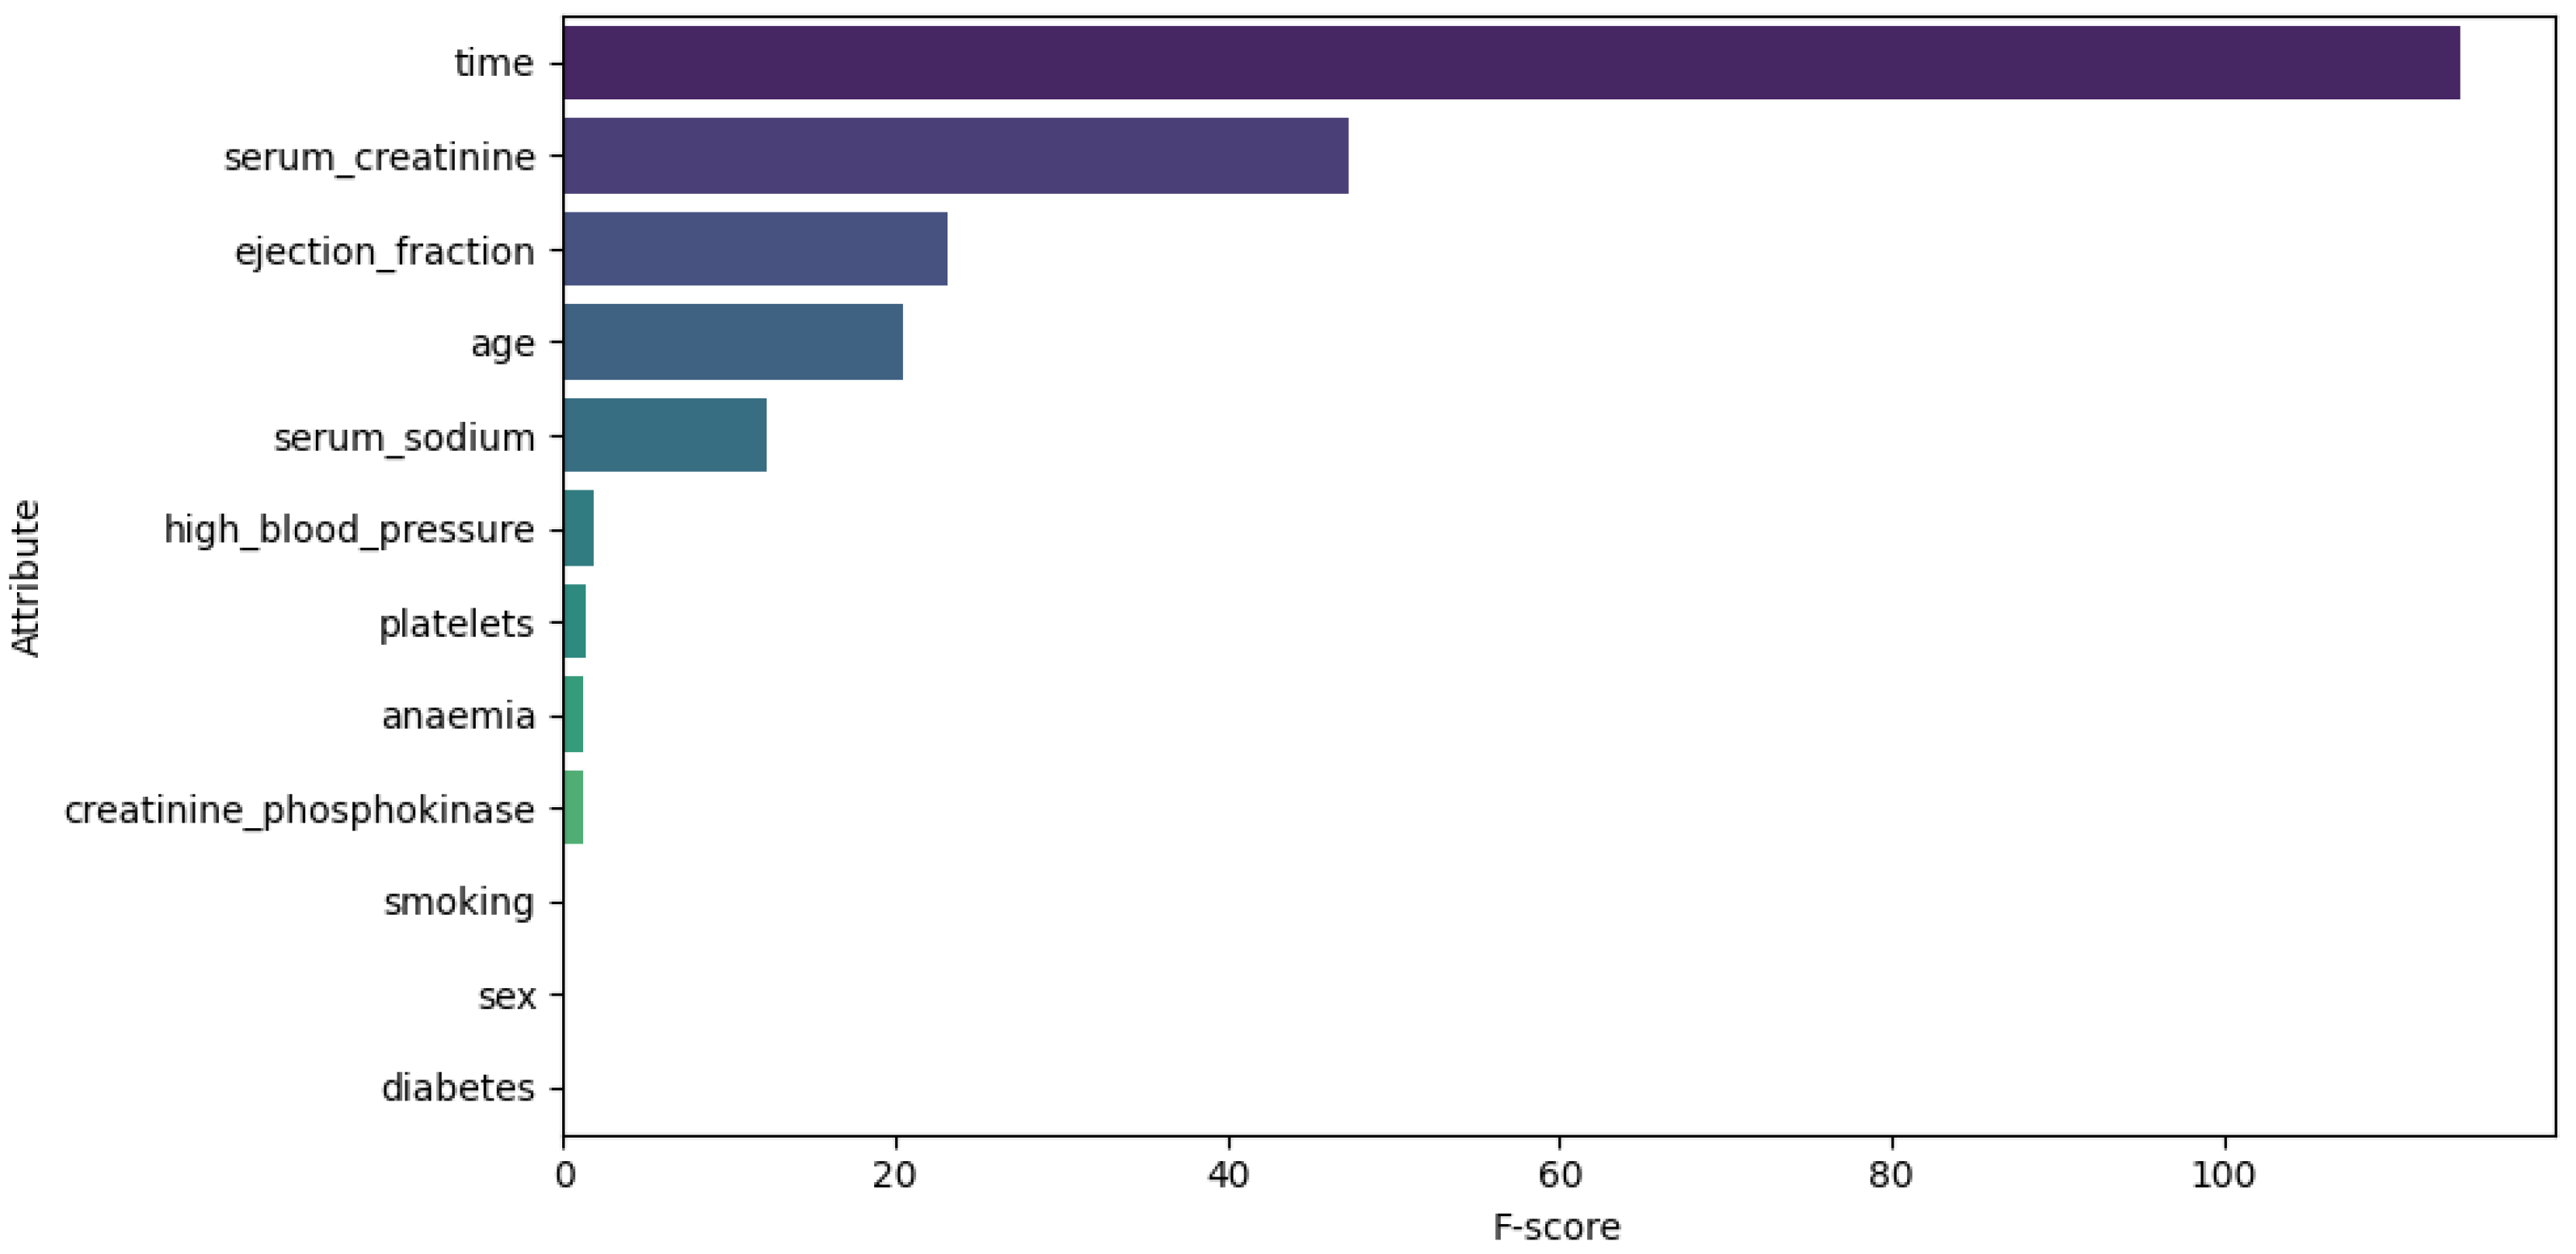
  • Feature selection. The ANOVA F-score test was used to evaluate how feature values vary across different classes of the target variable, identifying those with the greatest discriminatory power. We computed the F-statistic for each feature to assess its predictive power regarding the target variable, as described in [41]. The features were then ranked based on this metric and visualized. This ranking plot helped us identify the most discriminative features. The final selection was made by identifying the inflection point in the plot, following an intuitive principle based on the elbow method to isolate a subset of highly informative features. Figure 5, Figure 6 and Figure 7 illustrate the comparison of the most important attributes for Datasets 1, 2, and 3, respectively. For Dataset 1, the selected attributes were CK-MB, Troponin, Age, and Gender. For Dataset 2, the selected attributes were exang, cp, oldpeak, thalach, and ca. For Dataset 3, the selected attributes were time, ejection fraction, serum creatinine, serum sodium, and age.
  • Data split. The dataset was divided into two subsets: training (80%) and testing (20%). To achieve this, the target variable was separated from the predictor variables, allowing the model to learn to predict the target attribute using only the explanatory variables. The split was performed randomly to ensure an even distribution of data between the two subsets.
  • Normalization. Some machine learning algorithms are sensitive to the scale of the variables, so standard normalization was applied to the input features. To avoid introducing bias into the model, the normalization parameters (mean and standard deviation) were computed exclusively from the training set and then applied to both the test data and any new data. This practice ensures proper generalization of the model and guarantees that the evaluation remains objective and consistent [16].

3.3. Model Learning

This stage is responsible for preparing the machine learning models used for heart attack prediction. To achieve this, the process has been divided into two tasks: individual learning and ensemble learning.

3.3.1. Individual Learning

For this task, various supervised learning algorithms were selected, followed by a hyperparameter tuning process. A brief description of the selected algorithms is as follows:
  • K-Nearest Neighbors (KNN): Classifies or predicts values based on the proximity of data (neighbors) to a given input [42]. The formula is presented in Equation (1).
    y ^ q = arg max y C ( x i , y i ) N k ( x q ) y i = y
    where y ^ q is the response of classifying a sample x q . C is the set of labels or classes, and k is a number of neighbors. N k ( x q ) is a subset of the input (X) that contains the k closest points to x q (using a distance function such as Euclidean distance). Thus, y ^ q is determined by the majority vote of labels in N k ( x q ) .
  • Support Vector Machine (SVM): Its objective is to find the optimal hyperplane that separates the data into different classes, maximizing the distance between the closest points in each category [43]. A concise SVM decision function is presented in Equation (2).
    y ^ q = f ( x q ) = s i g n ( w T ( x q ) + b )
    where f ( X ) is a function with the best-fitting margin (hyperplane minimizing the error), w and b are the weight vector and bias, respectively, and ( ) is a non-linear mapping function.
  • Decision Tree (DT): DTs work by dividing data into branches based on questions or conditions, creating a tree-like structure. At each node, the algorithm makes a decision based on the characteristics of the dataset, eventually arriving at a prediction on the leaves [44]. Given a dataset D, the tree is recursively split into two parts ( D left and D right ) based on a feature i and a threshold θ . The splitting criterion is defined by a function S, as shown in Equation (3).
    S ( D , i , θ ) = Φ ( D ) | D left | | D | Φ ( D left ) + | D right | | D | Φ ( D right )
    where Φ ( ) is an impurity measure or loss function such as Gini impurity, entropy, or variance reduction. Then, the idea is to get the best split through ( i * , θ * ) = arg max i , θ S ( D , i , θ ) .
  • Multi-layer Perceptron (MLP): It is a type of artificial neural network that consists of multiple layers. The input layer receives the dataset features, the hidden layers apply transformations using neurons and activation functions, and the output layer generates the final prediction [45]. The output of layer l is defined recursively as shown in Equations (4)–(8):
    a ( 0 ) = x ,
    z ( l ) = W ( l ) a ( l 1 ) + b ( l ) ,
    a ( l ) = σ ( z ( l ) ) ( activation ) , l { 1 , , L } ,
    a ( L + 1 ) = W ( L + 1 ) a ( L ) + b ( L + 1 ) ( output layer ) .
    y ^ = a ( L + 1 )
    where x is a sample from the input (X), W ( l ) is the weight matrix for layer l, b is the bias vector, σ is a non-linear activation function (e.g., sigmoid), and y ^ is the prediction.
  • Logistic Regression (LR): This algorithm is based on the concept of probability and uses the sigmoid function to transform input values into probabilities ranging from 0 to 1, based on a decision boundary [46]. The sigmoid function and the probabilistic model are presented in Equations (9) and (10).
    σ ( z ) = 1 1 + e z
    h θ : X [ 0 , 1 ] , h θ ( x ) = σ ( θ T x ) = P ( Y = 1 X = x )
    where θ refers to the parameters vector and h θ obtains a hypothesis with the given parameters.
  • Naïve Bayes (NB): It is based on probability theory and Bayes’ Theorem, which assumes that all features are conditionally independent given the class label [47]. The prediction is given by Equation (11).
    y ^ = argmax y k Y P ( Y = y k ) j = 1 d P ( X j = x j Y = y k )
    where d refers to the feature space and the maximum a posteriori (MAP) determines the class prediction.

3.3.2. Hyperparameter Configuration

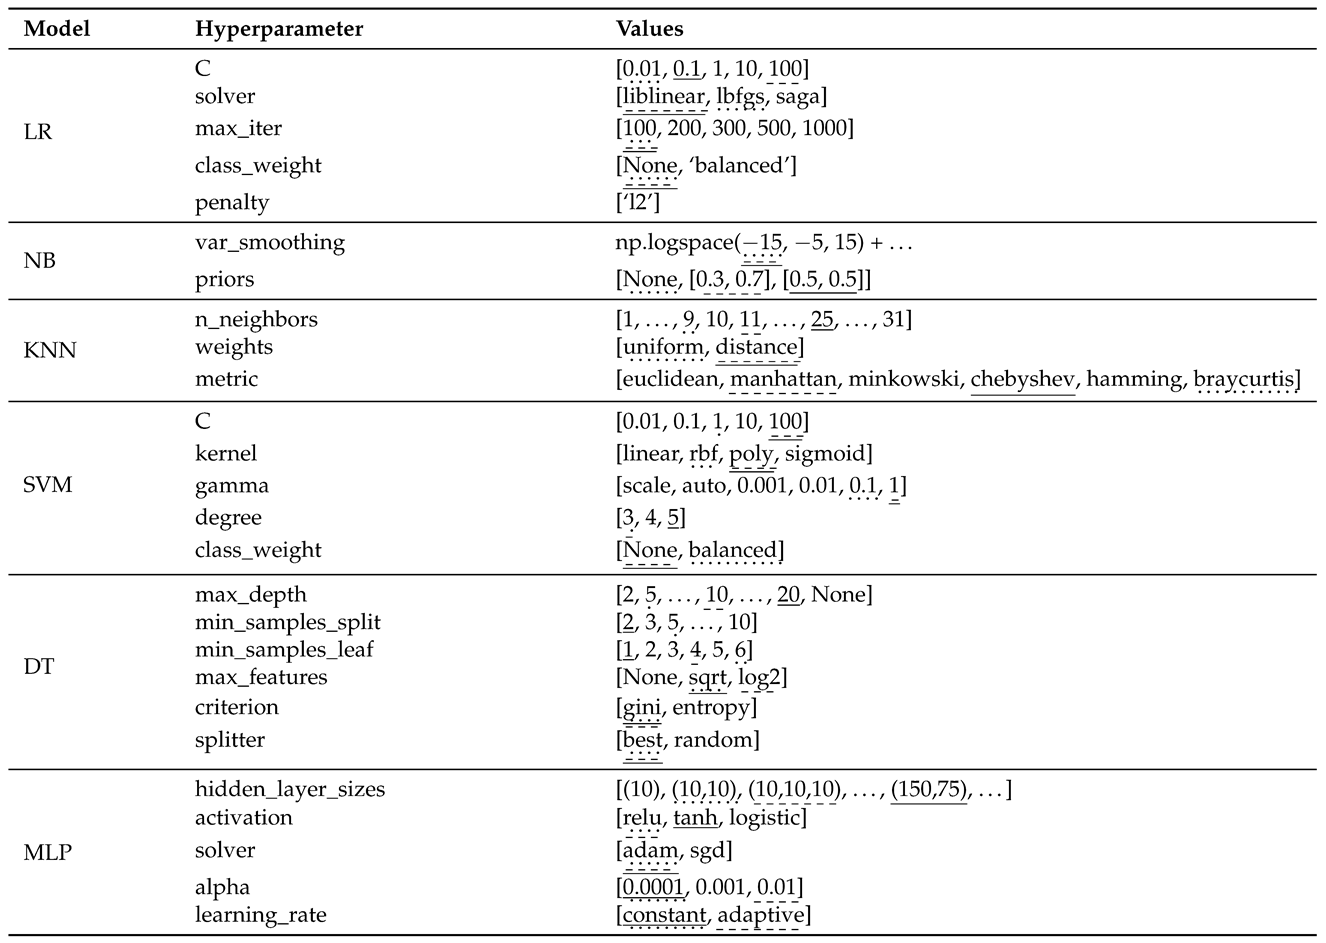
This subsection describes the hyperparameter tuning process for the classification models. We begin by defining a base grid of potential hyperparameter values and combinations to explore during training [48]. Once the grid is established, we use a grid search method to systematically evaluate all possible combinations. Table 4 presents the hyperparameters considered for configuring the selected algorithms. The optimal values, determined from the results in subsequent sections, are indicated in Table 4 with a dashed underline for Dataset 1, a solid underline for Dataset 2, and a dotted underline for Dataset 3.

3.3.3. Ensemble Learning

In this stage, we explore ensemble methods, such as Stacking and Voting, to enhance model accuracy [2,49]. Stacking combines individual models, known as base models, using a metamodel. Starting from a set of base learners ( h 1 , h 2 , , h K ) , the metamodel learns from their predictions y ^ = f meta - model h 1 ( x ) , h 2 ( x ) , , h K ( x ) . In contrast, the Voting ensemble aggregates the outputs of multiple base models through a voting scheme, which can be Hard Voting (Majority Voting) or Soft Voting (Probability Averaging).
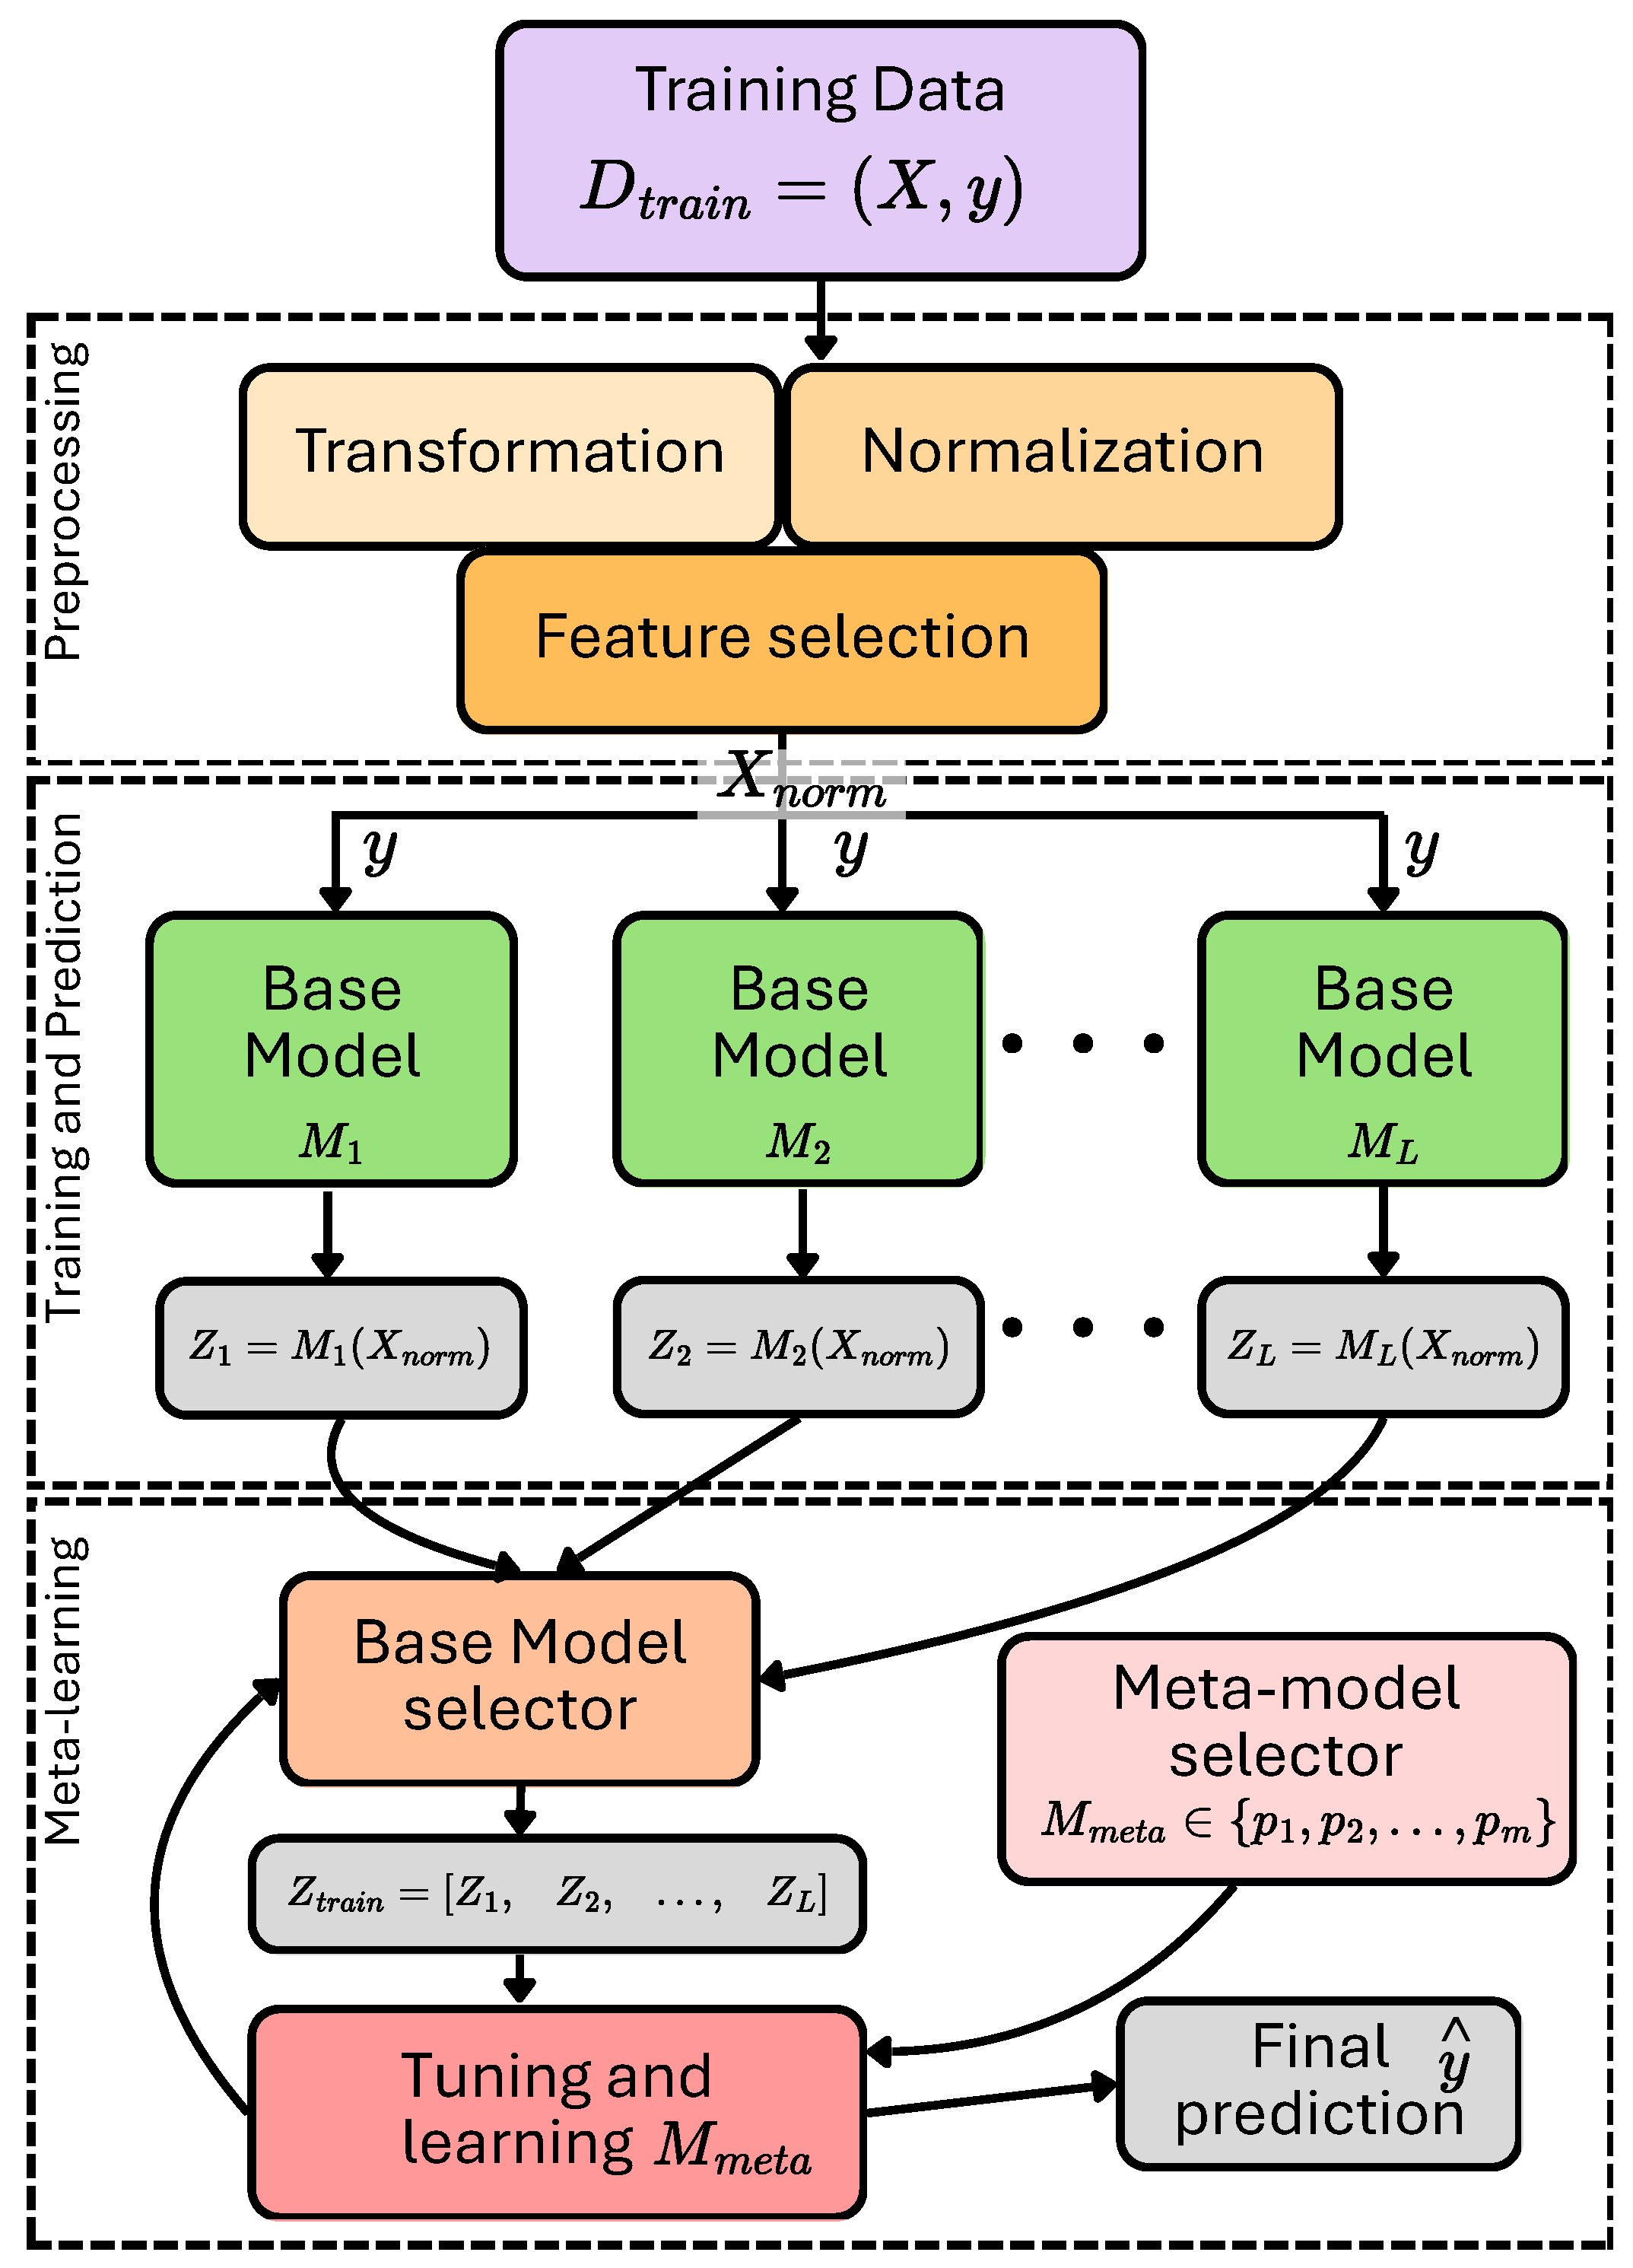
The proposed strategy for preparing and learning the ensemble models is illustrated in Figure 8. This strategy consists of three main stages: Preprocessing, Training and Prediction, and Meta-Learning. The Preprocessing stage involves preparing the input data, as previously defined. Once the data is standardized/normalized ( X n o r m ), it proceeds to the Training and Prediction stage. In this stage, the base models—whose hyperparameters were previously tuned—are trained, and predictions are generated from each model. Next, in the Meta-Learning stage, a Base Model Selector is employed. This component selects the outputs from the base models to create the meta-feature matrix. This selection process is guided by a tuning and learning step, as well as the choice of the final estimator (from a set of available meta-learners), which is configured for optimal performance to produce the final prediction. The entire process considers cross-validation to provide a robust estimate of the model’s generalization performance.
The individual models described in Section 3.3.1 are used as input to the ensemble learning. In particular, five metamodels were configured, taking as base the algorithms XGBoost (XGB), DT, LR, RF, and Gradient Boosting Classifier (GBC). Additionally, we configured an ensemble model employing Soft Voting to create a smoother probability distribution across the input models.

3.4. Evaluation

This stage involves evaluating the configured models. While Section 4 outlines the experimental setup, it is important to note that both individual and ensemble models include performance assessments, allowing us to observe the behavior of models that may be suitable for deployment [50].

3.5. Deployment

The final stage involves applying the best-performing model for instance classification. To achieve this, we developed a web application using the Streamlit framework [51] that takes a patient’s input values for physical and clinical features and provides a prediction on whether the patient is at risk of a heart attack. Figure 9 presents the initial screen of the web application.
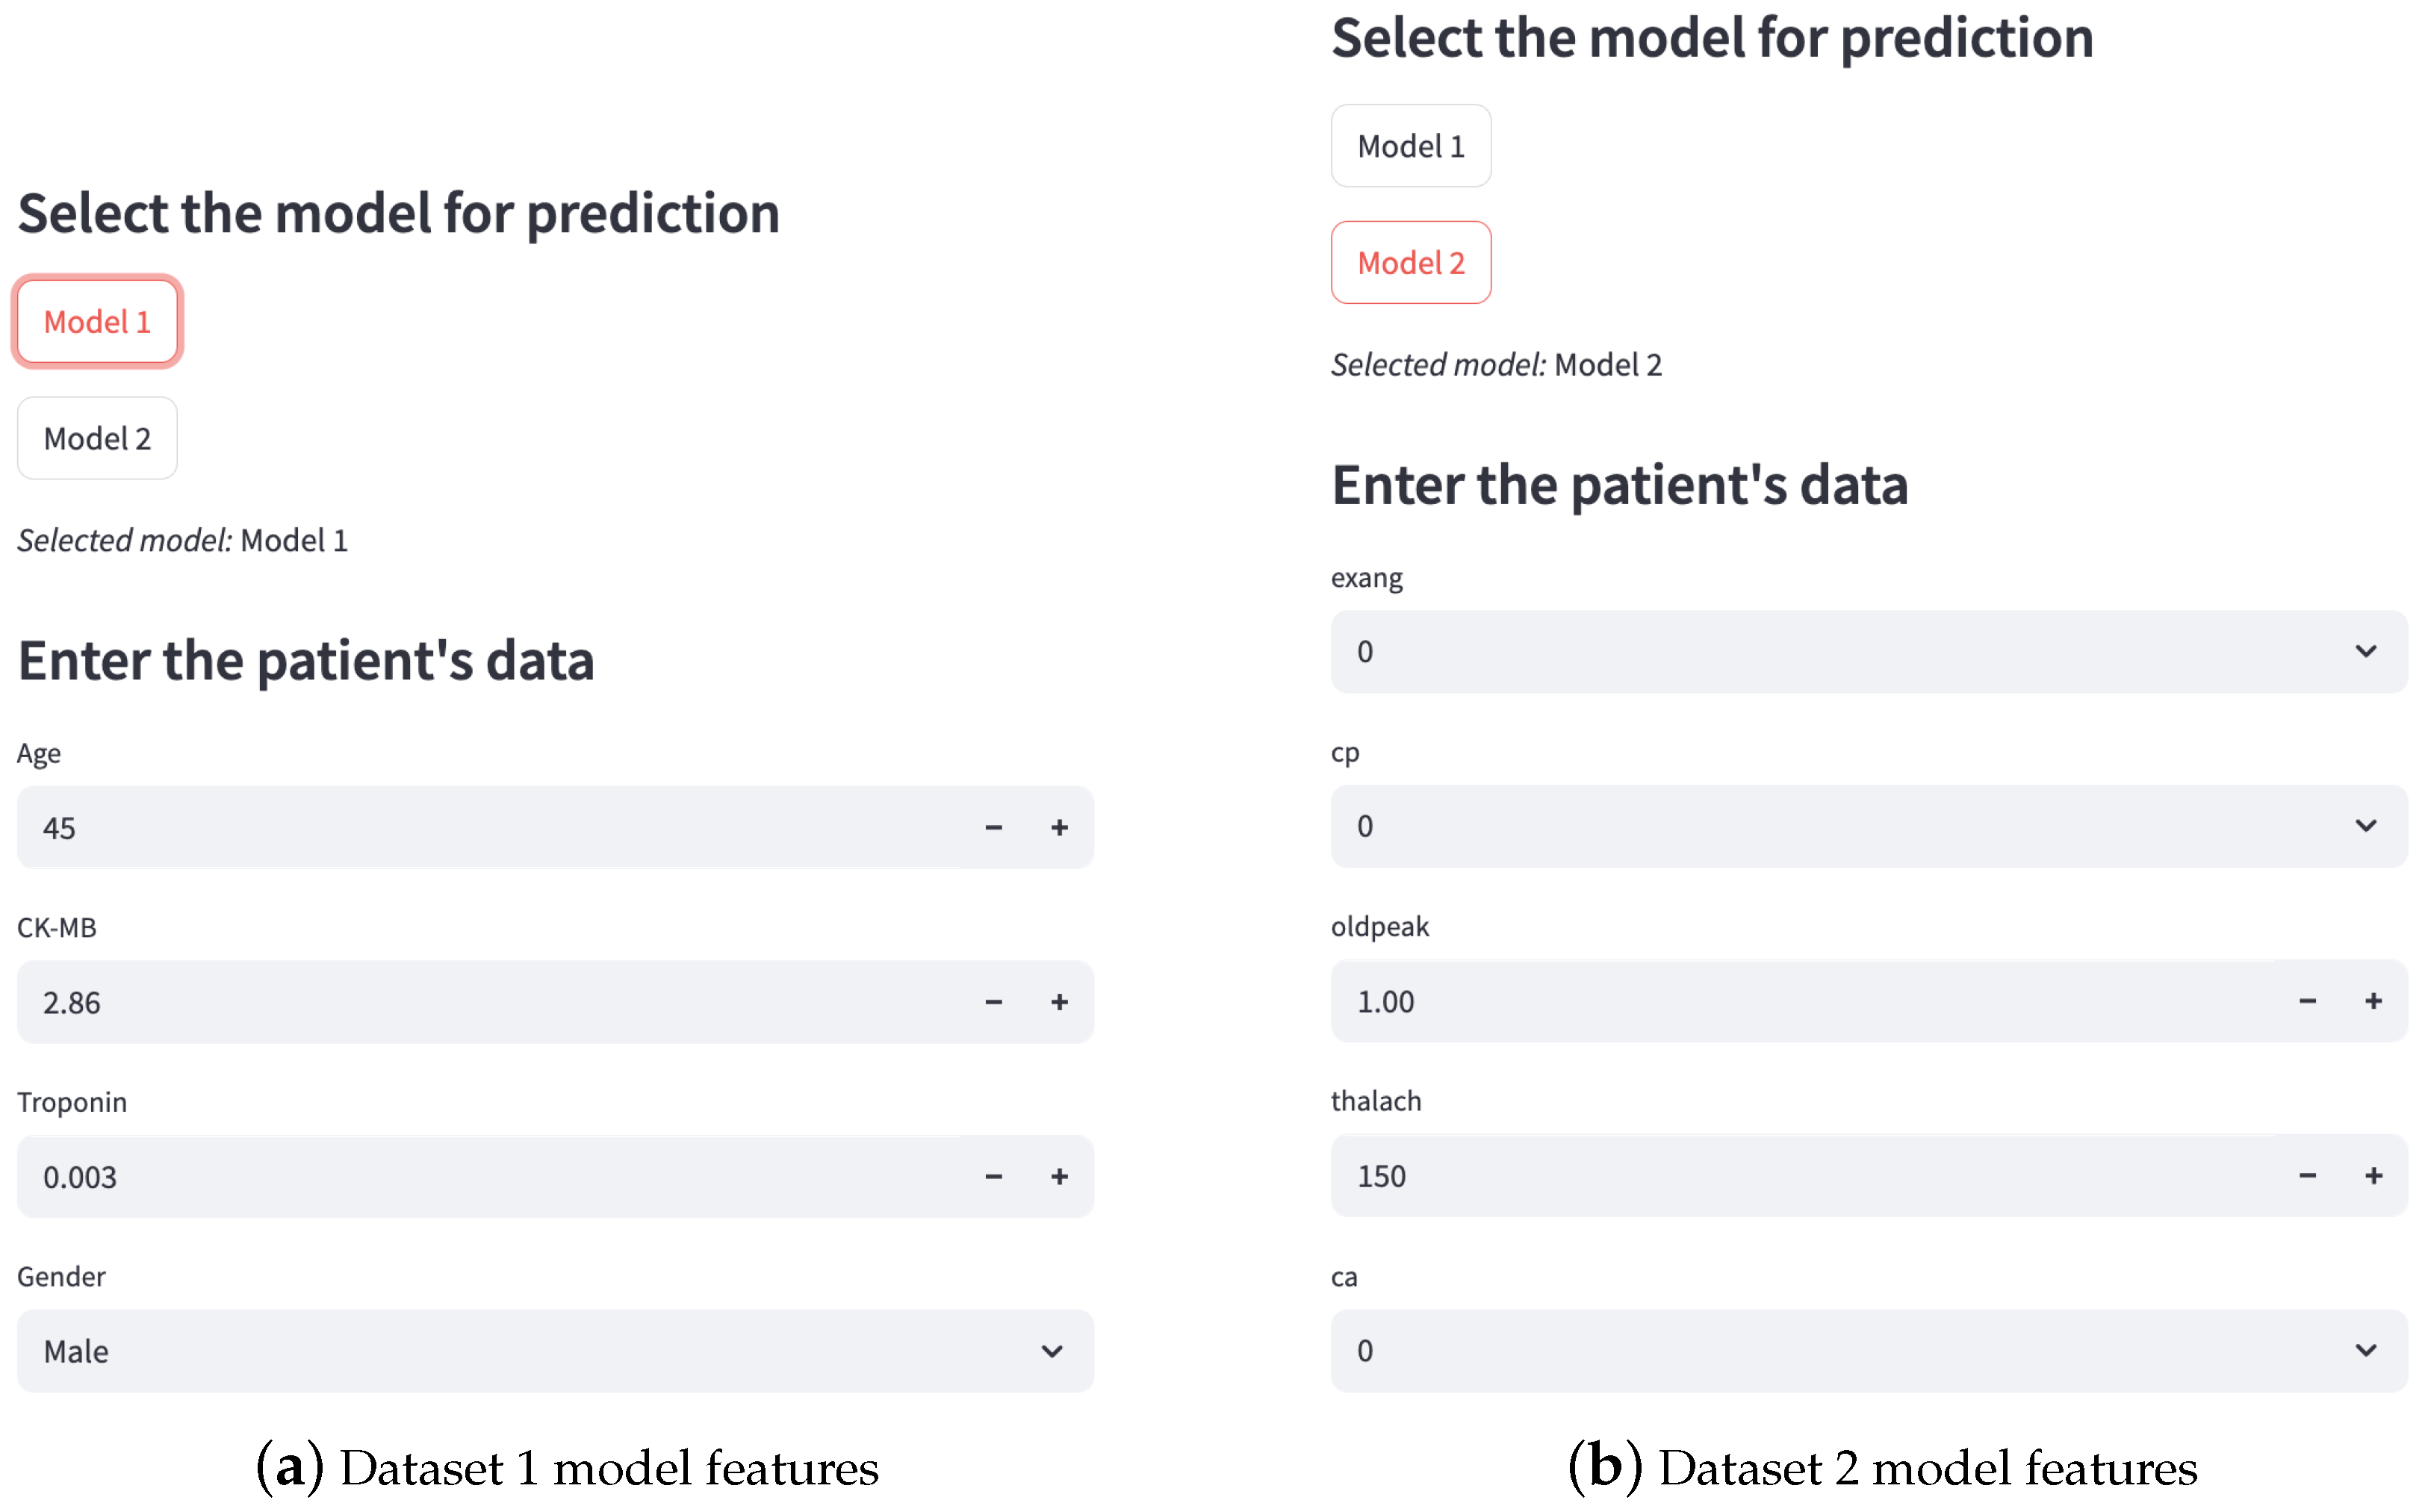
The application allows the user to choose between three models. For two of these models, Figure 10 illustrates the options pertaining to Datasets 1 and 2:
  • Model 1 (Figure 10a): Trained with Dataset 1, which includes the variables Age, CK-MB, Troponin, and Gender.
  • Model 2 (Figure 10b): Trained with Dataset 2 with the variables exang, cp, oldpeak, thalach, and ca.
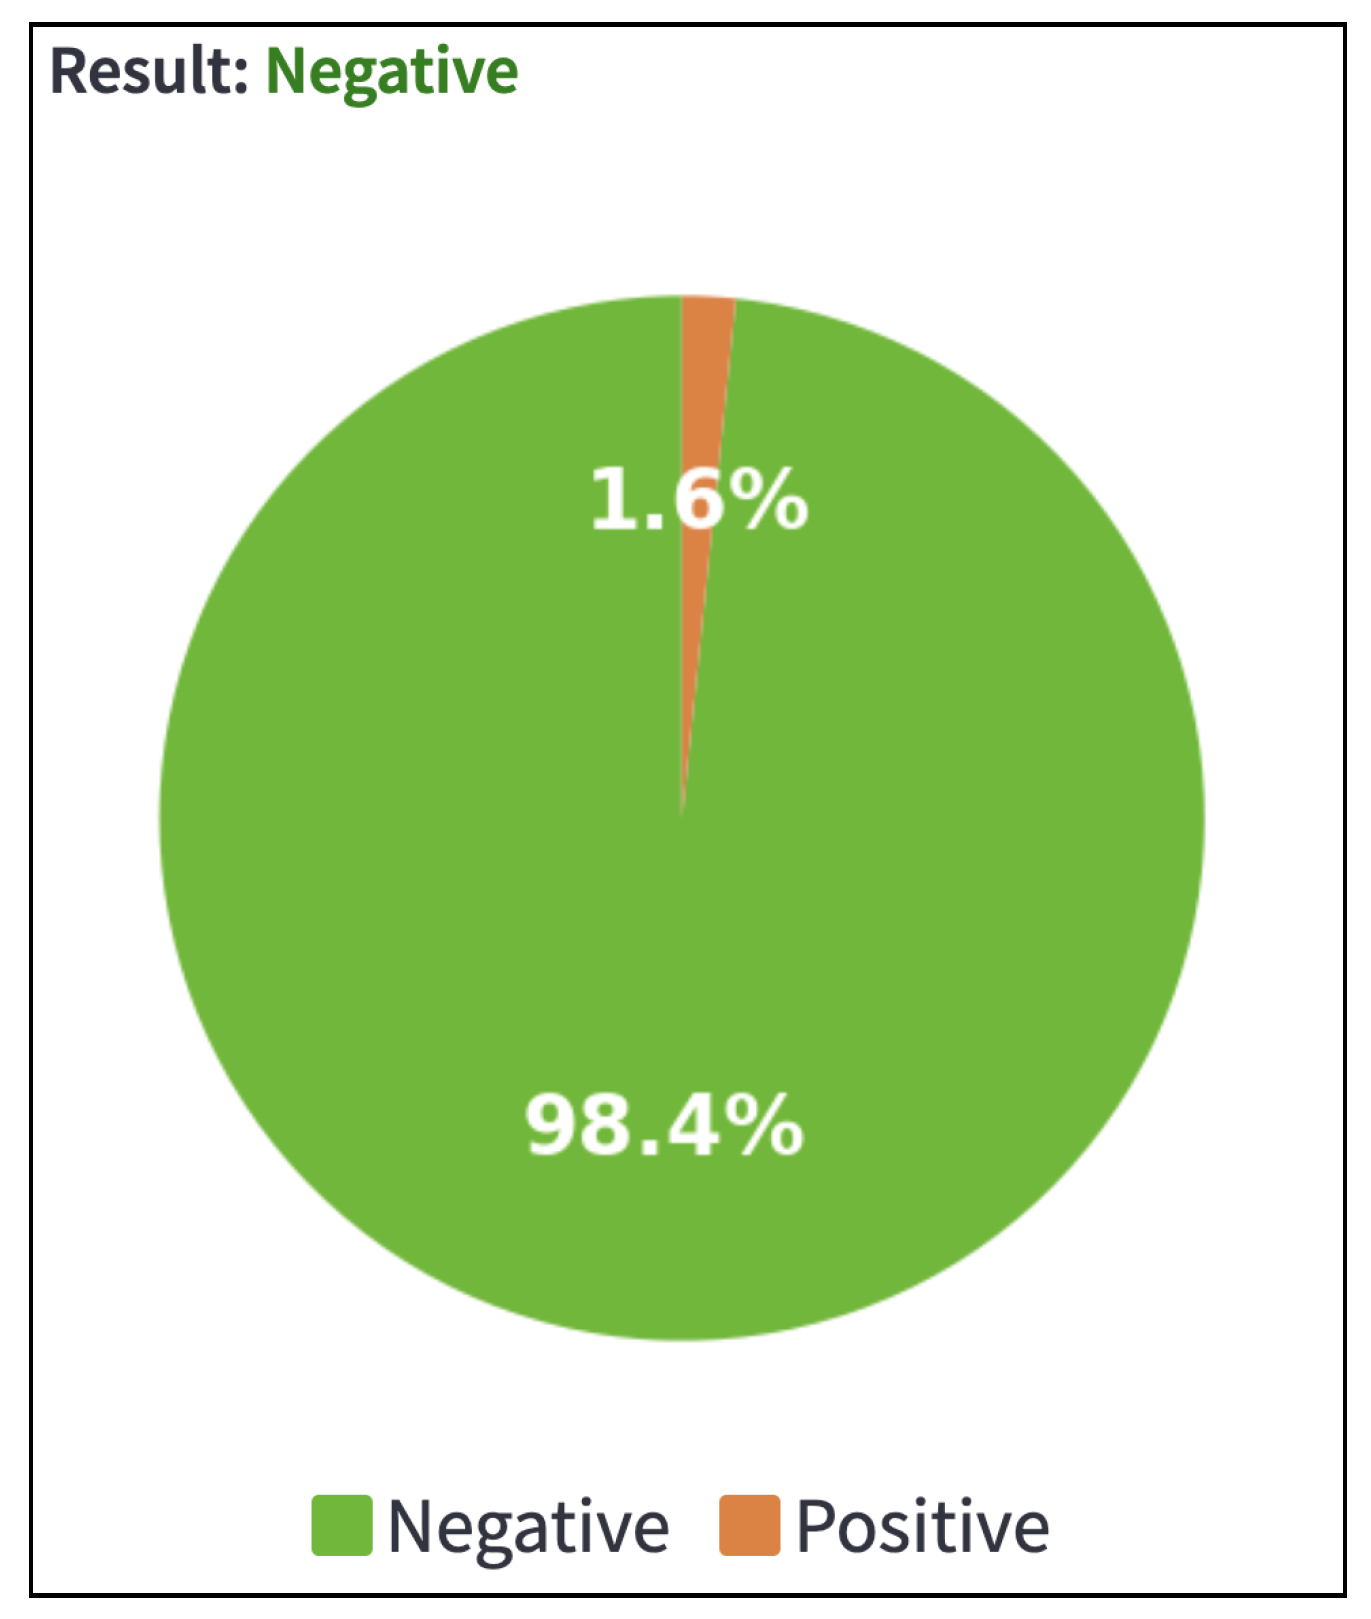
Expandable buttons have been incorporated to reveal the descriptions of the variables utilized in each model upon activation. Model selection is implemented through interactive buttons that dynamically update the input fields, allowing users to enter only the variables pertinent to the active model. Each input field is provided with selectors or numeric boxes, defined with default values and valid limits. To ensure compatibility with the trained models, specific preprocessing steps are implemented. The prediction is presented as a binary result (positive or negative), accompanied by a color code (red for positive risk and green for negative) to enhance visual clarity. A pie chart is also generated to visualize the estimated probability for each class. This chart, created using Matplotlib, features a fully transparent background to maintain a clean aesthetic, bold white labels, and a centered design, as presented in Figure 11.

4. Experiments

This section describes the experimental scenarios, which include the performance evaluation of six individual models and six ensemble metamodels. The effectiveness of both the individual and the ensemble models is assessed using an 80–20 train–test split, evaluated through 10-fold cross-validation.

4.1. Dataset and Metrics

The datasets used are described in Section 3.1 and include various features and instances from the three heart attack datasets. Additionally, different standard evaluation metrics were applied to quantify the effectiveness of the models in the binary classification task [52].
The performance metrics employed in this study include accuracy, precision, recall, F1-score, and the area under the receiver operating characteristic curve (AUC-ROC) [48]. These metrics are derived from the confusion matrix, which categorizes predictions as follows:
  • True Positives (TP): Cases correctly classified as positive.
  • False Positives (FP): Cases incorrectly classified as positive.
  • True Negatives (TN): Cases correctly classified as negative.
  • False Negatives (FN): Cases incorrectly classified as negative.
The metrics considered in this study are presented in Equations (12)–(16).
Accuracy = T P + T N T P + T N + F P + F N
Precision = T P T P + F P
Recall = T P T P + F N
F 1 = 2 · Precision · Recall Precision + Recall
AUC-ROC = 0 1 T P R ( F P R 1 ( x ) ) d x
where the AUC-ROC represents the relationship between the true positive rate (TPR) and the false positive rate (FPR).

4.2. Implementation Details

The data modeling modules and the web application were developed using Python 3. The implementation details are outlined below:
  • Exploration and preprocessing: The libraries pandas, numpy, matplotlib, and seaborn (versions 2.3, 2.3.2, 3.10.3, and 0.13.2, respectively) were used for data loading, exploration, visualization, and cleaning. Feature scaling was performed using StandardScaler, and winsorization techniques were applied with scipy (version 1.16.1).
  • Modeling: The individual models, including Logistic Regression, Naive Bayes, K-Nearest Neighbors, Decision Trees, Support Vector Machines, and Multi-Layer Perceptrons, were implemented using the scikit-learn library (version 1.7.0).
  • Tuning: Hyperparameter optimization was conducted using GridSearchCV from scikit-learn, with cross-validation folds set to k = 10 .
  • Evaluation: Model performance was assessed through metrics such as accuracy, precision, recall, F1-score, and AUC, using tools from the scikit-learn.metrics module.
  • Ensemble: We select the best-performing models based on hyperparameter tuning results and apply ensemble techniques from the scikit-learn library using the StackingClassifier and VotingClassifier methods.
  • Deployment: The web application was deployed using the Streamlit framework (version 1.46.0). The models and scalers were loaded with joblib (version 1.5.0), while the visual components were handled with matplotlib.
  • Platform: All experiments were executed on a personal HP Victus computer equipped with an AMD Ryzen 7 processor (3.80 GHz), 32 GB of RAM, an Nvidia RTX 4070 GPU, and running Windows OS.
  • Code: The source code, including training, validation, and web interface are available in the repository: https://github.com/SahidHernandez/Heart-Attack-Risk-Prediction-for-Real-Time-Clinical-Decision-Support, accessed on 7 October 2025.

5. Results

This section presents the results of the experiments for both the individual and ensemble models.

5.1. Individual and Ensemble Results

This subsection presents and analyzes the performance results of individual and ensemble models across the two selected datasets, using the optimal hyperparameters identified during the tuning phase.
The training and testing results for Dataset 1 are displayed in Table 5 for the gray and white columns, respectively. The first six rows refer to the individual models, while the last six rows pertain to the ensemble-based models. Regarding testing results, individual models showed varied performance; Naive Bayes (NB) was the weakest (accuracy = 73.5%), while the Decision Tree (DT) model delivered outstanding results across all metrics (precision, recall, F1-score, accuracy, and AUC-ROC reaching 98.9%). Among the ensemble models, Random Forest (ENS-RF) and Gradient Boosting (ENS-GBC) stood out, both achieving similarly high metrics (98.9% for the testing results). When comparing these results with the performance on the training set, no clear signs of overfitting were observed, as test and train metrics remained well-balanced. For Dataset 1, the selected base models for ensemble configurations included LR, KNN, SVM, DT, and MLP.
On the other hand, the training and testing results for Dataset 2 are presented in Table 6. The first six rows refer to the individual models, while the last six rows pertain to the ensemble-based models. For the testing results, the individual KNN model emerged as the top performer, achieving outstanding results (accuracy = 97.6%, AUC-ROC = 99.9%). However, the ensemble models—particularly ENS-XGB, ENS-DT— attained better accuracy results (98.5%), positioning them as the best overall configurations. Furthermore, when comparing these results with the training set performance, there was no evidence of significant overfitting, as the models maintained consistent performance on both seen and unseen data. For Dataset 2, the selected base models for ensemble configurations included KNN, SVM, DT, and MLP.
The results demonstrate the feasibility of the proposed models. However, because the project aims for an accuracy above 80%, the Naive Bayes and Logistic Regression models (on Dataset 2) were discarded. Therefore, while individual models such as Decision Tree (DT) and K-Nearest Neighbors (KNN) achieved outstanding results, the ensemble models demonstrated superior robustness and consistency. Notably, ENS-XGB and ENS-DT achieved the best accuracy at 98.5%. Furthermore, ENS-RF and ENS-Vot achieved the highest AUC-ROC score of 99.9%.
The training and testing results for Dataset 3 are presented in Table 7. The first six rows correspond to the individual models, and the last six rows to the ensemble-based models. The individual Logistic Regression model achieved the highest performance in precision, recall, and F1-score (88.2, 88.3, and 88.2%, respectively). In contrast, the ensemble Random Forest model (ENS-RF) obtained the best accuracy and AUC-ROC, at 90.2% and 96.3, respectively. For Dataset 3, the selected base models for ensemble configurations were structured as follows:
  • RF, DT, and Voting ensembles: LR, NB, KNN and MLP.
  • XGB and GBC ensembles: LR, NB, KNN, SVM, MLP.
  • LR ensemble: LR, KNN, SVM and MLP.

5.2. Model Comparison

A comparative analysis was conducted using previously published models on the evaluated heart attack datasets. For this comparison, we focused on model accuracy and AUC-ROC to align with the metrics most frequently reported in prior research, facilitating a direct performance assessment. Table 8 presents the results of the comparison.
For Dataset 1, we considered three studies in the comparison. The ensemble voting method utilized by Sharma and Lalwani [55] achieved an accuracy of 98%, employing a combination of models that included Logistic Regression (LR), AdaBoost (ADB), XGBoost (XGB), and Random Forest (RF). In contrast, our proposed ensemble model—based on Decision Trees and incorporating LR, KNN, SVM, DT, and MLP—achieved an accuracy of 98.9%. This result positions our approach among the top-performing models, demonstrating its competitive advantage and robustness in heart attack prediction tasks.
Regarding Dataset 2, the performance of the proposed ensemble model was compared against three published models using the same data. The KNN classifier reported by Assegie [15] achieved an accuracy of 93%. The XGB classifier implemented by Yang [14] reported an accuracy of 88%. In contrast, the proposed Ensemble-XGB model, which combines KNN, SVM, DT, and MLP, achieved an outstanding accuracy of 98.5%, clearly outperforming all previously reported methods. This comparison highlights the predictive capacity and robustness of the proposed approach for heart attack prediction using this clinical dataset.
On the other hand, for Dataset 3, we compared our results against three works reported in the literature. The accuracy of the proposed model surpassed that of Chicco and Jurman [37] and Tunç et al. [56], but was marginally lower than the approach of Song and Shi [57]. In terms of the AUC-ROC metric, the proposed model demonstrated superior performance, achieving a value of 96.3% and exceeding all other models. This suggests an enhanced ability to discriminate between the classes.

6. Discussion

This study outlines a methodology for predicting heart attack risk by exploring base and ensemble classification models. The proposed framework covers the entire pipeline, from data acquisition to the deployment of a web-based platform for decision support. Our methodology incorporates datasets with diverse characteristics, enabling various analyses based on the available information of the users. The encountered data heterogeneity required extensive tuning of both base learners and metamodels to select the optimal deployment model. Despite this complexity, the performance results on the studied datasets demonstrated that the ensemble models were more robust than the individual models across both training and testing sets. This indicates that the ensemble approach was more effective at capturing complex underlying patterns during training and, crucially, at generalizing these patterns to unseen data. Therefore, while individual models provide simplicity and interpretability, ensemble models are essential for maximizing predictive performance and ensuring stability, making them highly suitable for critical clinical applications.
A key finding from the analysis of the datasets using the proposed methodology, as detailed in Table 5 and Table 6, is the reduced performance variability of ensemble models on Datasets 1 and 2. On Dataset 1, the ensembles produced results comparable to the top-performing individual models. It is noteworthy that certain individual models, particularly the Decision Tree, also demonstrated strong performance. We assume this is a direct result of our comprehensive data preprocessing pipeline and rigorous hyperparameter optimization, which effectively enhanced the performance of all models and narrowed the performance gap. Nevertheless, the ensemble algorithms demonstrated greater consistency in their performance metrics compared to the individual models across both the training and testing sets. For Dataset 2, the ensemble approach achieved the highest scores across multiple evaluation metrics. It is worth mentioning that although ensemble models such as stacking and voting generally outperform individual models by combining strengths and mitigating weaknesses [58], some studies indicate that this superiority is not guaranteed. Studies by [59,60] emphasize that individual models can, in some cases, capture specific patterns in the test set and achieve metrics similar to or even better than those of ensembles.
On the other hand, the distribution analysis and preprocessing revealed that Dataset 3 exhibited more diverse trends, leading to significantly different model behavior compared to the other studied datasets. While individual models demonstrated notable results in Table 3, some showed signs of slight underfitting. This can be attributed to the data distribution and the limited sample size (299 instances), which hindered their ability to generalize effectively. However, targeted adjustments to the ensemble metamodels resulted in more consistent performance, surpassing all other models in terms of AUC-ROC, highlighting the robustness of the ensemble methodology for handling such complex and limited datasets. Although the proposed model yielded slightly lower accuracy than that of Song and Shi [57], it achieved a higher AUC-ROC, indicating a better overall trade-off between sensitivity and specificity. The ensemble design was specifically optimized to handle data variance and prevent overfitting, as evidenced by our cross-validation strategy. Despite the comprehensive nature of our current pipeline, we plan to explore other algorithms in future work, such as deep learning models, to serve as base learners and potentially enhance our results.
This study has limitations, primarily in the data collection, model exploration, and validation phases of the proposed methodology, which present opportunities for optimization. While the approach is based on data classification, the methodology would benefit from a standardized data collection protocol. Such standardization would facilitate the adjustment and reconfiguration of models according to the specific data available.
Regarding the model exploration, ensemble models pose an increase in computational complexity compared to individual models. In a stacking strategy, a two-stage approach is followed: first, the complexity of training each individual model is considered, and subsequently, the complexity of training the final meta-learner that integrates the outputs of the base models is considered. This computational cost is justified by a significant improvement in the accuracy and robustness of the predictive model. Since training is a one-time process, it offers an efficient solution for deployment and inference.
Another limitation is that the clinical validation of predictive models remains a significant challenge. While established guidelines enable reliable evaluation on static datasets, achieving comparable efficacy in real-world settings is complex. Performance can be adversely affected by diverse factors, including the data sampling period and place, measurement instrumentation, model interpretability, demographic diversity (e.g., ethnicity, sex, age), and integration within existing clinical workflows, to mention a few. Although a more comprehensive evaluation is planned for future work, the proposed system is designed to support clinicians who can provide feedback on its operation. This initial deployment paves the way for adapting the system to facilitate the collection of diverse, multifaceted clinical data for ongoing validation.

7. Conclusions

This study introduced a systematic, end-to-end methodology for the early prediction of heart attacks, integrating robust machine learning pipelines with a deployable clinical decision support system. Our methodology encompassed data acquisition, exploratory analysis, preprocessing, feature selection, hyperparameter tuning, and the development of an interactive web application for real-time risk assessment. The core of our approach was the comprehensive evaluation and integration of six distinct classification algorithms (SVM, MLP, LR, KNN, DT, and NB). These base models were combined through advanced ensemble strategies, including stacking and voting, to form six metamodels.
Experimental validation on three independent clinical datasets demonstrated that our tuned ensemble models outperformed existing state-of-the-art approaches. By strategically combining the strongest predictors and eliminating underperforming base models, our final ensemble achieved accuracies ranging from 90.2% to 98.9%. These findings confirm the high potential of properly engineered ensemble learning to enhance early diagnostic precision for cardiovascular events.
The practical utility of the proposed methodology is demonstrated through a user-friendly web application that offers a functional clinical interface for the predictive system. This interface allows healthcare professionals to select from pre-trained models, input specific clinical parameters, and generate real-time predictions. The output visualization, which includes color-coded labels and probability pie charts, is designed to enhance understanding and usability for those without a data science background, offering a pathway toward reducing diagnostic delays.
Certain limitations and areas for future enhancement must be acknowledged. For instance, reliance on structured clinical data restricts the application to environments where such data are consistently available and accurately labeled. Future work should include prospective validation with real-world data to further assess the model’s effectiveness and reliability. Additionally, integrating explainability methods, such as SHAP or LIME, could improve trust and interpretability of predictions among medical professionals.

Author Contributions

Conceptualization, J.L.M.-R.; methodology, J.L.M.-R., B.N.N.-M. and S.S.H.-H.; software, B.N.N.-M., S.S.H.-H. and D.A.R.-R.; formal analysis, A.D.-M. and A.B.R.-A.; investigation, J.R.M.-A. and A.B.R.-A.; resources, D.A.R.-R. and J.R.M.-A.; data curation, A.D.-M.; writing—original draft preparation, B.N.N.-M., J.L.M.-R. and T.Y.G.-M.; writing—review and editing, J.L.M.-R., A.D.-M., T.Y.G.-M. and A.B.R.-A.; visualization, B.N.N.-M., S.S.H.-H. and D.A.R.-R. All authors have read and agreed to the published version of the manuscript.

Funding

This research was funded in part by the Autonomous University of Tamaulipas.

Institutional Review Board Statement

Not applicable.

Informed Consent Statement

Not applicable.

Data Availability Statement

The data used in this paper is available in the original source, as indicated in the document.

Conflicts of Interest

The authors declare no conflicts of interest.

References

  1. WHO. Cardiovascular Diseases (CVDs). 2021. Available online: https://www.who.int/news-room/fact-sheets/detail/cardiovascular-diseases-(cvds) (accessed on 14 May 2025).
  2. Alotaibi, A. Ensemble Deep Learning Approaches in Health Care: A Review. Comput. Mater. Contin. 2025, 82, 3741. [Google Scholar] [CrossRef]
  3. Topol, E.J. High-performance medicine: The convergence of human and artificial intelligence. Nat. Med. 2019, 25, 44–56. [Google Scholar] [CrossRef] [PubMed]
  4. Berdaly, A.; Abdiakhmetova, Z. Predicting heart disease using machine learning algorithms. J. Math. Mech. Comput. Sci. 2022, 115, 101–111. [Google Scholar] [CrossRef]
  5. Dritsas, E.; Trigka, M. Application of Deep Learning for Heart Attack Prediction with Explainable Artificial Intelligence. Computers 2024, 13, 244. [Google Scholar] [CrossRef]
  6. Dafni Rose, J.; Mohanaprakash, T.; Jeyamohan, H.; Jerusalin Carol, J. Enhancing Cardiovascular Disease Diagnosis through Bioinformatics and Machine Learning. ResearchSquare 2024, 1–25. [Google Scholar] [CrossRef]
  7. Doppala, B.P.; Bhattacharyya, D.; Janarthanan, M.; Baik, N. A reliable machine intelligence model for accurate identification of cardiovascular diseases using ensemble techniques. J. Healthc. Eng. 2022, 2022, 2585235. [Google Scholar] [CrossRef]
  8. Alizadehsani, R.; Abdar, M.; Roshanzamir, M.; Khosravi, A.; Kebria, P.M.; Khozeimeh, F.; Nahavandi, S.; Sarrafzadegan, N.; Acharya, U.R. Machine learning-based coronary artery disease diagnosis: A comprehensive review. Comput. Biol. Med. 2019, 111, 103346. [Google Scholar] [CrossRef]
  9. Brandt, V.; Schoepf, U.J.; Aquino, G.J.; Bekeredjian, R.; Varga-Szemes, A.; Emrich, T.; Bayer, R.R.; Schwarz, F.; Kroencke, T.J.; Tesche, C.; et al. Impact of machine-learning-based coronary computed tomography angiography–derived fractional flow reserve on decision-making in patients with severe aortic stenosis undergoing transcatheter aortic valve replacement. Eur. Radiol. 2022, 32, 6008–6016. [Google Scholar] [CrossRef]
  10. Sheakh, M.A.; Tahosin, M.S.; Akter, L.; Jahan, I.; Islam, M.N.; Siddiky, M.R.; Hasan, M.M.; Hasan, S. Comparative analysis of machine learning algorithms for ECG-based heart attack prediction: A study using Bangladeshi patient data. World J. Adv. Res. Rev. 2024, 23, 2572–2584. [Google Scholar] [CrossRef]
  11. Alshraideh, M.; Alshraideh, N.; Alshraideh, A.; Alkayed, Y.; Al Trabsheh, Y.; Alshraideh, B. Enhancing heart attack prediction with machine learning: A study at jordan university hospital. Appl. Comput. Intell. Soft Comput. 2024, 2024, 5080332. [Google Scholar] [CrossRef]
  12. Wang, Y. AI-Based Methods of Cardiovascular Disease Prediction and Analysis. In Proceedings of the International Conference on Engineering Management, Information Technology and Intelligence, Shanghai, China, 14 June 2024; pp. 724–729. [Google Scholar] [CrossRef]
  13. Budholiya, K.; Shrivastava, S.K.; Sharma, V. An optimized XGBoost based diagnostic system for effective prediction of heart disease. J. King Saud Univ. - Comput. Inf. Sci. 2022, 34, 4514–4523. [Google Scholar] [CrossRef]
  14. Yang, J. The prediction and analysis of heart disease using XGBoost algorithm. Appl. Comput. Eng 2024, 41, 61–68. [Google Scholar] [CrossRef]
  15. Assegie, T.A. Heart disease prediction model with k-nearest neighbor algorithm. Int. J. Inform. Commun. Technol. (IJ-ICT) 2021, 10, 225. [Google Scholar] [CrossRef]
  16. Bouqentar, M.A.; Terrada, O.; Hamida, S.; Saleh, S.; Lamrani, D.; Cherradi, B.; Raihani, A. Early heart disease prediction using feature engineering and machine learning algorithms. Heliyon 2024, 10, e38731. [Google Scholar] [CrossRef]
  17. Mahajan, P.; Uddin, S.; Hajati, F.; Moni, M.A. Ensemble learning for disease prediction: A review. Healthcare 2023, 11, 1808. [Google Scholar] [CrossRef]
  18. Dinh, A.; Miertschin, S.; Young, A.; Mohanty, S.D. A data-driven approach to predicting diabetes and cardiovascular disease with machine learning. BMC Med. Inform. Decis. Mak. 2019, 19, 211. [Google Scholar] [CrossRef] [PubMed]
  19. Mienye, I.D.; Sun, Y.; Wang, Z. An improved ensemble learning approach for the prediction of heart disease risk. Inform. Med. Unlocked 2020, 20, 100402. [Google Scholar] [CrossRef]
  20. Ali, L.; Niamat, A.; Khan, J.A.; Golilarz, N.A.; Xingzhong, X.; Noor, A.; Nour, R.; Bukhari, S.A.C. An optimized stacked Support Vector Machines based expert system for the effective prediction of heart failure. IEEE Access 2019, 7, 54007–54014. [Google Scholar] [CrossRef]
  21. Karadeniz, T.; Tokdemir, G.; Maraş, H.H. Ensemble methods for heart disease prediction. New Gener. Comput. 2021, 39, 569–581. [Google Scholar] [CrossRef]
  22. Almulihi, A.; Saleh, H.; Hussien, A.M.; Mostafa, S.; El-Sappagh, S.; Alnowaiser, K.; Ali, A.A.; Refaat Hassan, M. Ensemble learning based on hybrid deep learning model for heart disease early prediction. Diagnostics 2022, 12, 3215. [Google Scholar] [CrossRef] [PubMed]
  23. Tiwari, A.; Chugh, A.; Sharma, A. Ensemble framework for cardiovascular disease prediction. Comput. Biol. Med. 2022, 146, 105624. [Google Scholar] [CrossRef]
  24. Islam, M.N.; Raiyan, K.R.; Mitra, S.; Mannan, M.R.; Tasnim, T.; Putul, A.O.; Mandol, A.B. Predictis: An IoT and machine learning-based system to predict risk level of cardio-vascular diseases. BMC Health Serv. Res. 2023, 23, 171. [Google Scholar] [CrossRef]
  25. Ganesan, M.; Sivakumar, N. IoT based heart disease prediction and diagnosis model for healthcare using machine learning models. In Proceedings of the 2019 IEEE International Conference on System, Computation, Automation and Networking (ICSCAN), Pondicherry, India, 29–30 March 2019; pp. 1–5. [Google Scholar] [CrossRef]
  26. Gupta, A.; Yadav, S.; Shahid, S.; U, V. HeartCare: IoT Based Heart Disease Prediction System. In Proceedings of the 2019 International Conference on Information Technology (ICIT), Shanghai, China, 20–23 December 2019; pp. 88–93. [Google Scholar] [CrossRef]
  27. Ahdal, A.A.; Rakhra, M.; Badotra, S.; Fadhaeel, T. An integrated Machine Learning Techniques for Accurate Heart Disease Prediction. In Proceedings of the 2022 International Mobile and Embedded Technology Conference (MECON), Noida, India, 10–11 March 2022; pp. 594–598. [Google Scholar] [CrossRef]
  28. Nancy, A.A.; Ravindran, D.; Raj Vincent, P.M.D.; Srinivasan, K.; Gutierrez Reina, D. IoT-Cloud-Based Smart Healthcare Monitoring System for Heart Disease Prediction via Deep Learning. Electronics 2022, 11, 2292. [Google Scholar] [CrossRef]
  29. Velmurugan, A.; Padmanaban, K.; Kumar, A.S.; Azath, H.; Subbiah, M. Machine learning IoT based framework for analysing heart disease prediction. AIP Conf. Proc. 2023, 2523, 020038. [Google Scholar] [CrossRef]
  30. Desai, F.; Chowdhury, D.; Kaur, R.; Peeters, M.; Arya, R.C.; Wander, G.S.; Gill, S.S.; Buyya, R. HealthCloud: A system for monitoring health status of heart patients using machine learning and cloud computing. Internet Things 2022, 17, 100485. [Google Scholar] [CrossRef]
  31. Golec, M.; Gill, S.S.; Parlikad, A.K.; Uhlig, S. HealthFaaS: AI-Based Smart Healthcare System for Heart Patients Using Serverless Computing. IEEE Internet Things J. 2023, 10, 18469–18476. [Google Scholar] [CrossRef]
  32. Shrestha, R.; Chatterjee, J.M. Heart disease prediction system using machine learning. LBEF Res. J. Sci. Technol. Manag. 2019, 1, 115–132. [Google Scholar]
  33. Effati, S.; Kamarzardi-Torghabe, A.; Azizi-Froutaghe, F.; Atighi, I.; Ghiasi-Hafez, S. Web application using machine learning to predict cardiovascular disease and hypertension in mine workers. Sci. Rep. 2024, 14, 31662. [Google Scholar] [CrossRef]
  34. Nashif, S.; Raihan, M.R.; Islam, M.R.; Imam, M.H. Heart disease detection by using machine learning algorithms and a real-time cardiovascular health monitoring system. World J. Eng. Technol. 2018, 6, 854–873. [Google Scholar] [CrossRef]
  35. Rashid, T.A.; Hassan, B. Heart Attack Dataset. Mendeley Data, V1. 2022. Available online: https://data.mendeley.com/datasets/wmhctcrt5v/1 (accessed on 7 October 2025).
  36. Zaganjori, J. Heart Attack Prediction -Analyzing Key Factors for Predicting Heart Disease Risk. 2024. Available online: https://www.kaggle.com/datasets/juledz/heart-attack-prediction (accessed on 5 June 2025).
  37. Chicco, D.; Jurman, G. Machine learning can predict survival of patients with heart failure from serum creatinine and ejection fraction alone. BMC Med. Inform. Decis. Mak. 2020, 20, 16. [Google Scholar] [CrossRef]
  38. El-Morr, C.; Jammal, M.; Ali-Hassan, H.; EI-Hallak, W. Machine Learning for Practical Decision Making; International Series in Operations Research & Management Science; Springer International Publishing: Cham, Switzerland, 2022. [Google Scholar]
  39. Dash, C.S.K.; Behera, A.K.; Dehuri, S.; Ghosh, A. An outliers detection and elimination framework in classification task of data mining. Decis. Anal. J. 2023, 6, 100164. [Google Scholar] [CrossRef]
  40. Wang, Q.; Shrestha, D.L.; Robertson, D.; Pokhrel, P. A log-sinh transformation for data normalization and variance stabilization. Water Resour. Res. 2012, 48, 1–7. [Google Scholar] [CrossRef]
  41. Ali, M.M.; Islam, M.S.; Uddin, M.N.; Uddin, M.A. A conceptual IoT framework based on Anova-F feature selection for chronic kidney disease detection using deep learning approach. Intell.-Based Med. 2024, 10, 100170. [Google Scholar] [CrossRef]
  42. Zhang, S.; Li, J. KNN classification with one-step computation. IEEE Trans. Knowl. Data Eng. 2021, 35, 2711–2723. [Google Scholar] [CrossRef]
  43. Guido, R.; Ferrisi, S.; Lofaro, D.; Conforti, D. An overview on the advancements of support vector machine models in healthcare applications: A review. Information 2024, 15, 235. [Google Scholar] [CrossRef]
  44. Helmud, E.; Fitriyani, F.; Romadiana, P. Classification comparison performance of supervised machine learning Random Forest and Decision Tree algorithms using confusion matrix. J. Sisfokom (Sistem Inf. Dan Komput.) 2024, 13, 92–97. [Google Scholar] [CrossRef]
  45. Rashedi, K.A.; Ismail, M.T.; Al Wadi, S.; Serroukh, A.; Alshammari, T.S.; Jaber, J.J. Multi-layer perceptron-based classification with application to outlier detection in Saudi Arabia stock returns. J. Risk Financ. Manag. 2024, 17, 69. [Google Scholar] [CrossRef]
  46. Ambrish, G.; Ganesh, B.; Ganesh, A.; Srinivas, C.; Dhanraj; Mensinkal, K. Logistic regression technique for prediction of cardiovascular disease. Glob. Transitions Proc. 2022, 3, 127–130. [Google Scholar] [CrossRef]
  47. Veziroğlu, M.; Veziroğlu, E.; Bucak, İ.Ö. Performance comparison between Naive Bayes and machine learning algorithms for news classification. In Bayesian Inference-Recent Trends; IntechOpen: London, UK, 2024. [Google Scholar]
  48. Géron, A. Hands-on Machine Learning with Scikit-Learn, Keras, and TensorFlow; O’Reilly Media, Inc.: Sebastopol, CA, USA, 2022. [Google Scholar]
  49. Shukla, S.S.P.; Singh, M.P. Exploring ensemble optimized voting and stacking classifiers through Cross-validation for early detection of suicidal ideation. J. Intell. Fuzzy Syst. 2024, 47, 335–349. [Google Scholar] [CrossRef]
  50. Nti, I.K.; Adekoya, A.F.; Weyori, B.A. A comprehensive evaluation of ensemble learning for stock-market prediction. J. Big Data 2020, 7, 20. [Google Scholar] [CrossRef]
  51. Richards, T. Streamlit for Data Science: Create Interactive Data Apps in Python; Packt Publishing Ltd.: Birmingham, UK, 2023. [Google Scholar]
  52. Vujović, Ž. Classification model evaluation metrics. Int. J. Adv. Comput. Sci. Appl. 2021, 12, 599–606. [Google Scholar] [CrossRef]
  53. Anshori, M.; Haris, M.S. Predicting heart disease using Logistic Regression. Knowl. Eng. Data Sci. (KEDS) 2022, 5, 188–196. [Google Scholar] [CrossRef]
  54. Abubaker, H.; Singh, J.; Muchtar, F.; Fattah, S. An Ensemble-Based Extra Feature Selection Approach for Predicting Heart Disease. In Proceedings of the The International Conference on Recent Innovations in Computing, Jammu, India, 26–27 October 2023; Springer: Berlin/Heidelberg, Germany, 2023; pp. 551–563. [Google Scholar]
  55. Sharma, N.; Lalwani, P. Increasing the reliability of Heart Disease classification models using Class Balancing techniques with Feature Engineering. ResearchSquare 2023. [Google Scholar] [CrossRef]
  56. Tunç, Z.; Çiçek, İ.B.; Güldoğan, E.; Çolak, C. Assessment of associative classification approach for predicting mortality by heart failure. J. Cogn. Syst. 2020, 5, 41–45. [Google Scholar]
  57. Song, C.; Shi, X. ReActHE: A homomorphic encryption friendly deep neural network for privacy-preserving biomedical prediction. Smart Health 2024, 32, 100469. [Google Scholar] [CrossRef]
  58. Mohammed, A.; Kora, R. A comprehensive review on ensemble deep learning: Opportunities and challenges. J. King Saud-Univ.-Comput. Inf. Sci. 2023, 35, 757–774. [Google Scholar] [CrossRef]
  59. Elo, G.; Ghansah, B.; Kwaa-Aidoo, E. Critical Review of Stack Ensemble Classifier for the Prediction of Young Adults’voting Patterns Based on Parents’political Affiliations. Informing Sci. 2024, 27. [Google Scholar] [CrossRef]
  60. Jeffares, A.; Liu, T.; Crabbé, J.; van der Schaar, M. Joint Training of Deep Ensembles Fails Due to Learner Collusion. In Proceedings of the Advances in Neural Information Processing Systems; Oh, A., Naumann, T., Globerson, A., Saenko, K., Hardt, M., Levine, S., Eds.; Curran Associates, Inc.: Red Hook, NY, USA, 2023; Volume 36, pp. 13559–13589. [Google Scholar]
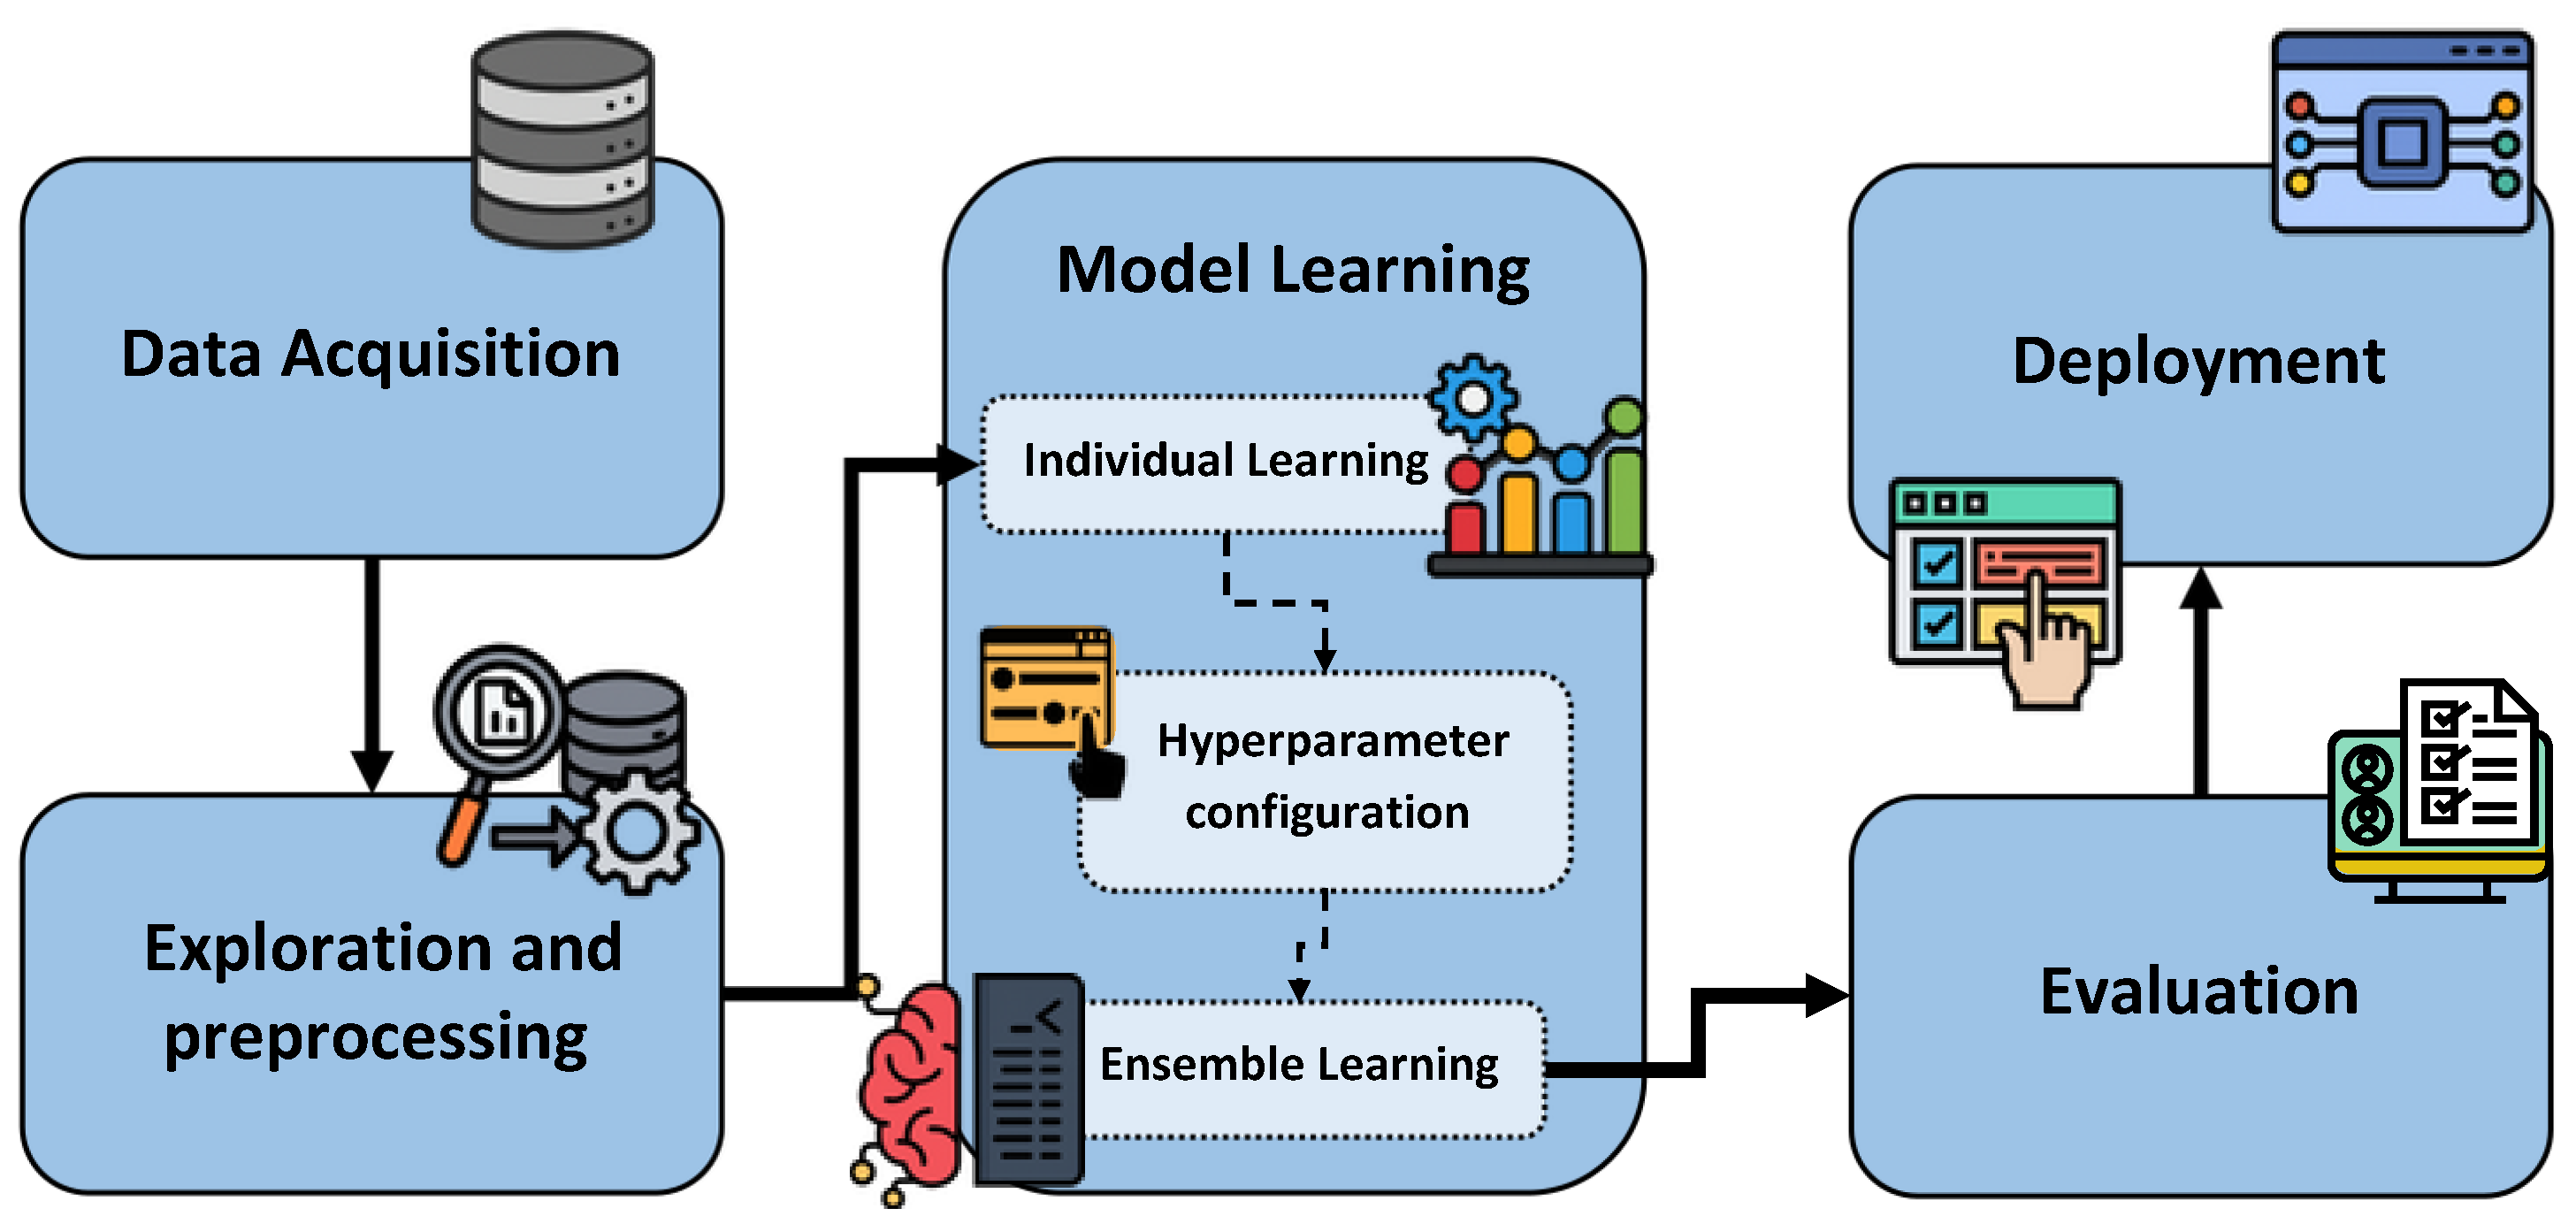
Figure 1. Proposed methodology for heart attack prediction.
Informatics 12 00110 g001
Figure 2. Attribute distribution before (top) and after (bottom) winsorization and log transformation on Dataset 1.
Informatics 12 00110 g002
Figure 3. Attribute distribution before (top) and after (bottom) log transformation on Dataset 2.
Informatics 12 00110 g003
Figure 4. Attribute distribution before (top) and after (bottom) log transformation on Dataset 3.
Informatics 12 00110 g004
Figure 5. Most important attributes according to ANOVA F-score (Dataset 1).
Informatics 12 00110 g005
Figure 6. Most important attributes according to ANOVA F-score (Dataset 2).
Informatics 12 00110 g006
Figure 7. Most important attributes according to ANOVA F-score (Dataset 3).
Informatics 12 00110 g007
Figure 8. Architecture of the metamodel ensemble learning.
Informatics 12 00110 g008
Figure 9. Initial screen user interface.
Informatics 12 00110 g009
Figure 10. Screen with features to be entered per model based on the dataset used.
Informatics 12 00110 g010
Figure 11. Screen with the classification result.
Informatics 12 00110 g011
Table 1. Data fragment from Dataset 1.
AgeGenderHeart RateSystolic Blood PressureDiastolic Blood PressureBlood SugarCK-MBTroponinResult
64166160831601.80.012negative
2119498462966.751.06positive
55164160772701.990.003negative
641701205527013.870.122positive
55164112653001.080.003negative
Table 2. Data fragment from Dataset 2.
AgeSexCpTrestbpsCholfbsRestecgThalachExangOldpeakSlopeCaThalTarget
521012521201168012230.23
53101402031015513.10030.37
70101451740112512.60030.24
611014820301161002130.28
62001382941110601.91320.21
Table 3. Data fragment from Dataset 3.
AgeAnemiaCreatinine
Phosphokinase
DiabetesEjection
Fraction
High Blood
Pressure
PlateletsSerum
Creatinine
Serum
Sodium
SexSmokingTimeDeath
Event
7505820201265,0001.91301041
55078610380263,3581.11361061
6501460200162,0001.31291171
5011110200210,0001.91371071
6511601200327,0002.71160081
Table 4. List of hyperparameters used in the configuration. LR: Logistic Regression, NB: Naive Bayes, KNN: K-Nearest Neighbors, SVM: Support Vector Machine, DT: Decision Tree, MLP: Multi-Layer Perceptron. The best hyperparameters for Datasets 1, 2, and 3 are indicated by dashed, solid, and dotted underlines, respectively.
Informatics 12 00110 i001
Table 5. Performance results of individual and ensemble models for Dataset 1. Gray columns refer to training results, while non-gray columns refer to testing results. The best testing results are marked in bold.
ModelPrecisionRecallF1-ScoreAccuracyAUC-ROC
LR0.9290.9010.8660.8980.8960.8980.8770.8980.9430.958
NB0.9790.8370.6540.7350.7840.7330.7790.7350.8890.898
KNN1.0000.8451.0000.8141.0000.8171.0000.8141.0000.913
SVM0.9890.9490.9610.9470.9750.9470.9700.9470.9960.962
DT0.9940.9890.9950.9890.9950.9890.9930.9890.9990.989
MLP0.9970.9590.9720.9580.9840.9590.9810.9580.9970.981
ENS-XGB0.9920.9770.9920.9770.9920.9770.9920.9770.9990.984
ENS-DT0.9930.9780.9930.9770.9930.9770.9930.9770.9940.972
ENS-LR0.9940.9810.9940.9810.9940.9810.9940.9811.0000.981
ENS-RF0.9950.9890.9950.9890.9950.9890.9950.9891.0000.989
ENS-Vot0.9960.9670.9960.9660.9960.9660.9960.9661.0000.987
ENS-GBC0.9940.9890.9940.9890.9940.9890.9940.9890.9990.981
Table 6. Performance results of individual and ensemble models for Dataset 2. Gray columns refer to training results, while non-gray columns refer to testing results. The best testing results are marked in bold.
ModelPrecisionRecallF1-ScoreAccuracyAUC-ROC
LR0.8120.7780.8920.7760.8500.7750.8370.7760.8880.865
NB0.7980.7710.8380.7710.8170.7710.8060.7710.8680.847
KNN0.9950.9761.0000.9760.9980.9760.9980.9761.0000.999
SVM0.9740.9510.9860.9510.9800.9510.9790.9510.9950.974
DT0.9950.9761.0000.9760.9980.9760.9980.9761.0000.985
MLP0.9540.9460.9760.9460.9650.9460.9630.9460.9950.989
ENS-XGB0.9950.9860.9950.9850.9950.9850.9950.9851.0000.985
ENS-DT0.9950.9860.9950.9850.9950.9850.9950.9850.9950.985
ENS-LR0.9980.9760.9980.9760.9980.9760.9980.9761.0000.995
ENS-RF0.9980.9620.9980.9610.9980.9610.9980.9611.0000.999
ENS-Vot0.9980.9760.9980.9760.9980.9760.9980.9761.0000.999
ENS-GBC0.9980.9760.9980.9760.9980.9760.9980.9761.0000.980
Table 7. Performance results of individual and ensemble models for Dataset 3. Gray columns refer to training results, while non-gray columns refer to testing results. The best testing results are marked in bold.
ModelPrecisionRecallF1-ScoreAccuracyAUC-ROC
LR0.7850.8820.6460.8830.7080.8820.8240.8830.8800.948
NB0.7460.8480.6330.8500.6850.8490.8080.8500.8750.938
KNN0.7360.8410.8100.8330.7710.8360.8410.8330.9130.927
SVM0.7140.8460.8860.8000.7910.8090.8450.8000.9200.930
DT0.6950.8500.9240.7670.7930.7780.8410.7670.9440.888
MLP0.9150.8730.8230.8670.8670.8690.9160.8670.9670.947
ENS-XGB0.8730.7850.8480.8380.8600.8100.9090.8880.9680.931
ENS-DT0.8060.7300.7550.7760.7740.7440.8550.8480.8880.883
ENS-LR0.8260.7220.7250.7640.7720.7420.8580.8500.9400.929
ENS-RF0.8720.8260.7980.8330.8330.8290.8940.9020.9630.963
ENS-Vot0.7590.7480.7350.7050.7460.7050.8350.8490.9170.937
ENS-GBC0.8440.7460.7780.8360.8100.7880.8790.8720.9590.932
Table 8. Comparison of the proposed model with related works using Datasets 1, 2, and 3. LR: Logistic Regression, ADB: AdaBoost, XGB: XGBoost, RF: Random Forest, KNN: K-Nearest Neighbors, SVM: Support Vector Machine, DT: Decision Tree, MLP: Multi-Layer Perceptron. “–” indicates that no value was reported.
DatasetMethod UsedAuthorAccuracy (%)AUC (%)
LR Classifier[53]81.089.3
1Extra Trees[54]97.097.0
Ensemble-Voting (LR, ADB, XGB, RF)[55]98.098.0
Ensemble-Stacking-RF (LR, KNN, SVM, DT, MLP)Proposed Model98.998.9
KNN Classifier[15]93.0
2MLP[54]85.085.0
XGB Classifier[14]88.0
Ensemble-Stacking-DT (KNN, SVM, DT, MLP)Proposed Model98.598.5
Logistic Regression[37]83.882.2
3Associative Classification[56]86.6
Homomorphic encryption Deep Learning[57]91.189.7
Ensemble-Stacking-RF (LR, NB, KNN, MLP)Proposed Model90.296.3
Disclaimer/Publisher’s Note: The statements, opinions and data contained in all publications are solely those of the individual author(s) and contributor(s) and not of MDPI and/or the editor(s). MDPI and/or the editor(s) disclaim responsibility for any injury to people or property resulting from any ideas, methods, instructions or products referred to in the content.