Article

Methodology for Digitalizing Railway Vehicle Maintenance Training Using Augmented Reality

1
Maintenance Team, Seoul Metro, Seoul 04806, Republic of Korea
2
Railroad Vehicle Driving System Engineering, Korea National University of Transportation, Uiwang 16106, Republic of Korea
3
Department of Smart Railroad System Engineering, Korea National University of Transportation, Uiwang 16106, Republic of Korea
4
Department of Railroad Vehicle System Engineering, Korea National University of Transportation, Uiwang 16106, Republic of Korea
*
Author to whom correspondence should be addressed.
Informatics 2025, 12(4), 101; https://doi.org/10.3390/informatics12040101
Submission received: 28 July 2025 / Revised: 12 September 2025 / Accepted: 16 September 2025 / Published: 23 September 2025

Abstract

The axle box of a railway vehicle is a critical component, and its maintenance involves complex procedures that are difficult to convey with traditional, document-based manuals. To address these challenges, augmented reality (AR)-based educational content was developed to digitize maintenance training and enhance its effectiveness. The content’s implementation was guided by a systematic storyboard, which was based on interviews with skilled staff. It also utilized specialized algorithms to improve the accuracy of mechanical measurement work and the efficiency of User Interface (UI) generation. The user experience of the developed content was comprehensively evaluated using a combination of two methods: a formative evaluation through direct observation of work performance and a post-survey administered to 40 participants. As a result of the evaluation, the mean work success rate was 62.5%, demonstrating the content’s high efficiency as a training tool. The overall mean score from the post-survey was 4.11, indicating high user satisfaction and perceived usefulness. A one-way ANOVA was performed and revealed a statistically significant difference in post-survey scores among the four age groups. The developed content was found to be more effective for younger participants. The results confirm the high potential of AR as a digital educational method for complex maintenance work.

1. Introduction

Railway vehicles incur higher maintenance costs than other modes of transportation due to their long service life, severe wear, and vibration [1]. In addition, systematic training is crucial because railway vehicle maintenance is performed in a work environment that demands high adaptability and expertise. The axle box of a railway vehicle is an important driving device that supports the load and transfers braking force to the wheels. To maintain this device, specialized equipment is required, and a high level of technical skill is demanded. During disassembly and assembly, it is also essential to verify the torque values of bolts and measure the shaft height to maintain those values within tolerance. However, maintenance training for axle boxes has traditionally been conducted through on-the-job training using textbooks [2]. Such a training approach has encountered several challenges. Traditional on-the-job training using existing textbooks is constrained by factors such as time, space, and personnel, making it difficult to effectively transfer specialized knowledge [3]. To replace these manuals, there is a need for immersive and three-dimensional (3D) augmented reality (AR)-based educational content that provides a new learning experience for generations familiar with modern technology [4].
AR is a technique that combines virtual images with a real environment, displaying virtual objects in a 3D space in real time. It responds to the real space, provides both virtual graphics and informational content and shows useful information without the spatial limitations of the display. AR techniques have been successfully applied to staff training and maintenance in various safety-critical industries, including automotive, aerospace, and shipbuilding. The benefits of AR include reduced safety risks, increased work efficiency, and cost savings. The demand for AR-based maintenance is rising in line with digital transformation, with a growing number of cases utilizing it for maintenance staff education. While AR technology has been successfully applied in various industries, there are still opportunities for further research and development in the following areas: enhancing the accuracy of precision measurement work and reducing error rates, since existing research primarily visualizes simple processes; conducting more comprehensive usability verification through direct observation of actual maintenance work or analyzing usability across different user groups; and developing content for the railway vehicle maintenance field, a domain with a growing demand for AR applications, where AR can be implemented for complex procedures and supplement existing manuals.
To address the challenges and opportunities in railway vehicle maintenance training, this study proposes a systematic methodology for digitalizing complex procedures using augmented reality (AR). The developed digital content targets critical maintenance work essential for long-term vehicle safety and was designed based on interviews with experienced maintenance staff. Specialized algorithms were applied to generate efficient user interfaces and enhance interaction in mechanical measurement work. The effectiveness of this content was evaluated through formative observation of work performance and a post-survey with 40 novice participants across different age groups, providing empirical evidence of its usability and educational value. This study therefore focuses on three main objectives: First, to demonstrate that digital content can guide novice users with no prior experience in axle box maintenance to complete maintenance work without relying on traditional manuals. Second, to examine differences in user performance and experience across age groups, supported by statistical validation. Third, to identify design-related factors—such as animation duration, interface clarity, and interaction stability—that influence user delays or failures, thereby providing insights for improving future digital content.

1.1. Literature Review

1.1.1. Augmented Reality in Maintenance

AR technology to assist maintenance staff has been a significant topic of academic research for approximately 50 years, with substantial advancements made in the past decade, leading to its implementation in the industry [5]. By utilizing AR technology, maintenance staff can achieve benefits such as reduced safety risks, increased work efficiency, and cost savings [6,7]. Accordingly, there has been a recent increase in cases of utilizing AR technology for educating maintenance staff. Data provided through AR serves as advanced guidance and instructional tools in the field, making it highly beneficial for maintenance staff [8]. The demand for such AR-based maintenance is rapidly increasing in line with the digital transformation trend, and it is expected to continue to grow steadily in the future [9,10].
A systematic analysis of research on AR-based maintenance was conducted. Peng et al. [11] proposed a method to visualize the standard operating procedure of an aircraft and provide it as an AR simulation. Their framework provided work processes in a three-dimensional space through simulations of aircraft turbofans and landing gears, enabling defect detection using artificial intelligence technology. In the plant field, Song et al. [12] proposed a system that integrates SLAM (Simultaneous Localization and Mapping) and ToF (Time of Flight) modules to provide AR-based video guidance for maintenance work. Additionally, the maintenance time was measured and compared between two groups, and it was found to be reduced compared to the existing process. In the automotive field, Borro et al. [13] developed a system that utilizes algorithms for spatial mapping and object detection to identify vehicles and automatically provide necessary maintenance-related information. Furthermore, to verify the system, a performance comparison experiment was conducted with the existing document-based maintenance manual during the execution of four actual maintenance work. As a result, work efficiency and execution speed were improved. In the shipbuilding field, Lee et al. [14] developed a markerless-based accurate model alignment system for seamless object detection. Additionally, the evaluation was conducted in three stages to compare accuracy and time, and its validity was demonstrated. Lim et al. [15] developed a platform that provides AR-based information through remote collaboration while linking in real time with a smart factory system. The platform enables remote collaboration with system experts in the event of failure, providing information and facilitating immediate on-site repairs. It was also concluded that using the system aids in rapid decision-making while reducing maintenance costs and time. Jung et al. [16] presented a methodology to recognize the equipment components of a thermal power plant and visualize and provide related information. The methodology utilizes location-tracking-based technology to calculate the position information of components and presents it through AR. Additionally, a four-stage field experiment was conducted, which suggested that the methodology reduces human error and enhances work efficiency.
Table 1 provides an analysis of AR research cases in the maintenance field, highlighting the novel contributions of our study against the existing literature.
Existing AR-based maintenance research has been conducted in various fields, but the majority of these studies have focused on visualizing simple maintenance processes and related information. Therefore, there is a need for a systematic methodology that enhances the accuracy of precision measurement work, which have not been a focus of existing research. To address this need, a newly proposed solution was utilized to provide a touchpad that allows users to input dimensional measurements and interact with digital content. The algorithm has also been modularized, enabling its utilization in a wide range of mechanical measurement work beyond the railway vehicle field.

1.1.2. Augmented Reality in Railway

Analyzing AR-based research in the railway field, Bulkova et al. [17] developed AR-based automatic train recognition, transportation inspection, and technical inspection processes in the field of vehicle operations. The comparison of the actual process with the existing process revealed that inspection time was reduced and employee error rates decreased. In the field of railway vehicle maintenance, Scheffer et al. [18] proposed a system that provides accurate maintenance instructions and relevant information through AR-based voice and visual interaction functions. The system issues warning messages and provides real-time feedback if maintenance work is not performed according to safety standards. Furthermore, interviews conducted with 28 railway maintenance staff demonstrated that the system is suitable for enhancing technical capabilities. Jeon et al. [19] developed an AR-based railway safety inspection process. The process enables pre/post safety inspections based on AR, providing remote inspections and precise inspections in a stable indoor environment. Kostolani et al. [20] developed AR smart glasses that transform manufacturing process parameters of electric monorails and provide sensor status monitoring. These glasses visualize sensor status monitoring values for staff and provide real-time maintenance process. Accordingly, it was suggested that maintenance quality and failure prediction accuracy were improved. In the railway insulation panel assembly work, Garcia et al. [21] developed an AR system based on Hololens. The system utilizes a marker-based algorithm to provide staff with AR-based visual instructions and automatically aligns assembly information in real time to enhance efficiency. Additionally, the user experience evaluation results, conducted by dividing 12 people into two groups showed that assembly time and error occurrences were reduced. Table 2 provides an analysis of AR research cases in the railway field and demonstrates the unique contributions of our study in comparison to the existing literature.
Similarly, AR-based educational content in the railway industry has been developed in various fields such as manufacturing, assembly, operation, safety inspection, and maintenance [17,18,19,20,21]. However, research cases in the field of railway vehicle maintenance are extremely limited, and there appear to be few instances of implementing AR animations for complex maintenance procedures or supplementing existing maintenance manuals [22]. Moreover, existing studies have either not conducted usability verification of the developed cases or have not analyzed usability by comparing results across different groups. To apply AR technology to the field of railway vehicle maintenance, interviews were conducted with an advisory group of 20 maintenance staff to collect preliminary data for content development. Maintenance know-how that was not described in existing maintenance manuals was also consolidated and incorporated into the content. The developed content was evaluated for usability through a user experience evaluation conducted with a test group of 40 maintenance staff, divided into four age-based groups.

2. Materials and Methods

2.1. Overview of the Methodology

This study proposes a comprehensive methodology for digitalizing railway vehicle maintenance training using augmented reality. The entire process, from data collection to user experience evaluation, is illustrated in Figure 1. This methodology serves as a systematic framework for developing an effective digital platform. This overview provides the organizing logic for Section 2.2 and Section 2.3, where each stage is described in detail.

2.2. Digital Content Development Process

Existing AR-related equipment consists of heavy and complex components, such as a camera, a screen display device, and a processing device. Due to the recent rapid development of information and communication technology (ICT) and mobile device-related base technology, the personal penetration rate of mobile devices equipped with cameras is approaching 70% of the world’s population. Mobile Augmented Reality (MAR), which combines the advantages of mobile learning and AR technology, is rapidly advancing [23]. MAR is a technology that obtains information about objects and environments that users see by overlaying images onto the real environment through mobile devices [24,25]. MAR combines the mobility of wearable devices with recently improved built-in cameras, cloud computing, and other technologies to enable the use of a convenient augmented interface [26]. There are the following problems in applying AR technology to the field of railway vehicle maintenance:
  • Converting a vast amount of maintenance manuals classified by vehicle type and device requires long-term development and high costs.
  • Because maintenance work is performed in a confined environment, such as the narrow space under the rail or the high place on top of the vehicle body, visibility must be secured for safety.
  • Railway vehicle maintenance staff are not familiar with AR technology due to the aging digital divide and the number of inexperienced staff is rapidly increasing, necessitating the need for advanced technical support.
To address these issues, MAR-based educational content was developed to reflect the specific characteristics of railway vehicle maintenance.
The content is designed for universal distribution across smartphones and tablets, ensuring broad accessibility. Compared to traditional paper manuals, it provides superior portability and storage capacity, effectively overcoming the physical limitations of conventional documentation. In addition, the system secures a wide field of view without requiring a separate head-mounted display (HMD). It also supports real-time, advanced technical assistance, which is particularly beneficial for complex maintenance work [27,28]. Ultimately, the MAR-based system overlays virtual information onto the real-world environment, combining efficient information delivery with active learning. This approach enhances practical usability and facilitates more effective training for maintenance personnel.

2.2.1. Axle Box

The axle box of a railway vehicle is a device that supports the load of the vehicle and transmits traction and braking forces to the wheels. As shown in Figure 2, it is installed at both ends of the axle. It serves to maintain the position of the axle during vertical displacement of the bogie frame, while also compensating for axle rotation.
Depending on the function, various speed sensors and ground brushes are installed. The maintenance process of the axle box includes external inspection and dimensional inspection. Before and after train operation, maintenance staff directly check whether the front cover bolts, conical spring, safety hanger, etc., are fastened with the prescribed torque value. Additionally, the tolerance of the bogie frame is measured and adjusted to the prescribed tolerance. To understand the maintenance process, additional information such as specifications, system hierarchy, and equipment usage, beyond the procedures provided in the existing maintenance manual, is required.

2.2.2. Modeling and Storyboard

Figure 3 shows the 3D modeling process of the axle box for content design. The shape data was collected using a 3D scanner by visiting industrial sites performing railway vehicle maintenance work for accurate modeling. The CAD (version 2024, Autodesk Inc., San Rafael, CA, USA) model was generated using Geomagic DesignX (version 2023.0, 3D System Inc., Rock Hill, SC, USA), based on the shape data. This model was compressed using SAP 3D Visual Enterprise Author (version 9.0, SAP SE, Walldorf, Baden-Württemberg, Germany) and converted for use in Unity. The digital content was developed using the Unity engine (version 2023.1.18f1, Unity Technologies, San Francisco, CA, USA) and optimized for mobile devices with the Universal Render Pipeline (URP). AR functions were implemented using the Unity AR Foundation package, which supports ARCore for Android and ARKit for iOS, ensuring broad compatibility. The final model is a low-capacity file compressed by more than 85% compared to the original file, making it convenient for use on mobile devices.
A storyboard is an output document that serves as a foundational reference for content development and must detail the necessary screen elements while accounting for various variables. Creating a systematic storyboard enhances the efficiency of content development. Prior to creating the storyboard, keyword mapping was conducted to efficiently convey the maintenance process by referencing similar studies in the maintenance field [29]. The keyword mapping involves reorganizing and categorizing the extensive content of existing maintenance manuals by terms, enabling a comprehensive understanding of the overall maintenance workflow at a glance. For mapping, interviews were conducted with 20 railway vehicle maintenance technicians of Level 2 or higher (classified into four levels) to collect information [30].
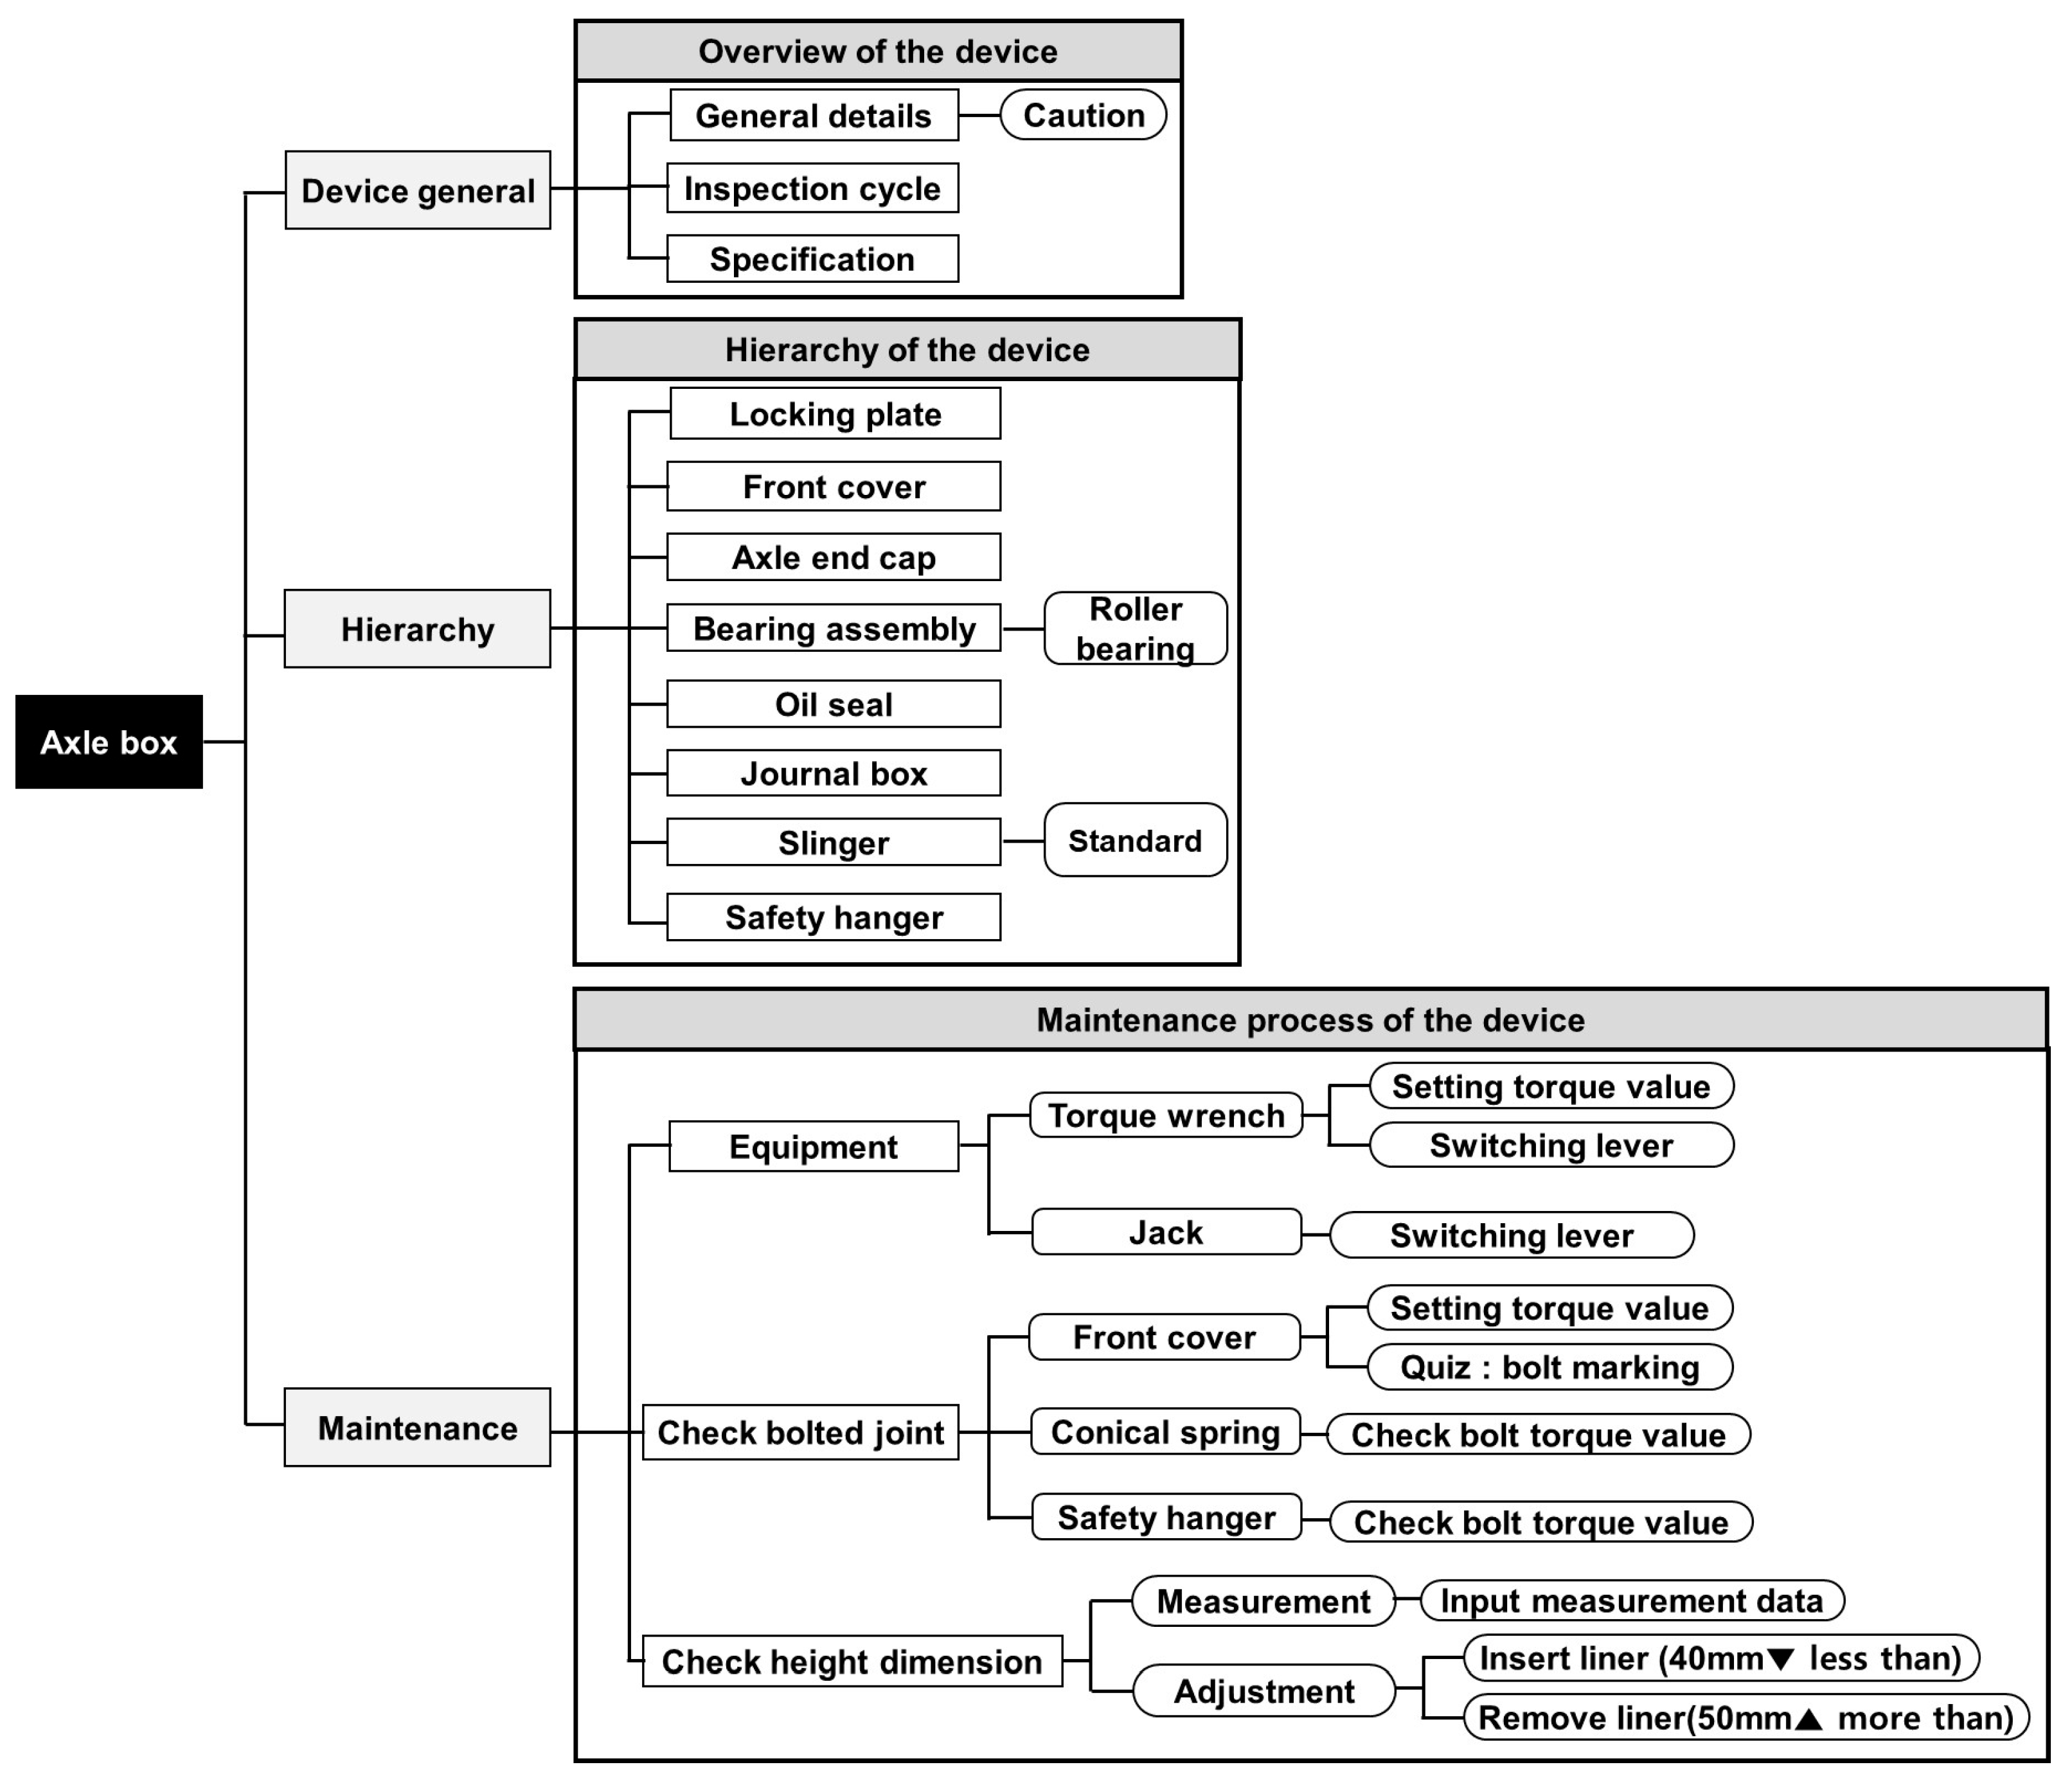
Figure 4 provides an example of top-down mapping of essential information for developing educational content on axle box maintenance. The upper-level categories include device general, hierarchy, and maintenance, which are further subdivided into 14 detailed subcategories. The maintenance section, in particular, encompasses a variety of work involving specialized equipment such as jacks and torque wrenches, checking torque values of bolts fastened to front cover, conical spring, safety hanger, measuring shaft heights, and more. Consequently, the structure of the menu is highly intricate and diverse.
Figure 5 is a storyboard for AR content created based on a mind map. As shown in Figure 5a, the storyboard consists of items displayed on the screen of a mobile device and the corresponding scenario. Details include animation design, such as in Figure 5b, the overall UI composition, each button, the pop-up window that appears when a button is clicked, displayed text, and photos.

2.2.3. AR Implementation Flow

The AR implementation flow of the developed content is illustrated in Figure 6. As shown in the diagram, the process begins with user guidance delivered through instructional text and voice assistance (Step 1). The system then employs the mobile device’s camera to detect a real-world plane, thereby transitioning from a 2D interface to a 3D AR environment (Step 2). Once the reference plane is identified, the AR content is placed in the physical environment, and a 3D model is instantiated at the corresponding spatial coordinate (Step 3). Finally, users interact with the content by manipulating the 3D models, accessing explanations, and performing work-related actions through touch gestures such as zooming and rotating (Step 4).
To complement this logical flow, Figure 7 presents actual screenshots that demonstrate how each stage is implemented on a mobile device. The sequence of images shows the transition from text-based user guidance to spatial recognition, followed by digital content placement and direct user interaction with the 3D model.

2.2.4. IGPI Algorithm

Railway vehicles come in various types, and each type is composed of numerous components. Furthermore, each component has a complex structure composed of many sub-components according to the bill of materials (BOM). Therefore, to develop educational content in the railway vehicle field, the abundance and diversity of related components result in a highly complex and diverse menu structure. Generating such complex menus using Unity requires a lot of time and effort due to the repetitive nature of the work (or implementation). To resolve these challenges, an interface generation productivity improvement (IGPI) algorithm is proposed to minimize repetitive work, reduce work time, and enable faster menu generation. Figure 8 illustrates the flowchart of the IGPI algorithm. To implement the proposed algorithm, a reusable user interface (UI) prefab must first be established for use throughout the educational content. The process begins by defining four distinct UI frame types according to their intended purposes, such as presenting only text, combining text with images, integrating text with interactive buttons, or incorporating all three elements simultaneously. Once these frame types are created, they are interconnected using default navigation buttons, with each button assigned a specific function to facilitate user interaction. For each maintenance procedure, input variables are then specified, including text values related to the procedure, any additional buttons required for interaction, and the corresponding images to be displayed. After the interface prefab is instantiated, the appropriate frame type is selected, and the predefined variables are applied. Through this process, the system automatically generates a customized interface, ensuring consistency and efficiency in the development of maintenance training content.
Figure 9 is the user interface of digital content implemented using the proposed IGPI algorithm. As shown in the figure, each frame type was selected based on the design requirements. By instantiating the prefab and configuring the menu, an intuitive user interface suitable for use on a mobile device screen was completed.
The novelty of the IGPI algorithm lies not in the use of simple prefabs, but in its systematic methodology for effectively managing the vast and complex content structure specific to railway vehicle maintenance. By replicating and leveraging UI prefabs based on standardized frames, the algorithm significantly enhances the productivity of content development. This is evidenced by the integration of the entire content hierarchy, which was previously composed of eight layers and numerous classes, into a single layer. As a result, it allows for easier management, future modifications, and also reduces the overall file size. The algorithm is well-suited for developing educational content in the railway vehicle field, which consists of many mechanical devices and has a highly complex menu structure.
In addition to these structural benefits, the algorithm provides a flexible foundation for transforming existing manuals into an immersive AR experience. To support this, four standardized UI frame types were defined as shown in Table 3, ranging from simple information displays to complex, scenario-based interactions. These frame types serve as reusable building blocks that enable consistent design and efficient integration of diverse elements such as images, buttons, and quizzes. By applying these standardized frames, the IGPI algorithm accommodates interactive elements and supports the development of complex scenarios by linking them directly to button events. In this way, it provides an efficient basis for creating complex content, which is an essential element in converting a textbook into a highly engaging and immersive AR experience.

2.2.5. MWI Algorithm

The railway vehicle maintenance process includes numerous mechanical measurement work such as wheel flange measurement, measurement of brake shoe and lining usage limits, and air spring displacement measurement. In these measurement work, small errors can directly result in safety accidents, such as derailments or personal injuries. However, because these small errors cannot be confirmed with the naked eye, the maintenance staff thoroughly manages them using equipment capable of measuring even minute units. Existing digital content in the railway vehicle field does not include interfaces related to measurement work. A measurement work interaction (MWI) algorithm was proposed to prevent errors in measurement work and enable users to interact with measurement equipment. Figure 10 is the flowchart of the MWI algorithm. The touchpad was designed to enable users to input measured dimensions directly. It allows the input of numbers up to the decimal point and includes buttons for clearing, entering, and canceling operations. The minimum and maximum values are set within the appropriate tolerance based on maintenance process standards, and the touchpad is visualized accordingly. After performing the measurement work, users input the measurement values into the touchpad. If the entered value is within the specified tolerance range, a message indicating correctness is displayed. If the value is outside the tolerance range, it is categorized as either over or under, and the system displays related animations to guide the user through the corresponding maintenance process.
While the underlying logic employs standard conditional structures such as range validation, the MWI algorithm’s originality lies in its integration of real-time dimension entry and tolerance-based feedback within an AR-based mechanical training environment. Unlike conventional digital content that merely visualizes procedures, MWI actively engages users by linking their inputs with differentiated animations based on actual maintenance outcomes, fostering decision-making and error recognition skills. To ensure broad applicability, the algorithm was modularized and designed to support various precision measurement work beyond railway vehicles. Tools such as Vernier calipers, wheel gauges, and steel rulers can be virtually simulated through the MWI interface, enabling adaptation across domains such as automotive and aviation. From an educational perspective, MWI maximizes learning effectiveness by promoting active participation, reflection on measurement deviations, and reinforcement of proper procedures through scenario-based feedback. This approach is particularly effective for novice technicians, as it supports the development of tolerance-based decision logic and critical technical judgment required in real-world operations.

2.3. Digital Content Composition and Details

The text within the digital content is displayed through color coding to distinguish different purposes.Dimensions that require accuracy are expressed in orange, cautions for each maintenance process are expressed in red, and additional emphasis is indicated in yellow. Additionally, when an animation is executed by clicking each button, actual photos for reference and explanatory text are displayed to enhance user understanding. The composition of content is divided into three parts based on the storyboard. The device general part includes general details, inspection cycle, and specifications. The Axle box is displayed simultaneously with the railway vehicle running device in AR, making it easy to identify its location. Additionally, by clicking the button at the bottom right, it is possible to learn about the overall description of the device, precautions for handling, and actual damage cases, as shown in Figure 11. The pop-up window in the figure shows actual photos and descriptions of bearing damage and grease leakage. Inspection cycle and specifications can be checked in a separate additional pop-up window when selected. In the pop-up window, the details are organized by items and displayed in a table format.
The hierarchy part is designed to display a complete exploded view, making it easy to recognize and learn the various components. The user can utilize touch gestures to rotate the view at any angle to observe the connections between components and the detailed hierarchy and can use the hide menu button located at the top of the screen. Figure 12 is a detailed exploded view of the axle box and a cross-section of the ball bearing, which is an internal part. As shown in the figure, by clicking the desired button among the eight components on the left, it is possible to check additional information such as dimensions and cross-sections of each component. Therefore, it is possible to effectively learn the hierarchy of the axle box, which was unknown before disassembling the device, prior to commencing work.
The maintenance part consists of equipment usage for maintenance work and a detailed inspection process. For equipment usage, a list of equipment used for maintenance work is displayed in a pop-up window, and each equipment usage is demonstrated through AR animation. As shown in Figure 13a, this content is designed to guide the user through a step-by-step visualization of the maintenance procedure, which progresses each time the “Next” button located at the bottom right is clicked. This button is highlighted in a separate color to encourage active participation and to provide a more systematic and structured learning experience. Figure 13b shows an educational quiz pop-up window. This quiz was designed to encourage the selection of the correct answer by allowing the participant to try again if an incorrect answer is chosen. The key learning points of the maintenance process were reinforced through this quiz process. Accordingly, users can check whether they have learned properly. The bolt fastening inspection process was displayed using the highlight function and finger model, as shown in Figure 14a, to enhance the sense of realism. In this way, it can capture the attention and focus of users by implementing it vividly with reference to the actual maintenance process. Figure 14b shows the process of checking the shaft height dimension. The height measurement location is visualized using a separate square bar. The maintenance process according to the height measurement value is classified and placed at the bottom right. The user can accurately check the measurement location and efficiently learn the maintenance process guided in conjunction.
Figure 15a shows a touchpad implemented using the MWI algorithm. Users can con-firm that the dimensions are within tolerance by inputting them on the touchpad after working actual measurements. Also, as shown in Figure 15b, when the measurement value exceeds or falls short of the tolerance, users can experience the necessary processes for each situation in conjunction with animations.

3. User Experience Evaluation and Results

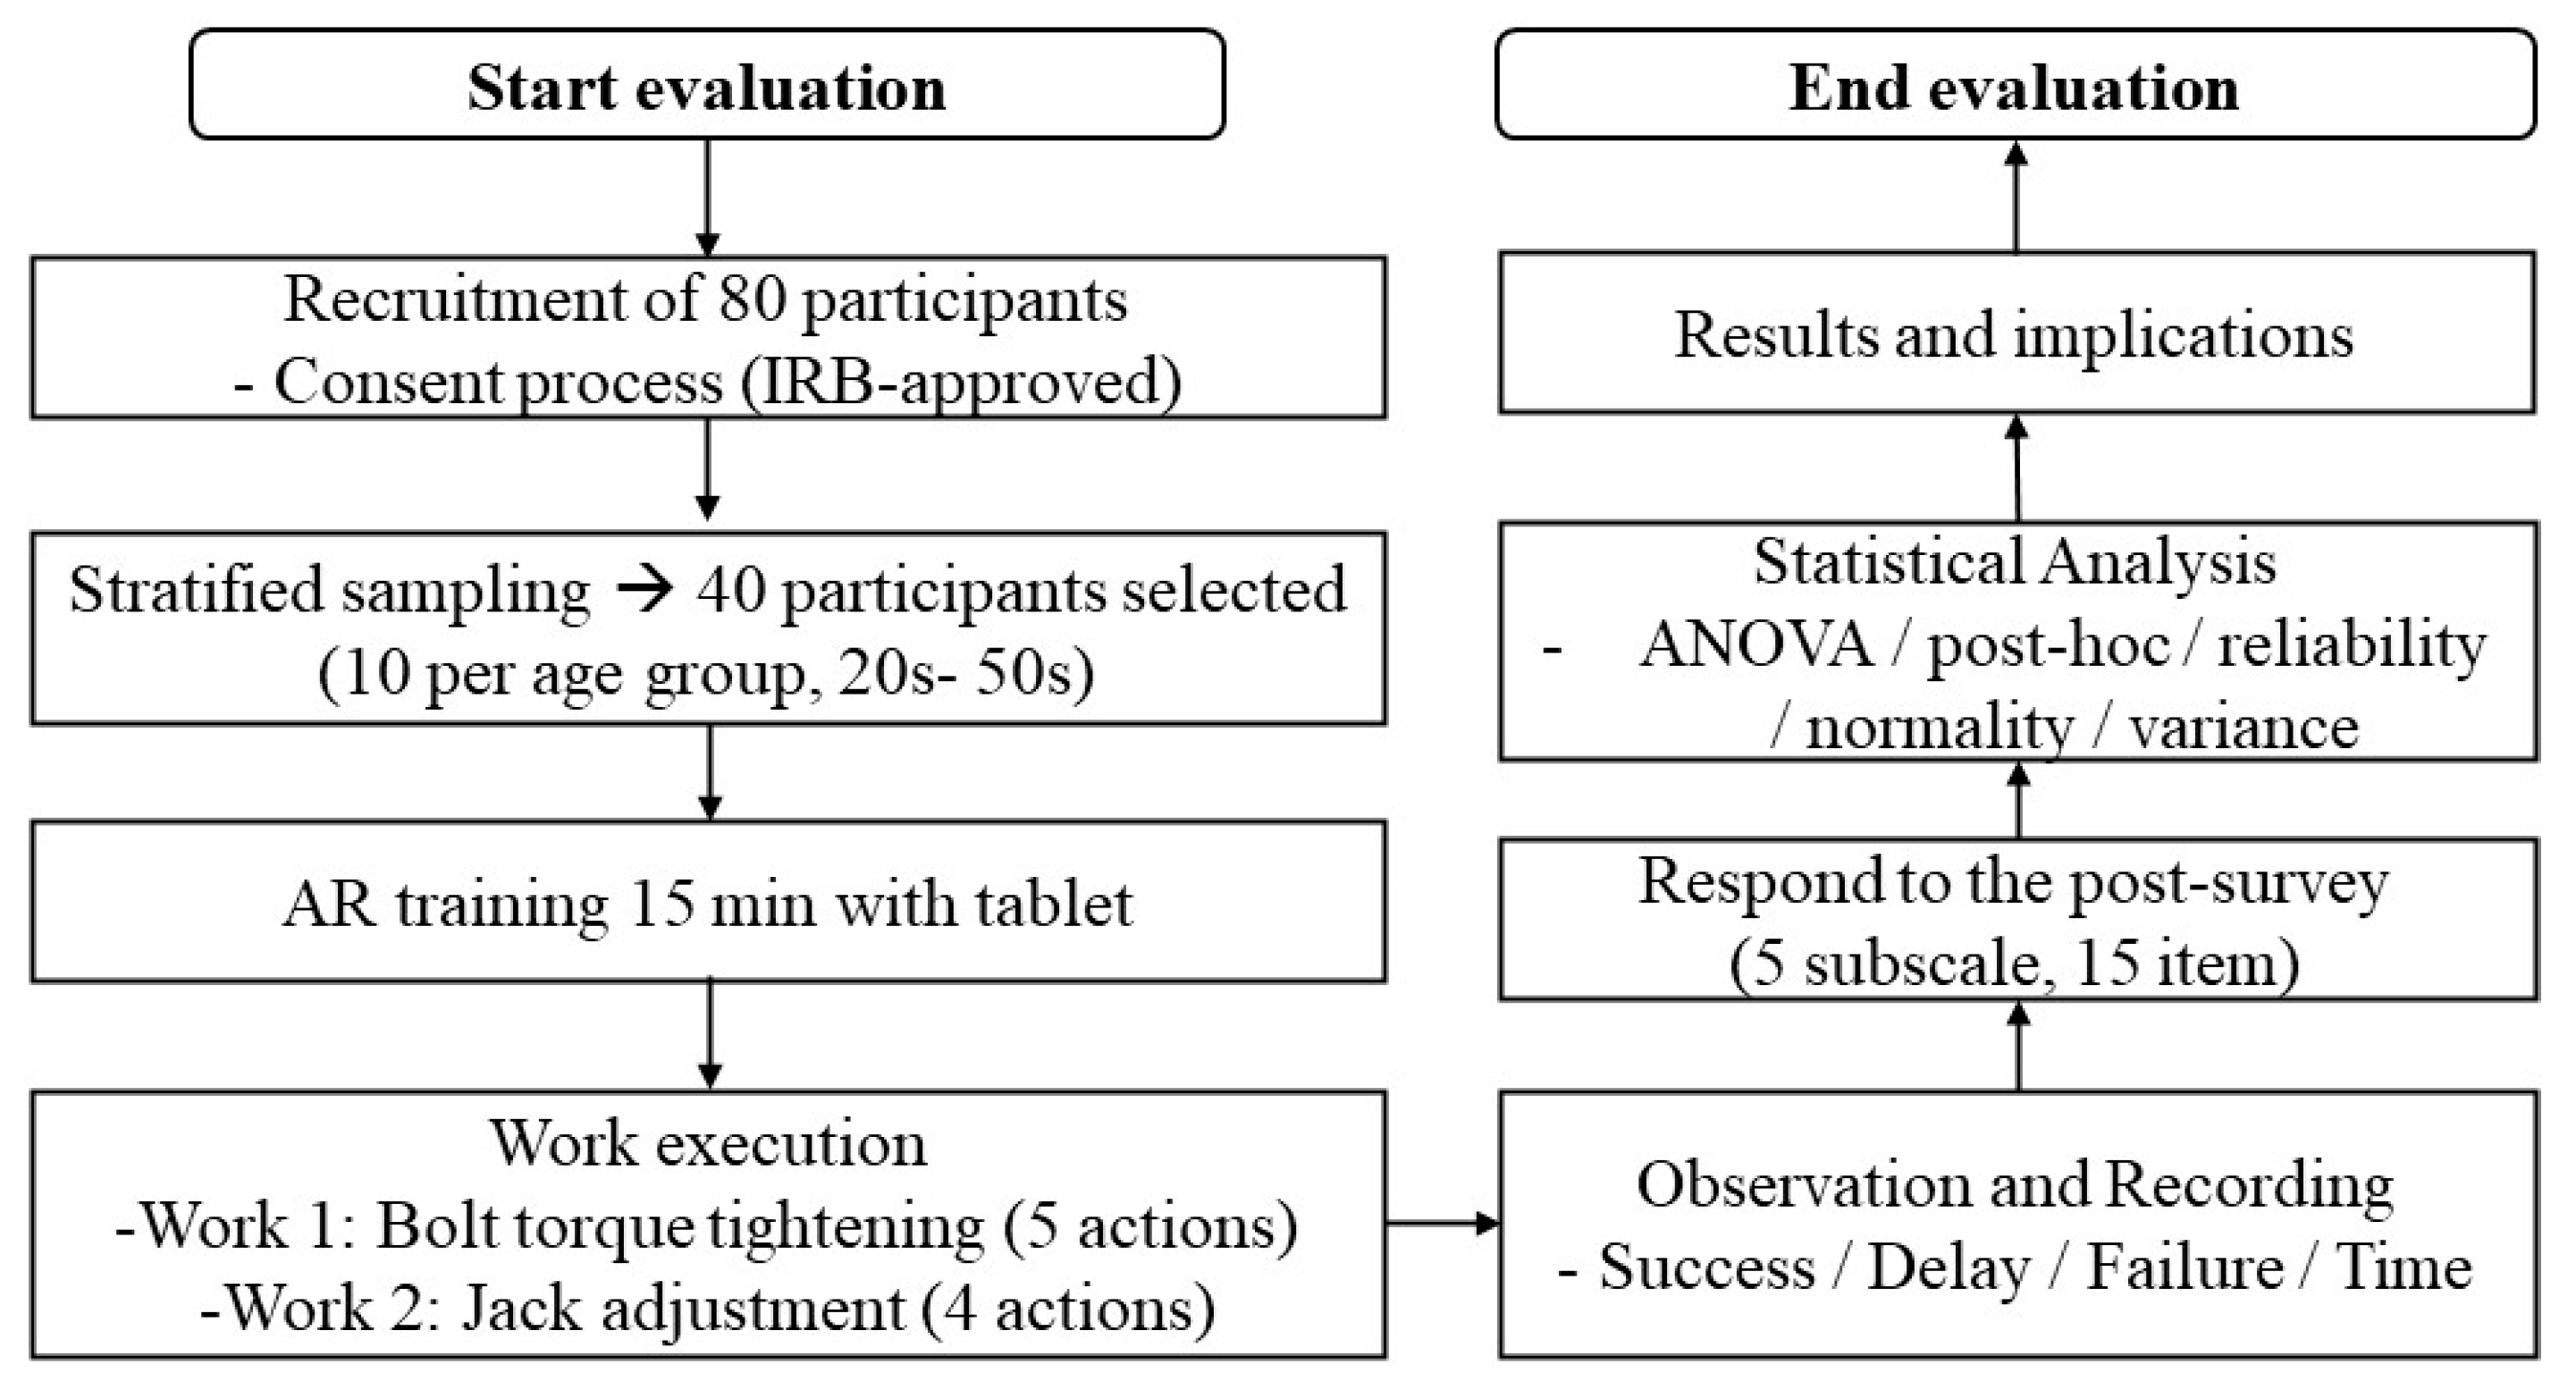
To clarify the whole evaluation process, a new evaluation schema is presented in Figure 16, detailing the methodology from participant recruitment to data analysis. The diagram illustrates the comprehensive user experience evaluation methodology, detailing the process from participant recruitment and stratified sampling to the two-part evaluation (formative evaluation and post-survey) and subsequent data analysis.

3.1. Formative Evaluation

As a formative evaluation tool, the observer checklist developed by You Ji-won et al. was reconstructed to suit the subject of this research through discussions with developers and railway-related professors [31]. Two activities were considered for this case study, with the most complex and difficult maintenance processes implemented as animations in the content. The derived work were evaluated by classifying them as either successful, delayed, or failed for each detailed item. In the developed evaluation tool, each item was modified based on the review of staff with over 10 years of experience in railway vehicle maintenance. For each maintenance work, performance was assessed according to predefined target behavior criteria.
The first maintenance work involves bolt tightening using a torque wrench.
The process begins by setting the specified torque value and switching the torque wrench lever to the tightening mode. The operator then holds the torque wrench with both hands and positions it on the front cover bolt. Next, the handle is turned clockwise until a clicking sound is heard, indicating that the proper torque has been achieved. Finally, the bolts are marked with a white marker to confirm that the tightening process has been completed.
The second maintenance work focuses on adjusting the height of a shaft using a jack. Initially, the shaft height is measured with a steel scale to determine the starting point. The lever is then switched to the lifting position, and the handle is repeatedly moved to raise the jack by approximately 10 cm. Once the desired height is reached, the lever is switched again to lower the jack carefully to its proper position.

3.2. Post-Survey

The post-survey was designed to comprehensively evaluate user experience with the digital content, focusing on elements critical to learning effectiveness and technical training. To optimize the instrument, existing frameworks from AR-based education and maintenance training studies were reviewed [32,33,34], and the overall structure was reorganized with reference to the tool developed by Shin Jung-min et al. [35]. The final survey consisted of five subscales—activeness, immersion, presence, satisfaction, and usability—each comprising 3 items, for a total of 15 items. Responses were measured using a 5-point Likert scale ranging from 1 (“strongly disagree”) to 5 (“strongly agree”) [36,37,38].
Importantly, while the subscale framework was informed by prior validated instruments, the individual items presented in Table 4 were newly developed, specifically tailored to the context of axle box maintenance training and refined through expert discussions with AR developers and railway-related professors, ensuring both contextual relevance and reliability.

3.3. Evaluation

In the evaluation, the study recruited participants with no prior experience in axle box maintenance or related equipment to verify whether the digital content could provide sufficient guidance and training without relying on pre-existing knowledge or traditional manuals. To analyze age-related differences, a stratified sampling method was applied to an initial pool of 80 candidates, and 40 participants were selected. The final sample consisted of 33 males and 7 females, with 10 individuals in each age group: those in their twenties, thirties, forties, and fifties [39]. All recruitment and training procedures were approved by the Korea Transportation University Industry–University Cooperation Foundation and informed consent was obtained from all participants. The demographic characteristics of the participants, including age and gender, are presented in Table 5.
Each participant was trained on the digital content for 15 min using a tablet provided in the practice room and then performed two work based on the instructions written on the evaluation sheet. Axle boxes, torque wrenches, markers, and steel scales were prepared in the practice room.
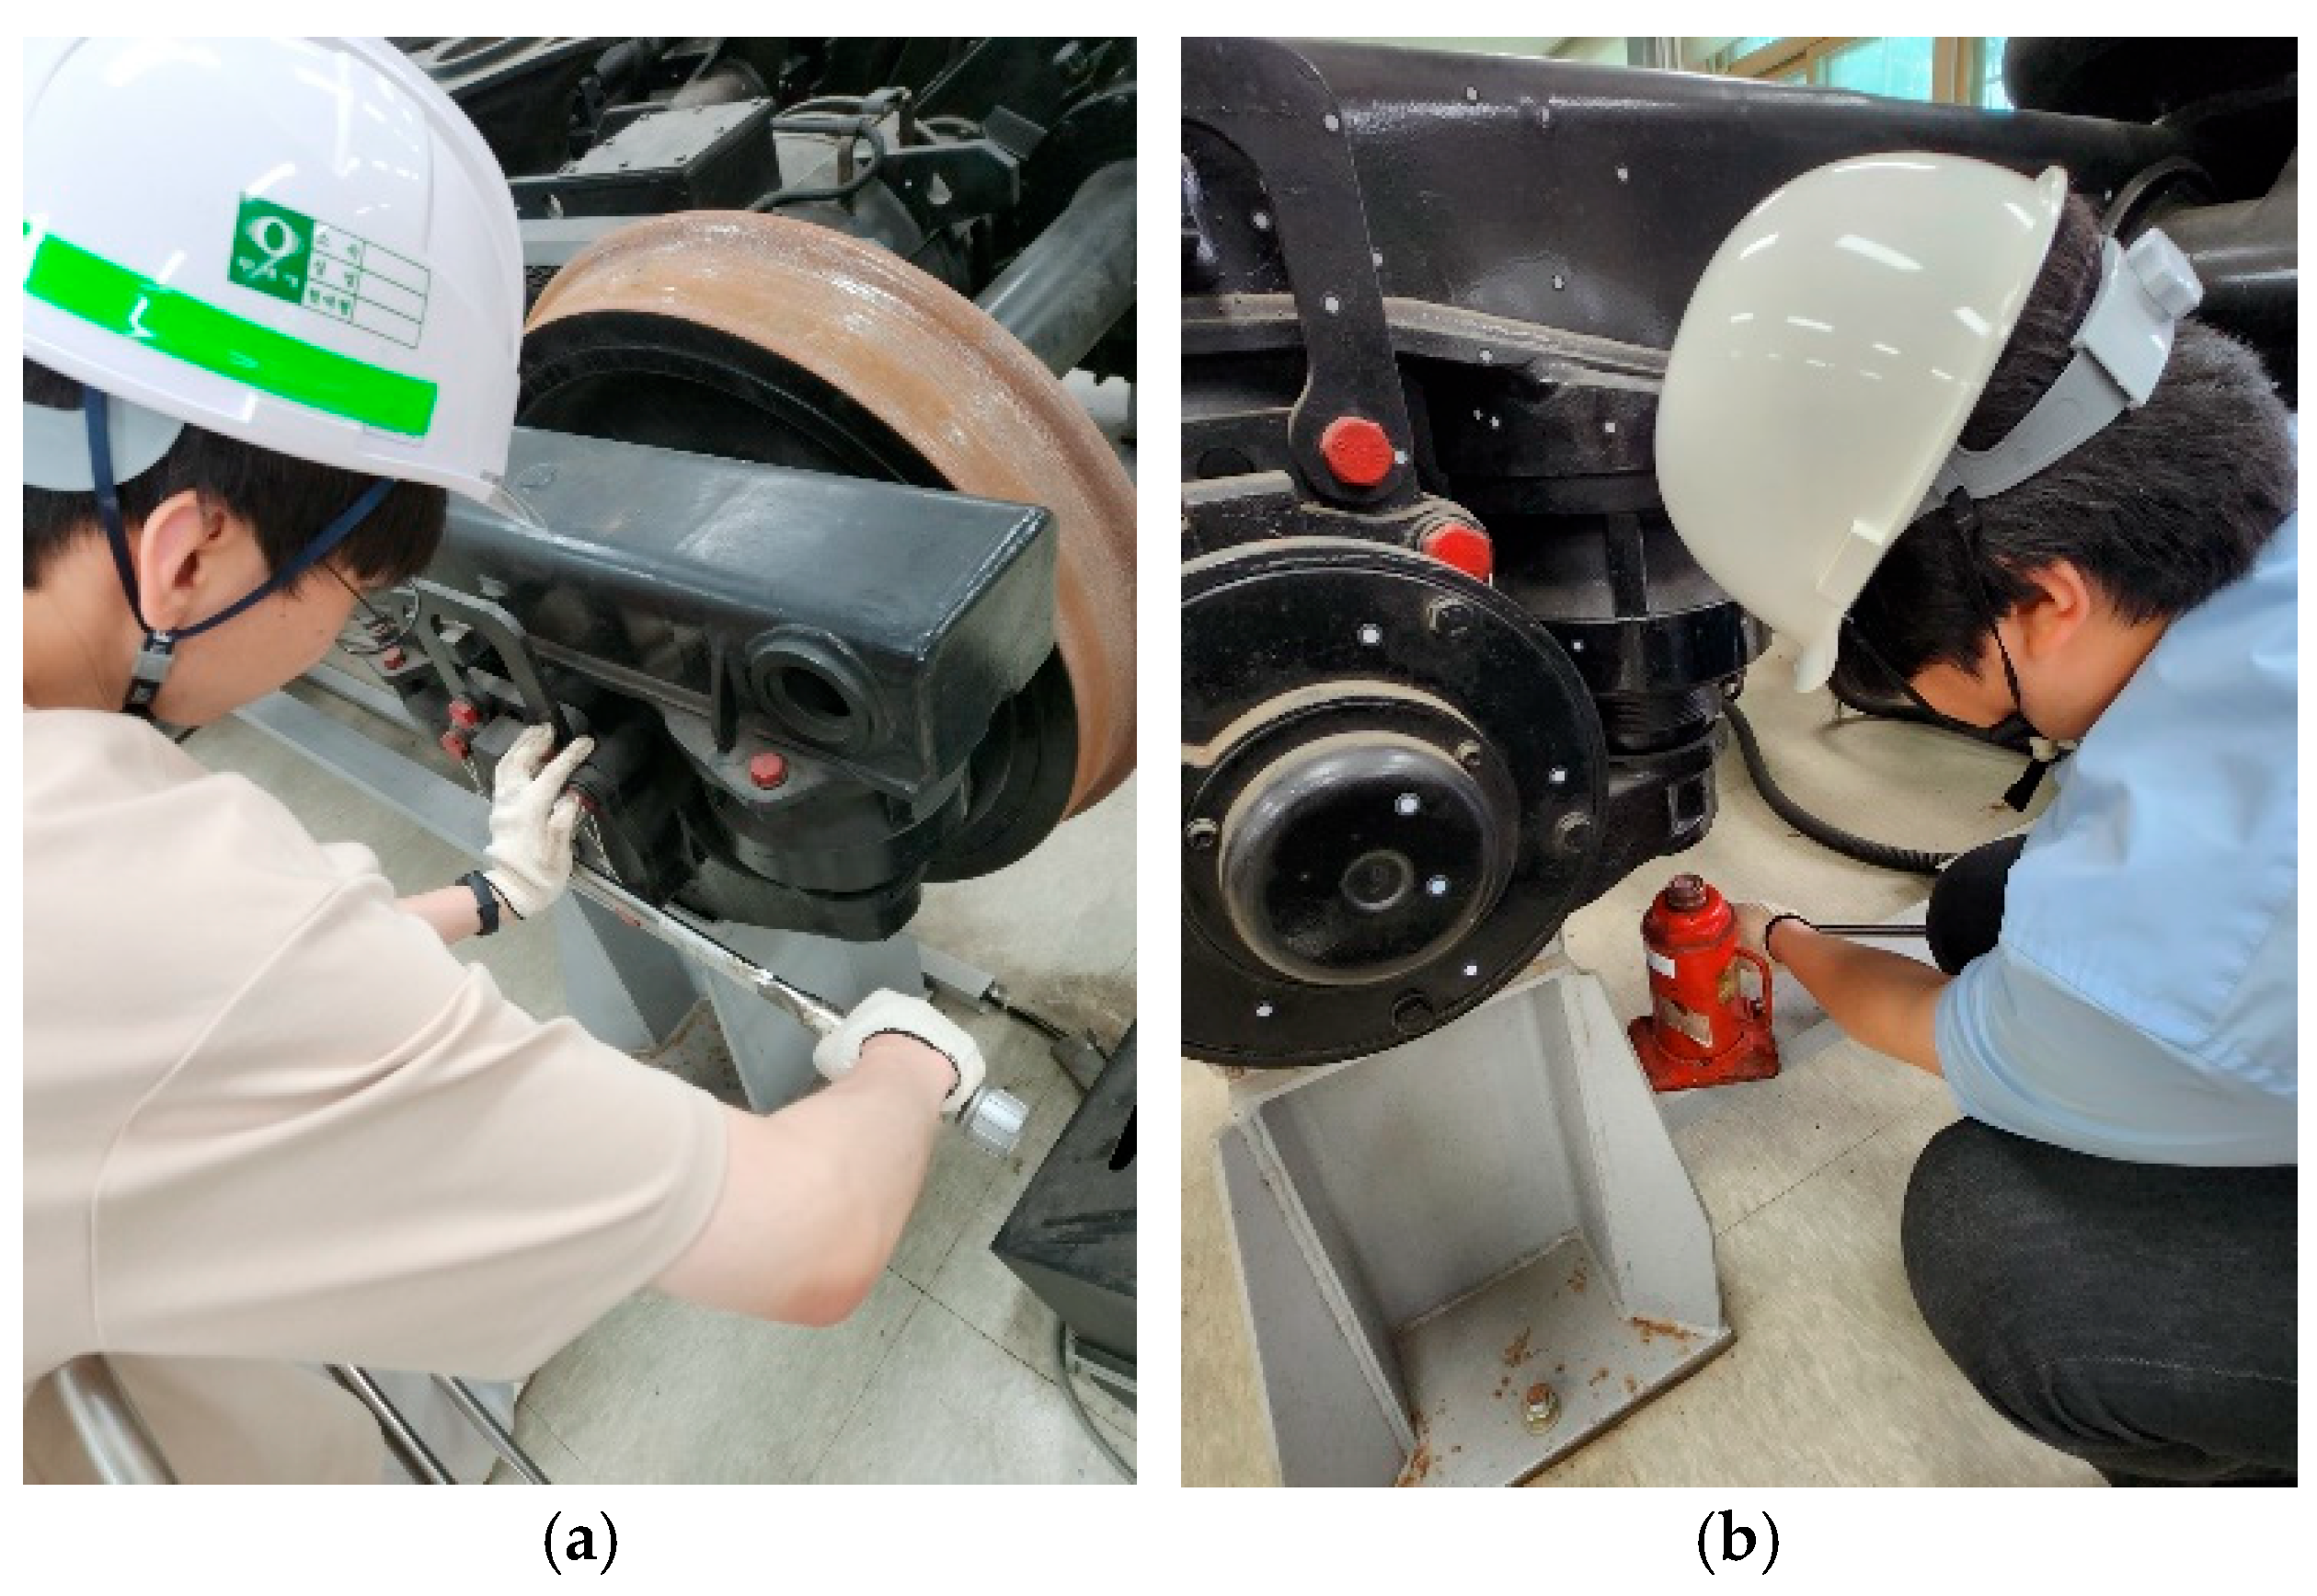
Three observers recorded the work performance of the participants by categorizing it into success, delay, and failure. Success is defined as completing the work within 2 min without relying on the provided content to accomplish the specified action outlined in the evaluation sheet. A delay is when the content is re-utilized or completed within 5 min to perform a target action. A failure is defined as the inability to consistently complete the target action for more than 5 min. Observers recorded the causes of delays and failures and measured the time it took to perform each action. Figure 13 shows participants performing the action for each work. Figure 17a shows participants actually tightening the bolt with a torque wrench and Figure 17b shows participants directly switching the lever of jack.

3.4. Results

The first work is to set the torque value of the torque wrench and perform the fastening inspection of the front cover. All participants were trained solely with the interactive AR guide for 15 min prior to the work, without exposure to conventional manuals or alternative training methods. This ensured that every participant performed the same procedure under identical conditions, making the evaluation focused on how well first-time learners could complete the work using digital content alone. Observers recorded the time it took for participants to complete the five target actions using a torque wrench and marker, which were prepared in the practice room. They also noted whether the participants succeeded, experienced delays, or failed. Table 6 presents the evaluation results of the first work. As a result of the recordings, there were many delays when performing actions 1 and 4. Observers have identified the cause of the delay as follows. In action 1, the animation duration of turning the dial on the torque wrench handle was too short, which did not allow the user enough time to learn. In action 4, the guide to the clicking sound was provided only in text format, making it difficult to understand. Delays were observed up to five times in actions 2, 3, and 5. This is because the ‘Next’ button was placed to encourage learning the animation step by step, and the training quiz pop-up window provided sufficient time and environment for users to learn. The mean time required for the first work was 8 min and 26 s, with a minimum of 7 min and 34 s and a maximum of 10 min and 13 s. The number of participants who succeeded in all five actions was 23 out of 40, resulting in a success rate of 57.5%.
The second work is to measure the height of the shaft and use the jack to adjust for any differences. Similar to the first task, all participants completed the procedure after receiving the same AR-based training, without group division. Observers recorded the time it took for participants to complete the five target actions using a jack and stainless-steel ruler prepared in the practice room, as well as whether they succeeded, were delayed, or failed. Table 7 presents the evaluation results of the second work. It was observed that there were numerous delays while performing action 2. Observers have identified the cause of the delay as follows. In action 2, it was difficult to understand because the animation duration for rotating the switch lever was short, and detailed text guidance for the rotation direction was not provided. In actions 1, 3, and 4, delays occurred up to 5 times. This is because the height measurement position is indicated using square bars and arrows, and the movement of the piston is expressed in 3D animation, making repetitive learning easy. The mean time required for the second work was 6 min and 3 s with a minimum of 5 min and 23 s and a maximum of 7 min and 49 s. The number of participants who succeeded in all four actions was 27 out of 40, resulting in a success rate of 67.5%.
Table 8 summarizes the results of both work by integrating the frequency of delays and failures with their main causes, as described above.
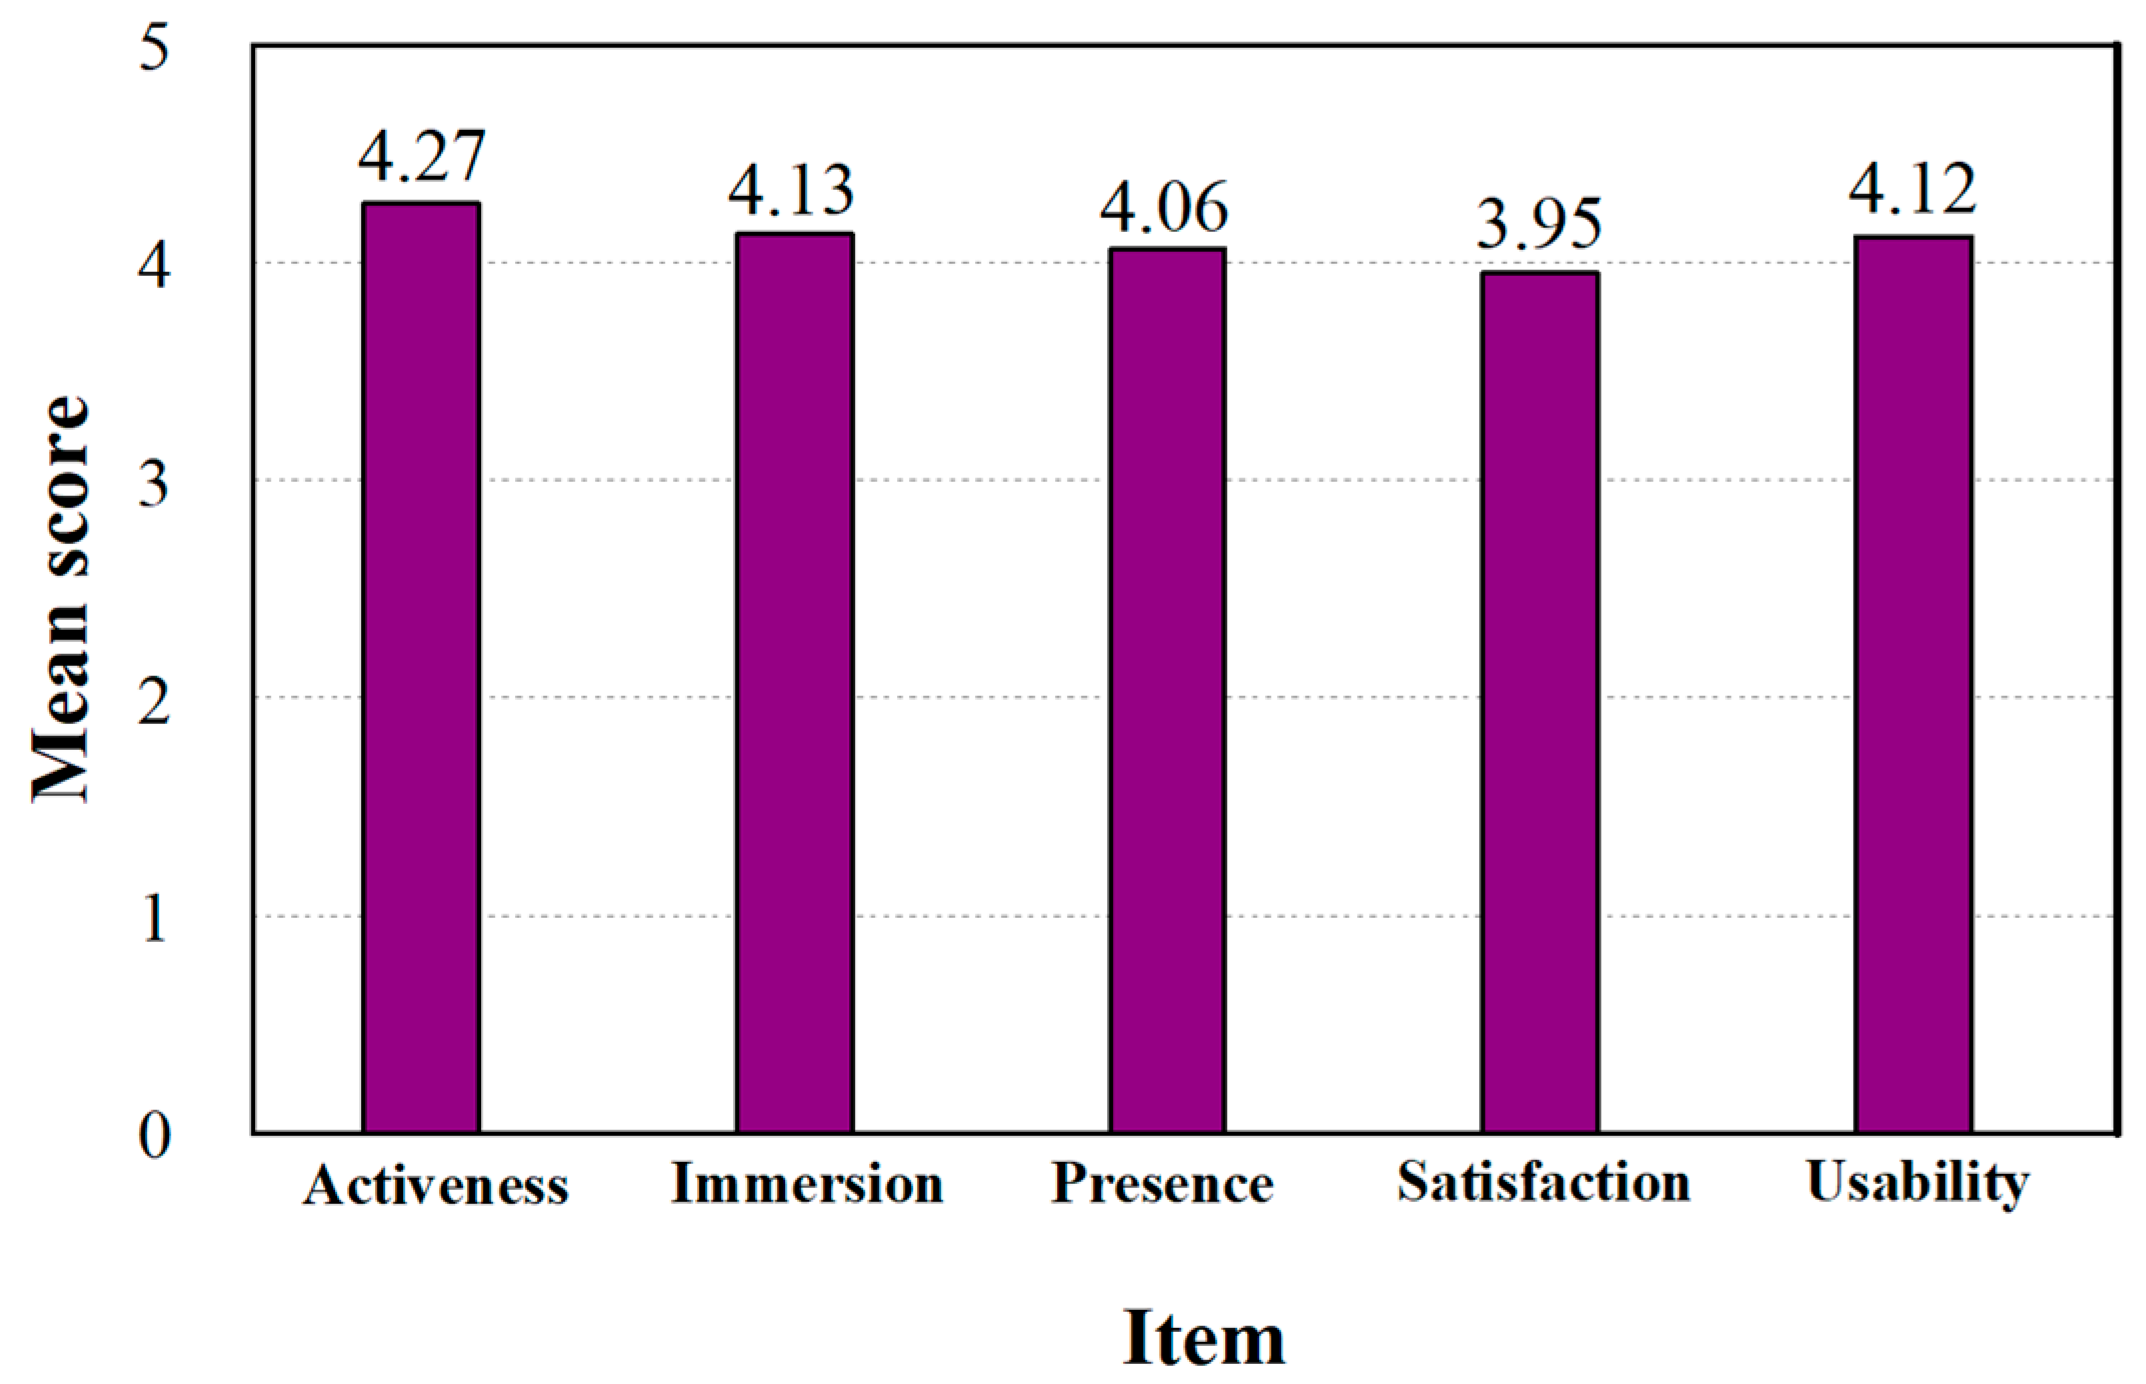
After completing the work, the participants were asked to respond to a post-survey regarding their experience. Figure 18 is a graph displaying the results of the five evaluation items. The score for the activeness item was the highest at 4.27. This is because the menu was structured systematically and consistently by repeatedly utilizing a standardized user interface for each purpose according to the use of the IGPI algorithm. The score for the immersion item was the second highest at 4.13. This is because, by using the MWI algorithm, it increased the proficiency in using specialized equipment through interactions between users and mechanical measurement work, thereby enhancing the accuracy of measurement work and maximizing training effectiveness. For the satisfaction item, the score was 3.95, which was the lowest among the five items. This is because the participants felt uncomfortable controlling the position, size, and rotation of the model simultaneously, as they were not familiar with touch gestures. The scores for the other items were relatively high: presence (4.06) and usability (4.12).
One-way ANOVA is a commonly used statistical test for comparing the means of three or more groups [40]. The results are considered statistically significant when the assumptions of normality, homoscedasticity, and independence are met [41]. A one-way ANOVA was performed to assess whether the survey results from four different age groups were statistically significant. The reliability of each evaluation subscales was estimated using Cronbach’s alpha, which measures the degree of consistency between items [42,43]. Cronbach’s alpha values for the five subscales were as follows: Activeness (0.88), Immersion (0.82), Presence (0.85), Satisfaction (0.84), and Usability (0.86). The average reliability of these subscales was 0.85, which was higher than the reliability reported in similar studies [44,45]. Additionally, the normality of the data was confirmed using the Shapiro–Wilk test, which is highly effective for small sample sizes. As a result, the significance levels were 0.67, 0.33, 0.34, and 0.10, all of which were greater than 0.05, indicating that the data followed a normal distribution. The Levene test, one of the most commonly used methods for comparing the means of two or more groups, was employed to test for homogeneity of variances. The significance level was 0.624, which is greater than 0.05, confirming that the assumption of equal variances was met. Based on the above results, all the basic assumptions for a one-way ANOVA were satisfied. The null hypothesis for the one-way ANOVA conducted based on the result data was assumed to be, “the means of the four groups are all equal,” while the alternative hypothesis was assumed to be, “the means of the four groups are not all equal”. Table 9 shows the results of the one-way ANOVA. The degrees of freedom between groups are 3, the degrees of freedom within groups are 36, and the F-value of the variance ratio is 3.839. Also, since the significance level is 0.018, which is less than 0.05, the alternative hypothesis that “the means of the four groups are not all the same” is established. Therefore, it can be confirmed that there are differences in post-survey scores among the groups.
However, the results of the one-way ANOVA do not allow for a comparison of which independent variable has a higher or lower mean. To accurately identify the differences in means between groups, Tukey’s post hoc test, which is used when the group sizes are equal, was conducted. Table 10 shows the results of the post hoc test. When comparing the four groups, the significance levels were all less than 0.05, indicating that the difference in the average scores was statistically significant. The differences between groups were the largest between the 20 s and 40 s groups at 0.34, while the smallest difference was observed between the 20 s and 30 s groups at 0.08 points. Therefore, the developed digital content was found to be more effective for younger age groups. This is because younger participants are relatively more familiar with AR technology due to greater exposure and tend to acquire it more quickly. Therefore, this content would be highly effective if used for the education of new employees or individuals transitioning to new roles.
Through the results of user experience evaluation, the research team identified four problems, as presented in Table 11. Because some of the animations were short in duration, participants learned by repeating the animations several times. They attempted to learn about the maintenance process from different perspectives by rotating the model. However, they encountered significant inconvenience as the animation ended abruptly during their learning process. Therefore, it is necessary to adjust the duration and speed of the animation through repeated experiments targeting beginners who have no experience in axle box maintenance. Participants had difficulty understanding some of the terms presented. These terms are technical jargon specific to the railway industry, making them unfamiliar and, in some scenes, resulting in a delay in work performance. Therefore, to enhance learning efficiency, it is necessary to replace it with 3D text that has thickness and shadow, and to clearly present the details of the maintenance process. The interaction with the model was not stable in many cases. In some cases, the model rotated in the opposite direction because it misrecognized the slight movement of the finger. The button was not pressed because the finger touch was not recognized, and so on. To enhance this, it is necessary to create a tutorial that adequately teaches touch gestures prior to commencing training and to improve touch sensitivity.

4. Conclusions

The developed digital educational content for railway vehicle maintenance successfully guided novice users in performing complex axle box maintenance, thereby demonstrating the potential of AR as a digital educational tool for safety-critical maintenance work. By capturing expert know-how and embedding it into digital content, this approach addressed long-standing limitations of traditional manuals and provided a more effective pathway for knowledge transfer.
User evaluation with forty participants confirmed high work success rates (mean: 62.5%) and positive perceptions of usefulness (mean survey score: 4.11). Statistical analysis further revealed a statistically significant difference based on age, showing that younger participants benefited more strongly from the AR-based training. This underscores the educational relevance of digital content for a generation of technicians already familiar with digital environments. Statistical validation, which emerged as a key strength of the evaluation, reinforces the robustness of the findings and underpins the pedagogical contribution of this study.
Beyond visualization, the study’s primary contribution lies in proposing a scalable methodology for digitalizing complex maintenance training. Techniques such as efficient interface generation and measurement-based interaction exemplify how AR can enhance both accuracy and efficiency, supporting the broader methodological contribution of this work.
Looking ahead, future research will extend this work in several directions. Integrating hands-free wearable devices, such as the Meta Quest 3, will enable immersive and ergonomically realistic training experiences. Advanced computer vision for object and pose tracking will allow context-aware guidance and error prevention. More importantly, longitudinal field studies across multiple depots will be conducted to evaluate safety outcomes, cost-effectiveness, and long-term learning retention, ensuring that the proposed methodology is both pedagogically robust and industrially viable. To address the limitations of the current study, we will investigate a headset-based approach, utilizing head tracking and hand gestures to resolve the model interaction challenges identified in the user evaluation and provide more intuitive and ergonomic training experiences. Furthermore, by analyzing different maintenance operations and textbooks, the “completeness” of the four UI frame types will be further validated and extended to support a broader range of complex procedures, such as parts replacement, thereby establishing AR’s role as a modern and practical framework for railway maintenance training.
In sum, this study demonstrates that AR-based training not only enables novices to perform complex maintenance work with measurable success, but also establishes a foundation for a scalable, empirically validated, and future-ready approach to industrial training.

Author Contributions

Conceptualization, H.-J.K. and C.-S.K.; validation, K.-S.K. and J.-H.S.; writing—original draft preparation, H.-J.K., J.-H.S. and C.-S.K.; writing—review and editing, K.-S.K. and C.-S.K.; visualization, J.-H.S. and C.-S.K.; project administration, C.-S.K. All authors have read and agreed to the published version of the manuscript.

Funding

This research was supported by the Korea National University of Transportation Industry–Academy Cooperation Foundation in 2025.

Institutional Review Board Statement

All study procedures were approved by the Korea National University of Transportation Institutional Review Board (KNUT IRB-HR-09-12), approval date 2 August 2024.

Informed Consent Statement

Informed written consent was obtained from the participants.

Conflicts of Interest

Author Hwi-Jin Kwon was employed by Seoul Metro. The remaining authors declare that the research was conducted in the absence of any commercial or financial relationships that could be construed as a potential conflict of interest.

References

  1. Park, K.J. A Study for the Development of the Reliability/Availability Management System of the Urban Transit Vehicles (I). J. Korean Soc. Railw 2023, 16, 163–168. [Google Scholar] [CrossRef]
  2. Kwon, H.J.; Lee, S.I.; Park, J.H.; Kim, C.S. Design of Augmented Reality Training Content for Railway Vehicle Maintenance Focusing on the Axle-Mounted Disc Brake System. Appl. Sci. 2021, 11, 9090. [Google Scholar] [CrossRef]
  3. Kwon, H.J.; Cha, J.H.; Park, Y.K.; Kim, C.S. A Study on the Realistic Content for Air Compressor Maintenance of the Ur-ban Railway Vehicle. J. Korean Soc. Urban Railw 2022, 10, 1231–1238. [Google Scholar] [CrossRef]
  4. Kang, G.H.; Cha, H.J.; Chung, I.S.; Kim, C.S. A Study on the Development of Augmented Reality Contents for Air Compressor of Railway Vehicles. In Proceedings of the 2023 Prognostics and Health Management Conference (PHM), Paris, France, 31 May–2 June 2023; pp. 59–63. [Google Scholar] [CrossRef]
  5. Amo, I.D.; Erkoyunci, J.A.; Roy, R.; Palmarini, R.; Onoufriou, D. A systematic review of Augmented Reality content-related techniques for knowledge transfer in maintenance applications. Comput. Ind. 2018, 103, 47–71. [Google Scholar] [CrossRef]
  6. Simon, J.; Gogolak, L.; Sarosi, J.; Fürstner, I. Augmented Reality Based Distant Maintenance Approach. Actuators 2023, 12, 302. [Google Scholar] [CrossRef]
  7. Malta, A.; Farinha, T.; Mendes, M. Augmented reality in maintenance—History and perspectives. J. Imaging 2023, 9, 142. [Google Scholar] [CrossRef]
  8. Zhu, J.; Ong, S.K.; Nee, A.Y.C. An authorable context-aware augmented reality system to assist the maintenance technicians. Int. J. Adv. Manuf. Technol. 2013, 66, 1699–1714. [Google Scholar] [CrossRef]
  9. Mourtzis, D.; Siatras, V.; Angelopoulos, J. Real-Time Remote Maintenance Support Based on Augmented Reality (AR). Appl. Sci. 2020, 10, 1855. [Google Scholar] [CrossRef]
  10. Bodhwani, K.; Sharma, A. The Future of Augmented Reality: Emerging Trends and Challenges. Landscape 2023, 4, 63. [Google Scholar] [CrossRef]
  11. Peng, C.C.; Chang, A.C.; Chu, Y.L. Application of augmented reality for aviation equipment inspection and maintenance training. In Proceedings of the 2022 8th International Conference on Applied System Innovation (ICASI), Nantou, Taiwan, 22–23 April 2022; pp. 58–63. [Google Scholar] [CrossRef]
  12. Song, J.W. Augmented Reality (AR) and Virtual Reality (VR) Based Plant Work Support Technology for Smart Work Environment. Masters’s Thesis, University of Sungkyunkwan, Seoul, Republic of Korea, 2021. Available online: https://dcollection.skku.edu/srch/srchDetail/000000162059 (accessed on 13 September 2025).
  13. Borro, D.; Suescun, A.; Brazalez, A.; González, J.M.; Ortega, E.; González, E. WARM: Wearable AR and tablet-based assistant systems for bus maintenance. Appl. Sci. 2021, 11, 1443. [Google Scholar] [CrossRef]
  14. Lee, W.H.; Lee, K.H.; Lee, J.J.; Nam, B.W. A Study on Pipe Model Registration for Augmented Reality Based O&M Environment Improving. J. Comput. Struct. Eng. Inst. Korea 2019, 32, 191–197. [Google Scholar] [CrossRef]
  15. Lim, H.Y.; Ro, K.H. A Study on a CMS Platform for AR-based Remote Collaboration in a Smart Factory. J. Digit. Converg. 2018, 16, 327–334. [Google Scholar] [CrossRef]
  16. Jung, W. Application of Location-Based Augmented Reality to Support Operation and Maintenance in Indoor Environment of Power Plant. Bachelor’s Thesis, University of Inha, Incheon, Republic of Korea, 2020. Available online: http://inha.dcollection.net/common/orgView/200000288305 (accessed on 13 September 2025).
  17. Bulkova, Z. Possibilities of Implementing Augmented Reality in Railway Freight Transport. Transp. Tech. Technol. 2023, 19, 1–7. [Google Scholar] [CrossRef]
  18. Scheffer, S.; Martinetti, A.; Damgrave, R.; Thiede, S.; van Dongen, L. How to make augmented reality a tool for railway maintenance operations: Operator 4.0 perspective. Appl. Sci. 2021, 11, 2656. [Google Scholar] [CrossRef]
  19. Jeon, H.I.; Yu, Y.S.; Ko, B.J.; Kim, S.; Koo, B. Augmented Reality-based safety inspection framework for safety management in railway bridge and tunnel projects. J. Korean Soc. Railw 2021, 24, 590–607. [Google Scholar] [CrossRef]
  20. Kostolani, M.; Murin, J.; Kozak, S. Intelligent predictive maintenance control using augmented reality. In Proceedings of the 2019 22nd International Conference on Process Control (PC19), Strbske Pleso, Slovakia, 11–14 June 2019; pp. 58–63. [Google Scholar] [CrossRef]
  21. Garcia, C.; Ortega, M.; Ivorra, E.; Contero, M.; Mora, P.; Alcañiz, M.L. Holorailway: An augmented reality system to support assembly operations in the railway industry. Adv. Manuf. 2024, 12, 764–783. [Google Scholar] [CrossRef]
  22. Kim, K.S.; Kim, C.S. Development and Usability Evaluation of Augmented Reality Content for Light Maintenance Training of Air Spring for Electric Multiple Unit. Appl. Sci. 2024, 14, 7702. [Google Scholar] [CrossRef]
  23. Syed, T.A.; Siddiqui, M.S.; Abdullah, H.B.; Jan, S.; Namoun, A.; Alzahrani, A.; Nadeem, A.; Alkhodre, A.B. In-Depth Re-view of Augmented Reality: Tracking Technologies, Development Tools, AR Displays, Collaborative AR, and Security Concerns. Robot. Appl. Sci. 2022, 23, 146. [Google Scholar] [CrossRef]
  24. Chatzopoulos, D.; Bermejo, C.; Huang, Z.; Hui, P. Mobile Augmented Reality Survey: From Where We Are to Where We Go. IEEE Access 2017, 23, 6917–6950. [Google Scholar] [CrossRef]
  25. Kwon, H.J.; Kim, K.S.; Kim, C.S. Development and Evaluation of Augmented Reality Learning Content for Pneumatic Flow: Case Study on Brake Operating Unit. IEEE Access 2023, 11, 46173–46184. [Google Scholar] [CrossRef]
  26. Cao, J.; Lam, K.Y.; Lee, L.H.; Liu, X.; Hui, P.; Su, X. Mobile Augmented Reality: User Interfaces, Frameworks, and Intelligence. Acm. Comput. Surv. 2023, 55, 1–36. [Google Scholar] [CrossRef]
  27. Su, X.; Cao, J. 5G edge enhanced mobile augmented reality. In Proceedings of the 26th Annual International Conference on Mobile Computing and Networking, London, UK, 21–25 September 2020; pp. 1–3. [Google Scholar] [CrossRef]
  28. Kim, J.Y.; Sung, J.H. Structuralization of User Flow System in the Mobile Augmented Reality-Focused on Mobile and Spatial characteristics. J. Korean Basic Art 2011, 12, 139–147. Available online: http://scholarworks.bwise.kr/ssu/handle/2018.sw.ssu/13807 (accessed on 13 September 2025).
  29. Song, J.H.; Han, K.Y. Development of Digital Content for Electric Multiple Unit Maintenance: A Case Study on the Semi-Permanent Coupler. J. Digi Conten. Soc. 2024, 25, 3431–3440. [Google Scholar] [CrossRef]
  30. Baek, J.H.; Yoon, S.H.; Um, B.K.; Han, S.B.; Um, D.J. Study on the Institutionalization for Rolling Stock Maintenance Engineer and Maintenance Organization Certification. In Proceedings of the 2018 Spring Conference of the Korean Society for Railway, Jeju, Republic of Korea, 16–18 May 2018; pp. 421–422. Available online: https://www.dbpia.co.kr/journal/articleDetail?nodeId=NODE07455000&language=ko_KR&hasTopBanner=true&language=ko_KR&hasTopBanner=true (accessed on 13 September 2025).
  31. You, J.W.; Park, K.H. A case study on user experience evaluation of a virtual reality training content for advanced metering infrastructure. J. Educ. Inf. Media 2018, 24, 779–803. [Google Scholar] [CrossRef]
  32. Palmarini, R.; Erkoyuncu, J.A.; Roy, R.; Torabmostaedi, H. A systematic review of augmented reality applications in maintenance. Robot. Comput. Integr. Manuf. 2018, 49, 215–228. [Google Scholar] [CrossRef]
  33. Dirin, A.; Laine, T.H. User Experience in Mobile Augmented Reality: Emotions, Challenges, Opportunities and Best Practices. Computers 2018, 7, 33. [Google Scholar] [CrossRef]
  34. Valentini, L.; Grandi, F.; Peruzzini, M.; Pellicciari, M. UX-Driven Methodology to Design Usable Augmented Reality Applications for Maintenance. In Leveraging Transdisciplinary Engineering in a Changing and Connected World; IOS Press: Amsterdam, The Netherlands, 2023; pp. 42–51. [Google Scholar] [CrossRef]
  35. Shin, J.M.; Lee, S.H.; Yoo, J.E.; Roh, C.; Oh, J.A.; Kim, S.Y. Development and Evaluation of a Virtual Maintenance Training System for Thermal Power Plant Boiler. J. Digi Conten. Soc. 2021, 22, 791–800. [Google Scholar] [CrossRef]
  36. Jebb, A.T.; Ng, V.; Tay, L. A review of key Likert scale development advances: 1995–2019. Front. Psychol. 2021, 12, 637547. [Google Scholar] [CrossRef]
  37. Norman, G. Likert scales, levels of measurement and the “laws” of statistics. Adv. Health Sci. Educ. 2010, 15, 625–632. [Google Scholar] [CrossRef]
  38. Finstad, K. Response interpolation and scale sensitivity: Evidence against 5-point scales. J. Usability Stud. 2010, 5, 104–110. [Google Scholar]
  39. Ahn, S.H.; Yoo, E.Y.; Lee, S.H. A Validation Study of the Gross Motor Scale of Korean Version of Bayley Scales of Infant and Toddler Development. J. Korean Soc. Occup. Therap. 2018, 26, 81–97. [Google Scholar] [CrossRef]
  40. Kang, S.H. The Effects of Empowerment on Accountability. Bachelor’s Thesis, University of Seoul, Seoul, Republic of Korea, 2014. Available online: https://hdl.handle.net/10371/130416 (accessed on 13 September 2025).
  41. Oh, J.H.; Lee, J.I.; Karadeniz, F.; Kim, H.R.; Park, S.Y.; Jung, K.I.; Jeon, B.-J.; Kim, D.; Park, J.H.; Kong, C.-S. Quality characteristics of grilled fish paste formulation added with hot water extract powder from Lentinus edodes using one-way ANOVA. J. Korean Soc. Food Sci. Nutr. 2015, 50, 307–314. [Google Scholar] [CrossRef]
  42. Tavakol, M.; Dennick, R. Making sense of Cronbach’s alpha. Int. J. Med. Educ. 2011, 2, 53–55. [Google Scholar] [CrossRef] [PubMed]
  43. Boenett, D.G.; Wright, T.A. Cronbach’s alpha reliability: Interval estimation, hypothesis testing, and sample size planning. J. Organ. Behav. 2015, 36, 3–15. [Google Scholar] [CrossRef]
  44. Bressler, D.M.; Bodzin, A.M. A mixed methods assessment of students’ flow experiences during a mobile augmented reality science game. J. Comput. Assist. Learn. 2013, 29, 505–517. [Google Scholar] [CrossRef]
  45. Oleksy, T.; Wunk, A. Augmented places: An impact of embodied historical experience on attitudes towards places. Comput. Hum. Behav. 2016, 57, 11–16. [Google Scholar] [CrossRef]
Figure 1. Methodology for digitalizing railway vehicle maintenance training.
Informatics 12 00101 g001
Figure 2. Axle box.
Figure 2. Axle box.
Informatics 12 00101 g002
Figure 3. Three-dimensional modeling process of axle box.
Informatics 12 00101 g003
Figure 4. Top-down mapping of essential information on axle box maintenance.
Informatics 12 00101 g004
Figure 5. AR content storyboard: (a) example of scenario; (b) example of animation.
Informatics 12 00101 g005
Figure 6. Logical flow of the implementation process.
Informatics 12 00101 g006
Figure 7. Visual implementation of digital content on a mobile device.
Informatics 12 00101 g007
Figure 8. Flowchart of the IGPI algorithm.
Informatics 12 00101 g008
Figure 9. The user interface implemented using IGPI algorithm.
Informatics 12 00101 g009
Figure 10. Flowchart of the MWI algorithm.
Informatics 12 00101 g010
Figure 11. Actual photos and descriptions of bearing damage and grease leakage.
Informatics 12 00101 g011
Figure 12. Exploded view of the axle box and a cross-section of the ball bearing.
Informatics 12 00101 g012
Figure 13. Equipment usage and detailed inspection: (a) ‘Next’ button click; (b) quiz pop-up window.
Informatics 12 00101 g013
Figure 14. Maintenance parts: (a) bolt fastening inspection process; (b) shaft height dimension checking process.
Informatics 12 00101 g014
Figure 15. Examples implemented through the MWI algorithm: (a) touchpad; (b) animation when the tolerance is exceeded or falls below the tolerance.
Informatics 12 00101 g015
Figure 16. The overall evaluation schema.
Informatics 12 00101 g016
Figure 17. Participants performing the work: (a) tightening the bolt with a torque wrench; (b) switching the lever of jack.
Informatics 12 00101 g017
Figure 18. The result graph of the five evaluation subscales.
Informatics 12 00101 g018
Table 1. Analysis results of AR research cases in the maintenance field.
FieldFeaturesUsability VerificationConclusions
Aerospace industry [11]Visualizes standard maintenance process and provides them through simulations-Reduce maintenance process search time and human error rates
Plant industry [12]Provides plant operation performance instructions and related videos based on ARCompare maintenance execution times between two groupsImprove work efficiency and information accessibility
Automotive industry [13]Detects vehicles and automatically provides necessary maintenance informationPerformance comparison with existing booklet-type manuals based on the execution of four maintenance workImprove work efficiency and performance speed
Shipbuilding industry [14]Provides accurate AR-based model alignment for seamless object detectionEvaluate accuracy and execution time divided into three stagesProvides seamless augmented information and demonstrates validity
Smart factory industry [15]Providing AR-based information through remote collaboration in real time with smart factory systems-Reduce maintenance time and costs for machinery and equipment
Thermal power plant industry [16]Recognize power plant components, visualize and provide related informationField experiments conducted in four stagesReduce misoperations and human errors while increasing work efficiency
Railway industryProposes a systematic methodology for digitalizing maintenance training and a modular algorithm for precision measurement work, which was previously unaddressedFormative evaluation and a post-survey with 40 participantsEnhances the accuracy of precision measurement work and reduces error rates
Table 2. Analysis results of AR research cases in the railway field.
FieldFeaturesUsability VerificationConclusions
Railway operation industry [17]Provides AR-based automatic train recognition, transportation inspection, and technical inspection processesComparison of inspection times divided into two processesReduces inspection time and decreases error occurrences rates
Railway maintenance industry [18]Provides maintenance instructions and related information through voice and visual interaction functionsAnalyzes cases through interviews with expertsProvides real-time feedback and enhances technical capabilities
Railway safety inspection industry [19]Provides remote inspection and indoor precision inspection processes using AR technology-Increases inspection continuity and enables management of inspection history
Railway manufacturing industry [20]Visualize sensor status monitoring values and provides the maintenance process in real time-Improves maintenance quality and fault prediction accuracy
Railway assembly industry [21]Provides real-time assembly information using SLAM technology and marker-based algorithmsEvaluate user experience by dividing into two groupsReduces assembly time, decreases error rates, and improves usability
Railway maintenance industryFocuses on complex procedures and supplements existing manuals with maintenance know-how from railway technicians.A user experience evaluation was conducted with 40 railway vehicle maintenance staff, divided into four age-based groups.Addresses research gaps by providing a methodology for complex maintenance procedures and conducting comprehensive usability verification.
Table 3. The IGPI algorithm UI frame types.
TypePrimary Use CaseConstituent ElementsExample Content
1Simple Information DisplayTitle Text, Detail TextGeneral Details, Precautions
2Visual InformationTitle Text, Detail Text, Image Component Details
3User Action/FeedbackTitle Text, Detail Text, Image, Button Button for Step Progression
4Complex InteractionTitle Text, Detail Text, Image, Button, Selections Quizzes, Scenario-Based Choices
Table 4. The composition of the post-survey.
SubscaleItem
ActivenessWhile using the educational content, I was able to learn how to use it and proceed with the training smoothly without the help of others.
While using the educational content, I was able to actively learn by selecting each desired item.
It was possible to learn all the items without missing any parts by identifying the entire progression scenario and evaluating the items of the educational content.
ImmersionWhile using the educational content, I found that irrelevant thoughts and distractions unrelated to learning were blocked, allowing me to fully engage in the educational process.
While using the educational content, I was able to focus on the change in perspective based on the model’s movement, and I found it enjoyable and interesting.
While using the educational content, it was possible to achieve an optimal learning experience through natural interaction, without any sense of heterogeneity or external interference.
PresenceWhile using the educational content, I was able to experience the actual maintenance work.
While using the educational content, I desired to follow the maintenance process directly using my body.
While using the educational content, I wanted to learn by using real objects in the field workplace.
SatisfactionThe learning items of the educational content were not difficult, and the necessary information and skills were properly and harmoniously organized.
While using the educational content, it was possible to freely manipulate the model and UI, and switch screens through touch gestures.
The entire composition of the educational content is designed to be easily comprehensible, and the work processes are implemented as animations for easy understanding.
UsabilityThe movements of the models in AR were natural and uninterrupted.
The graphics in the educational content were designed to maintain a consistent visual style throughout.
When using the educational content, the content system responded quickly to the learner’s intentions and actions.
Table 5. Demographic characteristics of the participants.
Characteristics20 s30 s40 sTotal
Participants (N)10101010
GenderMale (7)Female (3)Male (8)Female (2)Male (9)Female (1)Male (9)Female (1)
Prior ExperienceNone
Table 6. The evaluation of the first work.
Work 1Action 1Action 2Action 3Action 4Action 5
Success2533362334
Delay943123
Failure63153
Mean time2 min 38 s1 min 8 s51 s3 min 12 s49 s
Table 7. The evaluation of the second work.
Work 2Action 1Action 2Action 3Action 4
Success31273635
Delay4824
Failure5521
Mean time1 min 21 s2 min 43 s57 s1 min 2 s
Table 8. Evaluation results of work 1 and work 2 with success, delay, failure, and main causes.
Work Action Delay/Failure Frequency Main Cause of Delay/Failure
Work 119 delays6 failuresAnimation duration too short
24 delays3 failuresStep-by-step animation (minor delay)
33 delays1 failureStep-by-step animation (minor delay)
412 delays5 failuresClick sound provided only in text
53 delays3 failuresQuiz pop-up supported learning (minor delay)
Work 214 delays5 failuresPosition indicators generally clear (minor delay)
28 delays5 failuresRotation direction unclear and short animation
32 delays2 failures3D animation supported repetitive learning (minor delay)
44 delays1 failureLever guidance clear and well understood (minor delay)
Table 9. The results of the one-way ANOVA.
ClassificationSum of SquaresDegrees of FreedomMean SquareF
(Variance Ratio)
Significance Probability
Between group0.65930.2203.8390.018
Within group2.060360.057--
Total2.71939---
Table 10. The results of the post hoc test.
ClassificationMean
Difference
Mean
Error
Significance
Probability
95% Confidence
LowerUpper
10 s20 s0.080.106980.877−0.20810.3681
30 s0.20.259−0.08810.4881
40 s0.340.0150.05190.6281
20 s10 s−0.08−0.877−0.36810.2081
30 s0.120.679−0.16810.4081
40 s0.260.089−0.02810.5481
30 s10 s−0.20.259−0.48810.0881
20 s−0.120.679−0.40810.1681
40 s0.140.564−0.14810.4281
40 s10 s−0.34−0.015−0.6281−0.0519
20 s−0.260.089−0.54810.0281
30 s−0.140.564−0.42810.1481
Table 11. Problems derived from user experience evaluation results.
ProblemDetails
Animation durationDifficult to understand due to the short animation duration
Explanation of termsDifficult to understand because there is no additional explanation of technical terminology in the railway vehicle field
TextLack of realism due to 2D-based text and lack of detailed explanation
Touch gestureInteraction is not smooth when simultaneously controlling the position, size, and rotation of the model
Disclaimer/Publisher’s Note: The statements, opinions and data contained in all publications are solely those of the individual author(s) and contributor(s) and not of MDPI and/or the editor(s). MDPI and/or the editor(s) disclaim responsibility for any injury to people or property resulting from any ideas, methods, instructions or products referred to in the content.