Article

A Flexible Profile-Based Recommender System for Discovering Cultural Activities in an Emerging Tourist Destination

by
Isabel Arregocés-Julio
1,2,*,
Andrés Solano-Barliza
2,
Aida Valls
3,
Antonio Moreno
3,
Marysol Castillo-Palacio
4,
Melisa Acosta-Coll
1,* and
José Escorcia-Gutierrez
1
1
Department of Computational Science and Electronic, Universidad de la Costa, CUC, Barranquilla 080002, Colombia
2
Faculty of Economic and Administrative Sciences, Faculty Engineering, Universidad de la Guajira, Riohacha 440001, Colombia
3
Departament d’Enginyeria Informàtica i Matemàtiques, Universitat Rovira i Virgili, Av. Països Catalans, 26, 43007 Tarragona, Spain
4
Facultad de Ciencias Económicas y Administrativas, Departamento de Mercadeo y Negocios, Pontificia Universidad Javeriana, Seccional Cali 760031, Colombia
*
Authors to whom correspondence should be addressed.
Informatics 2025, 12(3), 81; https://doi.org/10.3390/informatics12030081
Submission received: 18 June 2025 / Revised: 26 July 2025 / Accepted: 28 July 2025 / Published: 14 August 2025
(This article belongs to the Topic The Applications of Artificial Intelligence in Tourism)

Abstract

Recommendation systems applied to tourism are widely recognized for improving the visitor’s experience in tourist destinations, thanks to their ability to personalize the trip. This paper presents a hybrid approach that combines Machine Learning techniques with the Ordered Weighted Averaging (OWA) aggregation operator to achieve greater accuracy in user segmentation and generate personalized recommendations. The data were collected through a questionnaire applied to tourists in the different points of interest of the Special, Tourist and Cultural District of Riohacha. In the first stage, the K-means algorithm defines the segmentation of tourists based on their socio-demographic data and travel preferences. The second stage uses the OWA operator with a disjunctive policy to assign the most relevant cluster given the input data. This hybrid approach provides a recommendation mechanism for tourist destinations and their cultural heritage.

1. Introduction

The tourism sector has achieved an important position in the economy, consolidating the development of destinations worldwide. Technological advances such as artificial intelligence (AI) are increasingly contributing to the improvement of tourism services. The particular preferences of each tourist demand the development of customized solutions to improve the visitor experience [1]. In this context, many touristic destinations have built AI-based recommendation systems that are used by tourists to explore, know and learn about interesting points of interest, about suitable restaurants where to eat or about hotels to stay tourists [2,3]. This technological integration has been shown to significantly improve tourist’s satisfaction in the search of touristic facilities [4]. In addition, recommender systems have become valuable allies of cultural tourism. The World Tourism Organization (UNWTO) defines this type of tourism as all those activities in which people participate to satisfy specific cultural motivations through a set of tangible and intangible cultural attractions offered by the tourist destination [5]. It includes diverse activities such as shows, celebrations, festivals or local carnivals, visits to historical or commemorative sites, traveling to learn about nature, enjoying natural landscapes or local traditions, and making peregrinations [6].
The ability of a destination to make visible and promote its singular touristic products and services increases the possibility of building a competitive market and attracting new tourists [7]. This fact is specially recognized for emerging tourist destinations, which are places with many interesting points of interest but without (or with few) foreign visitors. In this paper, we will study in detail the case of Riohacha, in Colombia. This city was designated as “Special, Tourist and Cultural District of Riohacha” in 2015. It is located in the Guajira peninsula, in the Caribean coast, in the north of Colombia. Riohacha has many potential tourist attractions that include cultural elements of great relevance, a rich local gastronomy, traditional and folkloric aspects, outstanding handicrafts of the Wayuu ethnic group, and the renowned monument of The Palabrero, designated as intangible cultural heritage of humanity. Despite the region’s efforts to align itself with national strategies that seek to link cultural heritage to the tourism offer, the region is still attracting few tourists [8]. The availability of a personalized recommender system could help to promote such emerging destinations worldwide in order to attract new tourists to those regions. However, the use of some of the usual data analysis and AI-based recommendation techniques in such emerging tourist destinations may be a challenge, due to the scarcity of available structured data from previous visitors [9].

Goal and Contributions

This research presents a recommendation system in the field of cultural tourism to strengthen the promotion and attractiveness of emerging destinations by increasing the visibility and engagement of their touristic activities.
To address data limitations in emerging tourist destinations, this study proposes a recommender model based on only socio-demographic and trip characteristics of the visitors. The system uses the K-means clustering algorithm to identify relevant user profiles from a reduced number of visitors. Observing the activities done by these visitors, each user profile is associated with a set of preferred types of activities. When a new visitor connects to the system, the system makes uses flexible parametrized aggregation operators (i.e., OWA—Ordered Weighted Average) to assign the user to one of the profiles and retrieve the appropriate list of recommended activities for this person.
The contributions of this study in the development of a recommendation system can be summarized in three components: (1) the identification of profiles of tourists based on demographic data and trip characteristics, (2) the association of a new tourist with one of the profiles, which determines a personalized list of activities that match with this person’s characteristics, and (3) the construction of a recommender system for the District of Riohacha, which serves to validate the proposed methodology in a practical context.
The structure of the article is as follows: Section 2 describes the literature recommendation systems. Section 3 focuses on the proposed approach. Section 4 presents the experimental phase. Finally, Section 5 contains the conclusions and future work.

2. Literature Review

Technological advances in the tourism industry have evolved the traditional way of presenting information [10], adopting technologies such as artificial intelligence and recommender systems. In this field, there is a trend towards the use of machine learning algorithms to improve the capacity of recommender systems and provide relevant information to the tourist through a set of input data [11]. Existing literature suggests that personalization in recommender systems improves the user experience by adapting to user preferences and providing more accurate recommendations [12].
In addition, previous research has explored the development of recommender systems, determining that it is relevant for tourist destinations as it contributes to improving their competitiveness [13]. Recommendation systems applied to tourism are valuable tools for the industry, offering personalized suggestions for activities, routes, trips, and hotels through advanced collaborative filtering techniques [14], content-based filtering, and machine learning algorithms [15,16]. Collaborative filtering allows users’ historical interactions with products to uncover common preferences, while content-based filtering takes additional user data to analyze past behavior and current preferences to deliver products [17]. These systems focus on key activities in a destination, such as restaurants, attractions, events, tourist sites, museums, festivals, local activities tours, and guided activities.
In [18], it is highlighted that recommender systems work through techniques such as filtering and ranking data based on their similarities. To address the inherent limitations of data sparsity and cold start, the authors presented a hybrid recommender system whose model generated a user-product rating matrix. The matrix was used to identify clusters and served as input to apply association rules in product recommendation. Although the method succeeded in reducing dispersion, the accuracy of the system is limited. In this respect, [19] indicates that personalization of recommendations requires the use of user data such as reviews and contextual information. Using hybrid approaches that change filtering techniques in tourism activities optimizes the quality and quantity of recommendations presented to travelers, which in turn facilitates the decisions they make during their trip. To exploit that data, tourism recommendation systems have incorporated clustering algorithms, which facilitates user segmentation [20]. Their results show the identification of segments in the demand of visitors to the Bahrain Food Festival and the relationship of the segments with socio-demographic aspects.
Emerging destinations, as opposed to consolidated ones, need to be promoted according to their particular characteristics without relying on other visitors’ data. Since they are new destinations, the perception that tourists have of the destination can be biased, and this hampers the discovery of new attractions [21]. Therefore, the construction of recommender systems in such destinations must be made with a combination of the available information from visitors but also with on-site knowledge about the points of interest of the place.

3. Materials and Methods

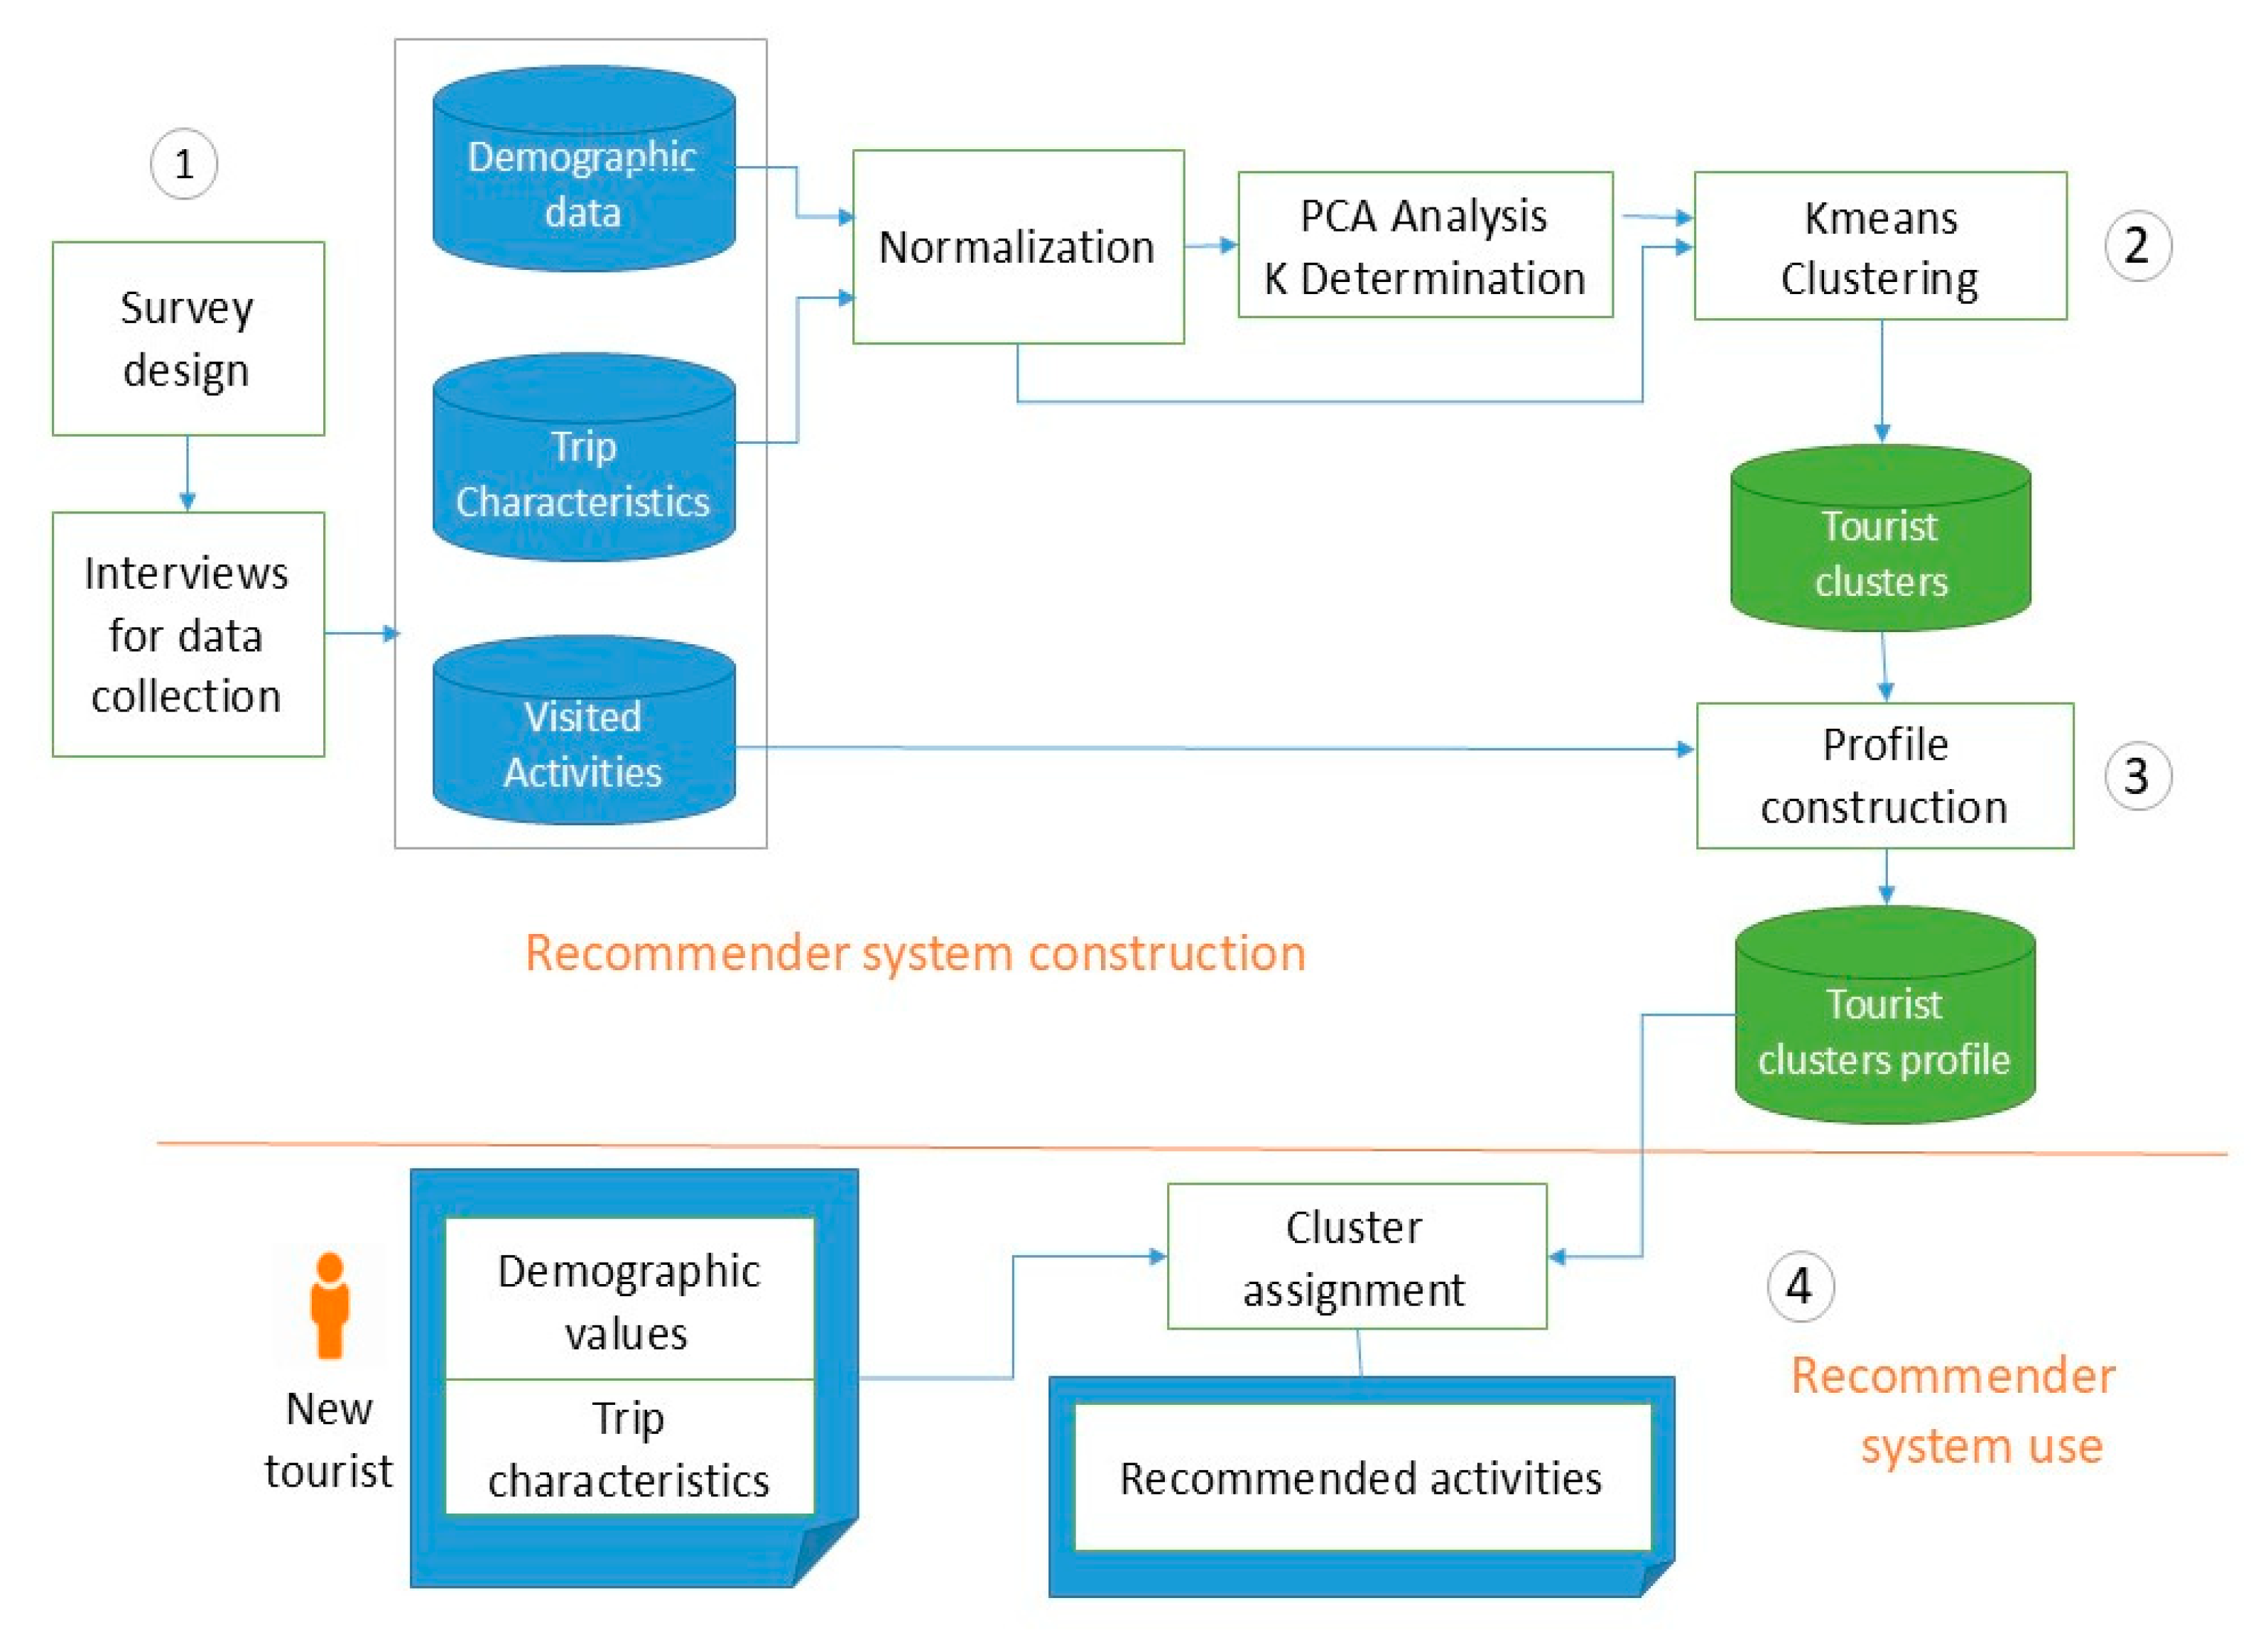
In this work, we have designed a methodology for building a recommendation system about touristic activities in an emerging tourist destination. The particular case of the Historic Center of the District of Riohacha will be used as a case study. Figure 1 displays the different techniques used in the process for building and using the recommender system. The recommendation will be based on the similarity of the new tourist with respect to some user profiles. These profiles are constructed in two steps from data collected in a survey conducted with some visitors to the city. Each of the steps is explained in the following sections.

3.1. Data Design and Collection

The first step of the process consists of generating a dataset of information about the visitors of the touristic destination of interest. As explained before, emerging destinations do not have this data available due to a lack of a consolidated touristic infrastructure, with touristic destination offices that are in charge of conducting surveys and studying the tourism behavior in their area. Therefore, the creation of an appropriate data collection instrument is required.
The review and analysis of the literature relevant to the design of the tourism recommender systems [22,23,24] provided sufficient and necessary information to identify the most relevant questions on sociodemographic characteristics and travel preferences indicators. A list of questions was designed for Riohacha District. The validation of the instrument was carried out with the help of a panel of experts in the field. They analyzed the questions in order to optimize the questionnaire in terms of the type, quality, and quantity of data to be collected, in order to obtain a sufficient sample for the design of the proposed recommendation system. In addition, a pre-test or pilot test was carried out, which allowed us to fine-tune not only the wording and semantics but also the text of the questions, so that it would be correctly understood by the respondents and fully in line with the requirements of the data needed for the recommender system. The sociodemographic data collected through the questionnaire are presented in Table 1, detailing the distribution of the participants according to the categories established: age, sex, level of education, and occupation.
The questionnaire includes four sociodemographic variables: age, sex, level of education, and occupation. For the occupation variable, the United Nations Classification of Economic Activities adapted for Colombia was used [25]. The data presented in Table 2 correspond to the trip characteristics. Five questions were asked to identify the following: (1) average number of places of cultural interest visited during the stay; (2) time spent visiting the city; (3) with whom they travel; (4) points of cultural interest to visit in the District of Riohacha presented to respondents through a list of options that included the different types of cultural attractions in the Historic Center of the District of Riohacha, such as monuments, paintings, historical sites, urban heritage, folkloric events, among others; and (5) time of visit.
The fieldwork was carried out in the historic center of the city, and participants were selected asynchronously. Printed and online questionnaires were used to collect the information. Answers were properly transferred to a computer system, and they were revised and curated. The sample collected corresponds to 393 tourists who visited the Historic Center of the District of Riohacha during the vacation season between June, July, and August in 2022. As a result of random non-probabilistic sampling and based on the accessibility and proximity of the object of study, the sample size was determined considering a statistically infinite population.

3.2. Data Pre-Processing

As seen in Table 1 and Table 2, the questionnaire had only two numerical questions (age and number of sites visited, V1 and V5), while the rest were open-ended categorical, with different numbers of categories (from 2 to 13). Before applying any clustering algorithm, the data were binarized. A one-hot encoding procedure was applied to single-answer questions: V2, V4, and V6. For the questions V7, V8 and V9, which allowed multiple answers, each of the selected categories is coded as “1”, and “0” for the non-selected. Finally, in question V3, which corresponds to the level of education, the following coding was applied (Table 3):

3.3. Grouping Tourists in Clusters

The recommender system proposed is based on identifying differentiated profiles of visitors with different interests, who should receive different recommendations about the activities and places to visit. As there is no prior study of the typology of the visitors in emerging destinations (as is the case in Riohacha District), we can rely on the use of data mining techniques, such as unsupervised clustering algorithms, to automatically discover groups of similar tourists.
Unsupervised clustering techniques include several algorithms, based on distances, densities, neural networks, or others [26]. Considering the limited amount of data that can be obtained in emerging destinations, a good performing method is the K-means algorithm. The next subsection explains in detail how it has been used in the case study of the city of Riohacha.

3.3.1. Building Clusters with K-Means

The K-means clustering algorithm consists of segmenting the data in a multidimensional space into k distinct and disjoint groupings or clusters of objects. To this end, it starts by specifying an initial number k of clusters, and each object will be assigned to a single cluster [27]. K-means clustering minimizes within-cluster variances. The algorithm starts with k seed objects, randomly selected from the dataset. At each iteration, a new object is taken and assigned to the closest cluster.
Similarity between objects is usually calculated with the Euclidean distance measure d. Having a set of objects ( x 1 , x 2 , , x N ) and k clusters g i with centroids   ( c 1 , c 2 , , c k ) , we can formulate the objective function of K-means as the minimization of the following objective function:
J = i = 1 N j = 1 k r i j d ( x i c j )  
where
r i j = 1 i f x i     c l u s t e r   j 0   i f x i c l u s t e r   j
At each iteration, we update the centroid c j of the j-th cluster, the one that receives a new object, by using the following equation:
c j = i = 1 N r i j x i i = 1 N r i j
The K-means unsupervised machine learning algorithm requires that the value of k is to say the number of clusters. To determine the optimal value of k, several quality measures can be used, with these being the most popular: Elbow, Silhouette, and Davis Bouldin, which are defined below. When these measures are not able to identify the appropriate value of k, we can explore an alternative space with linearly uncorrelated dimensions. The Principal Components Analysis (PCA) technique permits the construction of such a new space with a reduced number of orthogonal dimensions. The new space captures the largest variation in the data with less dimensions. Applying the K-means algorithm to this reduced and uncorrelated space may help to discover the best number of clusters, as it will be shown in the case study.

3.3.2. Clustering Validation Measures

The Elbow method [28] and Silhouette [29] and Davies–Bouldin [30] evaluation measures are designed to quantify the quality of a partition generated with an automatic clustering algorithm. Each of these measures provides a different perspective on clustering quality and can help make informed decisions about the appropriate number of clusters. First, the Elbow method is a visual inspection technique that displays for different number of clusters, k, the Within-Cluster Sum of Squares (WCSS), which is the sum of the squares of the distances from each data to the centroid of the respective cluster [31] and corresponds to the objective function presented in Equation (1). The point where an increase in K is not longer leads to a decrease of WCSS is called the “elbow,” and it determines the best value for k. Secondly, some numerical indicators have been defined to assess the quality of a cluster. Within each cluster, there may be a certain dispersion, which implies that the distances between points within a cluster, or the distance to its centroid, may vary significantly between clusters. The “cluster silhouette” is defined in terms of the homogeneity of these intra-cluster distances, Equation (3), which measures of how similar a data point is to its own cluster, i.e., its “cohesion” compared to other clusters [32,33,34,35]. To calculate the silhouette of a data point i of a cluster, we calculate the average distance between i and the rest of the points of the same cluster, denoted as a ¯ i . For the same data point i , the average distance between it and all points in the cluster nearest to it is calculated (different from the cluster to which it belongs), which is denoted as b ¯ i , where m á x a ¯ i , b ¯ i refers to the maximum value between a ¯ i and b ¯ i . The silhouette index ranges from −1 to +1, where a high value indicates that the object is well matched to its own cluster and it is different from neighboring clusters.
Finally, the Davies–Bouldin index is used to assess the quality of a set of clusters in the dataset by means of a score that represents the average ratio of the within-cluster dispersion to the between-cluster separation, Equation (4). For n clusters, with c i   the centroid of the i-th group and σ i   intra-cluster dispersion of the group i, which is generally calculated as the average distance between the points of the group and their centroid, d c i , c j   represents the distance between the centroids c i y c j of two groups. m a x i j corresponds to the maximum value that the indicated quotient can take, provided that i ≠ j, that is for neighboring clusters. The lower the Davie–Bouldin Index, the better the partitioning of the data into clusters, as it implies a stronger intra-cluster cohesion (the dispersion between points will be small), and the larger the inter-cluster distances will be It is best to separate well-separated clusters, which avoids possible cluster overlaps [36,37].
s i = b ¯ i a ¯ i m a x a ¯ i , b ¯ i
D B = 1 n i = 1 n m a x i j σ i + σ j d c i , c j

3.4. Constructing the Clusters Profiles

In this paper, we propose a procedure for constructing the representative profile of a cluster. Each cluster will have a profile that consists of two parts: tourist features (V1, V2, V3, V4, V8) and the activities done (V9). For each tourist feature V i , we have a list with all its n modalities with an associated percentage score: m i 1 ,   p i 1   ,   m i 2 ,   p i 2   , ,   ( m i n ,   p i n ) . This procedure is detailed in Algorithm 1.
Algorithm 1. Profile construction for tourist features
For each variable:
STEP 1.
In each cluster, the percentage p i j of the modality m i j is calculated considering the number of tourists who belong to that cluster that selected m i j
STEP 2.
Percentages p i j < 10% are reduced to 0%, as they are not relevant.
STEP 3.
The remaining percentages are rescaled to satisfy j = 1 n p i j = 100
For example, we may have Cluster X and variable V3 (education level) with the profile [(E, 0%), (S, 85%), (W, 0%), (U, 15%), (P, 0%)]. We know the following:
  • E, W, and P have a value of 0%, which indicates that there are no tourists in that cluster with those levels of study.
  • S represents 85%, suggesting that the majority of tourists in this cluster have attained this level of education.
  • U has a value of 15%, indicating lower representation of university students in this cluster.
For the second part of the profile consisting of travel activities, the information obtained from question V9 is used. For each cluster, we will have a list that includes the activities done by the majority of members of each cluster: A   =   a 1 , a 2 ,   . ,   a s . The length of the list, s, may be different for each cluster. Algorithm 2 details this procedure.
Algorithm 2. Profile construction for the touristic activities
STEP 1.
We construct a table with the percentage of members of each group that choose each of the activities.
STEP 2.
In order to focus the analysis on the distinctive traits, we omit the activities that are common to all the clusters (e.g., visiting monuments, handicrafts and traditional cuisine) during the next stages of the personalization procedure. So, we keep the categories that have significant differences in the selections among the clusters.
STEP 3.
In the analysis of visitor profiles and types of cultural activities, we may find a large variance in the selection percentage of some less popular activities (e.g., religious events or traditional medicine) in comparison with others (e.g., historical sites, language, and traditions). A category is then assigned to the clusters with a significant higher percentage of participation. Taking into account that this variable allows multiple responses, when possible, we assign a category to all the clusters where at least 50% of participants selected it. If a category has all percentages below 50%, then we decrease the threshold to 25%. If the percentages are still lower to 25%, in order to identify the categories that best represent the members of a cluster, we should analyze the distribution of the percentages of answers of each category per clusters and find the appropriate distinctive cut level.
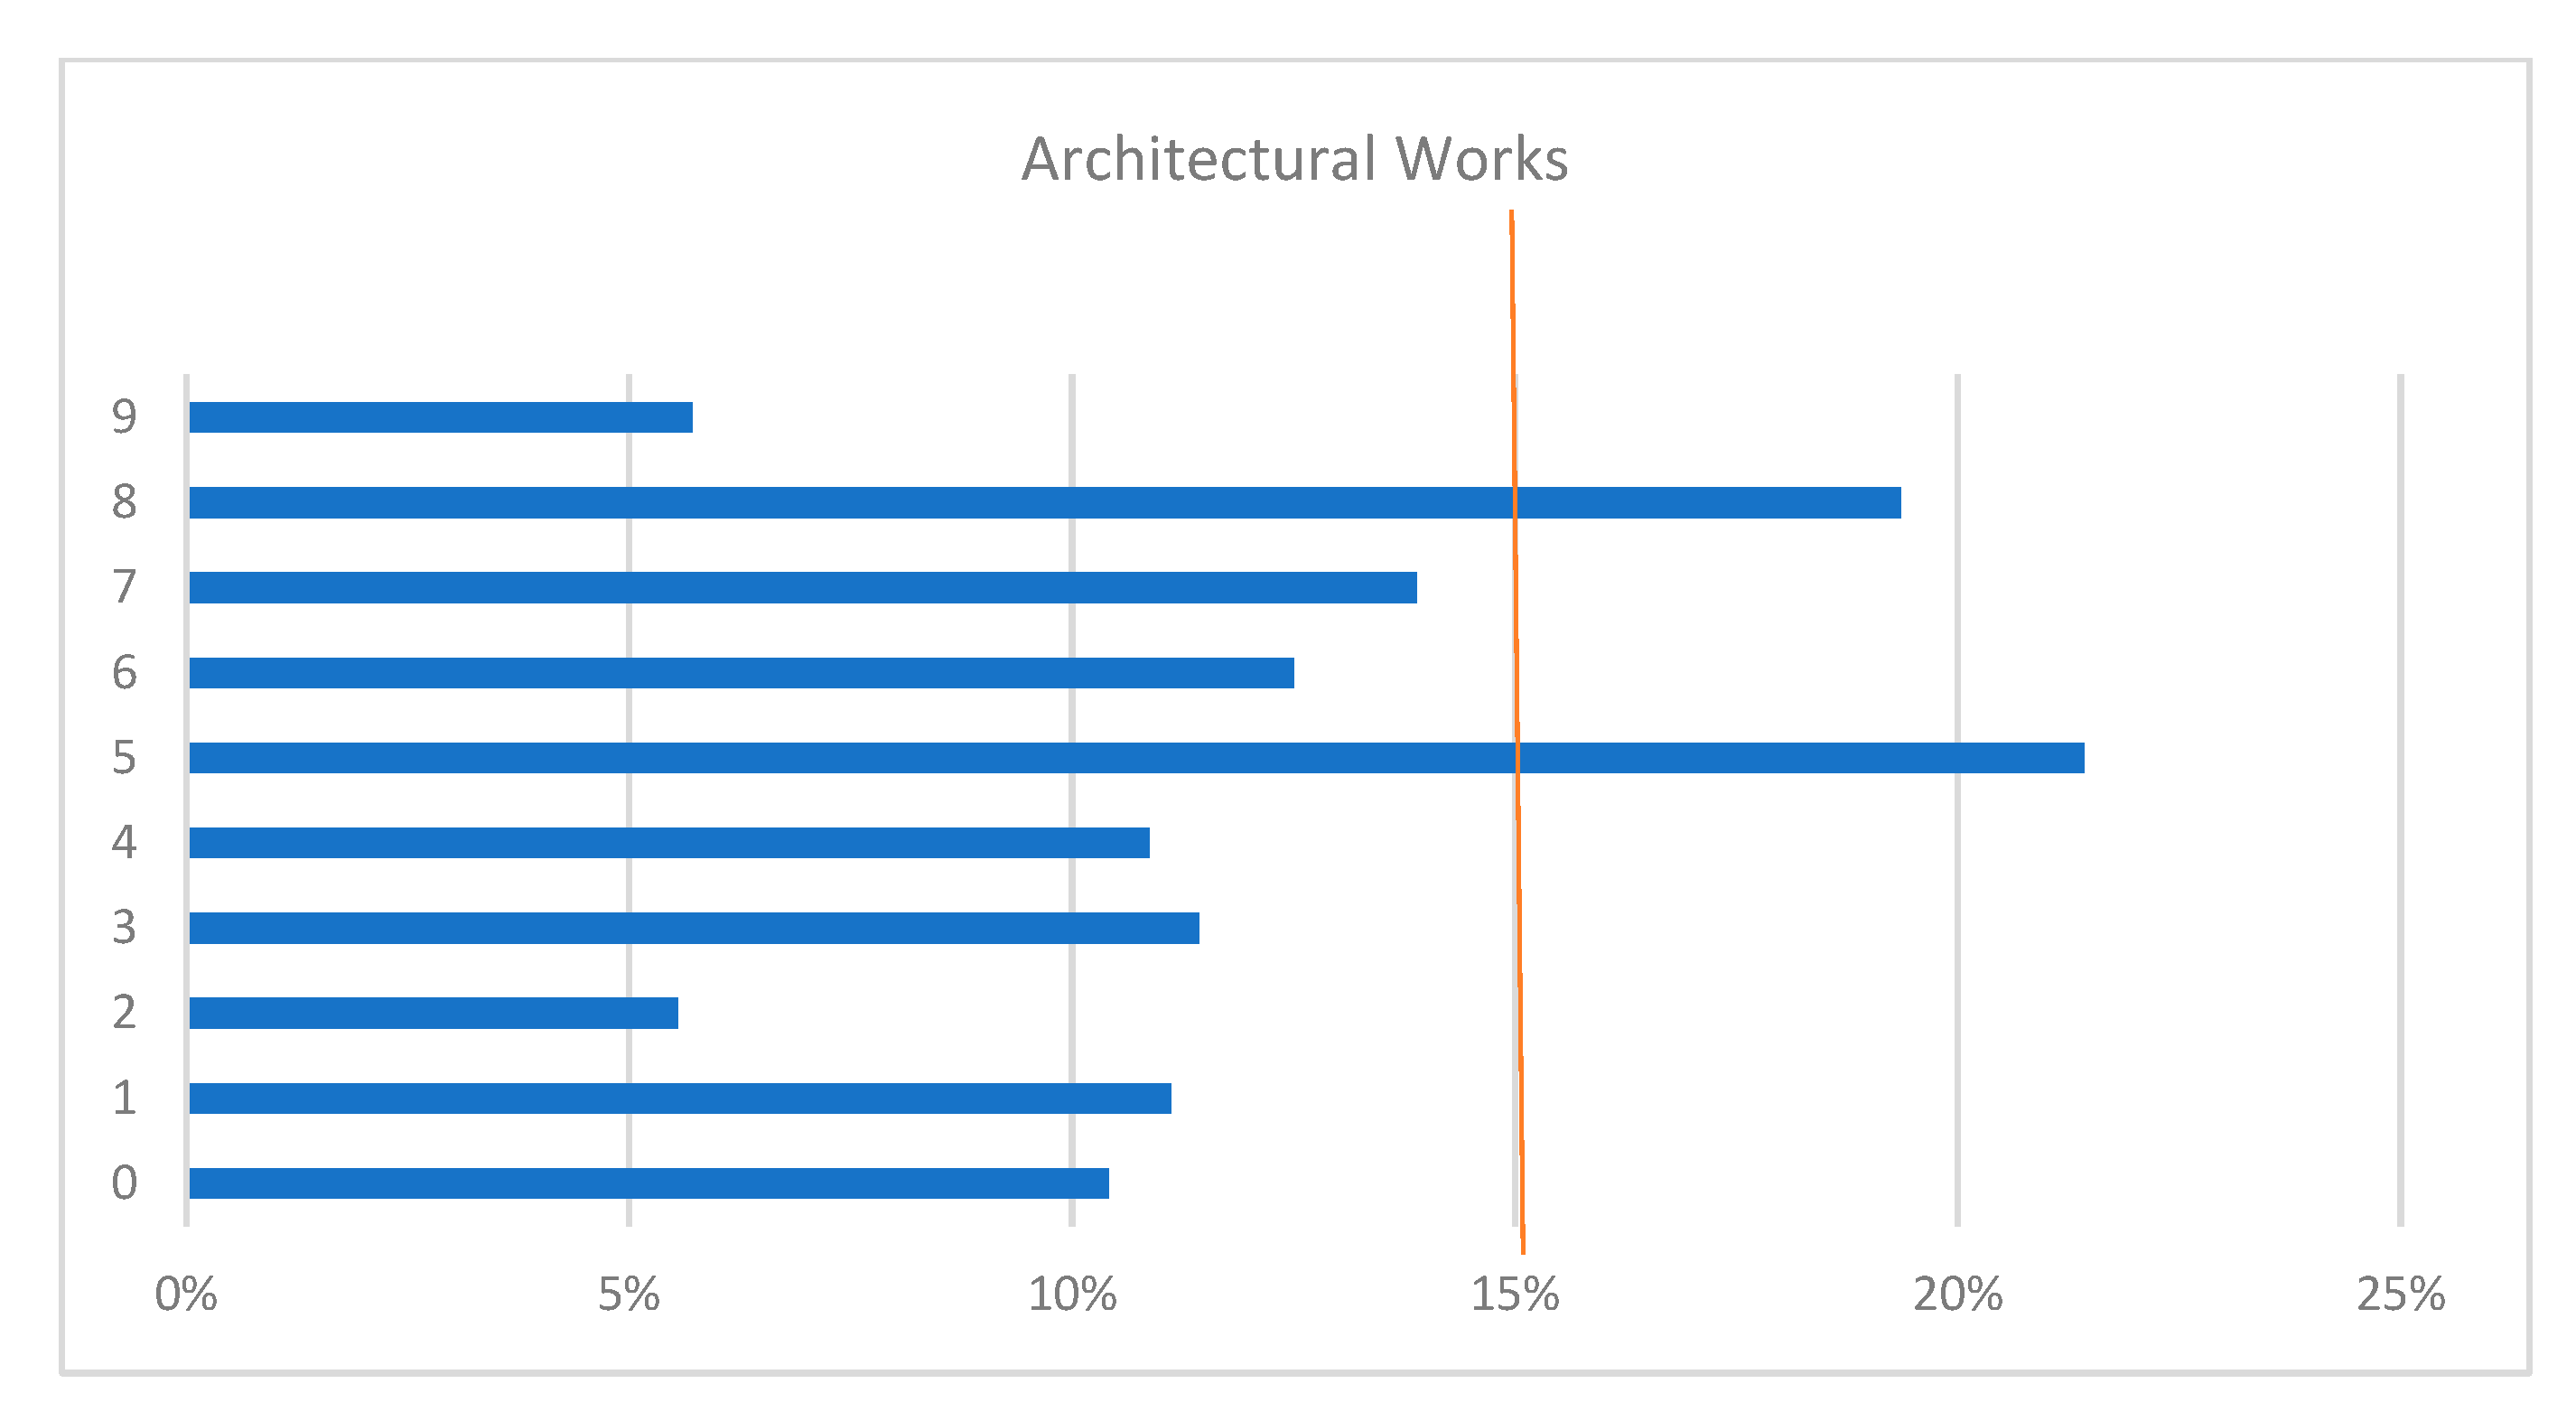
For example, let us consider the distributions shown in Figure 2, we can identify that the Architecture Heritage activities should be recommended to the members of cluster 5 and 8.

3.5. Recommending Activities to a New Tourist

The recommendation procedure will consist of assigning a new visitor to one of the clusters by taking into account the cluster profiles. The visitor will answer all the questions except V9, which are the activities that we want to recommend to him/her. Then, the user is assigned to the nearest cluster by using the following algorithm, where the similarity score of the user to the clusters is calculated by means of the Ordered Weighted Averaging Operator (OWA). Algorithm 3 outlines this recommendation process.
Algorithm 3. Procedure for recommending activities to a new tourist
For each cluster g c
  For each variable Vi
      Being modality mij selected by the user, p i j percentage of m i j in g c
      We calculate the aggregated score s i = O W A w ( p i j , w )
Assign the user to the cluster with maximum s i
The OWA operator applies an ordered weighted average on the values to be aggregated (p1, p2, …, pn) as follows [38]:
O W A w     p 1 ,     p 2 , ,   p n   =   j = 1 n w j p σ ( j )
where p σ ( j ) is a vector that includes the values to be aggregated (p1, p2,…, pn) arranged from largest to smallest. w is a vector of weights that defines the majority degree that is required during the aggregation. The weights thus give the importance of the values in each position regardless of the source of the value in that position.
The key property of the OWA operator is that the weighting vector is establishing the degree of andness used in the aggregation. In that way, the weights model different aggregation policies, ranging from situations of full andness (when w 1   = 1 and the rest are 0) to full orness (when w 1   = 1 and rest are 0). Any possibility in between can be represented with an appropriate combination of the weights. In all cases, the sum of all weights must be equal to 1, k = 1 m w k   =   1 .  

3.6. Computational Cost

The method proposed is scalable since it only requires comparing the new user with a reduced and fixed number of cluster prototypes. The costliest part of the method is the construction of the clusters, but this process is conducted offline. In the case study presented below, the clustering was done before the deployment of the recommender system by grouping the visitors’ values using the k-means algorithm. In case more data are collected in the future (for example, if the city becomes more popular), the clustering should be redone in order to adapt the clusters to the possible new profiles of tourists. However, the k-means clustering algorithm has a linear cost O (nki) in terms of the number of tourists n, the number k of clusters, and the number i of iterations to converge (which is usually low). This linear computational cost is a great advantage of this recommendation system. Thus, there is no need for large resources nor large amounts of time. This offline task will only be done when the destination managers detect significant changes in the number and type of visitors.

4. Case Study: The Riohacha District in Colombia

The methodology presented for constructing the recommender system was applied to the case of the Riohacha District in Colombia. Some questions from the initial questionnaire were not used in the recommender. In particular, variables V5, V6, and V7 were initially considered in the data collection instrument; however, after a methodological analysis, they were excluded from the computational process, as they did not provide significant differentiation for the development of user profiles. The model was trained mainly using sociodemographic data, which served as the basis for segmentation, ensuring that the system aligned as closely as possible with tourist profiles.

4.1. Results of Grouping Tourists in Clusters and Building the Profiles

After the data collection explained in Section 3.1 and its codification explained in Section 3.2, the procedures of clustering and profiling were conducted to build a recommender system. To identify the number of clusters associated with the data, the Elbow method and the silhouette coefficient were initially applied to the original codified dataset. What can be appreciated by contrasting the graphs in Figure 3 is that the methods used do not coincide in the optimal number of clusters given the large number of binary variables in the dataset. For this reason, Principal Component Analysis (PCA) was applied to reduce the dimensionality.
Principal Component Analysis (PCA) was performed on the dataset variables corresponding to the tourist profile V1, V2, V4, and the variable V8 of the trip characteristics. Subsequently, the K-means model was trained by applying a dimensionality reduction to only three components that represented 83% of the total variance. To determine the number of clusters, we calculated the value of the Elbow, Silhouette, and Davies–Boulding metrics. According to the results obtained, it is recommended to work with 10 clusters, as illustrated in Figure 4. Using these methods, the optimal number of clusters was identified clearly in the three techniques. The choice of k is crucial for the success of the K-means model and the segmentation of the tourists, taking into account similarity patterns.
Table 4 shows the proportion of tourists that belong to each of the 10 clusters. We can see that most of them range from 9% to 13%, which indicates that all the clusters have a similar number of tourists. There are only two clusters with 7% of members, corresponding to clusters with id = 3 and id = 9.
In the first part of the profile, a table was constructed that organizes the sociodemographic data of tourists by cluster. Table 4 shows the scaled data with the percentages obtained in the respective modalities. Cells in green indicate the distinctive modalities for each cluster.
Description of the characteristics that define each cluster in the population studied, see Figure 5:
  • Cluster 0: Women with secondary school studies, working in scientific jobs, with no preference in time and ages between 26 and 35.
  • Cluster 1: Women or men with secondary education, with student occupation, preferring to visit in the afternoon and with ages between 18 and 25.
  • Cluster 2: Women or men with university education and working in wholesale and retail trade, preferring to visit in the afternoon and with ages between 26 and 35.
  • Cluster 3: Women or men with secondary education, working in teaching, with no preference in time and with ages between 51 and 64.
  • Cluster 4: Women or men with secondary education, working in scientific jobs, with no preference in time and with ages between 36 and 50.
  • Cluster 5: Women with secondary education, with student occupation, with no preference in time, and with ages between 18 and 25.
  • Cluster 6: Women with secondary education and student occupation and other activities, who prefer to visit in the morning and all ages.
  • Cluster 7: Men with secondary education, working in scientific jobs, preferring to visit in the afternoon, and with ages between 36 and 50.
  • Cluster 8: Women with secondary education working in scientific jobs, with no preference in time and with ages between 18 and 25.
  • Cluster 9: Women or men with secondary education working in wholesale and retail trade with no preference in time and with ages between 26 and 35.
In the second part of the profile, a list of activities on the cultural points of interest to visit was constructed. At this stage, the variables were also scaled in each cluster. The results of this phase are presented in Table 5, where the cells in gray indicate the relevant activities in each of the clusters.
The handicrafts, monuments, and local culinary culture are the most popular activities for tourists visiting the area. When analyzing each cluster, it can be observed that some groups are interested in additional activities beyond the most popular cultural attractions. Among these activities, visits to historical sites, paintings, and urban heritage are presented in a smaller number of clusters. In particular, visits to paintings and historical sites are predominant among women, with a majority in the 18–25 and 26–35 age ranges. In addition, certain activities such as folkloric events and traditional medicine are characteristic of a single cluster, while others such as architectural heritage, religious events, languages, and traditional, habitat, and architectural works are distributed among two or three clusters, adapting to the specific preferences of different groups of tourists.

Sensitivity Analysis

To evaluate the robustness of the recommendation system against variations in the thresholds defined for each type of cultural activity, a comparative analysis was conducted. This involved modifying the thresholds and examining the effects of increasing and decreasing them across different ranges. Table 6 shows the number of cultural activities recommended to user clusters under various threshold levels, both above and below the reference value. Activities with low recommendation assignment (recommended to one cluster or no clusters) are highlighted in blue. An increase of just 2% in the threshold leads to a rise in activities falling into this undesired condition, increasing from two to four clusters.
Conversely, activities recommended to seven or more clusters are marked in orange, which implies that most of the tourists are being directed to the same places, reducing differentiation among experiences, and producing overcrowding situations. While a 2% decrease in the threshold is considered acceptable, further reductions are not recommended, as up to six clusters fall into this condition. These findings support the selected threshold as the most balanced configuration, with only a 2% reduction being tolerable.
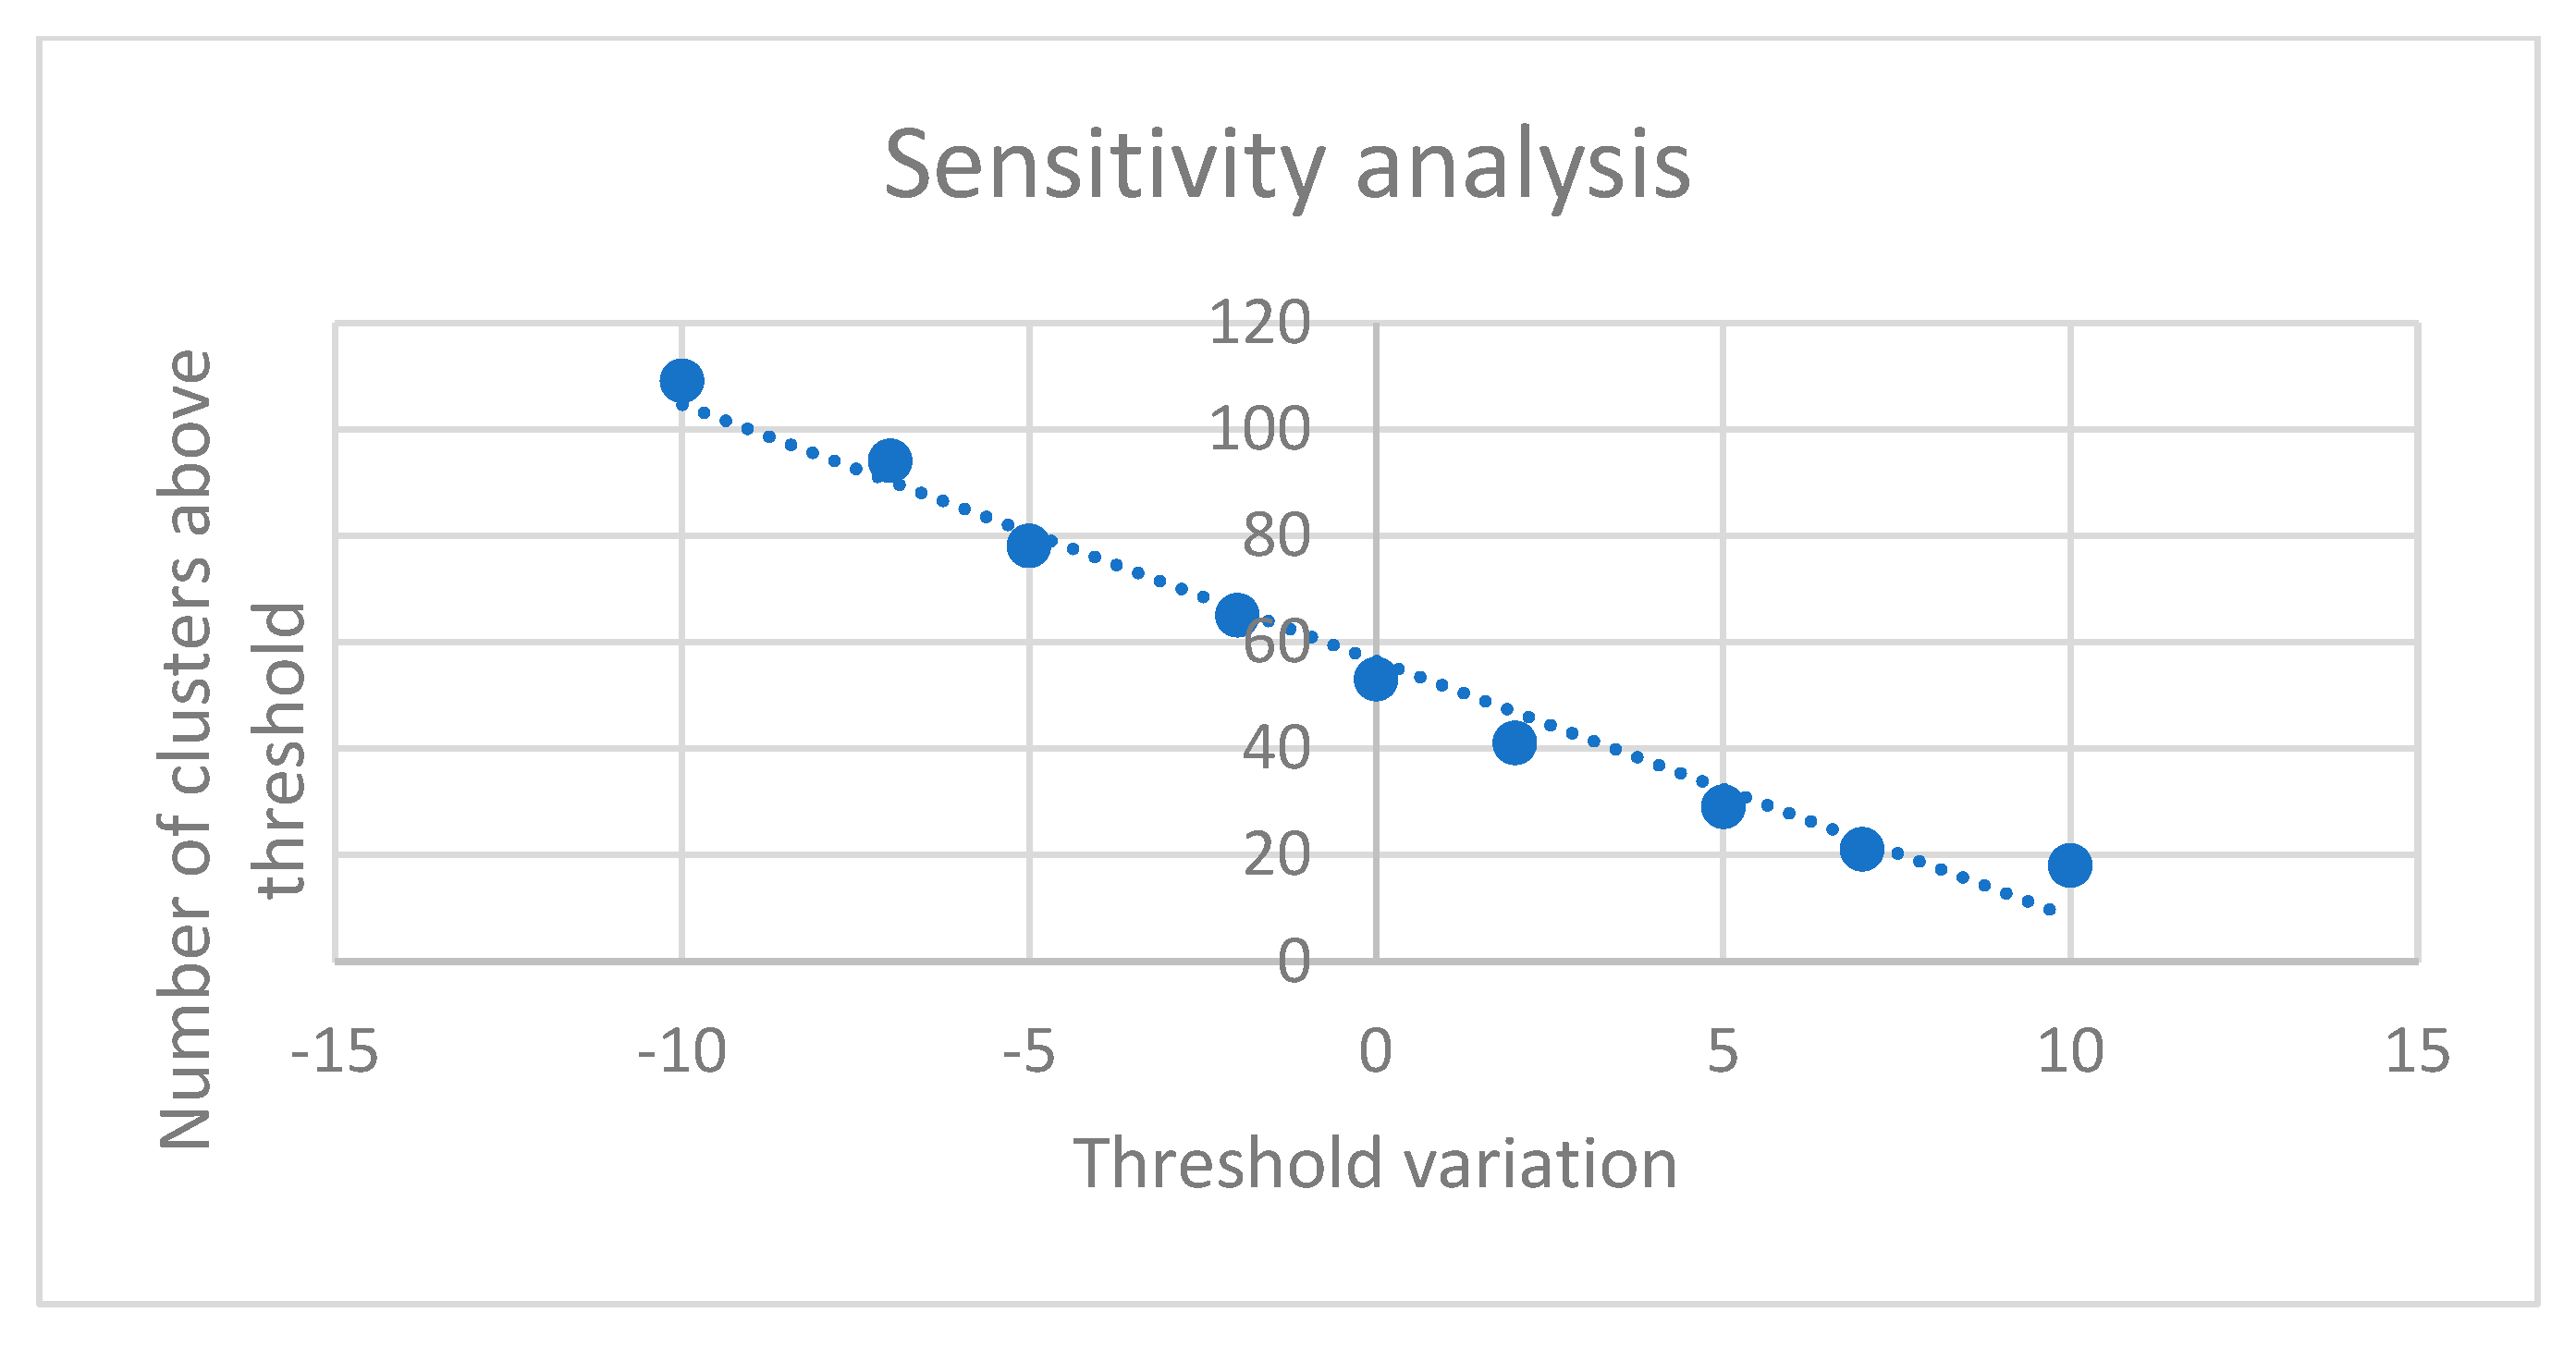
Figure 6 shows the total number of activities recommended across all clusters as the threshold changes in the range from −10 to +10 relative to the originally established values. As observed, the results follow an almost linear trend, suggesting that the output depends linearly on the value of the threshold (i.e., a small variation in the threshold leads to a small variation in the results). Therefore, the proposed method shows a linear smooth behavior in terms of threshold changes, which shows that the results are sensitive to this parameter. Consequently, a proper adjustment of the threshold is needed to have a balanced assignment of activities to clusters, which confirms what was observed in the previous table.

4.2. Results of the Recommendation Process: Validation with Tourists

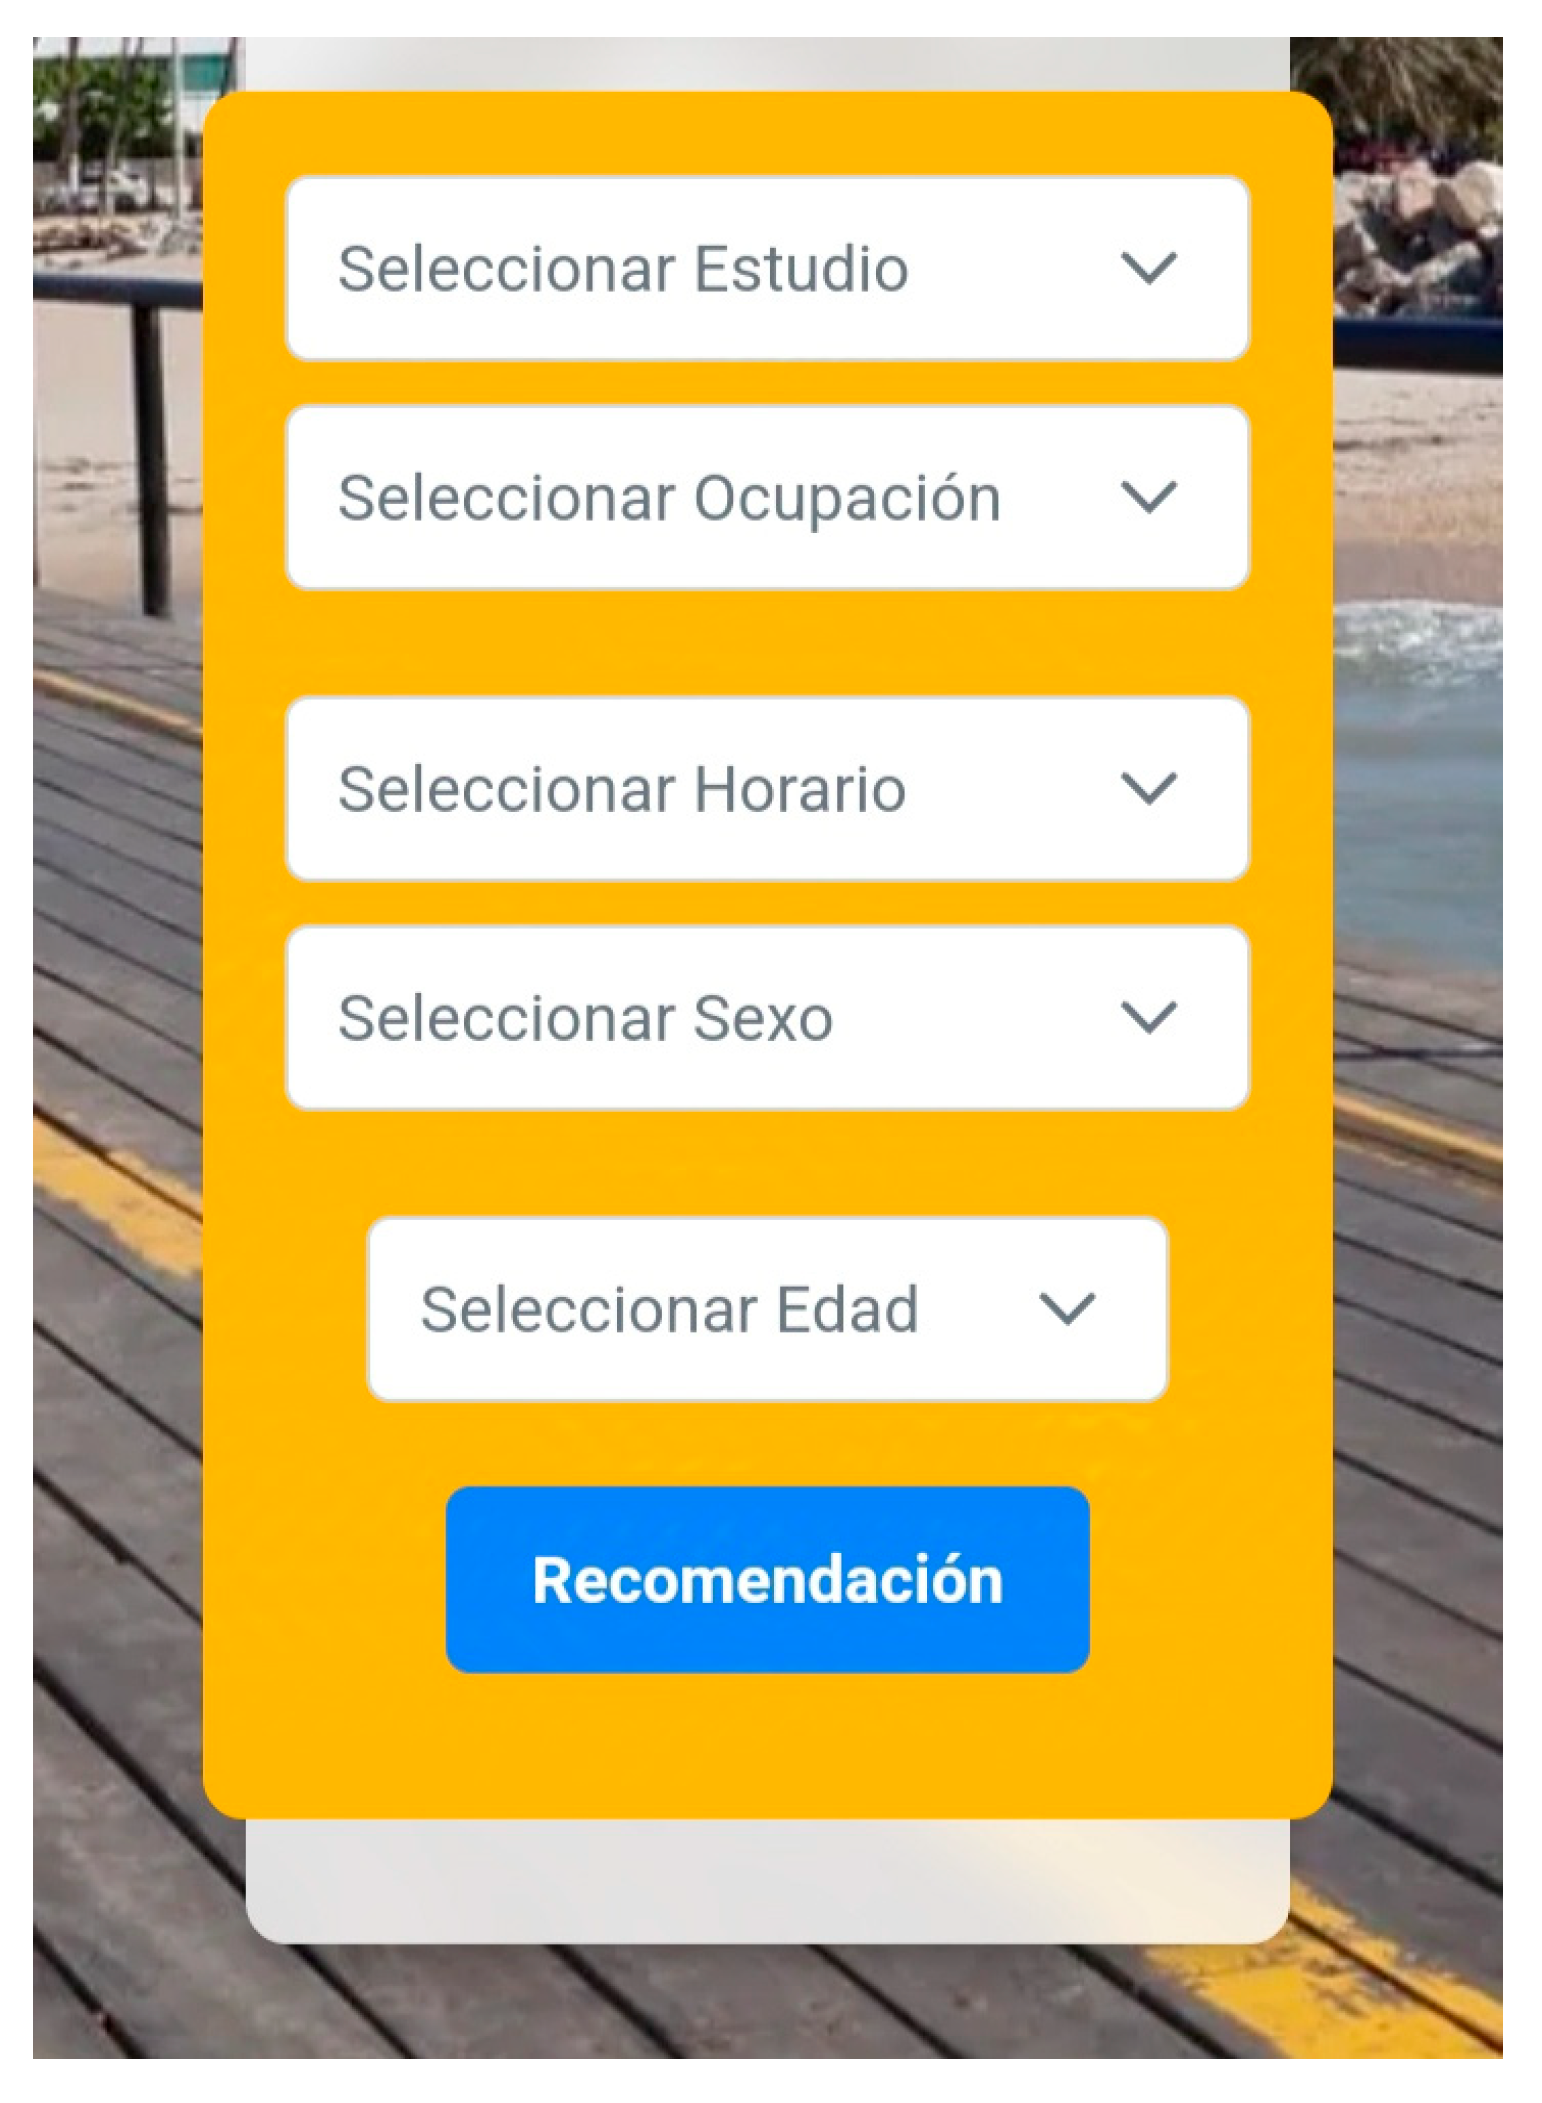
The validation of the tourism recommendation system was carried out through tests conducted with a group of tourists in the District of Riohacha, in order to evaluate the functionality of the system and the satisfaction of the participants. For this purpose, the web platform designed for cultural tourism recommendations in the Historical Center of Riohacha was used, and the participants tested the system in a real environment, allowing direct interaction with the interface and its functionalities. The onterface is only available in Spanish. The validation process involved 51 tourists visiting the District of Riohacha; the group was composed of users of various ages and profiles to obtain a broader perspective on the user experience. Figure 6 and Figure 7 present representative images of the system interface.
After interacting with the system, tourists completed a survey designed to measure the system’s functionalities. The questions focused on relevant aspects of the recommender system, including the accuracy of recommendations, ease of use, relevance of the information provided, and overall satisfaction, see Table 7. The main questions posed in the survey are presented below:
  • Is the website easy to use?
  • Do you consider the content of the web application relevant?
  • Can you act on the information provided by the web application?
  • Would you recommend the web application?
  • Did the recommendation help you identify points of cultural interest in the Historic Center of the District of Riohacha?
  • Do you consider that more points of cultural interest should be added to the recommendation provided by the application? Which ones?
Table 6 summarizes the results obtained from the participants’ responses in the first five questions. The objective of the open question 6, which asked for suggestions to improve the recommendation offered by the system, was to evaluate whether users considered it necessary to add more points of cultural interest in the recommendations provided by the application, as well as to identify what type of additional experiences would be of interest to enrich the offer. Although the focus of the web application is cultural tourism, users expressed significant interest in local gastronomy. User responses show a strong tendency towards the inclusion of information on typical gastronomic sites. In addition, participants suggested including cultural experiences based on the experiences of other tourists. Another point that stands out is the importance of expanding the recommendation beyond the District of Riohacha to include the entire Department of Guajira.
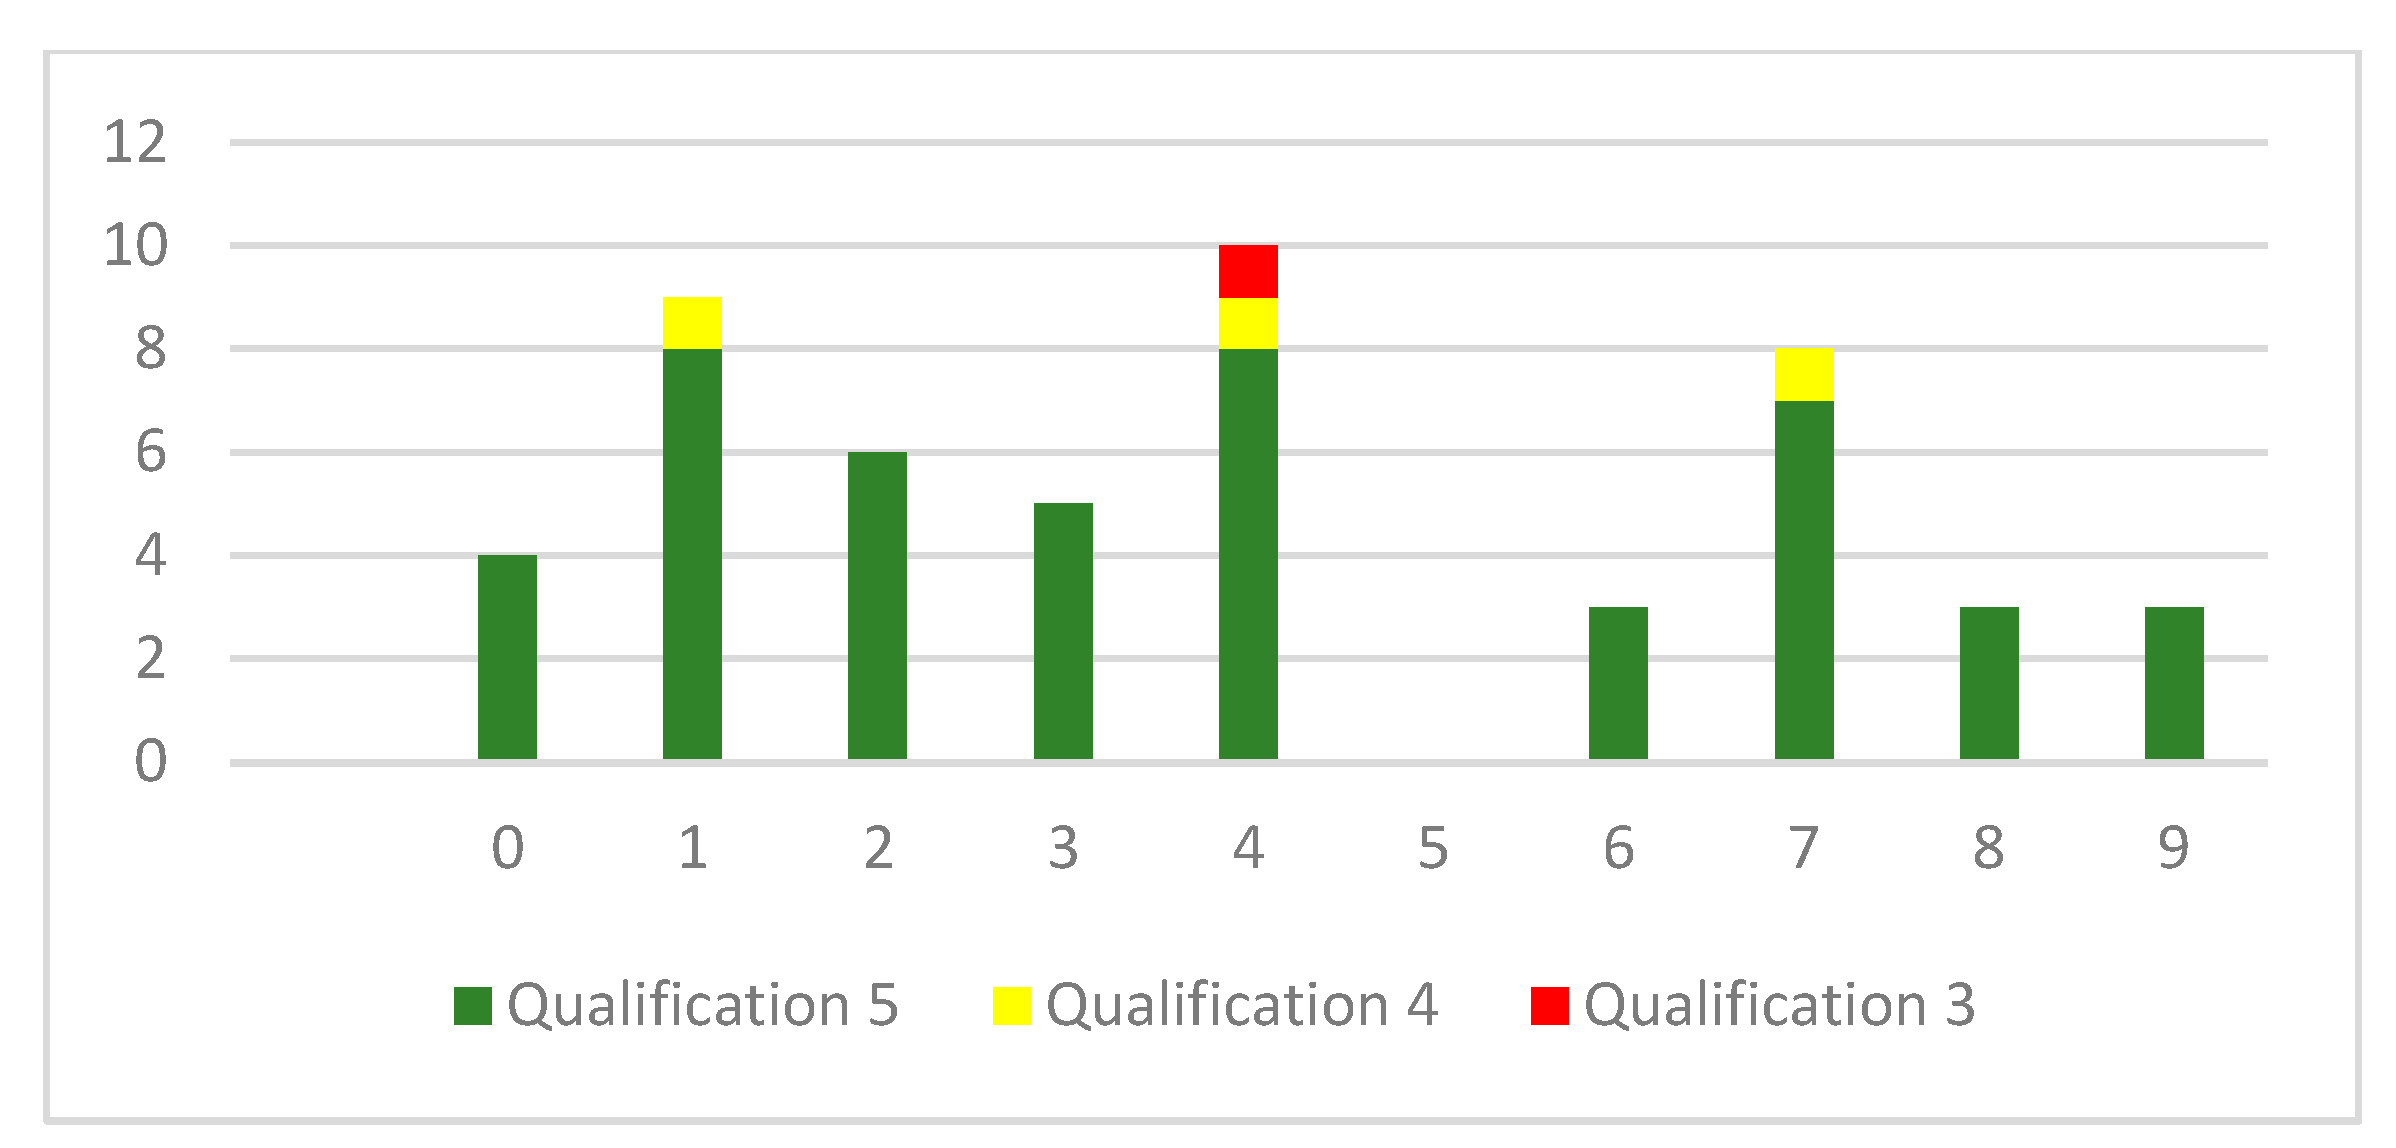
In addition to the previous questions, users had to give a rating on the quality of the recommendations provided by the web application, by means of a scale from 1 to 5, with the purpose of measuring the satisfaction and effectiveness of the recommendations. The distribution of the scores by cluster is shown in Figure 8. The graph shows the ratings given by tourists, segmented according to the cluster to which they were assigned by the system, which allows us to analyze the level of satisfaction associated with each group of users. Most of the groups were completely satisfied with the recommendations received (qualification of 5), having only some ratings of 4 or 3 in clusters 1, 4, and 7. No rating below 3 was obtained in any cluster.
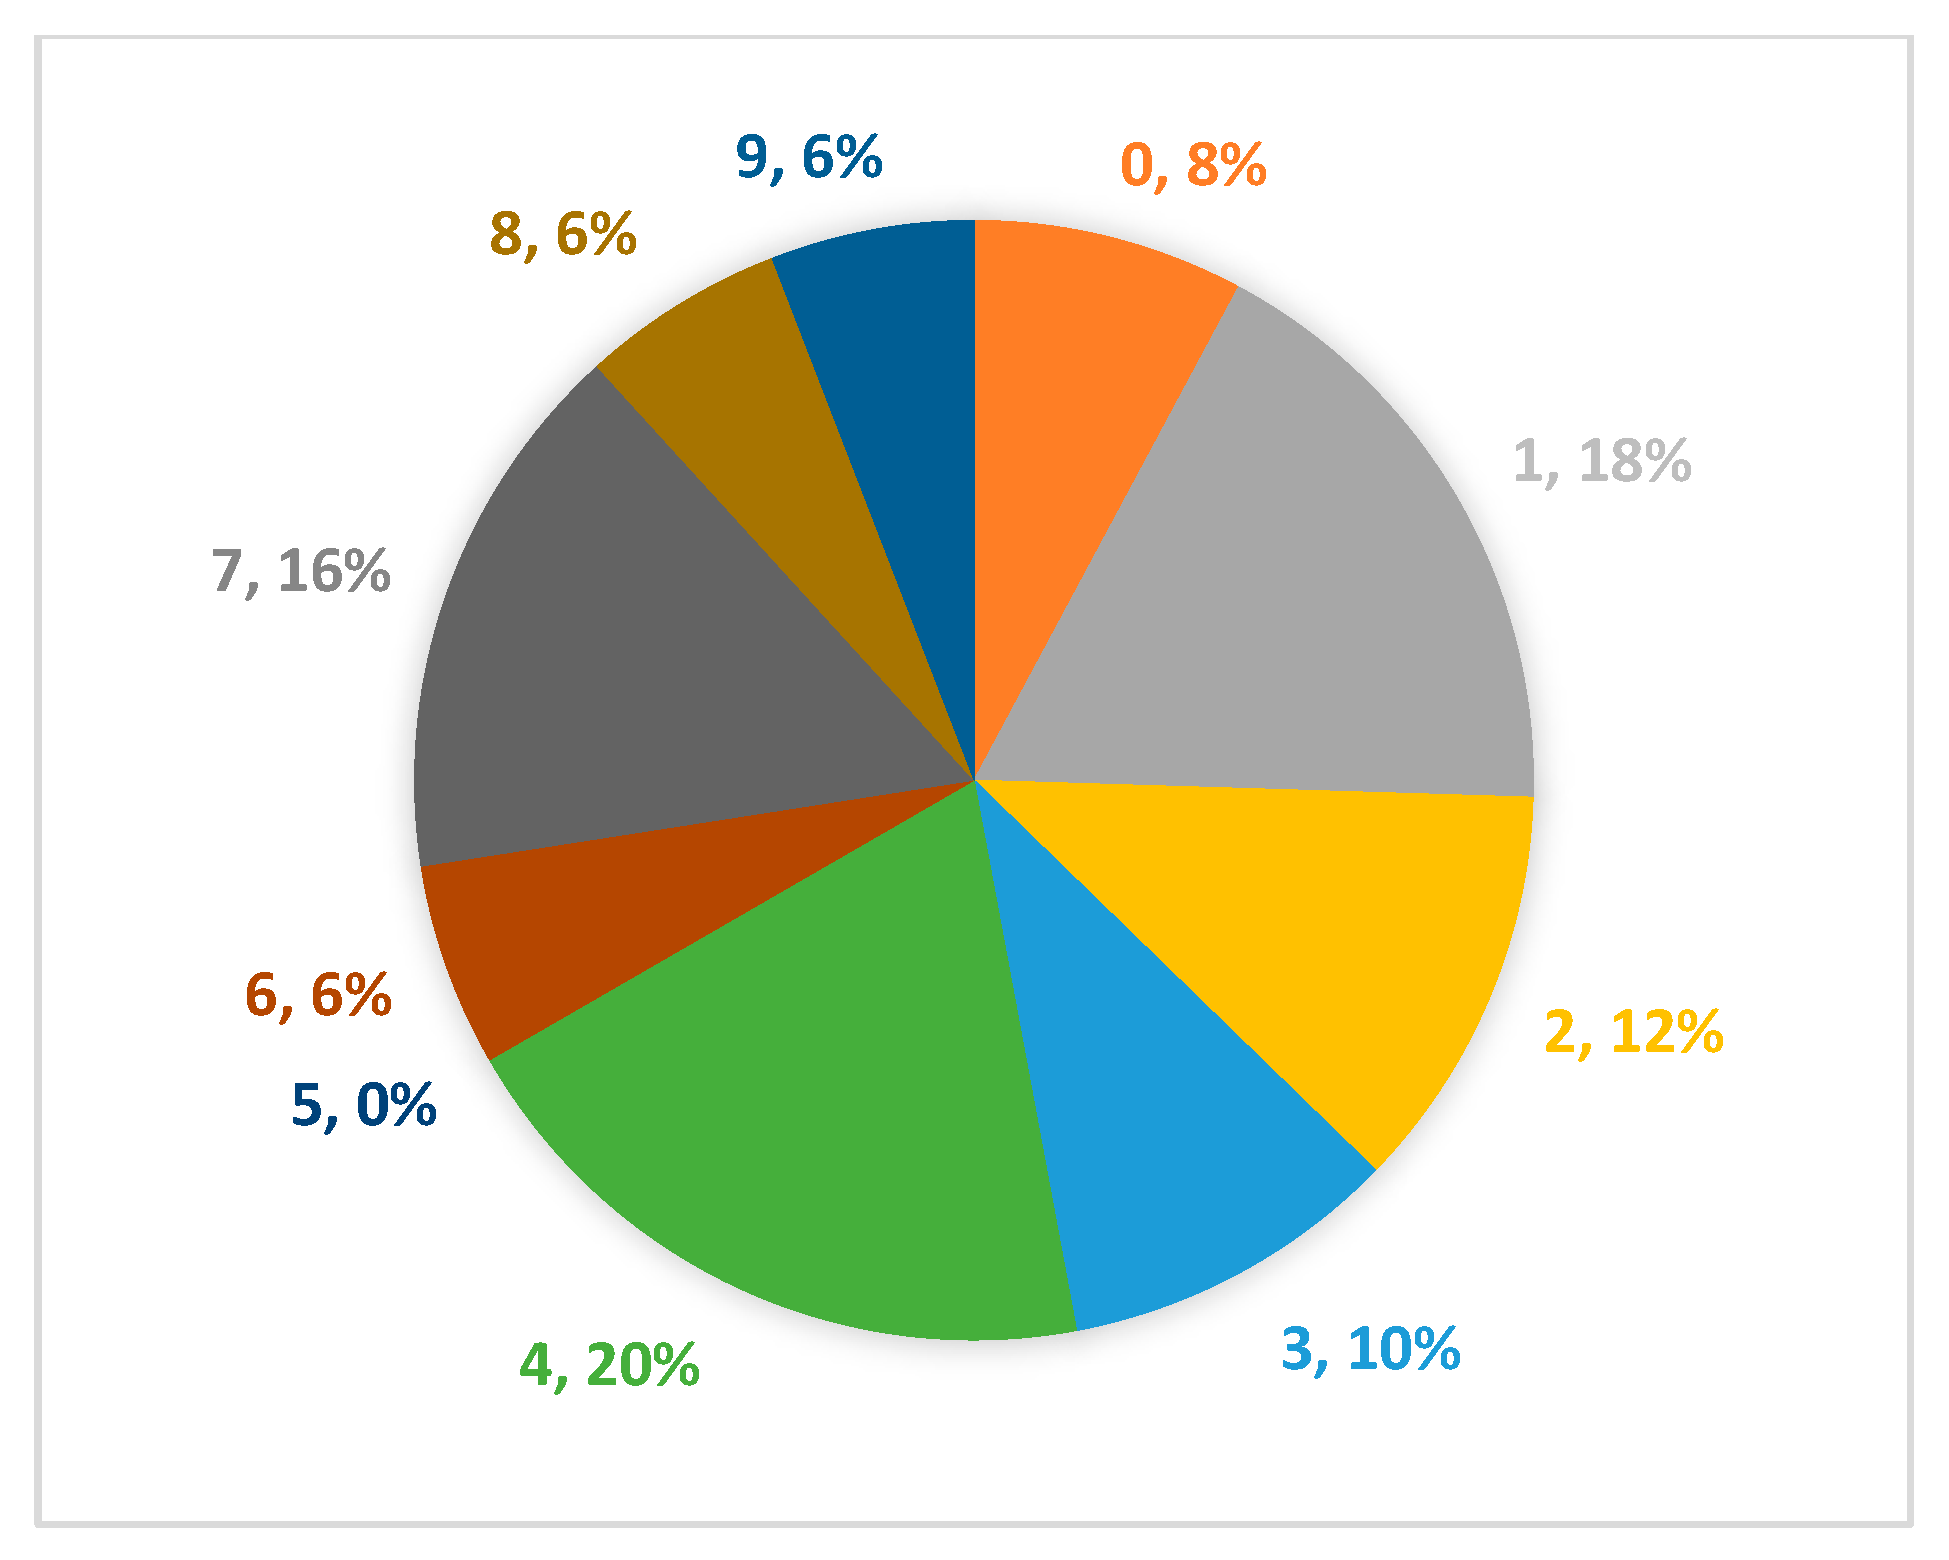
Figure 9 shows the distribution of users by cluster. It can be seen that clusters 1, 4, and 7, mentioned above, concentrate the highest population density, with more than 50% of all segmented users.

4.3. Comparison of Cluster Distribution in Training and Testing

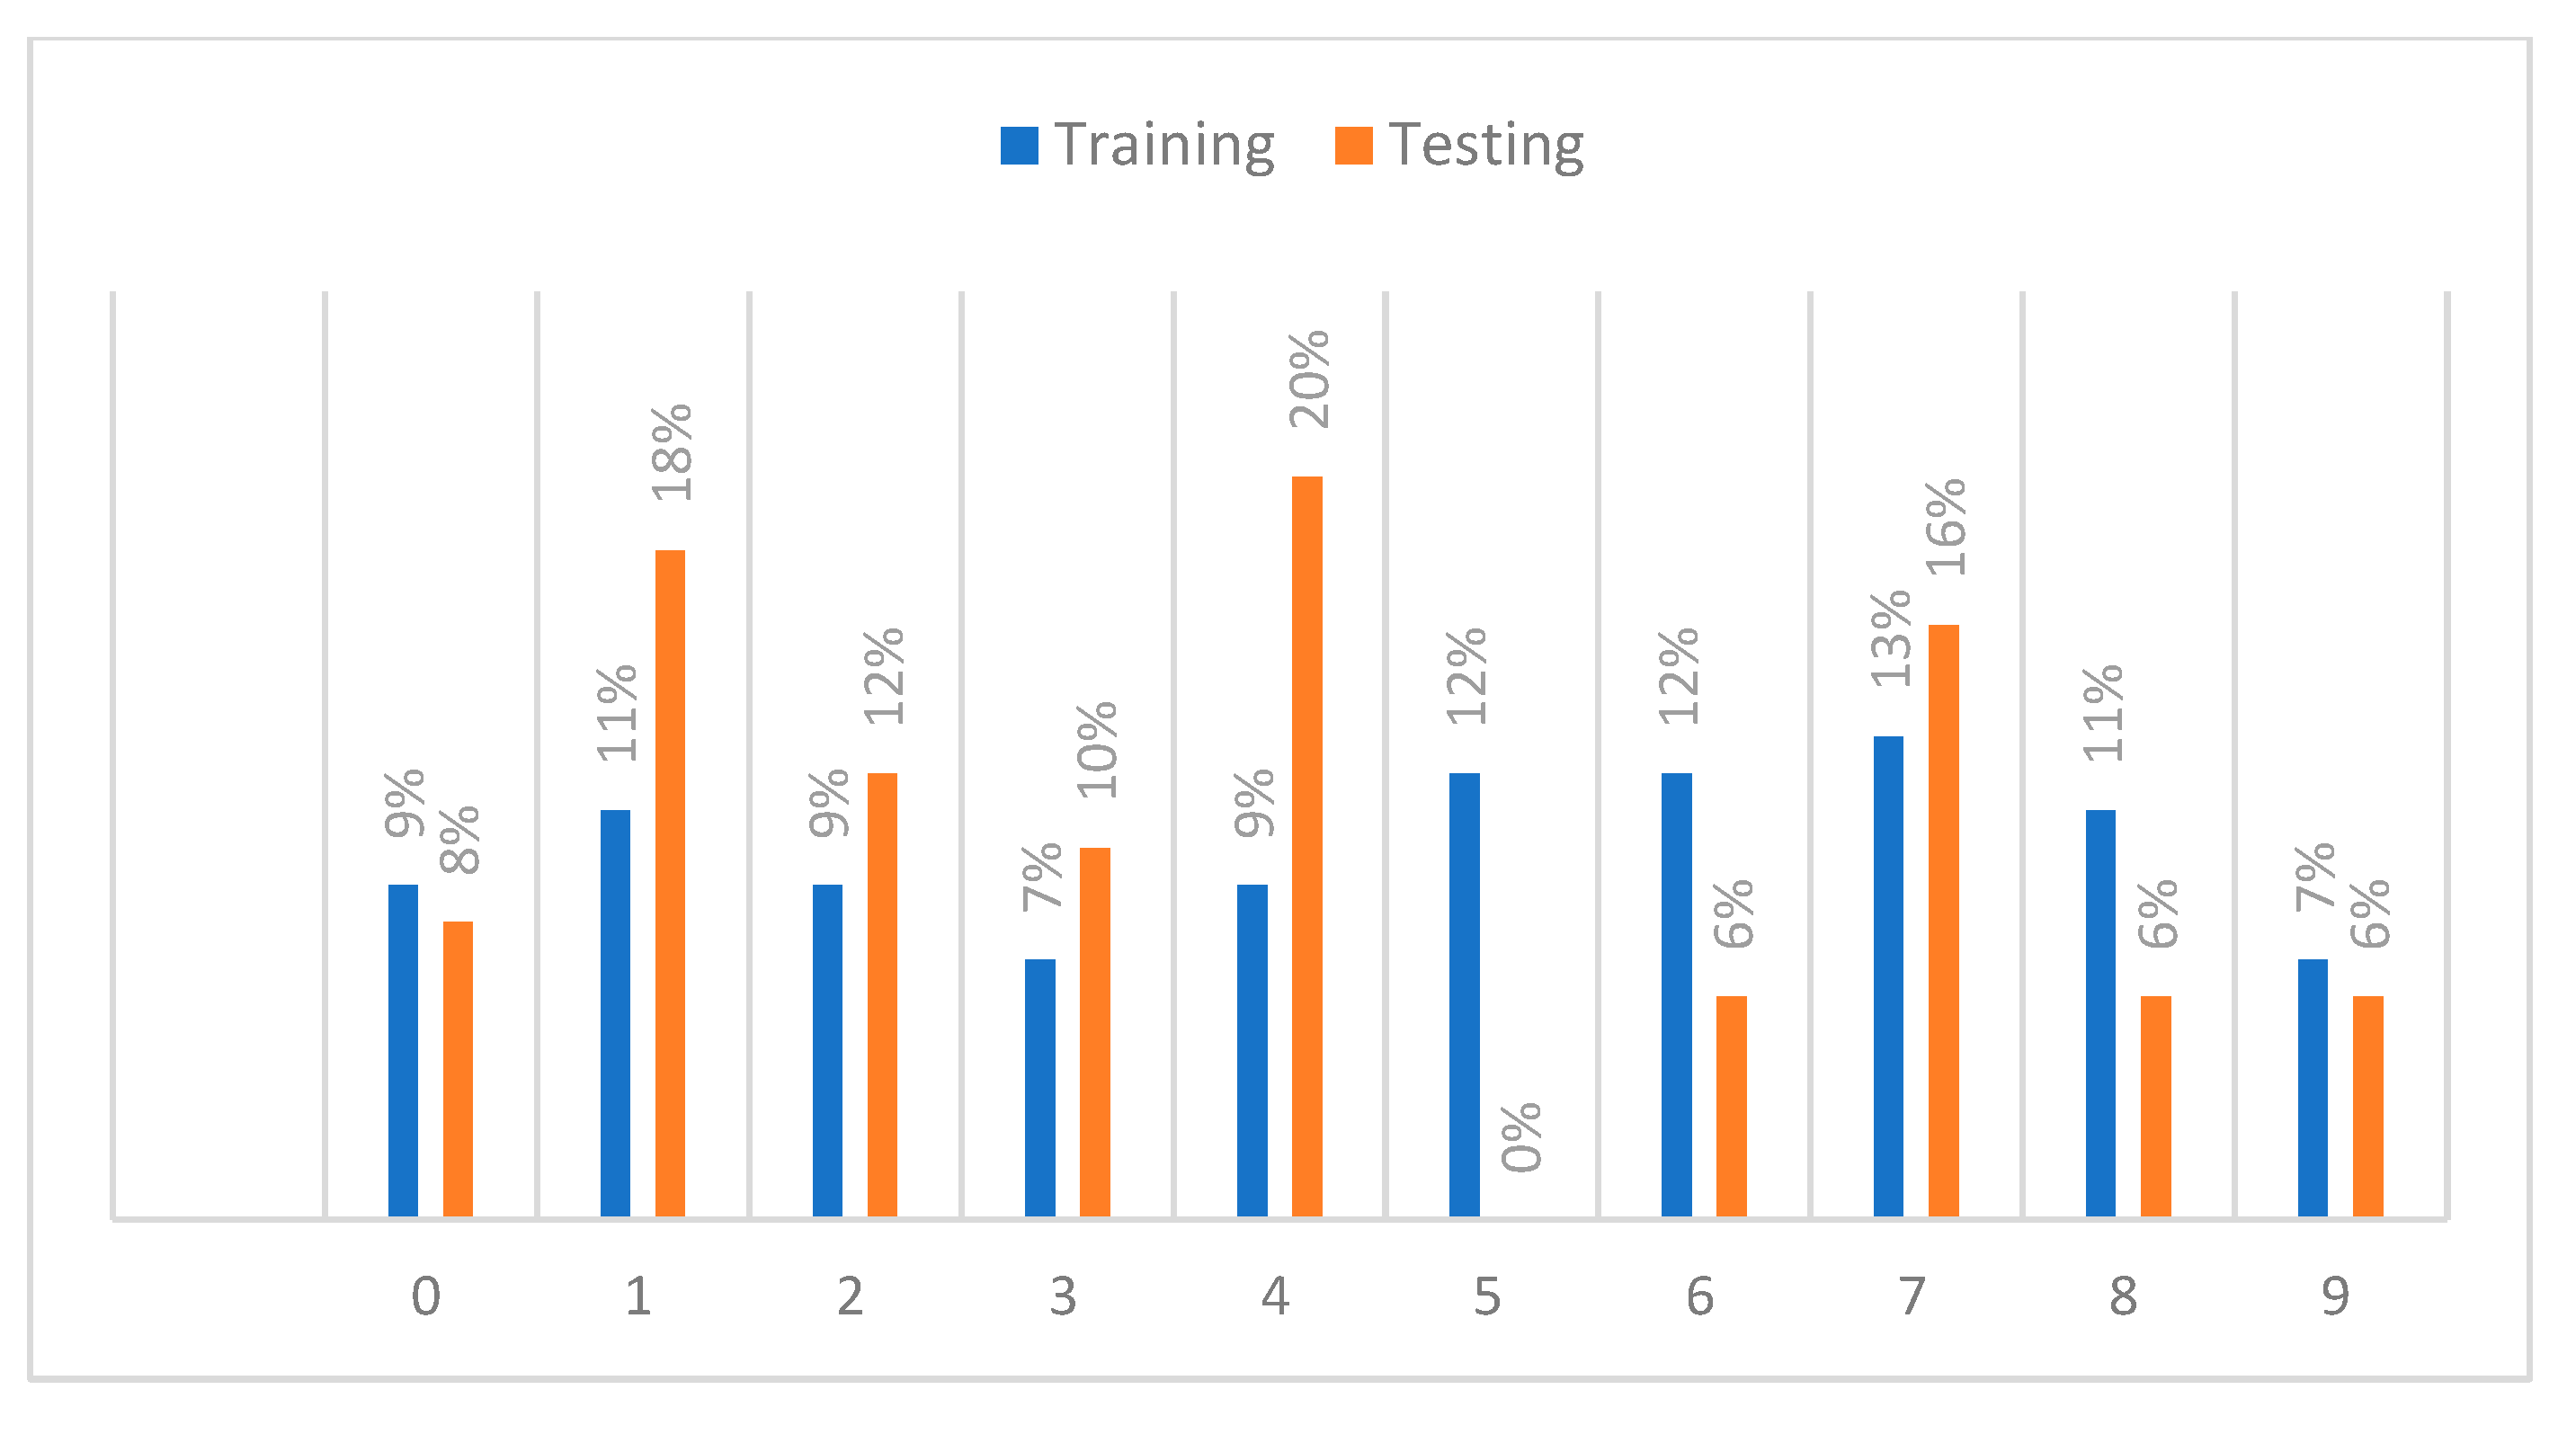
Figure 10 shows the distribution of users assigned to each cluster in the training and test sets of the model. Although variations are visualized in some clusters, such as C1 and C4, this difference can be explained by the size of the samples analyzed. However, a remarkable coherence is maintained in other clusters (C0, C2, C8, and C9), a positive result to identify the ability of the model to maintain certain segmentation structures despite different samples. The results suggest that the proposed recommendation model identifies patterns in user segmentation inherent in real contexts where populations can be highly dynamic, see Figure 11.

5. Conclusions

The proposed recommender system uses machine learning techniques, such as the K-means algorithm, to segment tourists according to sociodemographic data and travel preferences, and an OWA operator with a disjunctive policy that assigns the most relevant cluster to each of them. An algorithm for determining the most relevant activities in each cluster has been presented. This is a new content-based recommendation procedure that allows the provision of personalized recommendations in touristic destinations based on the observation of other travelers’ features and behavior.
The flexible profile-based recommendation system shows great potential for promoting cultural tourism in emerging destinations. This paper has addressed the case of Riohacha (Colombia), with the aim to improve the visitor experience in the historic center of this beautiful city. The constructed recommender system not only increases the visibility of local attractions, but also permits the identification of distinctive tourist profiles, which may be of interest to the local destination tourism managers. It is worth mentioning that for emerging destinations, where tourism has not yet been studied, the method proposed needs only the collection of a representative visitor’s data by means of a survey. The artificial intelligence techniques used for the exploitation of this data and recommendation generation are fast and of low computational cost, which is a great advantage in comparison with other approaches based on huge deep learning or language models.
The evaluation and validation process of the recommendation system showed a high level of satisfaction in terms of ease of use and effectiveness of recommendations. Satisfaction rates reached 100% in several aspects, such as ease of navigation, relevance of content, effectiveness of information provided, and recommending the application to other users. In addition, users expressed interest in extending the recommendations to include local gastronomic and cultural experiences beyond the immediate area.
The proposal not only effectively addresses the particularities of the context but also establishes a replicable approach for regions with similar cultural and tourism characteristics. The methodology and techniques developed in this study can be adapted globally, allowing for the optimization of the visitor experience and the enhancement of cultural heritage.
The main limitations of the study are related to the lack of available and updated data for the construction of the recommender system, a common situation in emerging tourism destinations, especially due to the absence of historical data. Therefore, it is not possible to apply content-based techniques which require having previous evaluations of the different features of the items, nor collaborative techniques that need to exploit the information of the scores given by other users. In addition, it is not possible to have quantitative metrics (e.g., precision, recall, F1 score), because these metrics require information based on users’ actual behavior in response to the recommendations. The current prototype does not permit collecting these data at the moment, but we plan to work on that in order to be able to analyze usage logs for a quantitative evaluation. Moreover, in future work, we should study the possibility of including a broader and more diverse set of features related to trip characteristics, such as length of stay and level of expenditure. It is also planned to extend the demographic descriptors to achieve a more detailed characterization of tourist profiles. These improvements are intended to increase the adaptability and accuracy of the system in dynamic and heterogeneous tourism contexts, favoring a more effective personalization of recommendations.
A direct comparison of the proposed system with other recommenders is not feasible. Being an emerging tourist destination, Riohacha does not have a detailed textual description of each specific point of interest (that is why the recommendation was focused on types of activities, rather than on concrete items); thus, content-based semantic recommenders or recommenders based on embeddings generated from textual content are not applicable. Moreover, the lack of a strong tourism industry makes it impossible to obtain a large number of opinions and ratings from traditional worldwide touristic platforms like Tripadvisor, preventing the use of content filtering techniques. They could be applicable in the future, when the system is deployed and enough ratings and opinions have been obtained.

Author Contributions

Conceptualization, I.A.-J., A.S.-B., A.V., A.M. and M.C.-P.; methodology, I.A.-J., A.S.-B., A.V. and A.M.; software, I.A.-J., A.S.-B. and M.A.-C.; validation, J.E.-G. and M.A.-C.; formal analysis, I.A.-J., A.S.-B., A.V., A.M. and J.E.-G.; investigation, I.A.-J., A.S.-B., A.V., A.M. and M.C.-P. resources, J.E.-G. and M.A.-C.; data curation, A.V., A.M., J.E.-G. and M.A.-C.; writing—original draft preparation, I.A.-J. and A.S.-B.; writing—review and editing, A.V., A.M., M.C.-P., J.E.-G. and M.A.-C.; visualization, I.A.-J.; supervision, J.E.-G. and M.A.-C.; project administration, J.E.-G.; funding acquisition, J.E.-G. All authors have read and agreed to the published version of the manuscript.

Funding

Universitat Rovira i Virgili with project 2023PFR-URV-00114; Departament de Recerca i Universitats of Generalitat de Catalunya (Consolidated research group 2021 SGR 00114); the Spanish network ELIGE-IA on recommender systems; Universidad de la Guajira-Colombia and Minciencias Colombia (Bicentenary PhD grant).

Institutional Review Board Statement

This study was non-interventional in nature and based on an anonymous survey; therefore, it did not require ethical approval from an institutional review board. Data collection was conducted in accordance with current Colombian regulations on personal data protection, specifically Law 1581 of 2012 and Decree 1377 of 2013, which govern the handling of sensitive information and ensure the anonymity of participants.

Informed Consent Statement

Verbal informed consent was obtained from the participants. Verbal consent was obtained rather than written because participants were randomly selected tourists who voluntarily agreed to respond to the survey, and due to the non-sensitive nature of the questions, written consent was not deemed necessary. All procedures were conducted in accordance with ethical standards and in compliance with the Colombian data protection regulations, specifically Law 1581 of 2012 and its regulatory decrees, which safeguard the rights of individuals regarding the collection and processing of personal data.

Data Availability Statement

The original data presented in the study are openly available at: https://doi.org/10.5281/zenodo.16756850.

Conflicts of Interest

The authors declare no conflict of interest.

References

  1. Moreno, A.; Valls, A.; Isern, D.; Marin, L.; Borràs, J. SigTur/E-Destination: Ontology-based personalized recommendation of Tourism and Leisure Activities. Eng. Appl. Artif. Intell. 2013, 26, 633–651. [Google Scholar] [CrossRef]
  2. Halder, S.; Lim, K.H.; Chan, J.; Zhang, X. A survey on personalized itinerary recommendation: From optimisation to deep learning. Appl. Soft Comput. 2023, 152, 111200. [Google Scholar] [CrossRef]
  3. Pavlidis, G. Apollo—A Hybrid Recommender for Museums and Cultural Tourism. In Proceedings of the 2018 International Conference on Intelligent Systems (IS), Funchal, Portugal, 25–27 September 2018; pp. 94–101. [Google Scholar] [CrossRef]
  4. Ding, L. Research on Application System of Computer Artificial Intelligence Technology in Content Recommendation of Cultural Tourism Industry in Jilin Province. In Proceedings of the 2024 2nd International Conference on Mechatronics, IoT and Industrial Informatics (ICMIII), Melbourne, Australia, 12–14 June 2024; pp. 772–776. [Google Scholar] [CrossRef]
  5. Ministerio de Comercio, Industria y Turismo. Política de Turismo Cultural: Colombia, Destino Turístico Cultural, Creativo y Sostenible; Gobierno de Colombia: Bogotá, Colombia, 2021. [Google Scholar]
  6. Wu, Y.C.; Lin, S.W. Efficiency evaluation of Asia’s cultural tourism using a dynamic DEA approach. Socio-Econ. Plan. Sci. 2022, 84, 101426. [Google Scholar] [CrossRef]
  7. Nuanmeesri, S. Development of community tourism enhancement in emerging cities using gamification and adaptive tourism recommendation. J. King Saud Univ.-Comput. Inf. Sci. 2022, 34, 8549–8563. [Google Scholar] [CrossRef]
  8. El Congreso de Colombia. Plan Nacional De Desarrollo 2022–2026; Departamento Nacional de Planeación (DNP): Bogotá, Colombia, 2022. [Google Scholar]
  9. Bravo, J.; Alarcón, R.; Valdivia, C.; Serquén, O. Application of Machine Learning Techniques to Predict Visitors to the Tourist Attractions of the Moche Route in Peru. Sustainability 2023, 15, 8967. [Google Scholar] [CrossRef]
  10. Lou, N. Tourism Destination Recommendation Based on Association Rule Algorithm. Mob. Inf. Syst. 2022, 2022, 9331178. [Google Scholar] [CrossRef]
  11. Karthiyayini, J.; Anandhi, R.J. To Analyze the Various Machine Learning Algorithms That Can Effectively Process Large Volumes of Data and Extract Relevant Information for Personalized Travel Recommendations. SN Comput. Sci. 2024, 5, 336. [Google Scholar] [CrossRef]
  12. Huda, C.; Heryadi, Y.; Lukas; Budiharto, W. A tourism dataset from historical transaction for recommender systems. Data Brief 2024, 52, 109990. [Google Scholar] [CrossRef]
  13. Aldayel, M.; Al-Nafjan, A.; Al-Nuwaiser, W.M.; Alrehaili, G.; Alyahya, G. Collaborative Filtering-Based Recommendation Systems for Touristic Businesses, Attractions, and Destinations. Electronics 2023, 12, 4047. [Google Scholar] [CrossRef]
  14. Solano-Barliza, A.; Valls, A.; Moreno, A.; Dujmovic, J.; Acosta-Coll, M.; Escorcia-Gutierrez, J.; De-La-Hoz-Franco, E. Personalized Hotel Recommender System Based on Graded Logic Personalized Hotel Recommender System Based on Graded Logic with Asymmetric Criteria with Asymmetric Criteria. Procedia Comput. Sci. 2024, 246, 2864–2873. [Google Scholar] [CrossRef]
  15. Badouch, M.; Boutaounte, M. Personalized Travel Recommendation Systems: A Study of Machine Learning Approaches in Tourism. J. Artif. Intell. Mach. Learn. Neural Netw. 2023, 33, 35–45. [Google Scholar] [CrossRef]
  16. Solano-Barliza, A.; Arregocés-Julio, I.; Aarón-Gonzalvez, M.; Zamora-Musa, R.; De-La-Hoz-Franco, E.; Escorcia-Gutierrez, J.; Acosta-Coll, M. Recommender systems applied to the tourism industry: A literature review. Cogent Bus. Manag. 2024, 11, 2367088. [Google Scholar] [CrossRef]
  17. Pandey, P.; Mayank, K.; Sharma, S. Recommendation System for Adventure Tourism. In Proceedings of the 2023 4th IEEE Global Conference for Advancement in Technology, Bangalore, India, 6–8 October 2023; pp. 1–7. [Google Scholar] [CrossRef]
  18. Pandya, S.; Shah, J.; Joshi, N.; Ghayvat, H.; Mukhopadhyay, S.C.; Yap, M.H. A novel hybrid based recommendation system based on clustering and association mining. In Proceedings of the 2016 10th International Conference on Sensing Technology (ICST), Nanjing, China, 11–13 November 2016; pp. 1–6. [Google Scholar] [CrossRef]
  19. Lemma, T.; Byrne, W.; Tadisetti, S. A Hybrid Machine Learning Enabled Tourism Recommender System Providing a Context-Aware Experience to Tourists in Ireland. In Proceedings of the 2023 1st International Conference on Advanced Engineering and Technologies (ICONNIC), Kediri, Indonesia, 13–14 October 2023; pp. 275–280. [Google Scholar] [CrossRef]
  20. Carvache-Franco, M.; Hassan, T.; Carvache-Franco, O.; Carvache-Franco, W.; Martin-Moreno, O. Demand segmentation and sociodemographic aspects of food festivals: A study in Bahrain. PLoS ONE 2023, 18, 0287113. [Google Scholar] [CrossRef]
  21. Marques, C.; da Silva, R.V.; Antova, S. Image, satisfaction, destination and product post-visit behaviours: How do they relate in emerging destinations? Tour. Manag. 2021, 85, 104293. [Google Scholar] [CrossRef]
  22. Konstantakis, M.; Alexandridis, G.; Caridakis, G. A personalized heritage-oriented recommender system based on extended cultural tourist typologies. Big Data Cogn. Comput. 2020, 4, 12. [Google Scholar] [CrossRef]
  23. Chang, A.Y.P.; Hung, K.P. Development and validation of a tourist experience scale for cultural and creative industries parks. J. Destin. Mark. Manag. 2021, 20, 100560. [Google Scholar] [CrossRef]
  24. Lenis Escobar, A.; Rueda López, R.; Pérez-Priego, M.; García-Moreno García, M.D.L.B. Perception, motivation, and satisfaction of female tourists with their visit to the city of Cordoba (Spain). Sustainability 2020, 12, 7595. [Google Scholar] [CrossRef]
  25. DANE. Clasificación Industrial Internacional Uniforme de todas las actividades económicas. Versión 4 adaptada para Colombia. Angew. Chemie Int. Ed. 2021, 119, 361–416. [Google Scholar]
  26. Sevilla Villanueva, B. A Methodology for Pre-Post Intervention Studies: An Application for a Nutritional Case Study. Available online: https://widgets.ebscohost.com/prod/customerspecific/ns000545/customproxy.php?url=https://search.ebscohost.com/login.aspx?direct=true&db=edstdx&AN=edstdx.10803.392610&amp%0Alang=pt-pt&site=eds-live&scope=site (accessed on 1 June 2020).
  27. Ezugwu, A.E.; Ikotun, A.M.; Oyelade, O.O.; Abualigah, L.; Agushaka, J.O.; Eke, C.I.; Akinyelu, A.A. A comprehensive survey of clustering algorithms: State-of-the-art machine learning applications, taxonomy, challenges, and future research prospects. Eng. Appl. Artif. Intell. 2022, 110, 104743. [Google Scholar] [CrossRef]
  28. Musthafa, N.; Raji, C.G. Hybrid Recommender System using K-means Clustering. In Proceedings of the 2022 8th International Conference on Advanced Computing and Communication Systems (ICACCS), Coimbatore, India, 25–26 March 2022; pp. 625–630. [Google Scholar] [CrossRef]
  29. Kumar, M.R.; Vishnu, S.; Roshen, G.; Kumar, D.N.; Revathi, P.; Baster, D.R.L. Product Recommendation Using Collaborative Filtering and K-Means Clustering. In Proceedings of the 2024 IEEE International Conference on Computing, Power and Communication Technologies (IC2PCT), Greater Noida, India, 9–10 February 2024; pp. 1722–1728. [Google Scholar] [CrossRef]
  30. Zacarias, H.; Cangondo, G.; Souza-Pereira, L.; Garcia, N.M.; Silva, B.; Pombo, N. Application of Content-Base Recommendation Algorithms on Mobile Travel Applications. In Proceedings of the 2023 1st International Conference on Advanced Innovations in Smart Cities (ICAISC), Jeddah, Saudi Arabia, 23–25 January 2023; pp. 1–5. [Google Scholar] [CrossRef]
  31. Ojeda-Beltrán, A.; Solano-Barliza, A.; Arrubla-Hoyos, W.; Ortega, D.D.; Cama-Pinto, D.; Holgado-Terriza, J.A.; Damas, M.; Toscano-Vanegas, G.; Cama-Pinto, A. Characterisation of Youth Entrepreneurship in Medellín-Colombia Using Machine Learning. Sustainability 2023, 15, 10297. [Google Scholar] [CrossRef]
  32. Cazals, F. A mini-review of clustering algorithms and their theoretical properties, with applications to molecular science. J. Innov. Mater. Extrem. Cond. 2024, 5. Available online: https://inria.hal.science/hal-04504440v1 (accessed on 20 January 2025).
  33. Arbelaitz, O.; Gurrutxaga, I.; Muguerza, J.; Pérez, J.M.; Perona, I. An extensive comparative study of cluster validity indices. Pattern Recognit. 2013, 46, 243–256. [Google Scholar] [CrossRef]
  34. Van Mechelen, I.; Boulesteix, A.; Dangl, R.; Dean, N.; Hennig, C.; Leisch, F.; Steinley, D.; Warrens, M.J. A white paper on good research practices in benchmarking: The case of cluster analysis. Wiley Interdiscip. Rev. Data Min. Knowl. Discov. 2023, 13, 1511. [Google Scholar] [CrossRef]
  35. Rodriguez, M.Z.; Comin, C.H.; Casanova, D.; Bruno, O.M.; Amancio, D.R.; Costa, L.D.F.; Rodrigues, F.A. Clustering algorithms: A comparative approach. PLoS ONE 2019, 14, e0210236. [Google Scholar] [CrossRef]
  36. Davies, D.L.; Bouldin, D.W. A Cluster Separation Measure. IEEE Trans. Pattern Anal. Mach. Intell. 1979, PAMI-1, 224–227. [Google Scholar] [CrossRef]
  37. Thomas, J.C.R.; Peñas, M.S.; Mora, M. New Version of Davies-Bouldin Index for Clustering Validation Based on Cylindrical Distance. In Proceedings of the 2013 32nd International Conference of the Chilean Computer Science Society (SCCC), Temuco, Chile, 11–15 November 2013; pp. 49–53. [Google Scholar] [CrossRef]
  38. Yager, R.R. Quantifier guided aggregation using OWA operators. Int. J. Intell. Systems 1996, 11, 49–73. [Google Scholar] [CrossRef]
Figure 1. Process of the recommender system construction and use.
Informatics 12 00081 g001
Figure 2. Thresholds to indicate activities with percentages < 25%.
Informatics 12 00081 g002
Figure 3. Quality results of Elbow and Silhouette without PCA.
Informatics 12 00081 g003
Figure 4. Quality results with PCA: (A) the Elbow method, (B) the Silhouette method, and (C) the Davies–Bouldin Method.
Informatics 12 00081 g004
Figure 5. Tourists distribution in the 10 clusters.
Informatics 12 00081 g005
Figure 6. Sensitivity analysis with respect to threshold variation.
Informatics 12 00081 g006
Figure 7. System interface—user input form.
Informatics 12 00081 g007
Figure 8. System interface—visualization of recommended points of interest.
Informatics 12 00081 g008
Figure 9. Distribution of user ratings by cluster.
Informatics 12 00081 g009
Figure 10. Distribution of user by cluster.
Informatics 12 00081 g010
Figure 11. Distribution by cluster in training and test.
Informatics 12 00081 g011
Table 1. Sociodemographic characteristics of the tourist sample (N = 393).
IdCategoryAcronymFrecuencyPercentage (%)
V1Age group<18 226
18–2510126
26–3512231
36–508622
51–645313
65+92
V2SexMenM18447
WomenW20953
V3Level of educationElementary educationE82
Secondary educationS5213
Education for Work and Human TalentW7720
University educationU22056
PostgraduateP349
V4OccupationStudentsSt7218
UnemployedU31
Human health care and social assistanceH338
TeachingT236
Public Administration and DefensePu144
Artistic, entertainment and recreationalA113
Accommodation and food servicesF102
Information and communicationsI82
Professional, scientific and technical activitiesSc11329
Wholesale and retail tradeR5614
PensionerPe113
Self-employedSe20
Other activitiesO3910
Total393100
Table 2. Trip characteristics.
IdQuestionsResponsesAcronym
V5When you visit a tourist destination, how many cultural sites of interest do you visit on average during your stay?1–2
3–4
5–6
7–8
9–10
10+
V6How much time do you spend on your trips visiting tourist attractions of cultural interest?Less than 1 h<1
1–3 h1–3
3 h or more3+
V7When you travel, you generally do soAloneA
In a groupG
With the familyFa
With friendFr
V8At what time do you prefer to visit the tourist attractions in the District of Riohacha?MorningM
AfternoonA
EveningE
IndifferentI
V9What are you interested in knowing in the Riohacha District?MonumentsM
PaintingsP
Historic SitesH
Urban HeritageU
Architectural HeritageA
Festive and recreational eventsF
Traditional religious eventsR
HandicraftsH
Traditional medicineM
Culinary CultureC
Language and traditionsL
Natural habitatN
Architectural WorksA
Table 3. Level of education coded.
CategoryESWUP
Elementary education10000
Secondary education11000
Education for Work and Human Talent11100
University education11010
Postgraduate11011
Table 4. Scaled data sociodemographic profile of tourists.
ClusterLevel of EducationOccupationTime to VisitSexAge
ESWUPHScPuARUTFStIOPeMAEM/AM/EA/EM/A/EIWomenMan[18–25][26–35][36–50][51–64][65–85]
00%85%0%15%0%0%100%0%0%0%0%0%0%0%0%0%0%31%025%000044%65%35%0%100%0%0%0%
10%68%0%32%0%0%0%0%0%0%0%0%0%100%0%0%0%0%73%27%0%0%0%0%0%54%46%100%0%0%0%0%
20%33%0%67%0%21%0%0%0%79%0%0%0%0%0%0%0%0%85%0%0%0%15%0%0%47%53%0%100%0%0%0%
318%62%0%21%0%0%28%0%0%18%0%31%0%0%0%12%12%0%26%0%0%0%0%0%74%51%49%0%0%0%100%0%
411%61%0%28%0%16%61%0%0%22%0%0%0%0%0%0%0%0%0%0%0%0%0%0%100%46%54%0%0%100%0%0%
50%64%0%36%0%0%22%0%0%0%0%0%0%78%0%0%0%0%0%0%0%0%0%0%0%65%35%100%0%0%0%0%
616%57%0%27%0%12%16%0%0%0%0%0%0%29%0%29%14%100%0%0%0%0%0%0%0%88%12%28%12%12%35%14%
723%47%0%30%0%13%43%0%0%20%0%0%0%0%0%23%0%0%70%0%15%0%15%0%0%31%69%0%0%100%0%0%
80%52%0%48%0%22%50%0%0%28%0%0%0%0%0%0%0%0%0%0%0%0%0%0%100%61%39%100%0%0%0%0%
90%54%0%46%0%24%0%16%0%44%0%0%0%0%0%16%0%0%0%0%0%0%0%0%100%49%51%0%100%0%0%0%
Table 5. Scaled data on interest in visiting the different types of activities in the Riohacha District.
ClusterMonumentsPaintingsHistoric SitesUrban HeritageArchitectural HeritageFestive and Recreational EventsTraditional Religious EventsHandicraftsTraditional MedicineCulinary CultureLanguage and TraditionsNatrual HabitatArchitectural Works
069%31%52%15%19%17%4%79%8%56%35%29%10%
144%14%50%22%17%56%6%75%8%56%53%8%11%
264%19%39%25%22%36%11%86%8%58%44%22%6%
371%14%60%29%14%23%3%91%6%51%43%31%11%
474%26%43%26%20%20%4%89%11%52%52%17%11%
576%26%55%21%24%21%14%83%12%48%48%17%21%
660%19%54%23%19%35%13%85%13%54%40%21%13%
758%8%44%31%19%33%8%86%6%44%28%19%14%
842%26%32%19%19%35%6%84%19%58%48%16%19%
977%14%34%14%11%31%3%83%11%51%51%14%6%
Table 6. Number of recommended activities per cluster with threshold sensitivity analysis.
Number of Recommended Activities with Increased Threshold
Threshold Monuments (Threshold 50%)Paintings (Threshold 25%)Historic Sites (Threshold 50%)Urban Heritage (Threshold 25%)Architectural Heritage (Threshold 20%)Festive and Recreational Events (Threshold 50%)Traditional Religious Events (Threshold 13%)Handicrafts (Threshold 50%)Traditional Medicine (Threshold 15%)Culinary Culture (Threshold 50%)Language and Traditions (Threshold 50%)Natrual Habitat (Threshold 25%)Architectural Works (Threshold 15%)
084543121018322
281422101016222
581210101004011
780100001002000
1070100001000000
Number of Recommended Activities with Reduction to the Threshold
084543121018322
284557131029524
584578141059548
7967891610810758
1010679101101010108810
Table 7. User satisfaction evaluation.
AskYes
1. Easy navigation100%
2. Relevance of content100%
3. Effectiveness of information100%
4. Recommendation of the application to other users100%
5. Identification of points of cultural interest100%
Disclaimer/Publisher’s Note: The statements, opinions and data contained in all publications are solely those of the individual author(s) and contributor(s) and not of MDPI and/or the editor(s). MDPI and/or the editor(s) disclaim responsibility for any injury to people or property resulting from any ideas, methods, instructions or products referred to in the content.