
Predicting Mental Health Problems in Gay Men in Peru Using Machine Learning and Deep Learning Models


Abstract
1. Introduction
2. Literature Review
2.1. Sexual Stigma and Social Determinants of Mental Health
2.2. Machine Learning and Deep Learning for Prediction of Mental Health
2.3. Advancements in One-Dimensional Convolutional Neural Networks Architectures for Mental Health Research
3. Materials and Methods
3.1. Study Data and Design
3.2. Machine and Deep Learning Models
3.2.1. XGBoost
3.2.2. Random Forest
3.2.3. Gradient Boosting Machines
3.2.4. Artificial Neural Networks
3.2.5. Logistic Regression
3.2.6. One-Dimensional Convolutional Neural Network (1D-CNN)
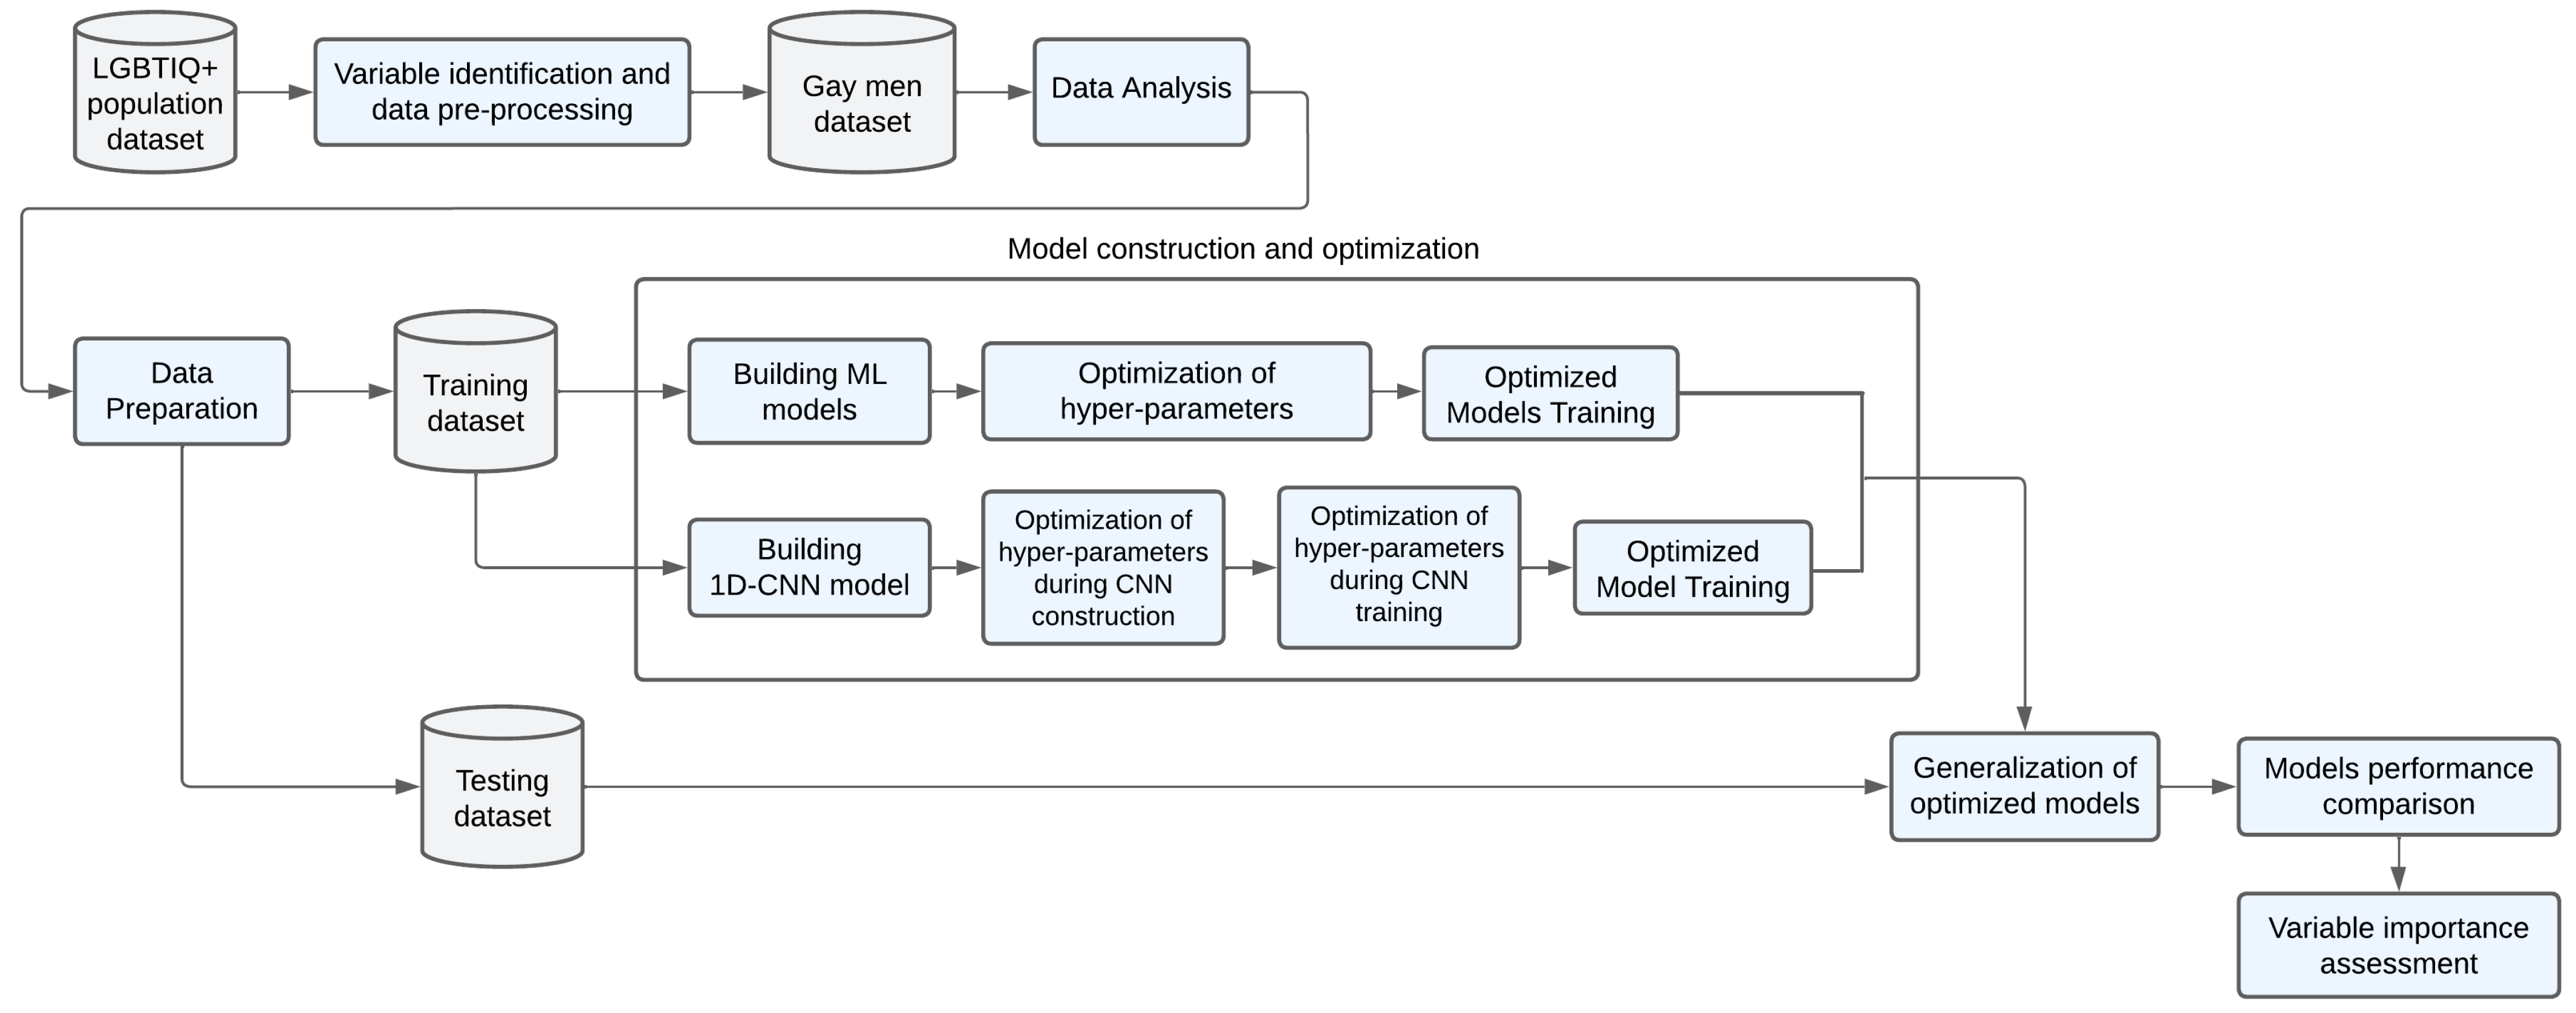
3.3. Methodology
3.3.1. Variable Identification and Selection
3.3.2. Study Sample Preprocessing
3.3.3. Data Analysis
3.3.4. Data Preparation
3.3.5. Models Construction and Optimization
3.3.6. Model Performance Comparison
3.3.7. Feature Importance
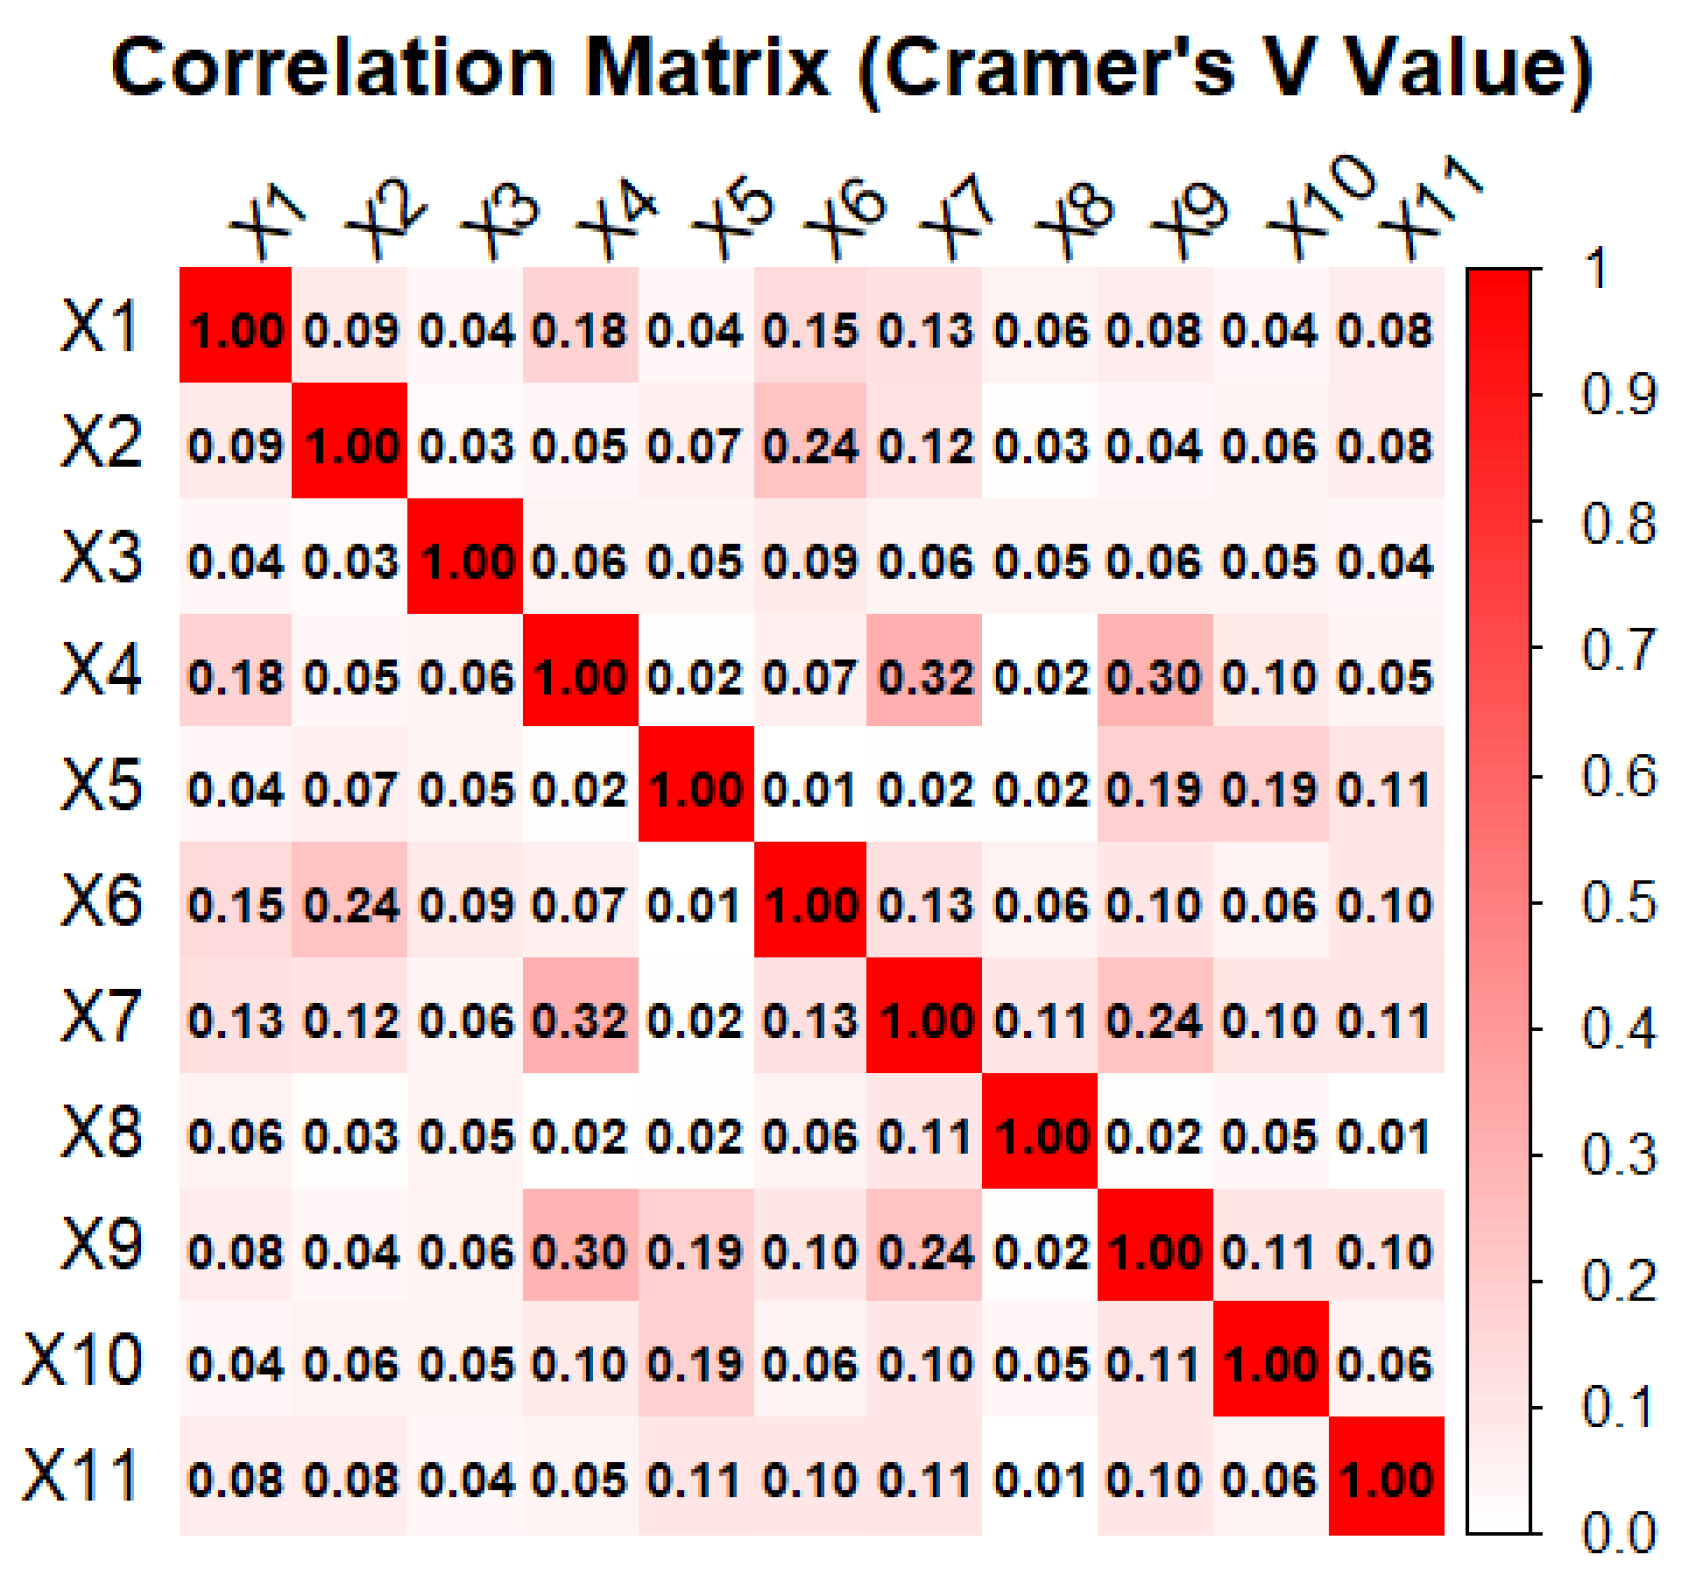
3.3.8. Statistical Analysis
4. Results
4.1. Univariate and Bivariate Analysis of Study Sample
4.2. Development and Optimization of Models
4.2.1. Optimization of ML Models
4.2.2. Optimization During CNN Construction
4.2.3. Optimization During CNN Training
4.3. Comparison of Classifiers for the Prediction
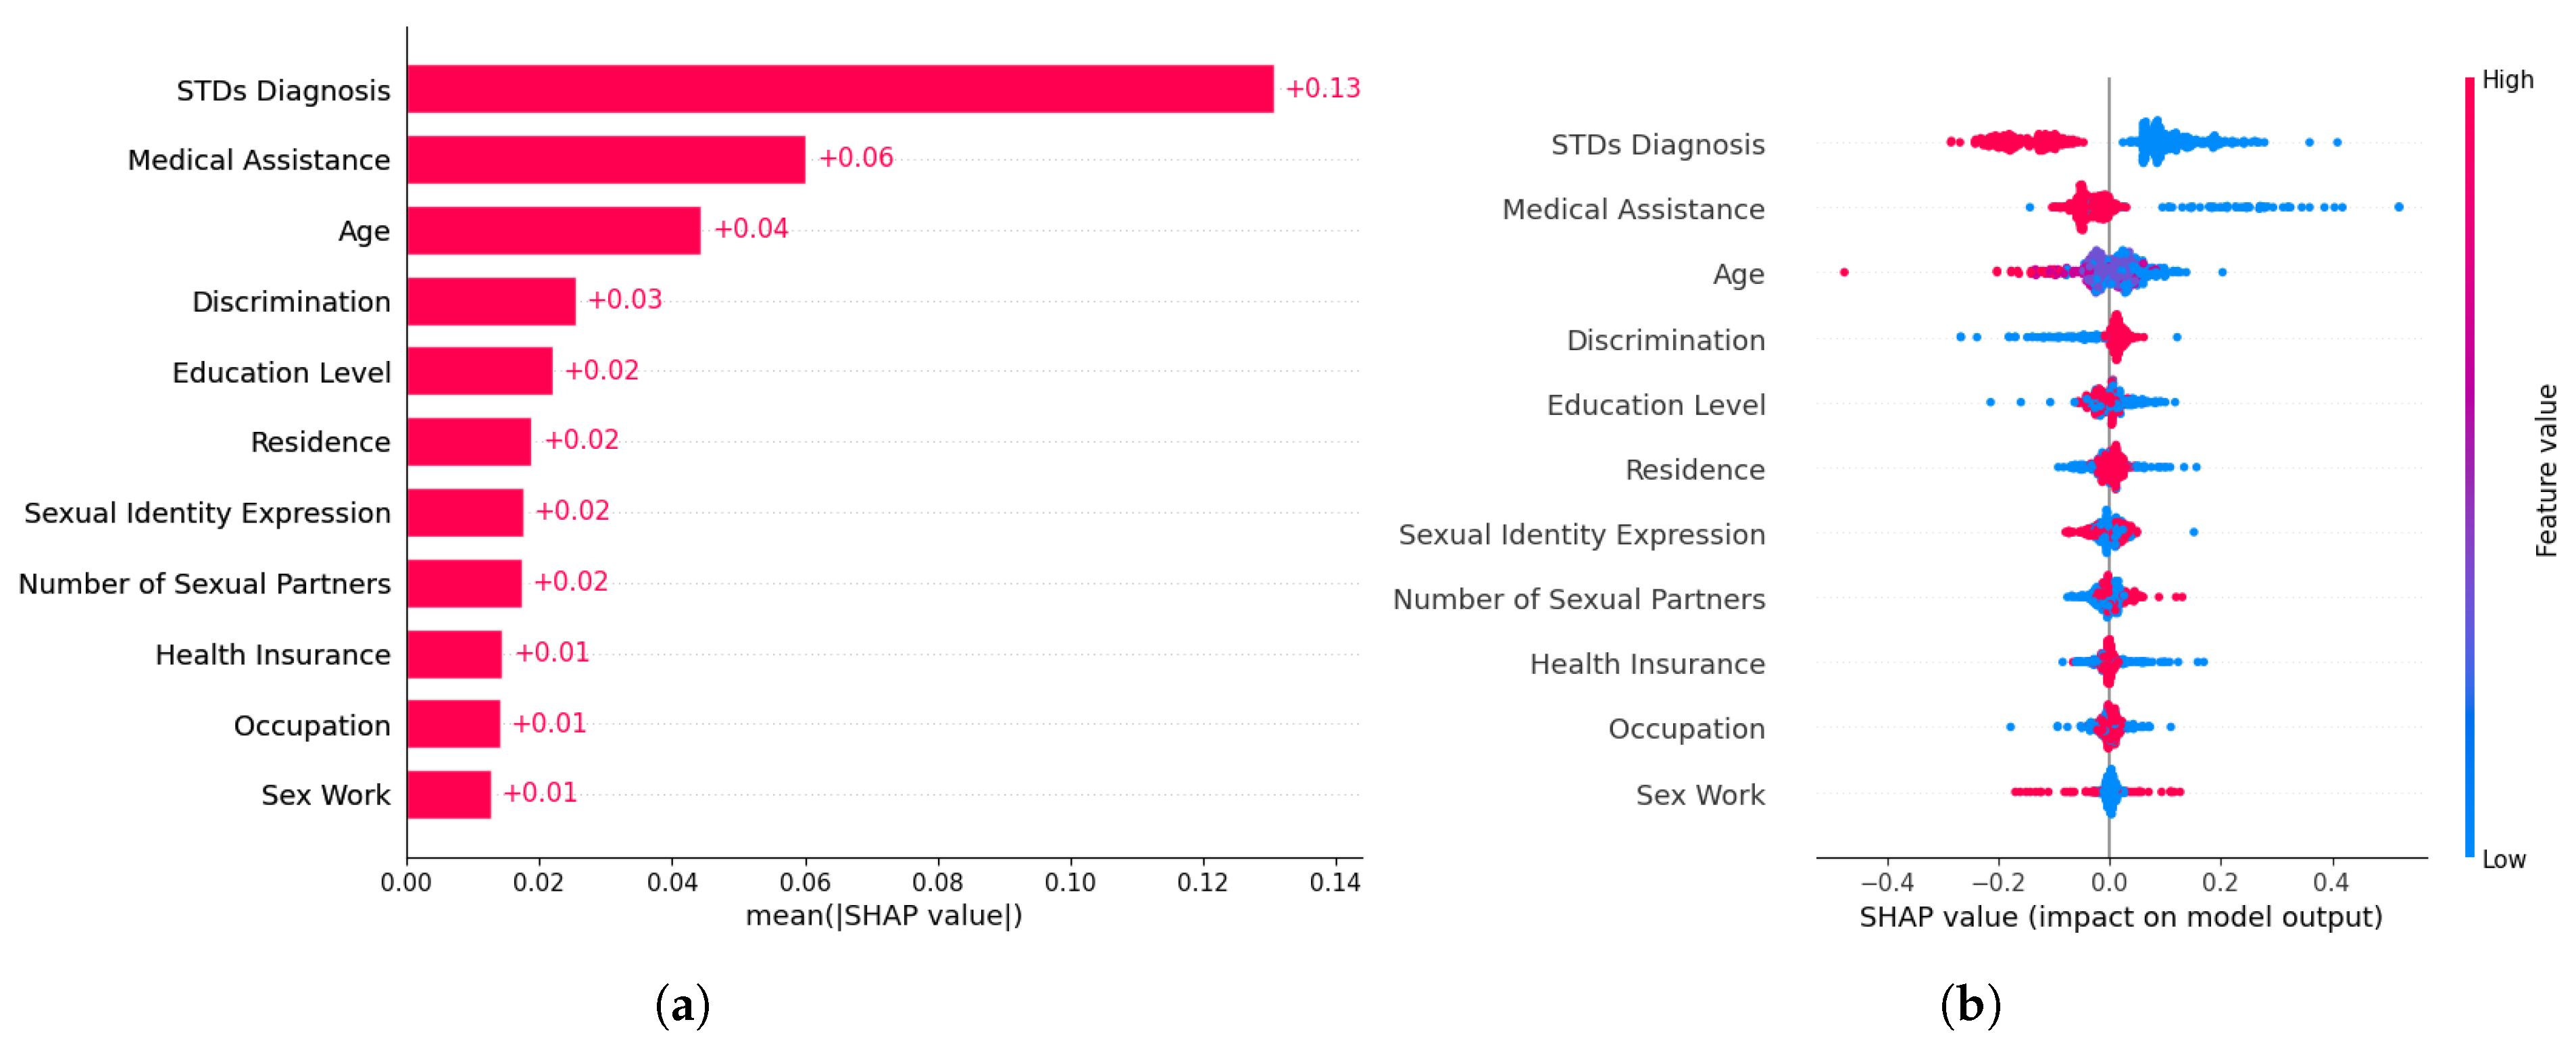
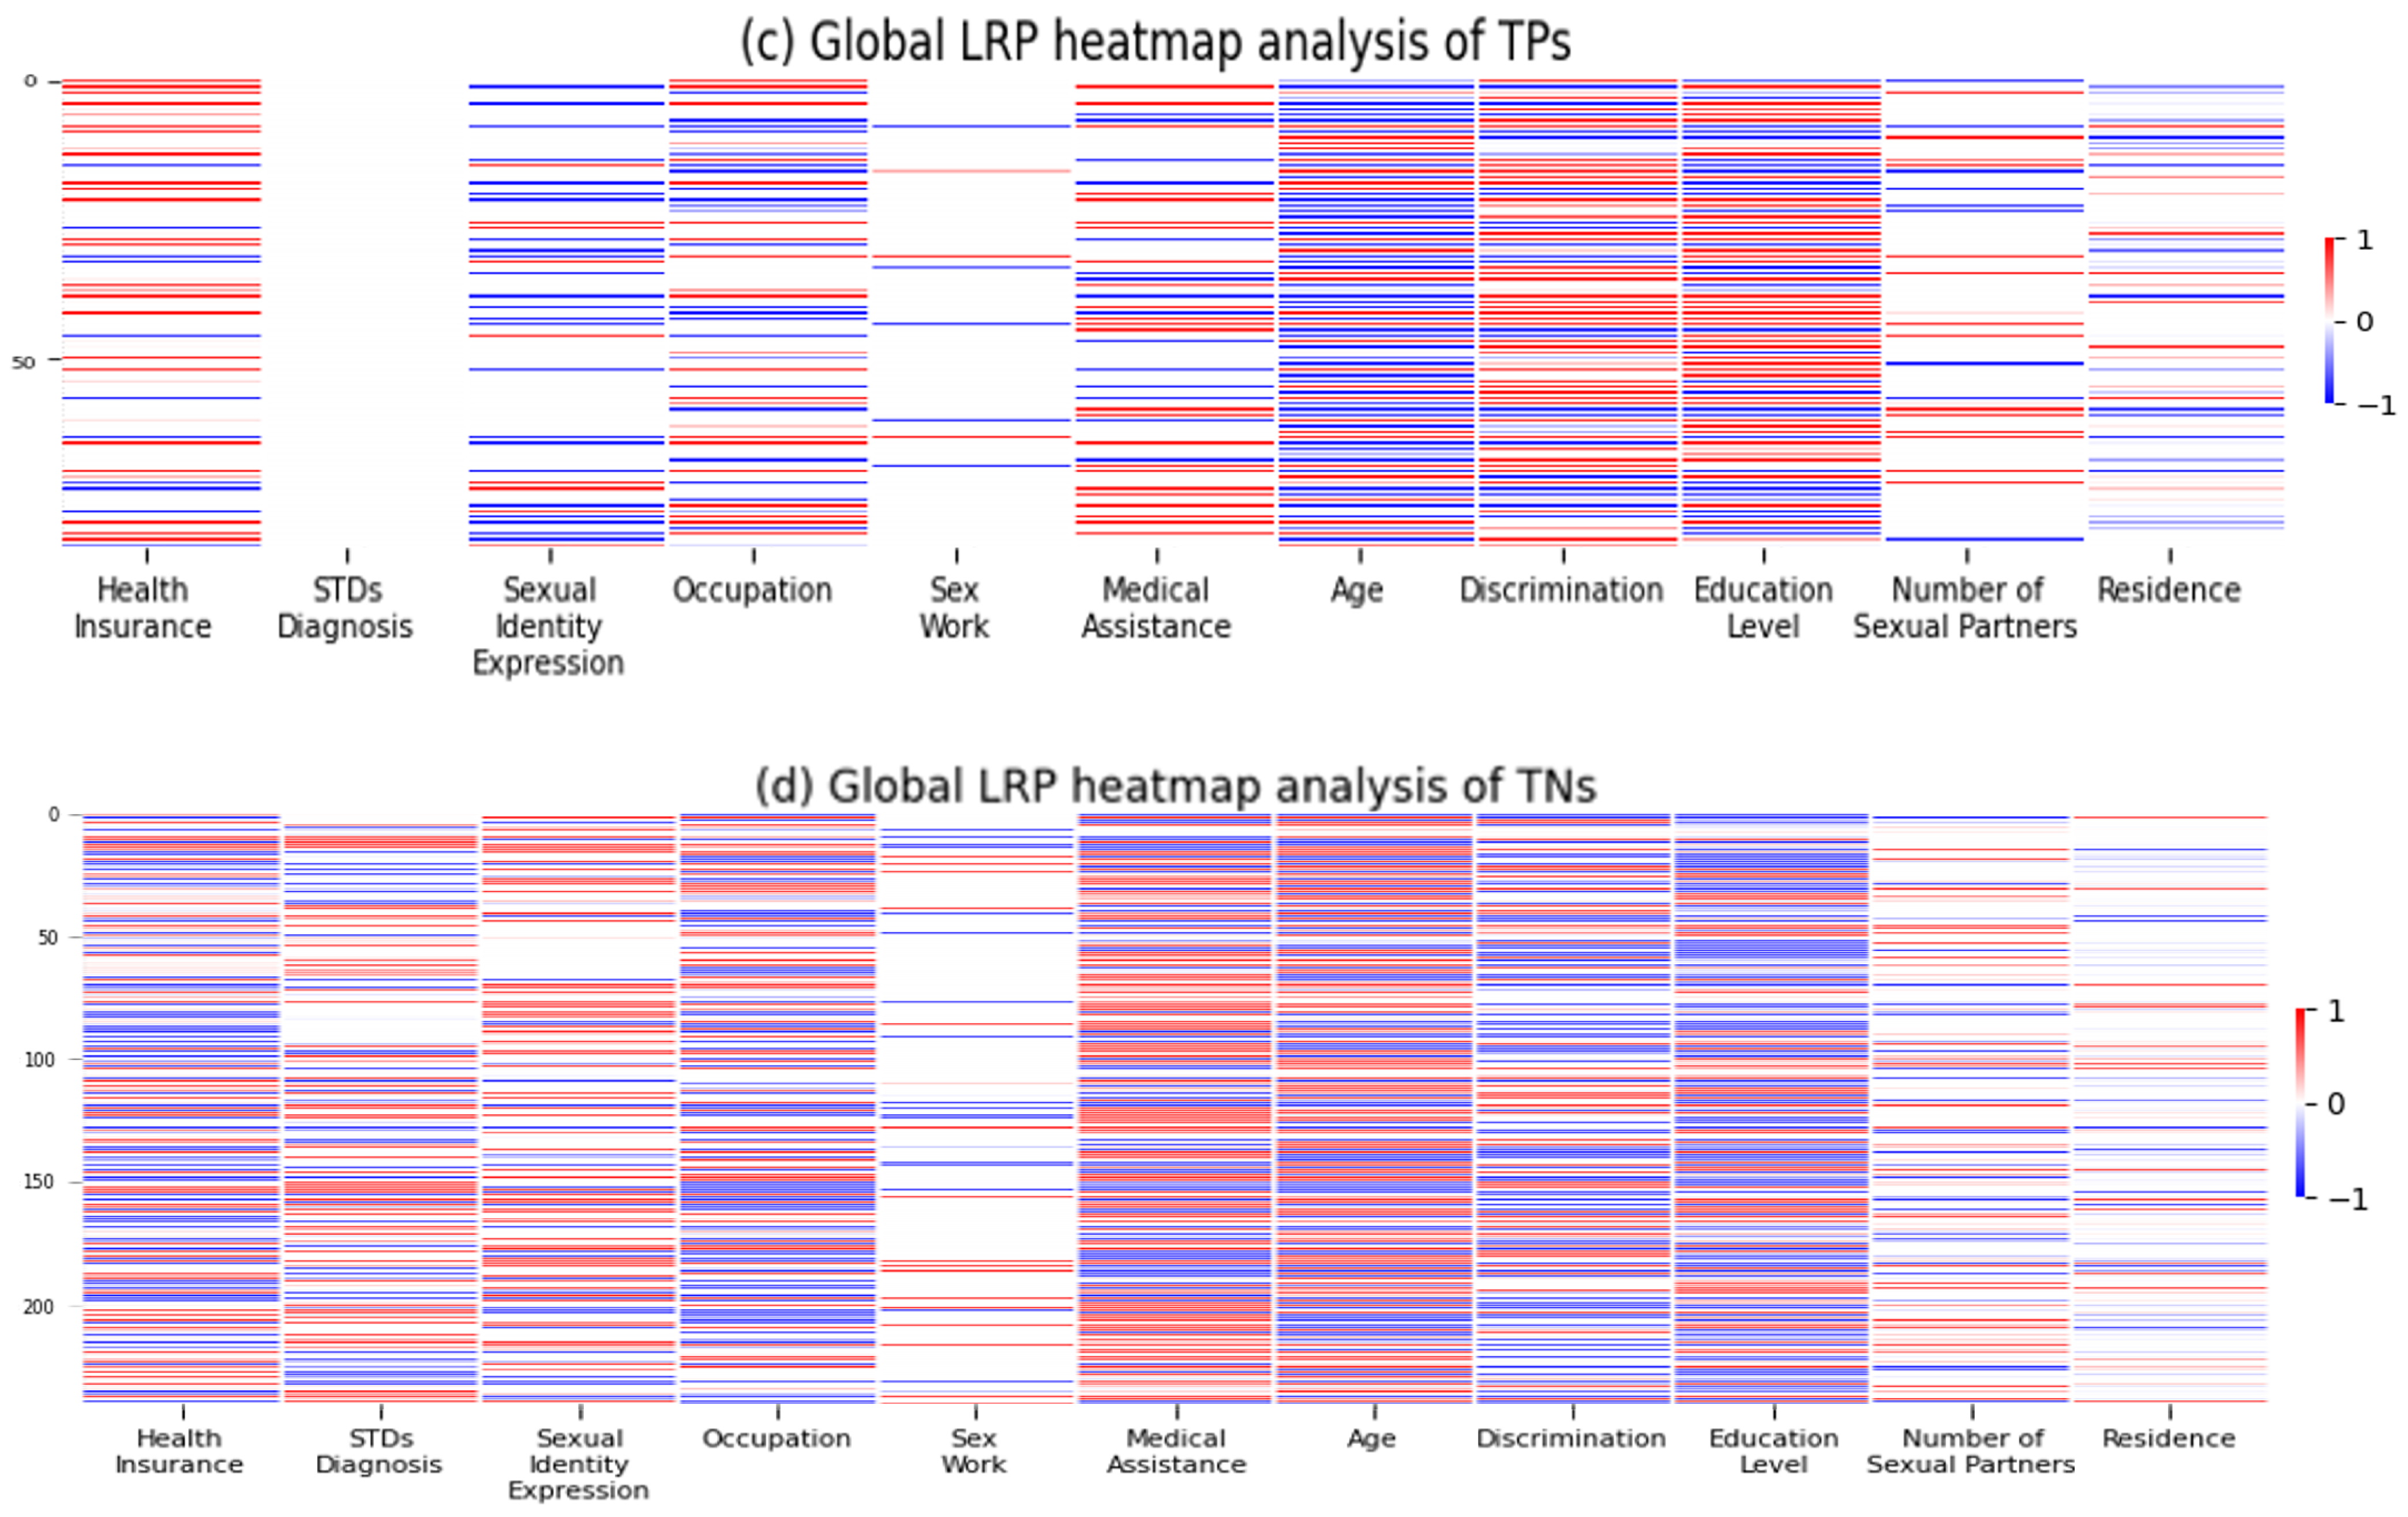
4.4. Feature Importance
5. Discussion
5.1. Summary of Findings
5.2. Mental Health Determinants and Predictive Modeling
6. Conclusions and Recommendations
6.1. Strengths and Limitations
6.2. Study Implications and Future Scope
Supplementary Materials
Author Contributions
Funding
Institutional Review Board Statement
Informed Consent Statement
Data Availability Statement
Conflicts of Interest
Abbreviations
| LGBTIQ+ | Lesbian, Gay, Bisexual, Transgender, Intersex, Queer, and Non-binary, Pansexual, and Asexual |
| ML | Machine Learning |
| DL | Deep Learning |
| AI | Artificial Intelligence |
| CNN | Convolutional Neural Networks |
| RNN | Recurrent Neural Networks |
| EEG | Electroencephalograms |
| NLP | Natural Language Processing |
| BERT | Bidirectional Encoder Representations from Transformers |
| SHAP | Shapley Additive exPlanations |
| MSM | Men Who Have Sex With Other Men |
| LSTM | Long Short-term Memory |
| GRU | Gated Recurrent Unit |
Appendix A

| Variable | Definition | Type | Categories |
|---|---|---|---|
| Mental Health Problems | In the last 12 months, the individual has experienced mental health issues. | Dependent | 1 = Yes 0 = No |
| Health Insurance | Whether the respondent currently has health insurance coverage or not. | Predictor | 1 = Yes 0 = No |
| Number of sexual partners | Indicates the extent of sexual activity within the past 12 months of the interviewee. | Predictor | 0 = No sexual partners 1 = One sexual partner 2 = More than one sexual partner |
| Residence | Refers to the location of the respondent’s primary residence. | Predictor | 1 = Lima 0 = Inland regions |
| Education level | The highest level of education that the respondent has. | Predictor | 0 = No education to incomplete elementary school 1 = Complete elementary school to incomplete high school 2 = Complete high school to incomplete superior education 3 = Complete superior education to postgraduate education |
| Infectious Diseases Diagnosis (STDs diagnosis) | In the last 12 months, the individual has been diagnosed with infectious diseases such as tuberculosis, STIs and HIV. | Predictor | 1 = Yes 0 = No |
| Sexual identity expression | Whether the respondent openly expresses their sexual orientation or gender identity. | Predictor | 1 = Yes 0 = No |
| Occupation | Indicates whether the respondent has engaged in any form of remunerated work within the past 12 months. | Predictor | 1 = Yes 0 = No |
| Sex Work | Whether the respondent has engaged in any form of commercial sexual activity for financial gain. | Predictor | 1 = Yes 0 = No |
| Medical assistance | Whether the interviewee utilized medical services for health-related issues or not in the last 12 months. | Predictor | 1 = Yes 0 = No |
| Discrimination | Whether the respondent has experienced discrimination due to their sexual identity in the past. | Predictor | 1 = Yes 0 = No |
| Age | Age of the respondent | Predictor | 1 = 18–24 years 2 = 25–34 years 3 = 35–44 years 4 = More than 45 years |
| Dependent Variable | Instances | Sample Size | Class 0 | Class 1 |
|---|---|---|---|---|
| Mental Health Problems | Training set (80%) | 1748 | 1063 | 685 |
| Test set (20%) | 438 | 276 | 162 |
References
- Castillo, A.; Cornejo, D. Factores Asociados al Autoreporte de Depresión y Ansiedad en los Últimos Doce Meses en Personas LGTBI vía una Encuesta Virtual en Perú, 2017. Bachelor’s Dissertation, Universidad Peruana de Ciencias Aplicadas, Lima, Peru, 2020. [Google Scholar]
- Soriano-Moreno, D.; Saldaña-Cabanillas, D.; Vasquez-Yeng, L.; Valencia-Huamani, J.; Alave-Rosas, J.; Soriano, A. Discrimination and mental health in the minority sexual population: Cross-sectional analysis of the first peruvian virtual survey. PLoS ONE 2022, 17, E0268755. [Google Scholar] [CrossRef] [PubMed]
- Ponce, D. Factores Asociados a Problemas de Salud Mental. 2022. Análisis de la Primera Encuesta Virtual para Personas LGBTI, Perú. Bachelor’s Dissertation, Universidad Ricardo Palma, Lima, Peru, 2017. [Google Scholar]
- Castaneda, J.; Poma, N.; Mougenot, B.; Herrera-Añazco, P. Association between the Expression of Sexual Orientation and/or Gender Identity and Mental Health Perceptions in the Peruvian LGBTI Population. Int. J. Environ. Res. Public Health 2023, 20, 5655. [Google Scholar] [CrossRef] [PubMed]
- Herek, G.; Garnets, L. Sexual orientation and mental health. Annu. Rev. Clin. Psychol. 2007, 3, 353–375. [Google Scholar] [CrossRef]
- Alegría, M.; NeMoyer, A.; Falgàs, I.; Wang, Y.; Alvarez, K. Social Determinants of Mental Health: Where We Are and Where We Need to Go. Curr. Psychiatry Rep. 2018, 20, 95. [Google Scholar] [CrossRef] [PubMed]
- Más Igualdad Perú. II Estudio de Salud Mental LGBTIQ+—Informe Final. 2024. Available online: https://www.masigualdad.pe/_files/ugd/4aec54_c8d6e0ecec9c43fab85c79aaa04bbbd1.pdf (accessed on 10 January 2025).
- INEI (National Institute of Statistics and Informatics). Primera Encuesta Virtual para Personas LGBTI 2017: Principales Resultados. 2017. Available online: https://www.inei.gob.pe/media/MenuRecursivo/boletines/lgbti.pdf (accessed on 10 January 2025).
- Más Igualdad Perú. Salud Mental de Personas LGBTQ+ en Perú—Informe Final. 2021. Available online: https://www.masigualdad.pe/_files/ugd/4aec54_d267bbb3a8564e1980f90ccd15281c39.pdf (accessed on 11 January 2025).
- Roth, C.; Papassotiropoulos, A.; Brühl, A.; Lang, U.; Huber, C. Psychiatry in the Digital Age: A Blessing or a Curse? Int. J. Environ. Res. Public Health 2021, 18, 8302. [Google Scholar] [CrossRef]
- Graham, S.; Depp, C.; Lee, E.; Nebeker, C.; Tu, X.; Kim, H.; Jeste, D. Artificial Intelligence for Mental Health and Mental Illnesses: An Overview. Curr. Psychiatry Rep. 2019, 21, 116. [Google Scholar] [CrossRef]
- Iyortsuun, N.; Kim, S.; Jhon, M.; Yang, H.; Pant, S. A Review of Machine Learning and Deep Learning Approaches on Mental Health Diagnosis. Healthcare 2023, 11, 285. [Google Scholar] [CrossRef]
- Huang, Z. Prediction of Mental Problem Based on Deep Learning Models. Appl. Comput. Eng. 2025, 138, 56–63. [Google Scholar] [CrossRef]
- Madububambachu, U.; Ukpebor, A.; Ihezue, U. Machine Learning Techniques to Predict Mental Health Diagnoses: A Systematic Literature Review. Clin. Pract. Epidemiol. Ment. Health 2024, 20, e17450179315688. [Google Scholar] [CrossRef]
- Kundu, N.; Chaiton, M.; Billington, R.; Grace, D.; Fu, R.; Logie, C.; Baskerville, B.; Yager, C.; Mitsakakis, N.; Schwartz, R. Machine Learning Applications in Mental Health and Substance Use Research Among the LGBTQ2S+ Population: Scoping Review. JMIR Med. Inf. 2021, 9, e28962. [Google Scholar] [CrossRef]
- Chapagain, S. Predictive Insights into LGBTQ+ Minority Stress: A Transductive Exploration of Social Media Discourse. arXiv 2024, arXiv:2411.13534v1. [Google Scholar]
- Malik, M.; Iqbal, S.; Noman, M.; Sarfraz, Z.; Sarfraz, A.; Mustafa, S. Mental Health Disparities Among Homosexual Men and Minorities: A Systematic Review. Am. J. Men’s Health 2023, 17, 15579883231176646. [Google Scholar] [CrossRef]
- Frost, D.; Meyer, I.; Lin, A.; Wilson, B.; Lightfoot, M.; Russell, S.; Hammack, P. Social Change and the Health of Sexual Minority Individuals: Do the Effects of Minority Stress and Community Connectedness Vary by Age Cohort? Arch. Sex. Behav. 2022, 51, 2299–2316. [Google Scholar] [CrossRef] [PubMed]
- Herek, G.; Gillis, J.; Cogan, J. Internalized Stigma Among Sexual Minority Adults: Insights From a Social Psychological Perspective. J. Couns. Psychol. 2009, 56, 32–43. [Google Scholar] [CrossRef]
- World Health Organization; Calouste Gulbenkian Foundation. Social Determinants of Mental Health; World Health Organization: Geneva, Switzerland, 2014; Available online: https://iris.who.int/bitstream/handle/10665/112828/9789241506809_eng.pdf (accessed on 21 January 2025).
- Kirkbride, J.; Anglin, D.; Colman, I.; Dykxhoorn, J.; Jones, P.; Patalay, P.; Pitman, A.; Soneson, E.; Steare, T.; Wright, T.; et al. The social determinants of mental health and disorder: Evidence, prevention and recommendations. World Psychiatry Off. J. World Psychiatr. Assoc. 2024, 23, 58–90. [Google Scholar] [CrossRef] [PubMed]
- Zhang, Y.; Chen, S.; Akintunde, T.; Okagbue, E.; Isangha, S.; Musa, T. Life course and mental health: A thematic and systematic review. Front. Psychol. 2024, 15, 1329079. [Google Scholar] [CrossRef]
- Shim, R.; Compton, M. Addressing the Social Determinants of Mental Health: If Not Now, When? If Not Us, Who? Psychiatr. Serv. 2018, 69, 2018000. [Google Scholar] [CrossRef]
- Burrichter, K. The use of machine learning algorithms to predict mental health outcomes based on behavioral data collected through digital devices. Arch. Clin. Psychiatry 2022, 49, 122–129. [Google Scholar]
- Zawad, R.; Haque, Y.; Kaiser, M.; Mahmud, M.; Chen, T. Computational Intelligence in Depression Detection. In Artificial Intelligence in Healthcare—AI in Mental Health; Chen, T., Carter, J., Mahmud, M., Khuman, A., Eds.; Springer Nature: Singapore, 2022; pp. 1–19. [Google Scholar] [CrossRef]
- Saleh, A.; Xian, L. Stress Classification using Deep Learning with 1D Convolutional Neural Networks. Knowl. Eng. Data Sci. 2021, 4, 145–152. [Google Scholar] [CrossRef]
- Awan, A.; Taj, I.; Khalid, S.; Usman, S.; Imran, A.; Akram, M. Advancing Emotional Health Assessments: A Hybrid Deep Learning Approach Using Physiological Signals for Robust Emotion Recognition. IEEE Access 2024, 12, 141890–141904. [Google Scholar] [CrossRef]
- Ige, A.; Sibiya, M. State-of-the-Art in 1D Convolutional Neural Networks: A Survey. IEEE Access 2024, 12, 144082–144105. [Google Scholar] [CrossRef]
- Romani, L.; Ladera-Porta, K.; Quiñones-Laveriano, D.; Rios-Garcia, W.; Juarez-Ubillus, A.; Vilchez-Cornejo, J. Factors associated with the non-use of health services in LGBTI people from Peru. Rev. Peru. Med. Exp. Salud Publ. 2021, 38, 240–247. [Google Scholar] [CrossRef] [PubMed]
- Noorunnahar, M.; Chowdhury, A.; Mila, F. A tree-based eXtreme Gradient Boosting (XGBoost) machine learning model to forecast the annual rice production in Bangladesh. PLoS ONE 2023, 18, e0283452. [Google Scholar] [CrossRef]
- Kulkarni, V.; Sinha, P. Random Forest Classifiers: A Survey and Future Research Directions. Int. J. Adv. Comput. 2013, 36, 1144–1153. [Google Scholar]
- Touzani, S.; Granderson, J.; Fernandes, S. Gradient boosting machine for modeling the energy consumption of commercial buildings. Energy Build. 2018, 158, 1533–1543. [Google Scholar] [CrossRef]
- Bonilla, M.; Olmeda, I.; Puertas, R. Modelos paramétricos y no paramétricos en problemas de credit scoring. Rev. Esp. Financ. Contab. 2003, 32, 833–869. [Google Scholar]
- Hosmer, D.; Lemeshow, S.; Sturdivant, R. Introduction to the Logistic Regression Model. In Applied Logistic Regression; John Wiley & Sons: Hoboken, NJ, USA, 2013; pp. 1–35. [Google Scholar]
- Qazi, E.; Almorjan, A.; Zia, T. A One-Dimensional Convolutional Neural Network (1D-CNN) Based Deep Learning System for Network Intrusion Detection. Appl. Sci. 2022, 12, 7986. [Google Scholar] [CrossRef]
- Hernández-Vásquez, A.; Chacón-Torrico, H. Manipulación, análisis y visualización de datos de la encuesta demográfica y de salud familiar con el programa R. Rev. Peru. Med. Exp. Salud Publ. 2019, 36, 128–133. [Google Scholar] [CrossRef]
- Lateef, R.; Abbas, A. Tuning the Hyperparameters of the 1D CNN Model to Improve the Performance of Human Activity Recognition. Eng. Technol. J. 2022, 40, 547–554. [Google Scholar] [CrossRef]
- Lundberg, S.; Lee, S. A unified approach to interpreting model predictions. In Proceedings of the 31st International Conference on Neural Information Processing Systems (NIPS 2017), Long Beach, CA, USA, 4–9 December 2017. [Google Scholar] [CrossRef]
- Sahakyan, M.; Aung, Z.; Rahwan, T. Explainable artificial intelligence for tabular data: A survey. IEEE Access 2021, 9, 135392–135422. [Google Scholar] [CrossRef]
- Ullah, I.; Rios, A.; Gala, V.; Mckeever, S. Explaining Deep Learning Models for Tabular Data Using Layer-Wise Relevance Propagation. Appl. Sci. 2022, 12, 136. [Google Scholar] [CrossRef]
- Guerra, M. Análisis Exploratorio Sobre la Violencia y/o Discriminación Reportados por Personas LGBTI en el Perú, 2017. Bachelor’s Dissertation, Universidad Peruana de Ciencias Aplicadas, Lima, Peru, 2023. [Google Scholar]
- Trust for America’s Health. Addressing the Social Determinants of Health Inequities Among Gay Men and Other Men Who Have Sex with Men in the United States. 2014. Available online: https://www.tfah.org/wp-content/uploads/archive/assets/files/TFAH-2014-MSM-Report-final.pdf (accessed on 6 February 2023).
- Lamontagne, E.; Leroy, V.; Yakusik, A.; Parker, W.; Howell, S.; Ventelou, B. Assessment and determinants of depression and anxiety on a global sample of sexual and gender diverse people at high risk of HIV: A public health approach. BMC Public Health 2024, 24, 215. [Google Scholar] [CrossRef]
- Zhang, X.; Zhou, Y.; Zhang, K. Social capital, perceived stress, and mental health of men who have sex with men in China: A cross-sectional study. Front. Psychol. 2023, 14, 1134198. [Google Scholar] [CrossRef]
- Bränström, R.; Hughes, T.; Pachankis, J. Global LGBTQ Mental Health. In Global LGBTQ Health; Springer: Berlin, Germany, 2024; pp. 45–78. [Google Scholar]
- Radhika, C.; Shraddha, N.; Vaishnavi, P.; Shirisha, K. Prediction of Mental Health Instability using Machine Learning and Deep Learning Algorithms. J. Comput. Sci. Appl. 2023, 15, 47–58. [Google Scholar]
- Laijawala, V.; Aachaliya, A.; Jatta, H.; Pinjarkar, V. Mental Health Prediction using Data Mining: A Systematic Review. In Proceedings of the 3rd International Conference on Advances in Science & Technology (ICAST), Bahir Dar, Ethiopia, 4–6 November 2022. [Google Scholar]
- Madineni, S. Mental Health Survey Analysis & Prediction Using Deep Learning Algorithms. In Proceedings of the Symposium of Student Scholars, Kennesaw, GA, USA, 18–21 April 2023; Available online: https://digitalcommons.kennesaw.edu/undergradsymposiumksu/spring2023/presentations/113 (accessed on 15 April 2025).
- Taye, M. Understanding of Machine Learning with Deep Learning: Architectures, Workflow, Applications and Future Directions. Computers 2023, 12, 91. [Google Scholar] [CrossRef]
- Karima, S.; Ouassila, H. An overview of machine learning and deep learning. Alger. J. Sci. 2021, 14, 139–143. [Google Scholar]
- Singh, K.; Mahajan, A.; Mansotra, V. 1D-CNN based Model for Classification and Analysis of Network Attacks. Int. J. Adv. Comput. Sci. Appl. 2021, 12, 604–613. [Google Scholar] [CrossRef]
- Xiao, D.; Chen, Y.; Li, D. One-Dimensional Deep Learning Architecture for Fast Fluorescence Lifetime Imaging. IEEE J. Sel. Top. Quantum Electron. 2021, 27, 7000210. [Google Scholar] [CrossRef]
- Odeniyi, O.; Oyinloye, O.; Thompson, A. Fraud Detection Using Multilayer Perceptron and Convolutional Neural Network. Int. J. Adv. Secur. 2021, 14, 1–11. [Google Scholar]
- Zhou, P. Capacity estimation of retired lithium-ion batteries using random charging segments from massive real-world data. Cell Rep. Phys. Sci. 2021, 6, 102444. [Google Scholar] [CrossRef]
- See, J. What it Means to Suffer in Silence. Challenges to Mental Health Access among LGBT People, 2019. Galen Centre for Health and Social Policy. Available online: https://galencentre.org/wp-content/uploads/2019/04/PFA02_2019_Challenges-to-Mental-Health-Access-Among-LGBT-People.pdf (accessed on 5 June 2025).
- Zuiderwijk, A.; Chen, Y.; Salem, F. Implications of the use of artificial intelligence in public governance: A systematic literature review and a research agenda. Gov. Inf. Q. 2021, 38, 101577. [Google Scholar] [CrossRef]


| Algorithm | Hyperparameter | Definition |
|---|---|---|
| LR | - | - |
| ANN | max_iter | Defines the maximum number of iterations the model will run before stopping |
| hidden_layer_sizes | Specifies the number of neurons in the hidden layer of the network | |
| momentum | Controls the momentum factor used in the gradient descent update | |
| learning rate | Determines the step size for updating the model’s weights during training | |
| RF | n_estimators | Specifies the number of decision trees in the forest |
| max_features | Defines the number of features considered for finding the best split | |
| max_depth | Sets the maximum depth allowed for each tree in the forest | |
| criterion | Determines the function used to evaluate the quality of a split | |
| XGBoost | max_depth | Defines the maximum depth of individual estimators |
| n_estimators | Specifies the number of boosting iterations to be performed | |
| learning_rate | Scales the contribution of each tree to the overall model | |
| min_split_loss | Regularization parameter that sets the minimum loss reduction required to allow a split | |
| GBM | learning_rate | Controls the contribution of each tree to the final prediction |
| max_depth | Sets the maximum depth of each tree | |
| subsample | Defines the fraction of training data used per boosting iteration | |
| n_estimators | Specifies the number of boosting iterations (trees) |
| Parameter | Value |
|---|---|
| Optimizer | Adam |
| Batch size | 32 |
| Kernel size | 2 |
| Epochs | 200 |
| Loss | Binary Cross-Entropy |
| Convolutional and pooling layers activation function | ReLu |
| Fully connected layers activation function | Sigmoid |
| Learning rate | 0.001 |
| Predicted Class | ||
|---|---|---|
| True Class | Negative | Positive |
| Negative | True Negative (TN) | False Positive (FP) |
| Positive | False Negative (FN) | True Positive (TP) |
| Mental Health Problems | |||||
|---|---|---|---|---|---|
| Yes (n = 847) | No (n = 1339) | χ2 Test | GVIF | ||
| Characteristics | n/% | n/% | p-Value | Value | |
| Health Insurance | |||||
| Yes | 576 (68.0%) | 1036 (77.4%) | <0.01 *** | 1.03 | |
| No | 271 (32.0%) | 303 (22.6%) | |||
| Number of sexual partners | <0.01 *** | 1.02 | |||
| No sexual partners | 539 (63.6%) | 748 (55.9%) | |||
| One sexual partner | 297 (35.1%) | 573 (42.8%) | |||
| More than one sexual partner | 11 (1.3%) | 18 (1.3%) | |||
| Residence | <0.01 *** | 1.02 | |||
| Lima | 573 (67.7%) | 956 (71.4%) | |||
| Inland regions | 274 (32.3%) | 383 (28.6%) | |||
| Education level | <0.01 *** | 1.05 | |||
| No education to incomplete elementary school | 1 (0.1%) | 4 (0.3%) | |||
| Complete elementary school to incomplete high school | 10 (1.2%) | 9 (0.7%) | |||
| Complete high school to incomplete superior education | 444 (52.4%) | 567 (42.3%) | |||
| Complete superior education to postgraduate education | 392 (46.3%) | 759 (56.7%) | |||
| Infectious diseases diagnosis | <0.01 *** | 1.02 | |||
| Yes | 155 (18.3%) | 712 (53.2%) | |||
| No | 692 (81.7%) | 627 (46.8%) | |||
| Sexual identity expression | <0.01 *** | 1.01 | |||
| Yes | 335 (39.6%) | 625 (46.7%) | |||
| No | 512 (60.4%) | 714 (53.3%) | |||
| Occupation | <0.01 *** | 1.09 | |||
| Yes | 500 (59.0%) | 911 (68.0%) | |||
| No | 347 (41.0%) | 428 (32.0%) | |||
| Sex Work | <0.01 *** | 1.03 | |||
| Yes | 106 (12.5%) | 195 (14.6%) | |||
| No | 741 (87.5%) | 1144 (85.4%) | |||
| Medical assistance | <0.01 *** | 1.02 | |||
| Yes | 627 (74.0%) | 1297 (96.9%) | |||
| No | 220 (26.0%) | 42 (3.1%) | |||
| Discrimination | <0.01 *** | 1.01 | |||
| Yes | 720 (85.0%) | 1039 (77.6%) | |||
| No | 127 (15.0%) | 300 (22.4%) | |||
| Age | <0.01 *** | 1.05 | |||
| 18–24 years | 399 (47.1%) | 407 (30.4%) | |||
| 25–34 years | 326 (38.5%) | 610 (45.6%) | |||
| 35–44 years | 82 (9.7%) | 218 (16.3%) | |||
| More than 45 years | 40 (4.7%) | 104 (7.8%) | |||
| Model | Hyper-Parameter | Tested Values | Optimal Values | Best Validation Accuracy |
|---|---|---|---|---|
| LR | - | - | - | 70.77% |
| ANN | Number of neurons | 2–26 | 16 | 71.22% |
| Max iterations | 250–500–750–1000 | 500 | ||
| Learning rate | 0.1–0.5–0.01 | 0.01 | ||
| Momentum | 0.4–0.9 | 0.7 | ||
| RF | Number of estimators | 100–200 | 160 | 72.14% |
| Max features | sqrt-log2 | log2 | ||
| Max depth | 4–12 | 8 | ||
| Criterion | Gini–Entropy | Entropy | ||
| GBM | Learning rate | 0.01–0.025–0.05–0.075–0.1 | 0.1 | 72.77% |
| Max depth | 2–10 | 4 | ||
| Subsample | 0.5–1.0 | 0.9 | ||
| Number of estimators | 10–100 | 10 | ||
| XGBoost | Max depth | 2–10 | 6 | 72.48% |
| Number of estimators | 20–220 | 100 | ||
| Learning rate | 0.1–0.01–0.05–0.075 | 0.01 | ||
| Min split loss | 0–0.2–0.4–0.6–0.8–1.0 | 1.0 |
| Model | Filter Values |
|---|---|
| Model 1 | Filter: 75-50-25 (Conv1D) & 25-1 (Dense) |
| Model 2 | Filter: 50-25-10 (Conv1D) & 10-1 (Dense) |
| Model 3 | Filter: 30-15-5 (Conv1D) & 10-1 (Dense) |
| Model 4 | Filter: 20-10-5 (Conv1D) & 5-1 (Dense) |
| Model 5 | Filter: 100-50-25 (Conv1D) & 20-1 (Dense) |
| Model 6 | Filter: 120-100-120 (Conv1D) & 40-1 (Dense) |
| Model 7 | Filter: 150-100-50 (Conv1D) & 25-1 (Dense) |
| Model 8 | Filter: 20-10-5 (Conv1D) & 10-1 (Dense) |
| Iteration N° | Model 1 | Model 2 | Model 3 | Model 4 | Model 5 | Model 6 | Model 7 | Model 8 |
|---|---|---|---|---|---|---|---|---|
| 1 | 72.60% | 73.29% | 70.09% | 71.23% | 71.92% | 70.78% | 71.23% | 71.00% |
| 2 | 71.23% | 73.29% | 68.49% | 71.23% | 71.23% | 70.09% | 70.55% | 70.09% |
| 3 | 71.92% | 73.06% | 70.55% | 70.78% | 71.46% | 69.41% | 69.86% | 70.55% |
| 4 | 71.92% | 74.20% | 71.00% | 71.00% | 71.23% | 70.09% | 69.86% | 69.41% |
| 5 | 72.60% | 75.11% | 71.23% | 71.23% | 70.55% | 69.86% | 70.78% | 72.15% |
| 6 | 71.92% | 73.14% | 71.92% | 71.00% | 71.00% | 69.41% | 70.09% | 71.00% |
| 7 | 72.60% | 74.05% | 72.60% | 70.55% | 71.46% | 71.00% | 71.92% | 71.92% |
| 8 | 72.29% | 73.06% | 70.09% | 71.92% | 71.23% | 71.23% | 72.15% | 71.70% |
| 9 | 73.00% | 73.00% | 70.55% | 70.55% | 70.78% | 70.78% | 72.29% | 70.78% |
| 10 | 71.23% | 72.60% | 71.92% | 72.60% | 71.92% | 70.78% | 70.55% | 73.06% |
| Avg. acc. | 72.13% | 73.48% | 70.84% | 71.21% | 71.28% | 70.34% | 70.93% | 71.17% |
| Std. dev. | ±0.0060 | ±0.0075 | ±0.0117 | ±0.0063 | ±0.0044 | ±0.0066 | ±0.0093 | ±0.0107 |
| Iteration N° | Kernel = 2 | Kernel = 3 | Kernel = 5 | Kernel = 7 | Kernel = 11 |
|---|---|---|---|---|---|
| 1 | 71.92% | 73.06% | 70.78% | 71.00% | 69.41% |
| 2 | 74.43% | 71.92% | 73.29% | 71.46% | 70.55% |
| 3 | 72.60% | 74.89% | 73.29% | 71.92% | 70.32% |
| 4 | 73.52% | 72.60% | 71.92% | 69.18% | 70.09% |
| 5 | 72.83% | 74.20% | 72.15% | 70.09% | 69.18% |
| 6 | 72.60% | 74.43% | 70.55% | 71.00% | 71.00% |
| 7 | 73.14% | 73.14% | 72.60% | 71.46% | 70.09% |
| 8 | 73.06% | 73.29% | 73.14% | 69.41% | 70.75% |
| 9 | 73.52% | 72.60% | 72.60% | 71.92% | 69.18% |
| 10 | 73.00% | 73.29% | 72.52% | 70.09% | 69.00% |
| Avg. acc. | 73.06% | 73.34% | 72.28% | 70.75% | 69.96% |
| Std. dev. | ±0.0067 | ±0.0092 | ±0.0097 | ±0.0100 | ±0.0072 |
| Architecture | Description | Hyper-Parameters Values |
|---|---|---|
| Architecture 1 (A1) | 2 successive convolutional layers followed by a max-pooling layer, a convolutional layer, a global average pooling layer and a dense layer | Filters: 50-25-10
(conv), 10 (dense). Kernel: 3. |
| Architecture 2 (A2) | 2 additional consecutive convolutional layers and a max-pooling layer were added to A1 | Filters: 50-25-50-25-10 (conv), 10 (dense). Kernel: 3. |
| Architecture 3 (A3) | 2 additional consecutive dense layers were added to A1 | Filters: 50-25-10 (conv), 20-15-10 (dense). Kernel: 3. |
| Architecture 4 (A4) | 2 additional consecutive convolutional layers, a max-pooling layer and 2 additional consecutive dense layers were added to A1 | Filters: 50-25-50-25-10 (conv), 20-15-10 (dense). Kernel: 3. |
| Architecture 5 (A5) | A dropout layer was added to A1 after the dense layer | Filters: 50-25-10 (conv), 10 (dense). Kernel: 3. Dropout value: 0.1 |
| Architecture 6 (A6) | The dropout value was increased to 0.2 for the A5 | Filters: 50-25-10 (conv), 10 (dense). Kernel: 3. Dropout value: 0.2 |
| Architecture 7 (A7) | Batch normalization layers were added after each convolutional and dense layers for the A6 | Filters: 50-25-10 (conv), 10 (dense). Kernel: 3. Dropout value: 0.2 |
| Architecture 8 (A8) | A flatten layer was added after the global average pooling layer for the A6 | Filters: 50-25-10 (conv), 10 (dense). Kernel: 3. Dropout value: 0.2 |
| Architecture 9 (A9) | A flatten layer was added after the global average pooling layer for the A7 | Filters: 50-25-10 (conv), 10 (dense). Kernel: 3. Dropout value: 0.2 |
| Iteration | A1 | A2 | A3 | A4 | A5 | A6 | A7 | A8 | A9 |
|---|---|---|---|---|---|---|---|---|---|
| 1 | 73.29% | 69.86% | 72.60% | 72.37% | 72.37% | 74.66% | 73.97% | 72.15% | 72.37% |
| 2 | 73.29% | 73.74% | 71.92% | 72.15% | 72.60% | 73.97% | 74.66% | 72.15% | 73.97% |
| 3 | 73.06% | 70.09% | 72.15% | 69.86% | 72.60% | 73.97% | 73.97% | 72.60% | 73.06% |
| 4 | 74.20% | 68.72% | 71.69% | 70.32% | 72.60% | 73.52% | 74.66% | 73.52% | 72.15% |
| 5 | 75.11% | 72.38% | 72.83% | 71.46% | 76.03% | 74.20% | 73.97% | 72.83% | 73.52% |
| 6 | 73.14% | 69.86% | 72.60% | 72.60% | 72.37% | 74.20% | 73.52% | 72.37% | 73.06% |
| 7 | 74.05% | 72.15% | 71.92% | 71.46% | 72.15% | 73.52% | 73.97% | 73.06% | 72.15% |
| 8 | 73.06% | 73.29% | 72.83% | 70.09% | 73.97% | 72.97% | 74.66% | 72.37% | 72.37% |
| 9 | 73.00% | 71.92% | 71.46% | 72.15% | 72.60% | 74.15% | 74.20% | 73.52% | 73.74% |
| 10 | 72.60% | 73.74% | 72.15% | 71.92% | 71.92% | 74.66% | 74.66% | 73.66% | 73.97% |
| Avg. acc. | 73.48% | 71.58% | 72.22% | 71.44% | 72.92% | 73.98% | 74.22% | 72.82% | 73.04% |
| Std. dev. | ±0.0075 | ±0.0182 | ±0.0048 | ±0.0100 | ±0.0122 | ±0.0053 | ±0.0041 | ±0.0059 | ±0.0074 |
| Iteration N° | Batch = 32 | Batch = 64 | Batch = 96 | Batch = 128 | Batch = 160 |
|---|---|---|---|---|---|
| 1 | 72.83% | 71.69% | 73.52% | 72.83% | 72.60% |
| 2 | 73.74% | 72.15% | 72.83% | 70.32% | 72.60% |
| 3 | 73.29% | 72.60% | 73.06% | 73.52% | 71.23% |
| 4 | 73.97% | 73.74% | 72.37% | 72.83% | 71.92% |
| 5 | 73.06% | 73.74% | 73.06% | 70.78% | 73.52% |
| 6 | 73.52% | 71.23% | 72.83% | 71.23% | 71.92% |
| 7 | 73.74% | 73.29% | 73.29% | 71.23% | 72.23% |
| 8 | 72.97% | 72.37% | 73.14% | 72.83% | 71.69% |
| 9 | 72.97% | 71.92% | 72.37% | 72.60% | 72.83% |
| 10 | 73.14% | 73.06% | 73.06% | 72.15% | 73.06% |
| Avg. acc. | 73.32% | 72.58% | 72.95% | 72.03% | 72.36% |
| Std. dev. | ±0.0039 | ±0.0086 | ±0.0037 | ±0.0107 | ±0.0069 |
| Iteration N° | Epochs = 50 | Epochs = 100 | Epochs = 150 | Epochs = 200 | Epochs = 250 |
|---|---|---|---|---|---|
| 1 | 73.29% | 72.60% | 74.43% | 72.60% | 71.92% |
| 2 | 75.11% | 74.89% | 72.83% | 72.83% | 72.60% |
| 3 | 71.23% | 73.06% | 72.37% | 73.52% | 73.52% |
| 4 | 73.52% | 73.74% | 73.06% | 74.43% | 72.83% |
| 5 | 73.74% | 73.97% | 73.74% | 73.97% | 72.37% |
| 6 | 73.74% | 74.14% | 73.06% | 73.52% | 72.14% |
| 7 | 74.14% | 73.52% | 72.83% | 74.14% | 72.83% |
| 8 | 71.92% | 73.06% | 74.14% | 72.83% | 72.60% |
| 9 | 72.60% | 74.89% | 72.52% | 72.60% | 71.92% |
| 10 | 73.60% | 72.83% | 73.37% | 73.14% | 73.60% |
| Avg. acc. | 73.29% | 73.67% | 73.24% | 73.36% | 72.63% |
| Std. dev. | ±0.0111 | ±0.0081 | ±0.0068 | ±0.0066 | ±0.0059 |
| Layer Name | Output Shape | Number of Parameters |
|---|---|---|
| Conv1D | (None, 11, 50) | 200 |
| BatchNormalization | (None, 11, 50) | 200 |
| Conv1D | (None, 11, 25) | 3775 |
| BatchNormalization | (None, 11, 25) | 100 |
| MaxPooling1D | (None, 5, 25) | 0 |
| Conv1D | (None, 5, 10) | 760 |
| BatchNormalization | (None, 5, 10) | 40 |
| GlobalAveragePooling1D | (None, 10) | 0 |
| Dense | (None, 10) | 110 |
| BatchNormalization | (None, 10) | 40 |
| Dropout | (None, 10) | 0 |
| Dense | (None, 1) | 11 |
| Metric/Model | 1D-CNN | XGBoost | LR | ANN | RF | GBM |
|---|---|---|---|---|---|---|
| Accuracy (%) | 74.71 | 72.48 | 70.77 | 71.22 | 72.14 | 72.77 |
| Precision (%) | 74.51 | 78.95 | 67.54 | 79.93 | 75.52 | 73.48 |
| Recall (%) | 55.07 | 41.30 | 48.91 | 35.47 | 42.77 | 47.74 |
| Specificity (%) | 87.62 | 92.82 | 84.85 | 94.26 | 91.06 | 88.90 |
| F1 Score | 0.63 | 0.54 | 0.57 | 0.49 | 0.55 | 0.58 |
| AUC | 0.84 | 0.79 | 0.77 | 0.79 | 0.78 | 0.83 |
| Metric/Model | 1D-CNN | XGBoost | LR | ANN | RF | GBM |
|---|---|---|---|---|---|---|
| Accuracy (%) | 77.17 | 70.55 | 71.69 | 70.78 | 71.46 | 72.15 |
| Precision (%) | 75.86 | 62.99 | 64.62 | 64.41 | 69.07 | 68.18 |
| Recall (%) | 55.00 | 49.38 | 51.85 | 46.91 | 41.36 | 46.30 |
| Specificity (%) | 89.93 | 82.97 | 83.33 | 84.78 | 89.13 | 87.32 |
| F1 Score | 0.64 | 0.55 | 0.57 | 0.54 | 0.52 | 0.55 |
| AUC | 0.78 | 0.74 | 0.75 | 0.75 | 0.75 | 0.75 |
Disclaimer/Publisher’s Note: The statements, opinions and data contained in all publications are solely those of the individual author(s) and contributor(s) and not of MDPI and/or the editor(s). MDPI and/or the editor(s) disclaim responsibility for any injury to people or property resulting from any ideas, methods, instructions or products referred to in the content. |
© 2025 by the authors. Licensee MDPI, Basel, Switzerland. This article is an open access article distributed under the terms and conditions of the Creative Commons Attribution (CC BY) license (https://creativecommons.org/licenses/by/4.0/).
Share and Cite
Aybar-Flores, A.; Espinoza-Portilla, E. Predicting Mental Health Problems in Gay Men in Peru Using Machine Learning and Deep Learning Models. Informatics 2025, 12, 60. https://doi.org/10.3390/informatics12030060
Aybar-Flores A, Espinoza-Portilla E. Predicting Mental Health Problems in Gay Men in Peru Using Machine Learning and Deep Learning Models. Informatics. 2025; 12(3):60. https://doi.org/10.3390/informatics12030060
Chicago/Turabian StyleAybar-Flores, Alejandro, and Elizabeth Espinoza-Portilla. 2025. "Predicting Mental Health Problems in Gay Men in Peru Using Machine Learning and Deep Learning Models" Informatics 12, no. 3: 60. https://doi.org/10.3390/informatics12030060
APA StyleAybar-Flores, A., & Espinoza-Portilla, E. (2025). Predicting Mental Health Problems in Gay Men in Peru Using Machine Learning and Deep Learning Models. Informatics, 12(3), 60. https://doi.org/10.3390/informatics12030060