Abstract
Facial expressions are a universally recognised means of conveying internal emotional states across diverse human cultural and ethnic groups. Recent advances in understanding people’s emotions expressed through verbal and non-verbal communication are particularly noteworthy in the clinical context for the assessment of patients’ health and well-being. Facial expression recognition (FER) plays an important and vital role in health care, providing communication with a patient’s feelings and allowing the assessment and monitoring of mental and physical health conditions. This paper shows that automatic machine learning methods can predict health deterioration accurately and robustly, independent of human subjective assessment. The prior work of this paper is to discover the early signs of deteriorating health that align with the principles of preventive reactions, improving health outcomes and human survival, and promoting overall health and well-being. Therefore, methods are developed to create a facial database mimicking the underlying muscular structure of the face, whose Action Unit motions can then be transferred to human face images, thus displaying animated expressions of interest. Then, building and developing an automatic system based on convolution neural networks (CNN) and long short-term memory (LSTM) to recognise patterns of facial expressions with a focus on patients at risk of deterioration in hospital wards. This research presents state-of-the-art results on generating and modelling synthetic database and automated deterioration prediction through FEs with 99.89% accuracy. The main contributions to knowledge from this paper can be summarized as (1) the generation of visual datasets mimicking real-life samples of facial expressions indicating health deterioration, (2) improvement of the understanding and communication with patients at risk of deterioration through facial expression analysis, and (3) development of a state-of-the-art model to recognize such facial expressions using a ConvLSTM model.
1. Introduction
An understanding of human feelings, behaviours, and intentions is based on interpreting their sentiments expressed by various cues, including verbal communication, such as speech patterns, and nonverbal communication, such as body language, gestures, head nods, and facial expressions (FEs) [1]. The prefrontal cortex, limbic system, and hippocampus are responsible for processing human feelings and emotional messages [2,3]. In the healthcare field, communication is an essential factor for understanding patient health and well-being [4]. However, it can be difficult to communicate directly with patients in critical states for a number of reasons, such as unconsciousness, severe illness, inability to speak, under medication, cognitive impairment, mental disorder, or second language. In such cases, a medical team must rely on measurements like vital signs monitoring (including heart rate (HR), blood pressure (BP), temperature, oxygen saturation), pain assessment (using the visual analogue scale), and imaging tests (including chest X-rays, CT-scans, ultrasound). Normally, facial expressions are not considered in these situations, and this is the aim of this research. Deterioration is a critical state and a serious factor that may result in the death of the patient [5] and can impair patients’ ability to communicate and convey their feelings, thoughts, and desires [6]. The early warning clinical signs of severe deterioration are important indicators that emphasize the imperative of taking preventive measures and immediate proper actions to improve patient health and increase their chance of survival [7]. An early and accurate clinical assessment, which is usually checked by professional nurses, is known as a self-report and is not always possible due to some factors such as age, the critical situation of the patient, unconsciousness, language impairments, the ability to speak, and difficulty in explaining their sentiments [8]. Self-report is a costly procedure, time-consuming concerning human resources, and difficult to perform objectively. In addition, it can be a risk assessment by the critical care nurses in intensive care units who depend on direct evaluation because of the likelihood of being alerted by their intuitive decisions [3,9]. Therefore, there is a need for an automatic system that can perform accurate measurements and health assessments, providing an early warning and prioritizing patients in need of urgent medical care. Face is the organ of emotion which is considered an essential indicator of human feelings, the prime source of wealth information, and the significant channel for transferring nonverbal communication [10]. Psychologists have illustrated facial expressions form 55% of daily human interaction, which is considered far higher than other verbal communication, such as speech-language, with 38%, and the written language, with only 7% [11]. Facial expressions are formed by the coordination of facial muscles that play a primary role in the exchange of information and facilitating social interactions [12]. The facial muscle movements are stimulated by the facial nerves, forming various types of voluntary and involuntary facial expressions. Facial analysis is a vital domain to multiple aspects of daily life such as age estimation, gender classification, face detection, face recognition, face posing, facial expression, and blink detection. Consequently, facial image analysis has been used in healthcare disciplines such as pain estimation, psychological assessment, and the analysis of mental health. All the achieved exceptional outcomes and continued progress in the facial analysis field have led to demonstrate its usefulness and effectiveness, which are reflected in various disciplines and applications. Some movements of facial muscles that surround all main facial landmarks, such as the eyes, nose, mouth, and ears, form specific expressions called universal facial expressions, which are perceived as happiness, anger, contempt, disgust, surprise, fear, and sadness. Other emotions reveal human sentiments and state of mind, allowing other people to glimpse into human minds as they can read facial expressions based on changes in key facial features. In 1978, Ekman and Friesen [13] developed a system to characterize facial expressions, which is called The Facial Action Coding System (FACS). This system refers to a comprehensive set of atomic non-overlapping facial muscle actions called Action Units (AUs) that are typically used to encode and taxonomize facial muscle movements to correspond to a displayed emotion [14]. Recently, different methods of facial expression recognition based on FACS have been used to identify the seven universal facial emotions such as joy, sadness, contempt, surprise, disgust, fear, and anger. However, human facial expression consists of thousands of expressions that are different in subtle changes due to a variety of Facial Action Units (FAUs), or the blending of some expressions. FACS can identify large numbers of facial emotions by identifying a set of muscular movements that comprise the facial expression. In facial behaviour, there are different relationships among FAUs. For instance, a set of AUs usually appears together to show specific emotions, such as the co-occurrence relationship of inner brow raiser (AU1) and outer brow raiser (AU2), and mutually exclusive relationships of lip presser (AU24) and lips apart (AU25). In 2015, Rudovic et al. [14] stated that identifying the estimation of facial action unit intensity is a challenging task due to some internal and external factors and conditions such as head position, illumination, age, or a specific set of action units. In the healthcare field, health professionals observe and assess facial expressions as a way to deepen their understanding of patients without causing them the exertion of saying what they feel. Therefore, some potential applications have been utilised to recognize depression, pain, and anxiety in patients [15,16]. Evaluation of facial expressions and analysing the degree of patient deterioration have relied on assessments based on the experiences that individual nurses have acquired in the course of their careers. In addition, nurses not only observe the status of the well-being of patients based on basic facial expressions but also need to assess and interpret complex changes exhibited through the face. Furthermore, patient monitoring is based on observation by nursing staff, which means that such measurements and patient deterioration may not be noticed in the time between observations. Moreover, the effort of training human experts and manually scoring the AUs is expensive and time-consuming. Within the realm of computer vision, Facial Expression Recognition (FER) stands as a crucial field, offering diverse techniques to decode emotions from facial expressions. Navigating the human–machine interaction (HMI) has a significant impact on feeling, recognising, and understanding internal emotions and intentions. Nowadays, there is a remarkable steady growth in employing digital images and machine learning (ML) in facial recognition and human–computer interaction due to the availability of high-end devices such as image devices (cameras) and cost-effectiveness. Facial image detection, analysis, and recognition have evolved into a substantial work that ended with remarkable outcomes. The main concept of involving deep learning algorithms is to achieve certain requirements by constructing a robust artificial neural network (ANN) model through training an enormous quantity of datasets along with considering their diversity and quality to satisfy certain requirements [17]. In 2022, Rodriguez and his colleagues [18] stated that the automatic recognition of deterioration is an essential part of the health domain since it is not only an influential indicator for medical diagnosis but has also been shown to be a supportive factor for patient recuperation in intensive care units, admitted to critical units and after surgery. Hence, precise deterioration assessment could be highly beneficial from the early warning automatic system [3]. Consequently, more intensive monitoring and accurate methods for observing and understanding the changes in facial expressions can help to identify the risk of clinical deterioration earlier than statistical methods. This paper presents an Automatic Facial Expression Recognition (AFER) to support healthcare professionals by providing specific information revealing significant patients’ health status without requiring previous knowledge or special skills. There are various feature extraction approaches aimed at providing features related to fine details of a dataset. Choosing one or multiple features is influenced by several factors such as what the specific targets or task requirements need to be achieved, the characteristics or nature of the dataset, and the dimensionality between the input dataset and targets. In this paper, to capture various aspects of facial data, a combination of appropriate feature extraction approaches has been employed for a comprehensive, robust analysis with high levels of detection 99.8% and recognition of a patient’s health status. The method proposed here includes, for instance, various metrics between facial landmarks. Distances or ratio measurements between facial action units and facial landmarks were used as facial features. Providing such features together with the spatial relationships between facial landmarks to deep learning systems led to vastly improved classifier models. In particular, here, we investigated and proposed a Convolution LSTM model to learn and predict facial features from animated characters, created using special software such as Blender 4.1 and First Order Motion Model (FOMM). Guided by the work of Madrigal and her colleagues [3] whose work predicted health conditions by recognizing early signs of deterioration, our research focused on convolution neural networks and Long-Short Term Memory in an attempt to replicate such predictions from the detection and recognition of facial expressions from a set of Action Units. Thus, the work reported here concerns the development of an Automatic Facial Action Units Recognition system capable of measuring the risk of patient deterioration in critical care wards. The expressed emotional states of patients were detected in real-time using fully automated computer algorithms that receive the data of facial expressions via webcam.
2. Related Work
Human facial expressions serve as a fundamental mode of communication and interaction. Therefore, facial expression recognition (FER) is an essential part of human communication and plays an energetic role in expressing emotions and providing non-verbal cues [19]. Charles Darwin investigated facial expressions and stated that facial movements convey what we are feeling, even though interpretations may differ among cultural groups. Some researchers have investigated the various muscle movements of facial expressions and have proposed that humans display universal facial expressions for specific emotions [20]. In 1971, one of the earliest works on facial expression was presented by Ekman and his colleagues [21]. They developed their theory based on facial expressions by observing films of social human interactions in different cultures. They proposed that people have universal facial expressions for specific emotions based on analysing and recognizing data from different cultures. Seven years later, Ekman and Friesen [13] determined universal facial expressions by proposing the Facial Action Coding System, which can determine AUs that represent muscular movements. In 1995, Gosselin and his colleagues [22] implemented an experiment that included six participants from Canada to present emotions based on scenarios corresponding to six types of facial expressions. The outcomes of the Facial Action Coding System (FACS) of the presented emotions revealed that some of the theoretically predicted Action Units appeared frequently, such as AU 6 and AU 12 in happy expression, while other AUs were rarely observed, such as AU 9 in disgusting expression. Furthermore, several non-predicted AUs were observed frequently in most facial expressions. Later, Scherer and Ellgring (2007) [23] implemented their experiment by asking professional actors (n = 12) in Germany to present emotions based on scenarios corresponding to various ranges of facial expressions. According to the FACS analyses for the presented emotions, the outcomes of the experiment did not prove the existence of a large number of theoretically predicted AUs of basic and non-basic emotions. Thus, in recent decades, the aim of using computer vision as an essential assistance for professional healthcare people has been addressed; for instance, in 2011, Lucey and her colleagues [24] built a UNBC-McMaster database containing 200 video streams taken from 25 patients who were suffering from shoulder pain. The frames were labelled depending on the work of Prkachin and Solomon [25]. The metric is based on the Facial Action Coding System (FACS) that has been presented by Ekman, Friesen, and Hager (2002) [26], which codes different facial muscle movements with various intensity levels. Sometimes, the dataset has been considered challenging data in the subject of facial expression recognition even for clinical professionals to determine what the patient feels. So, the UNBC-McMaster Painful dataset has been used to propose new models for facial pain detection. Lucey and her colleagues (2011) [24] published baseline results with the dataset that used support vector machines SVM/AAM system to extract facial landmark features to predict painful action units (AUs) and the PSPI for the presence of pain. Facial AUs have been typically used to encode facial activity corresponding to different facial expressions such as pain or anger. In 2015, Rudovic and his colleagues [14] stated that the task of AU intensity estimation is very challenging, due to the high variability in facial expressions depending on the context, such as intensity of light, head poses, or various facial expression expressions. In 2013, an investigation study using FACS proposed by Gross and his colleagues [27] uncovered that health professionals usually recognize sadness and fear expressions in patients at risk of deterioration. A previous collaboration between North Middlesex University Hospital, University College of London Hospital, and the GMPR Research Group at Sheffield Hallam University proved, for the first time, that patterns of Facial Action Units can be used as predictors of admission to critical care. The study analysed some AUs related to the upper and lower face, head position, and eye position, with clinical measures collected within the National Early Warning Score (NEWS) [3]. In the last few decades, automatic facial expression recognition (FER) has been considered an essential part of various applications in human-computer interaction [28]. Therefore, it is considered a multidisciplinary research field as it is involved in many disciplines such as computer vision, machine learning, psychology, neuroscience, and cognitive science [29]. In 2016, Jaiswal and Valstar [30] presented a combination of Convolution Neural Networks (CNN) and Bi-directional Long Short-Term Memory Networks (BLSTM) that can detect Facial Action Units. In 2017, Sang and his colleagues [31] introduced convolution neural networks that were capable of recognizing facial emotions; the output layer included seven neurons that were labelled according to seven expressions. The purpose was to classify each image as one of the universal facial expressions. One year later, Chen, Yang, Wang, and Zou (2017) [32] presented a convolution neural network that used a convolution kernel for feature extraction and a max pooling operation to minimize the dimensions of the extracted features. In this work, the proposed automatic recognition system of facial analysis was constructed to identify each facial image as one of the seven facial expressions. One of the earlier studies related to facial analysis was introduced by (Al Taee, Jasim, 2020) [33]. They presented a CNN with the ability to perform the process of FER to label each face as one of the seven universal emotion categories that are considered in the JAFFE database. The CNN was trained with different grey-scale images, and the accuracy of the results was 100%. The work of Mohan, Seal, Krejcar, and Yazidi (2021) [34] introduced deep convolution neural networks (DCNN) for recognizing facial expressions. The proposed approach included two main parts. The first part focused on finding out local features from the human face using a gravitational force descriptor, while, in the second stage, the descriptor was fed into the DCNN model. The implementation of DCNN was applied through two stages. The first stage extracted edges, curves, and lines, while the second explored the holistic features. In summary, Facial Action Units have been employed to encode the different facial expressions corresponding to various facial motions with varying degrees of success and intrinsic model limitations. Each specific combination of AUs can form specific facial expressions such as happiness, sadness, anger, fear, and so on.
3. Methodology
Designing and developing a Convolution LSTM model involves systematic methodology to ensure effective design, training, and evaluation. This section presents three major phases that include: generating the dataset, pre-processing the dataset, and the proposed system, which is based on a Convolution LSTM architecture.
3.1. The Dataset
3.1.1. Generating the Dataset
Creating avatars using computer-generated animated characters has significantly increased over the last few years and is considered a valuable tool in studying emotions and social cognition. Using avatars provides highly controllable, interactive experiments; allows for various facial expressions; saves cost and time compared with human experiments; and encompasses a variety of data including different ages, skin tones, and ethnicities. However, there are still some limitations and drawbacks of involving avatars in research findings that have to be considered, such as that they cannot mimic or capture the richness and complexity of real facial expressions, especially the fine subtle facial movements such as micro-expressions. These shortcomings minimize the realism of avatars. Generating avatars’ dynamic facial expressions emulating the risk of deterioration using Action Units was based on the Facial Action Coding System (FACS) (Ekman Friesen, 1978) [13]. Here, we used a typical combination of Action Units as described in the work of (Madrigal et al., 2018) [3] What Faces Reveal: A Novel Method to Identify Patients at Risk of Deterioration using Facial Expressions. The Action Units in question are illustrated in Table 1, where combinations of AUs are referred to Face Displays (FD). Twenty-five avatars aged between 18 and 70, with a mean age and standard deviation (Mage 30.04, SDage 14.3957), were generated with various genders, skin tones (white, black, yellow), and ethnicities (African, Asian, White), face shapes (oval, long, square, heart, diamond), and facial features (eye and hair colour, shape and size of the nose, chin, cheeks, eyes, forehead, lips). Each participant implemented five different expressions that were labelled into five classes (FD1, FD2-L, FD2-R, FD3-L, FD3-R), representing patients whose health is deteriorating. There were 10 male participants, representing 40% of the whole avatars, while there were 15 females, representing 60% of the participants. The dataset was generated consisting of 125 video clips covering the five particular facial expressions, and each video lasted around 11–12 s, displaying the faces of avatars were created and evolved using advanced 3D animation tools such as Blender and FacsHuman. FACSHuman is a software v0.4.0 tool based on FACS, which, in conjunction with MakeHuman software 1.2.0, helps to craft 3D avatars with high standards of realism, aesthetics, and morphological precision. This involved detailed facial rigging and expressions synthesis to mimic human facial expressions accurately. The flexibility of the software allowed for the generation of FEs in limitless scenarios, enhancing the realism of synthetic data. The avatars facing the camera at various angles with a frame rate of around 25 fps showed dynamic facial expressions at risk of deterioration without the movement of the trunk. The row dataset had around 37,000 frames for the whole videos of all classes.

Table 1.
Action Units of five expressions at risk of deterioration and their relevant facial muscles.
The relevant Action Units of five classes and the muscles that are responsible for their appearance, along with image samples of these expressions, are shown in Table 1.
The generated avatar videos simulated actors imitating the behaviour of patients at risk of deterioration while the body was considered under static conditions and was recorded via camera, either with or without the movement of head poses. The intensity of the deterioration expression was fixed at 100% of the maximal contraction of the AUs depicted in Table 1. Each video began with the avatar showing a neutral expression (sets of AUs at 0). The level of AUs linearly increased to reach 8% of contraction for 1 s. The deterioration expression was maintained for 9 s until the end of the clip, as depicted in Figure 1. In the first few seconds (4–5 s) of each video, the avatar first stayed static along with a neutral expression; then, the facial muscle movement started showing deterioration until reaching the maximum point at the end of the video. The automatic model analysed each frame and triggered when the participant was under deterioration risk at that captured frame. The position of the cursor along the scale was converted to numerical values between 0 (“normal situation”) and 100 (“worst condition of deterioration”). The deterioration believability task rating corresponding to the percentage of “True deteriorated” responses was calculated for each condition of the five classes. The left avatar of Figure 1a expresses a neutral expression, while the right avatar reveals a deterioration condition in the final stage (AUs recruited at 90% of their maximal contraction). As illustrated in Figure 1, deterioration intensity increased significantly with the amplitude of (AU15, AU25, AU43, AU55, AU56) movement.
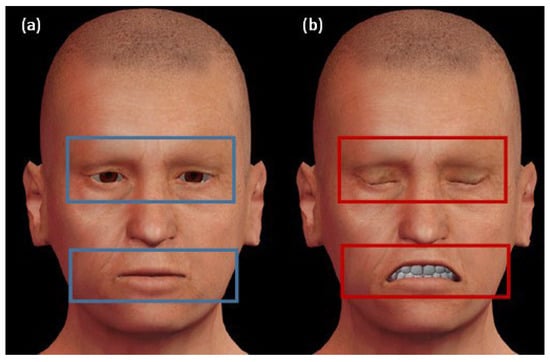
Figure 1.
Facial expression areas that reveal if the patient is under deterioration or not. (a) The left avatar expresses a neutral expression, which is bounded by the blue rectangles. (b) The right avatar reveals deterioration status in the final stage, which is bounded by the red rectangles.
Table 2 shows 5 classes of different combination of AUs along with their descriptions and the number of generated videos in each class.

Table 2.
Combination of AUs of each class to form facial expressions of participants at risk of deterioration and the number of generated videos.
The results showed that the avatar’s deteriorated expression was perceived to be more intense and more believable in the presence of a combination of the upper part and lower part of the face. Figure 2 shows an avatar with five different expressions in perceptive of deterioration, and each particular expression belongs to one class, such as the combination of AUs (15 + 25 + 43) belonging to the class named FD1, AUs (15 + 25 + 55) belonging to the class named FD2-L, AUs (15 + 25 + 55) belonging to the class FD2-R, AUs (15 + 25 + 43 + 55) belonging to the class labelled FD3-L, and finally, the FD3-R class includes samples that show the combination of AUs (15 + 25 + 43 + 65).

Figure 2.
Five classes along with the combination of Action Units.
3.1.2. Transfer Facial Expressions to Static Real Faces Using the First-Order Motion Model (FOMM)
The face swap, bring the face to life, image animation, and Deepfake generations techniques are applications used to replace the face of one person with the face of another sequence. In 2019, Siarohin [35] and his colleagues presented a computer vision and deep learning model, which is called the First-Order Motion Model (FOMM), to generate video sequences in such a way that the object in the source image is animated according to the motion of the driving video. The ability of this model to learn facial expressions is significant without the need to know any prior information about the specific object to animate. The concept of image animation is to synthesize a video using two main parts. The first one is the source image, and the other one is the driving video. The model is trained on a dataset of images and videos for the objects of the same category (e.g., face, body) by identifying key points on the object and then following them to the motion in the video. Recent applications of CNN have proved to mimic realistic human faces. Training networks on a large number of images and video datasets can generate realistic talking persons. A source image of someone can be animated to the target poses of another one in the driving video [36]. The FOMM combines the appearance extracted from the source image and the motion derived from the driving video. The framework described in [35] has achieved satisfactory results on a variety of object categories. Their model has pre-processed the dataset, extracting an initial bounding box in the first video frame. Then, it tracks the object until it is too far away from the initial position. After that, the video frames use the smallest crop containing all the bounding boxes. This process is repeated until the end of the sequence. Then, it filters out sequences that have a resolution lower than 256 × 256, and the remaining videos are resized to 256 × 256, preserving the aspect ratio to obtain a more realistic video where the head moves freely within the bounding box. The model uses 19,522 training videos and 525 test videos, with lengths varying from 64 to 1024 frames. This project has adapted the FOMM to capture facial expressions for various images. The model was trained to reconstruct the training videos by combining a single frame and a learned potential characterization of the motion in the driving video. At test time, we applied our model to pairs composed of the source image and each frame of the driving video and perform image animation of the source object. The model was trained and tested with different datasets containing various objects. More precisely, the method automatically produced videos by combining the appearance extracted from a source image with motion patterns derived from a driving video. For instance, a facial image of a certain person could be animated following the facial expressions of another person as shown in the sequence of frames from Figure 3. The method was employed in this proposed study to generate and expand a more realistic dataset for real people’s faces by transferring this combination of involuntary facial expressions and head poses of patients under risk of deterioration by animating the facial expression, eyeball movement, and head poses of real faces in a source image based on the motion of a facial expression and head poses of avatars in a driving video as shown in Figure 3. We applied the FOMM using a pre-trained deep learning method, and the raw data consisted of driving videos of 3D animated characters displaying the specific expressions of a patient in deterioration and real human faces from an open database known as the Celebrity Face Image Dataset. These expressions were faithfully transferred to the various source images of different real people’s faces as shown in Figure 3 and Figure 4. The model was implemented by utilizing source images of real human faces from an open database known as the Celebrity Face Image Dataset, and the results of facial expressions, head poses, eyeball movement, and other actions from the videos transferred to the source images were considered of good quality and realistic. Transferring the facial expressions data to static real faces and bringing them to life was an essential task to train the model on the facial expressions of real human faces. Creating a realistic robust model that can be applied in the real world on real faces can be achieved by utilizing a model that can bring the real faces of facial images to life as can be seen in Figure 3 and Figure 4.
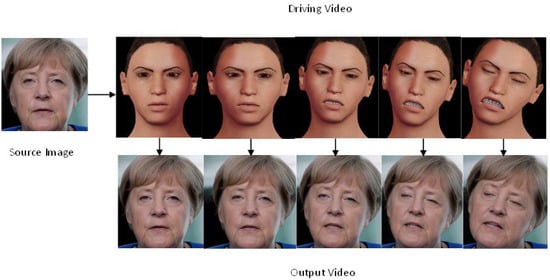
Figure 3.
Frames of video sample after utilizing FOMM to transfer facial expressions from avatars to real facial images.
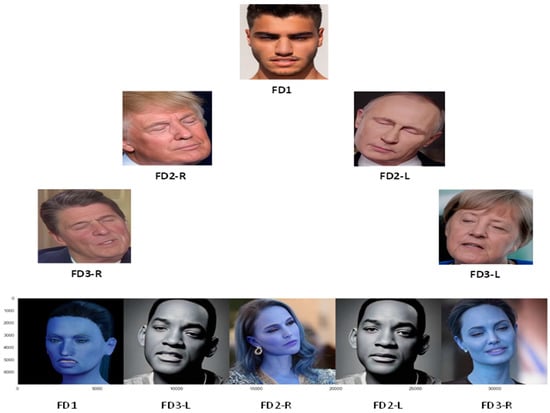
Figure 4.
Samples of five classes of facial frames representing five classes.
In summary, after generating and recording the facial expressions of each avatar, the facial expressions of avatars were transferred to static images of real people’s faces using the Celebrity Face Image Dataset that is available as an open database on Kaggle. Using the FOMM, the number of generated videos was expanded to reach 176 video clips that had colourful sequences of frames with a framerate of around 25 fps and a length of each video (11–12) seconds, so we had (275–300) frames in each video. The paper presents 176 generated videos, and there were around 50,550 frames for all videos. The five facial expressions are shown in Figure 4.
3.2. Pre-Processing Dataset
The pre-processing methods have a great impact on improving the performance of the learning process and model generalization by enhancing the quality of the dataset, minimizing noise, introducing variability, and providing standardized input data for machine learning models. Choosing the appropriate methods is based on the nature of the data, characteristics of data, requirements of the machine learning model, and the target task. It is crucial to achieve a balance between increasing the variability and preserving the essential features of the dataset. This section produces pre-processing methods that have been employed for the proposed system. To achieve consistency across the various image datasets, it was crucial to adjust the dimensions of images by resizing them to a particular size.
3.2.1. Face Detection Technique
Detecting and identifying faces is considered a crucial step in FER for several reasons. Its significant rule lies in providing relative data by focusing on the face region that contains the essential features and patterns to capture detailed information on facial expressions and classify their types by involving subsequent analysis. The faces have a wealth of information expressed by facial expressions, including the positions, intensity, and appearance of AUs for specific facial muscle movements. Therefore, providing the model with the region of interest by localizing and aligning the face area aids in isolating the face from the background and introducing the relevant features that result in reducing the impact of introducing irrelevant data, like backgrounds with noise that may affect the accuracy of model prediction, along with unnecessary computations which reduce the model performance. The proposed framework used the open-source programming packages called Mediapipe (version 0.10.9) for face detection. Mediapipe is considered a well-known method for face detection and facial landmark location, and it can be used for the recognition of facial features and expressions through single facial images or a continuous stream of facial images. Figure 5 shows how the Mediapipe provides a pre-trained face mesh model that can detect face and facial landmarks such as the eyes, nose, mouth, eyebrows, jawline, etc., through facial frames.

Figure 5.
Facial frames samples for each class after pre-processing using face mesh as a face detection technique.
The architecture of the pre-trained model for locating the face and its landmarks was based on a combination of methods, including computer vision and deep-learning algorithms, that were trained to localize facial landmarks in images and frames. The convolution neural network (CNN) is the deep learning method for detecting faces and localising their facial landmarks. Its architecture consists of multiple convolution layers followed by the pooling layers and fully connected layers. This model was trained to automatically learn the hierarchical facial features of images to achieve an accurate prediction.
Each generated video was labelled and categorized into one class of five classes according to its Face Display (FD). Figure 6 illustrates the distribution and number of samples for each class.
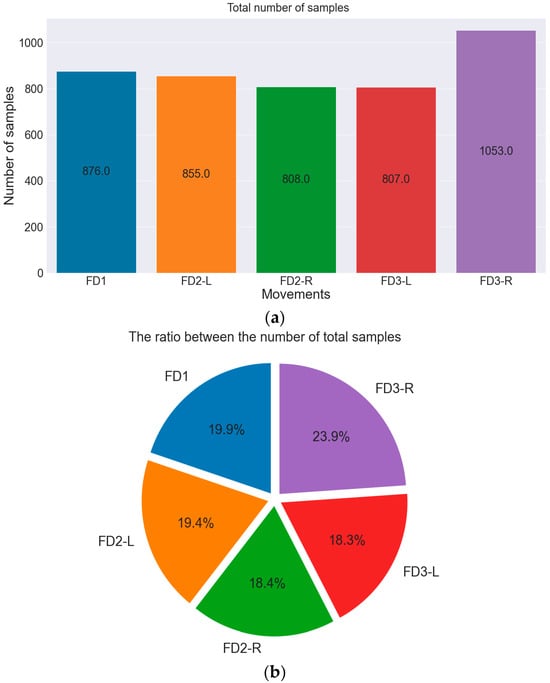
Figure 6.
Number and ratio of samples in each class for the whole dataset. (a) The total number of samples is represented by column chart. (b) The ratio of samples in each class.
The whole dataset was then split into training and test datasets. The test data were essential to evaluate model performance on unseen data. The split was performed at 15% for test data and 85% for training data, as illustrated in Figure 7. It is worth noting that any proposed model performs more precisely when it is fed with a rich, sufficient, and diverse dataset.
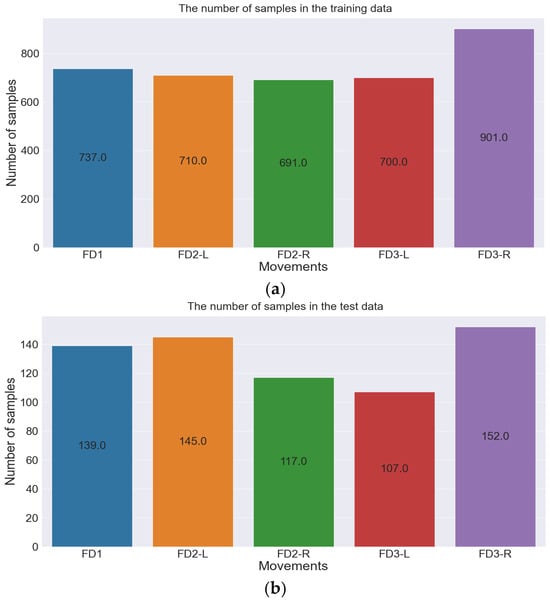
Figure 7.
Number of samples in training and test dataset. (a) The number of samples in the training dataset. (b) The number of samples in the test dataset.
3.2.2. Oversampling
The final step in the pre-processing method is the oversampling method, which is considered an effective process in machine learning to handle imbalanced classes and improve model performance by training it with a balanced training set. The oversampling method was only applied to training datasets to avoid data leakage. Again, evaluating the model performance on an imbalanced test dataset is crucial to assess its ability to perform real-world generalization. Figure 8 shows the training dataset before and after applying the oversampling method.
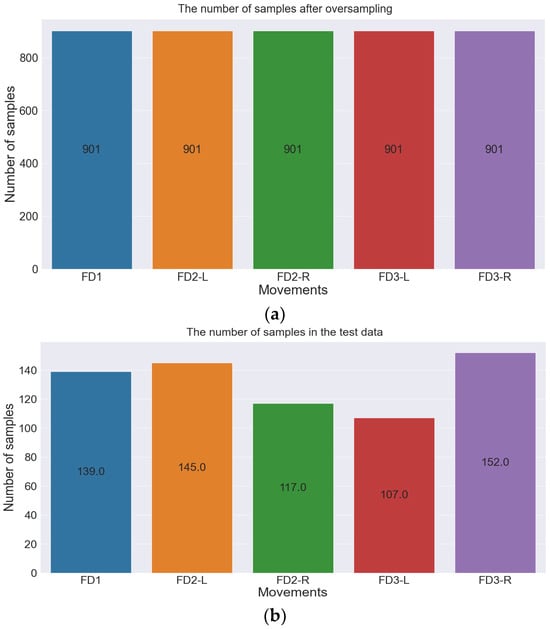
Figure 8.
Number of training samples before and after oversampling method. (a) Number of samples of training dataset before oversampling. (b) Number of samples of training dataset after oversampling.
3.3. Proposed Convolution Long Short-Term Memory (ConvLSTM) Model
LSTM can handle temporal input data and achieve high accuracy of prediction; however, it suffers from capturing spatial data, resulting in failing to capture features of spatial data. Therefore, Xingjian and other contributors [37] addressed this problem and developed ConvLSTM, which replaces the state-to-state transition operations in the LSTM with convolution operations. It involves convolution operation within the LSTM structure, and it is particularly popular in computer vision and video analysis tasks as it has demonstrated remarkable success in capturing and handling complex dynamic patterns within image sequences and video streams. The ConvLSTM model expands the traditional LSTM capabilities by involving convolution layers to propose a method that allows the model to learn and retain spatial dependencies in the input sequential data producing an effective prediction model for tasks involving sequential data with spatial characteristics such as video analysis, spatiotemporal modelling, and image sequence processing [38].
3.3.1. Convolution Layers
These layers are responsible for performing convolution operations on input data to capture spatial patterns and relationships to extract relative features [37,38].
3.3.2. LSTM Cells
These cells are involved in capturing temporal dependencies in the input sequential data [37,38]. Each cell includes three types of gates: the input gate, forget gate, and output gate. These gates are responsible for regulating the flow of information through the cell, allowing the network to retain or discard information over time [39]. By combining convolution layers and LSTM cells, the model can effectively process both spatial and temporal dependencies in the sequential data. Therefore, it is considered suitable for handling tasks such as video prediction, action recognition, facial emotion recognition, and other tasks where understanding and analysing both the spatial and temporal aspects of data is crucial. Therefore, this paper proposed the ConvLSTM model to recognize facial expressions through frames of video stream due to its ability to capture both spatial and temporal dependencies in facial expressions over time. Figure 9 shows the ConvLSTM structure [40] where the new memory and output will be generated by updating the internal memory to the current input and the previous output .
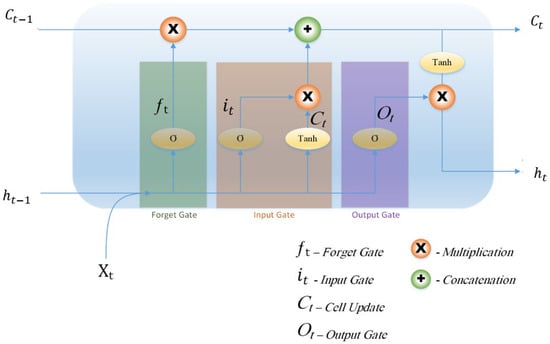
Figure 9.
Structure of ConvLSTM [40].
The mathematical expression of the ConvLSTM in the updated gates is given as follows:
where ∗ refers to convolution operation, and X refers to the Hadamard product. Wcf, Wci, and Wc0 refer to the weight matrices.
ft = (Wx f ∗ Xt + Wh f ∗ h(t − 1) + Wc f ∗ C(t − 1) + bf)
it = (Wxi ∗ Xt + Whi ∗ h(t − 1) + Wci ∗ C(t − 1) + bi)
Ot = (Wx0 ∗ Xt + Wh0 ∗ h(t − 1) + Wc0 ∗ Ct + b0)
Ct = ftC(t − 1) + ittanh(Wxc ∗ Xt + Whc ∗ h(t − 1) + bc)
ht = Ottanh(Ct)
All the weight matrices and bias vectors will be updated in each update process.
In this model, a background removal procedure was applied before the generation of the extraction vector to avoid dealing with multiple problems that may occur such as noise of the background, distance from the camera, light, irrelevant data, etc. Then, an expressional vector has been applied to detect and characterize the 5 various kinds of patients’ faces under deterioration. It was possible to correctly highlight the class label of facial expression with 99.4% accuracy. The proposed system phases are depicted in Figure 10.
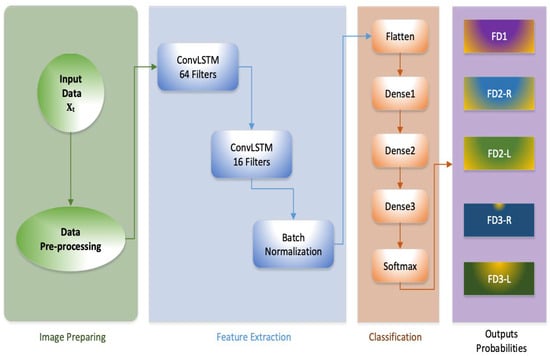
Figure 10.
The proposed model architecture.
The model was trained and evaluated using the k-fold cross-validation process, which helped ensure that the model generalised well to unseen data. Instead of relying on a single train-test split, which might lead to overfitting or underfitting, k-fold cross-validation trained the model on multiple different subsets of the data, which resulted in better learning the underlying patterns and avoiding overfitting to any particular subset.
4. Results and Limitations
The proposed model has been trained and tested on the generated dataset. The dataset includes video frames for five classes of specific facial expressions (FD1, FD2-L, FD2-R, FD3-L, FD3-R) for various facial landmarks, skin tones, and ethnicities representing patients at risk of deterioration. Achieving optimal results depends on many factors, such as the quality, quantity and diversity of the dataset, the effectiveness of feature extraction methods, the model structure, experimentations, and fine-tuning. After the data training stage, the model has to be evaluated for its reliability by testing their ability to handle and master the target task. The evaluation of machine learning models is based on essential metrics such as accuracy. The target of a machine learning engineer or designer is to achieve the highest model accuracy, and this measurement represents the model’s ability to find the features and relationships between data that relate to the target task. The accuracy is focused on the number of true predicted samples and calculated by finding the number of correctly predicted samples to the overall number of predictions. There are four essential measures used for estimating model performance, including: 1. True positives (TP): the number of correctly predicted samples. 2. True negatives (TN): the number of rightly predicted values as negative. 3. False positives (FP): the number of positive samples that are wrongly predicted. 4. False negatives (FN): the number of negative samples that are incorrectly predicted. The correct predictions of the model include the true positives and the true negatives, while the model misleading includes the false negatives and false positives. The accuracy of the model can be calculated by the following formula [41,42]:
The accuracy metric is a straightforward measurement; however, it cannot be considered a sufficient evaluation for all tasks due to some limitations. For instance, it might be the improper measurement in evaluating imbalanced classes where there is a substantial difference in the number of samples in a class compared with the other classes. It may result in a metric of accuracy being very high because of its correct prediction of the majority class, even if the model performs poorly in the other minority classes. Another metric is precision, which is responsible for measuring the ability to capture the number of correctly predicted samples of positive class. It can be calculated by finding the ratio of correct sample predictions to the overall number of samples identified as positive class. The proportion between true positives that are correctly identified and the total of both true positives and false positives can be calculated in the following formula [43]:
Recall is an evaluation metric that is sometimes known as sensitivity, especially in the medical and biological fields, or true-positive rates due to its ability to provide an accurate evolution of model performance in identifying the positive samples. It records the ability to identify positive samples and can be measured by finding the ratio between the true positives and the total number of positive samples [44].
Another popular metric for evaluating model performance is the F1 score. It is considered the harmonic mean of precision and recall, providing a balance between them and serving as an effective metric in imbalanced classes. Its importance lies in evaluating a model’s ability to detect true positives and false negatives. The equation for calculating the F1 Score is as follows [45]:
Table 3 illustrates these metrics, which provide an evaluation of the proposed ConvLSTM model. The evaluation of model performance is measured by testing the prediction of the model on unseen or new data during the testing process, recognizing relevant features in unseen new data. One of the most common evaluation methods is the confusion matrix which uses four essential components: true positives (TP), true negatives (TN), false positives (FP), and false negatives (FN), in assessing and evaluating the performance of classification models. Figure 11 and Figure 12 show the accuracy and loss of the testing dataset for the proposed model.

Table 3.
Evaluation metrics for each class: the total mean performance.
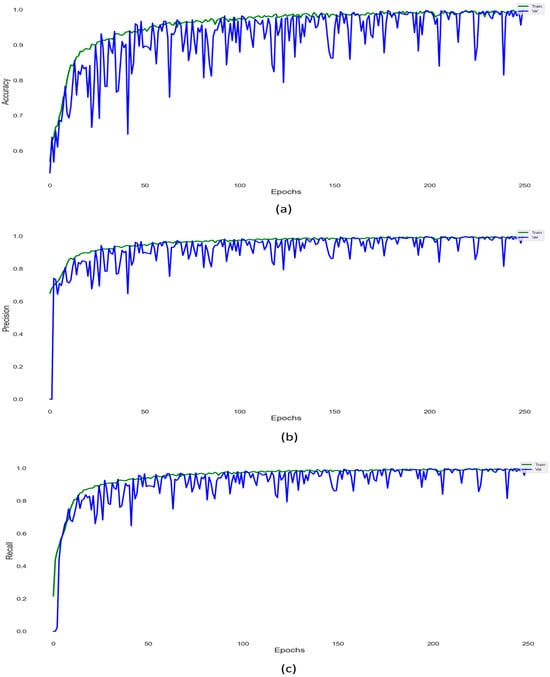
Figure 11.
(a) Evaluation metrics of model performance. Accuracy of the proposed model. (b) Precision of the proposed model. (c) Recall of the proposed model.
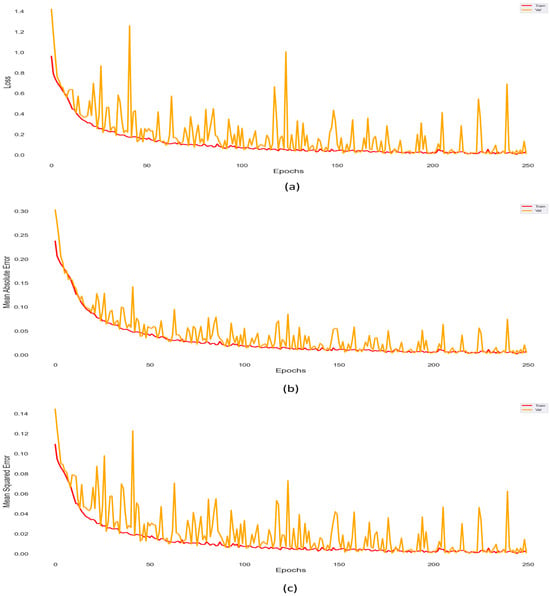
Figure 12.
Loss, Mean Square Error and Mean Absolute Error. (a) Loss of the predicted model. (b) Mean Square Error of the predicted model. (c) Mean Absolute Error.
Figure 13 presents the confusion matrix that summarises and visualizes the performance of the proposed model. Each row of the matrix presents facial expressions in the actual class, while each column represents facial expressions in the predicted class.
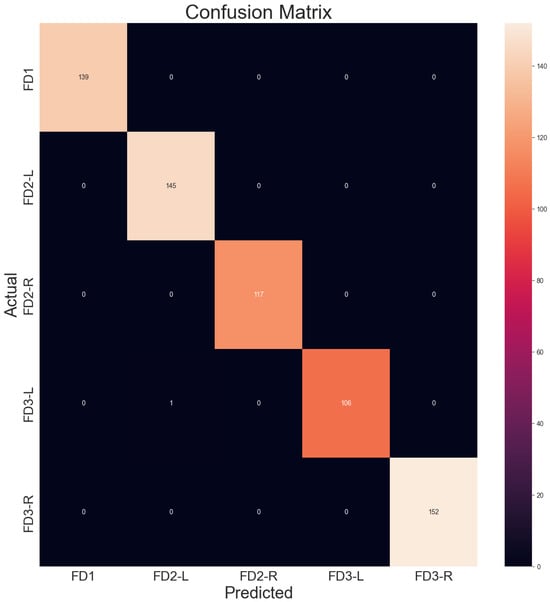
Figure 13.
Confusion matrix.
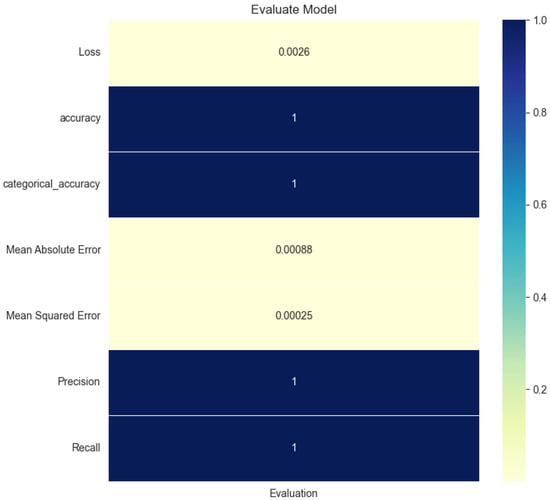
Figure 14.
Evaluation of the model.
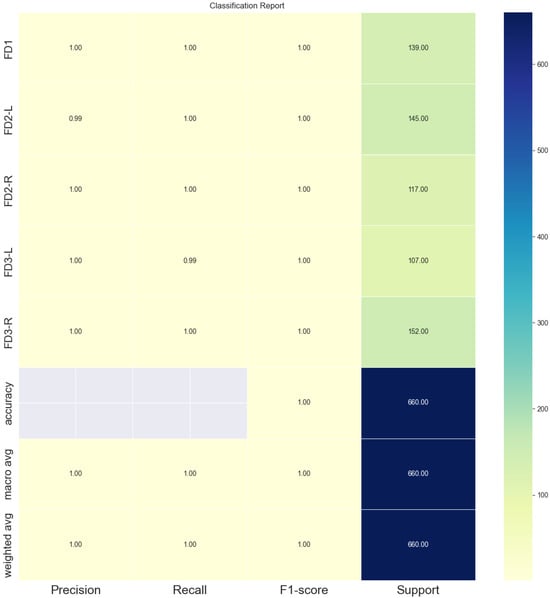
Figure 15.
Classification report.
The five evaluation measurements for five classes are illustrated in Table 3.
The above measurements provide insights into various aspects of model performance. The precision, recall, F1 score, and accuracy recorded 99.8%, 99.8%, 100%, and 99.8%, respectively. This study shows very promising outcomes in detecting the deterioration of patients from their facial expressions. However, the limitation of this project is that real-life data samples could not be collected due to ethical procedures as the data related to patients in critical care units and intensive care units. The generated data are based on the psychologists’ study presented by [3], which helped to introduce avatars mimicking the exact specific five categorical facial expressions that show patients suffering from deterioration.
We conducted experiments with other deep learning models, such as Vision Transformers, on the generated dataset. However, the results were not satisfactory due to the spatial-temporal nature of the dataset’s features. In contrast, the CNN model has a significant ability to explore and recognise spatial features, while the LSTM model is well known for its capability of capturing temporal features. Consequently, the ConvLSTM model achieved state-of-the-art results in predicting the facial expressions (FEs) of patients at risk of deterioration.
Figure 16a shows the ROC curve and Figure 16b shows the precision-recall (PR) curve, which are used to evaluate the performance of a classifier, especially when dealing with imbalanced datasets.
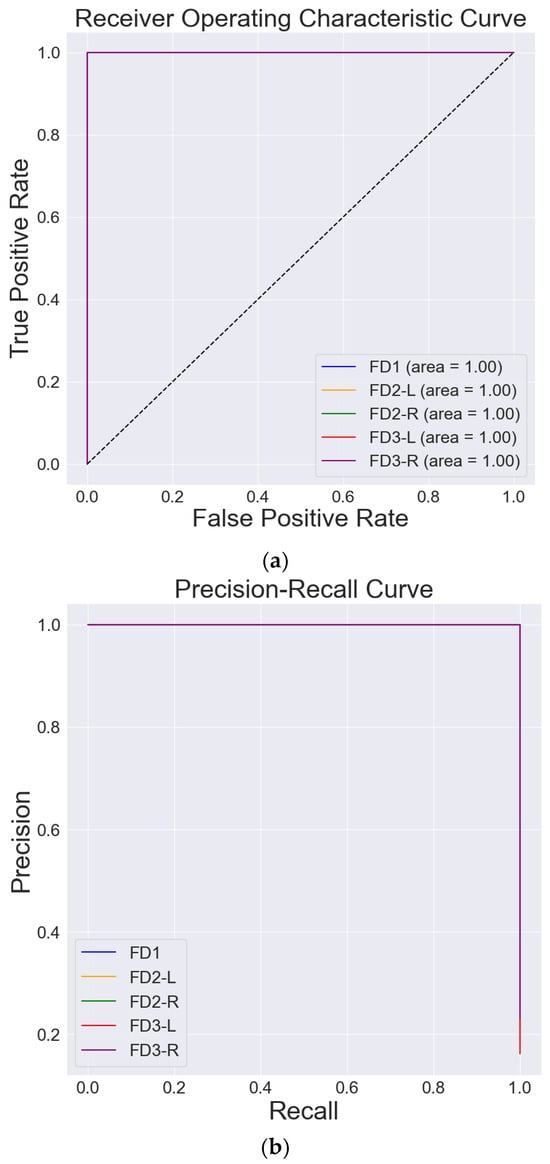
Figure 16.
Evaluating model by Receiver Operating Characteristics Curve (ROC) Precision-Recall Curve. (a) ROC. (b) Precision-Recall Curve.
In addition, the model has been evaluated using the unseen data separated from the whole dataset before training, and the model also shows high predicted results as shown in Figure 17.
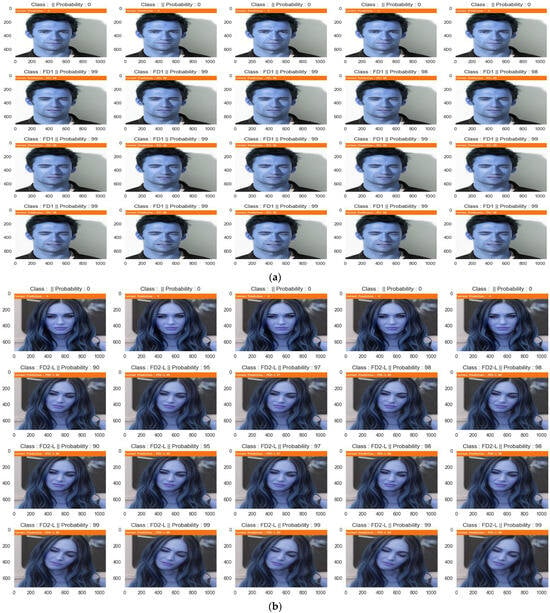
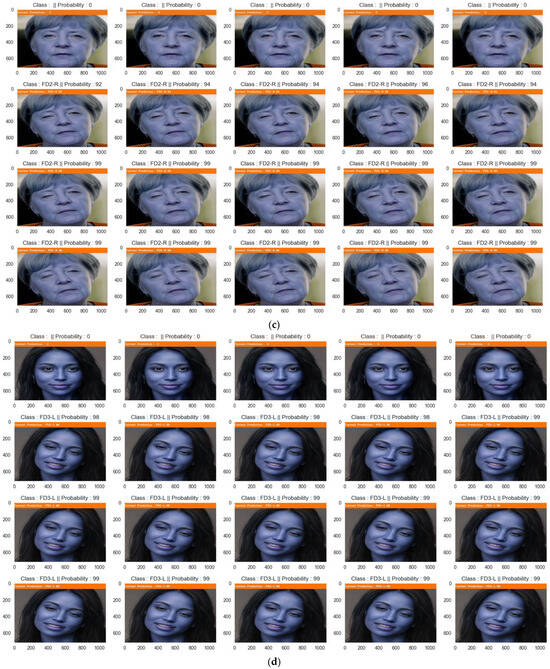
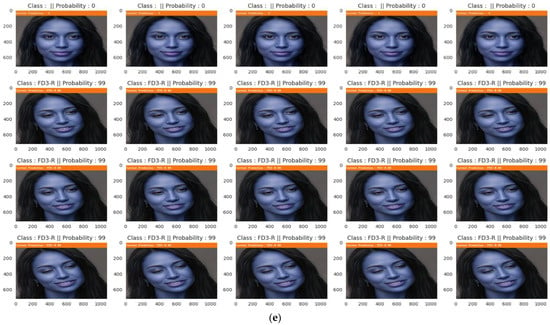
Figure 17.
The percentage of accuracy of model prediction for unseen data for different classes. (a) Accuracy of prediction of unseen data predicted as Class FD1. (b) Accuracy of prediction unseen data predicted as Class FD2-L. (c) Accuracy of prediction of unseen data predicted as Class FD2-R. (d) Accuracy of prediction of unseen data predicted as Class FD3-L. (e) Accuracy of prediction of unseen data predicted as Class FD3-R.
5. Conclusions
Our faces hold and show valuable clues about human emotions and their intentions [46]. FER has been intensively studied for the last few decades in computer vision, due to its importance to improving communication with individuals and generate empathetic responses. Early detection of signs of patients’ deterioration from facial expressions is a challenging task for healthcare professionals. Therefore, this paper has concentrated on proposing suitable methods, employing deep learning algorithms as a solution for identifying signs of patients’ deterioration through their FEs. With recent technologies and advancement in computer vision, pattern recognition, and machine learning, it is possible to detect and characterize FEs through images and video streams with high accuracy using DNN models such as ConvLSTM model. The main objective of this research was to design a framework for automatic FER to predict FEs of patients at risk of deterioration. The proposed system used a generated database called PRD-FE comprising five different combination sets of AUs (FD1, FD2-R, FD2-L, FD3-R, and FD3-L), representing FEs of deterioration risk. This paper presents a framework for automatic FER based on facial landmarks and ConvLSTM architecture, achieving state-of-the-art results with an accuracy of 99.89%. The proposed system has used a generated database that includes five classes of patients under deterioration, i.e., FD1, FD2-R, FD2-L, FD3-R, and FD3-L. Employing the facial landmarks detection technique resulted in improving the prediction of the proposed model,, achieving a significant accuracy of around 99.8%. Future work will concentrate on collecting real-world data to further validate the proposed models and present them as integrated systems with other medical assessment systems to enhance the chances of human survival.
Author Contributions
Conceptualization, Z.A.-T. and M.A.R.; methodology, Z.A.-T. and M.A.R.; software, Z.A.-T. and M.A.R.; validation, Z.A.-T. and M.A.R.; investigation, J.M.-C. and M.I.M.G.; resources, J.M.-C. and M.I.M.G.; data curation, Z.A.-T. and M.A.R.; writing—original draft preparation, Z.A.-T. and M.A.R.; writing—review and editing, Z.A.-T. and M.A.R.; visualization, M.A.R.; supervision, M.A.R.; project administration, M.A.R. All authors have read and agreed to the published version of the manuscript.
Funding
This research was funded by Sheffield Hallam University, grant number B3036983.
Institutional Review Board Statement
Not applicable.
Informed Consent Statement
Not applicable.
Data Availability Statement
The original contributions presented in the study are included in the article, further inquiries can be directed to the corresponding author.
Conflicts of Interest
The authors declare no conflict of interest.
References
- Manalu, H.V.; Rifai, A.P. Detection of human emotions through facial expressions using hybrid convolutional neural network-recurrent neural network algorithm. Intell. Syst. Appl. 2024, 21, 200339. [Google Scholar] [CrossRef]
- Cuesta, J.M.; Singer, M. The stress response and critical illness: A review. Crit. Care Med. 2012, 40, 3283–3289. [Google Scholar] [CrossRef] [PubMed]
- Madrigal-Garcia, M.I.; Rodrigues, M.; Shenfield, A.; Singer, M.; Moreno-Cuesta, J. What faces reveal: A novel method to identify patients at risk of deterioration using facial expressions. Crit. Care Med. 2018, 46, 1057–1062. [Google Scholar] [CrossRef] [PubMed]
- Street, R.L., Jr.; Makoul, G.; Arora, N.K.; Epstein, R.M. How does communication heal? Pathways linking clinician–patient communication to health outcomes. Patient Educ. Couns. 2009, 74, 295–301. [Google Scholar] [CrossRef] [PubMed]
- Jones, D.; Mitchell, I.; Hillman, K.; Story, D. Defining clinical deterioration. Resuscitation 2013, 84, 1029–1034. [Google Scholar] [CrossRef] [PubMed]
- Alasad, J.; Ahmad, M. Communication with critically ill patients. J. Adv. Nurs. 2005, 50, 356–362. [Google Scholar] [CrossRef] [PubMed]
- Ye, C.; Wang, O.; Liu, M.; Zheng, L.; Xia, M.; Hao, S.; Jin, B.; Jin, H.; Zhu, C.; Huang, C.J.; et al. A real-time early warning system for monitoring inpatient mortality risk: Prospective study using electronic medical record data. J. Med. Internet Res. 2019, 21, e13719. [Google Scholar] [CrossRef] [PubMed]
- Herr, K.; Coyne, P.J.; Ely, E.; Gélinas, C.; Manworren, R.C. Pain assessment in the patient unable to self-report: Clinical practice recommendations in support of the ASPMN 2019 position statement. Pain Manag. Nurs. 2019, 20, 404–417. [Google Scholar] [CrossRef]
- Odell, M.; Victor, C.; Oliver, D. Nurses’ role in detecting deterioration in ward patients: Systematic literature review. J. Adv. Nurs. 2009, 65, 1992–2006. [Google Scholar] [CrossRef]
- Guo, X.; Zhang, Y.; Lu, S.; Lu, Z. Facial expression recognition: A review. Multimed. Tools Appl. 2023, 83, 23689–23735. [Google Scholar] [CrossRef]
- Prakash, M.; Ravichandran, T. An efficient resource selection and binding model for job scheduling in grid. Eur. J. Sci. Res. 2012, 81, 450–458. [Google Scholar]
- Mehrabian, A. Nonverbal Communication; Routledge: London, UK, 2017. [Google Scholar]
- Ekman, P.; Friesen, W.V. Facial Action Coding Systems; Consulting Psychologists Press: Palo Alto, CA, USA, 1978. [Google Scholar]
- Rudovic, O.; Pavlovic, V.; Pantic, M. Context-sensitive dynamic ordinal regression for intensity estimation of facial action units. IEEE Trans. Pattern Anal. Mach. Intell. 2014, 37, 944–958. [Google Scholar] [CrossRef] [PubMed]
- Cascella, M.; Schiavo, D.; Cuomo, A.; Ottaiano, A.; Perri, F.; Patrone, R.; Migliarelli, S.; Bignami, E.G.; Vittori, A.; Cutugno, F.; et al. Artificial intelligence for automatic pain assessment: Research methods and perspectives. Pain Res. Manag. 2023, 2023, 6018736. [Google Scholar] [CrossRef]
- Nagireddi, J.N.; Vyas, A.K.; Sanapati, M.R.; Soin, A.; Manchikanti, L. The analysis of pain research through the lens of artificial intelligence and machine learning. Pain Physician 2022, 25, E211. [Google Scholar]
- Hardas, B.M.; Pokle, S.B. Optimization of peak to average power reduction in OFDM. J. Commun. Technol. Electron. 2017, 62, 1388–1395. [Google Scholar] [CrossRef]
- Rodriguez, P.; Cucurull, G.; Gonzàlez, J.; Gonfaus, J.M.; Nasrollahi, K.; Moeslund, T.B.; Roca, F.X. Deep pain: Exploiting long short-term memory networks for facial expression classification. IEEE Trans. Cybern. 2017, 52, 3314–3324. [Google Scholar] [CrossRef]
- Jaswanth, K.; David, D.S. A novel based 3D facial expression detection using recurrent neural network. In Proceedings of the 2020 International Conference on System, Computation, Automation and Networking (ICSCAN), Pondicherry, India, 3–4 July 2020; pp. 1–6. [Google Scholar]
- Sato, W.; Hyniewska, S.; Minemoto, K.; Yoshikawa, S. Facial expressions of basic emotions in Japanese laypeople. Front. Psychol. 2019, 10, 259. [Google Scholar] [CrossRef] [PubMed]
- Ekman, P.; Friesen, W.V. Constants across cultures in the face and emotion. J. Personal. Soc. Psychol. 1971, 17, 124. [Google Scholar] [CrossRef] [PubMed]
- Gosselin, P.; Kirouac, G.; Doré, F.Y. Components and recognition of facial expression in the communication of emotion by actors. J. Personal. Soc. Psychol. 1995, 68, 83. [Google Scholar] [CrossRef]
- Scherer, K.R.; Ellgring, H. Are facial expressions of emotion produced by categorical affect programs or dynamically driven by appraisal? Emotion 2007, 7, 113. [Google Scholar] [CrossRef]
- Lucey, P.; Cohn, J.F.; Prkachin, K.M.; Solomon, P.E.; Matthews, I. Painful data: The UNBC-McMaster shoulder pain expression archive database. In Proceedings of the 2011 IEEE International Conference on Automatic Face & Gesture Recognition (FG), Santa Barbara, CA, USA, 21–25 March 2011; pp. 57–64. [Google Scholar]
- Prkachin, K.M.; Solomon, P.E. The structure, reliability and validity of pain expression: Evidence from patients with shoulder pain. Pain 2008, 139, 267–274. [Google Scholar] [CrossRef] [PubMed]
- Ekman, P.; Friesen, W.v.; Hager, J. Facial action coding system: Research Nexus. In Network Research Information; Research Nexus: Salt Lake City, UT, USA, 2002. [Google Scholar]
- Gross, J.; Cuesta, J.; Crawford, S.; Devaney, M.; Madrigal-Garcia, M. The face of illness: Analysing facial expressions in critical illness in conjunction with the facial action coding system (FACS). In Proceedings of the Intensive Care Medicine; Springer: New York, NY, USA, 2013; Volume 39, p. S265. [Google Scholar]
- Chen, J.; Lv, Y.; Xu, R.; Xu, C. Automatic social signal analysis: Facial expression recognition using difference convolution neural network. J. Parallel Distrib. Comput. 2019, 131, 97–102. [Google Scholar] [CrossRef]
- Gunes, H.; Hung, H. Is automatic facial expression recognition of emotions coming to a dead end? The rise of the new kids on the block. Image Vis. Comput. 2016, 55, 6–8. [Google Scholar] [CrossRef]
- Jaiswal, S.; Valstar, M. Deep learning the dynamic appearance and shape of facial action units. In Proceedings of the 2016 IEEE Winter Conference on Applications of Computer Vision (WACV), Lake Placid, NY, USA, 7–10 March 2016; pp. 1–8. [Google Scholar]
- Sang, D.V.; Van Dat, N. Facial expression recognition using deep convolutional neural networks. In Proceedings of the 2017 9th International Conference on Knowledge and Systems Engineering (KSE), Hue, Vietnam, 19–21 October 2017; pp. 130–135. [Google Scholar]
- Chen, X.; Yang, X.; Wang, M.; Zou, J. Convolution neural network for automatic facial expression recognition. In Proceedings of the 2017 International Conference on Applied System Innovation (ICASI), Sapporo, Japan, 13–17 May 2017; pp. 814–817. [Google Scholar]
- Al Taee, E.J.; Jasim, Q.M. Blurred Facial Expression Recognition System by Using Convolution Neural Network. Webology 2020, 17, 804–816. [Google Scholar] [CrossRef]
- Mohan, K.; Seal, A.; Krejcar, O.; Yazidi, A. Facial expression recognition using local gravitational force descriptor-based deep convolution neural networks. IEEE Trans. Instrum. Meas. 2020, 70, 5003512. [Google Scholar] [CrossRef]
- Siarohin, A.; Lathuilière, S.; Tulyakov, S.; Ricci, E.; Sebe, N. First order motion model for image animation. Adv. Neural Inf. Process. Syst. 2019, 32, 7137–7147. [Google Scholar]
- Malik, Y.S.; Sabahat, N.; Moazzam, M.O. Image animations on driving videos with DeepFakes and detecting DeepFakes generated animations. In Proceedings of the 2020 IEEE 23rd International Multitopic Conference (INMIC), Bahawalpur, Pakistan, 5–7 November 2020; pp. 1–6. [Google Scholar]
- Shi, X.; Chen, Z.; Wang, H.; Yeung, D.Y.; Wong, W.K.; Woo, W.C. Convolutional LSTM network: A machine learning approach for precipitation nowcasting. Adv. Neural Inf. Process. Syst. 2015, 28, 802–810. [Google Scholar]
- Singh, R.; Saurav, S.; Kumar, T.; Saini, R.; Vohra, A.; Singh, S. Facial expression recognition in videos using hybrid CNN & ConvLSTM. Int. J. Inf. Technol. 2023, 15, 1819–1830. [Google Scholar] [PubMed]
- Tian, Y.; Zhang, K.; Li, J.; Lin, X.; Yang, B. LSTM-based traffic flow prediction with missing data. Neurocomputing 2018, 318, 297–305. [Google Scholar] [CrossRef]
- Zhang, L.; Zhu, G.; Mei, L.; Shen, P.; Shah, S.A.A.; Bennamoun, M. Attention in convolutional LSTM for gesture recognition. Adv. Neural Inf. Process. Syst. 2018, 31, 1953–1962. [Google Scholar]
- Ikram, S.T.; Cherukuri, A.K. Improving accuracy of intrusion detection model using PCA and optimized SVM. J. Comput. Inf. Technol. 2016, 24, 133–148. [Google Scholar] [CrossRef]
- Thaseen, I.S.; Kumar, C.A. Intrusion detection model using fusion of chi-square feature selection and multi class SVM. J. King Saud Univ.-Comput. Inf. Sci. 2017, 29, 462–472. [Google Scholar]
- Abo-Tabik, M.A. Using Deep Learning Predictions of Smokers’ Behaviour to Develop a Smart Smoking-Cessation App. Ph.D. Thesis, Manchester Metropolitan University, Manchester, UK, 2021. [Google Scholar]
- Chakravarthi, B.R.; Priyadharshini, R.; Muralidaran, V.; Suryawanshi, S.; Jose, N.; Sherly, E.; McCrae, J.P. Overview of the track on sentiment analysis for dravidian languages in code-mixed text. In Proceedings of the 12th Annual Meeting of the Forum for Information Retrieval Evaluation, Hyderabad, India, 16–20 December 2020; pp. 21–24. [Google Scholar]
- Lachgar, M.; Hrimech, H.; Kartit, A. Optimization techniques in deep convolutional neuronal networks applied to olive diseases classification. Artif. Intell. Agric. 2022, 6, 77–89. [Google Scholar]
- Arul Vinayakam Rajasimman, M.; Manoharan, R.K.; Subramani, N.; Aridoss, M.; Galety, M.G. Robust facial expression recognition using an evolutionary algorithm with a deep learning model. Appl. Sci. 2022, 13, 468. [Google Scholar] [CrossRef]
Disclaimer/Publisher’s Note: The statements, opinions and data contained in all publications are solely those of the individual author(s) and contributor(s) and not of MDPI and/or the editor(s). MDPI and/or the editor(s) disclaim responsibility for any injury to people or property resulting from any ideas, methods, instructions or products referred to in the content. |
© 2024 by the authors. Licensee MDPI, Basel, Switzerland. This article is an open access article distributed under the terms and conditions of the Creative Commons Attribution (CC BY) license (https://creativecommons.org/licenses/by/4.0/).


