Article

A Method for Analyzing Navigation Flows of Health Website Users Seeking Complex Health Information with Google Analytics

by
Patrick Cheong-Iao Pang
1,*,
Megan Munsie
2 and
Shanton Chang
3
1
Faculty of Applied Sciences, Macao Polytechnic University, Macao SAR, China
2
Stem Cell Ethics and Policy Group, Murdoch Children’s Research Institute, Melbourne Medical School, The University of Melbourne, Melbourne 3010, Australia
3
School of Computing and Information Systems, The University of Melbourne, Melbourne 3010, Australia
*
Author to whom correspondence should be addressed.
Informatics 2023, 10(4), 80; https://doi.org/10.3390/informatics10040080
Submission received: 28 June 2023 / Revised: 11 October 2023 / Accepted: 18 October 2023 / Published: 20 October 2023
(This article belongs to the Section Health Informatics)

Abstract

:
People are increasingly seeking complex health information online. However, how they access this information and how influential it is on their health choices remains poorly understood. Google Analytics (GA) is a widely used web analytics tool and it has been used in academic research to study health information-seeking behaviors. Nevertheless, it is rarely used to study the navigation flows of health websites. To demonstrate the usefulness of GA data, we adopted both top-down and bottom-up approaches to study how web visitors navigate within a website delivering complex health information about stem cell research using GA’s device, traffic and path data. Custom Treemap and Sankey visualizations were used to illustrate the navigation flows extracted from these data in a more understandable manner. Our methodology reveals that different device and traffic types expose dissimilar search approaches. Through the visualizations, popular web pages and content categories frequently browsed together can be identified. Information on a website that is often overlooked but needed by many users can also be discovered. Our proposed method can identify content requiring improvements, enhance usability and guide a design for better addressing the needs of different audiences. This paper has implications for how web designers can use GA to help them determine users’ priorities and behaviors when navigating complex information. It highlights that even where there is complex health information, users may still want more direct and easy-to-understand navigations to retrieve such information.

1. Background

Google Analytics (GA) is an effective tool for monitoring and analyzing web traffic and it has been adopted in many websites for performing web analytics. Meanwhile, health information websites serve as one of the common information sources of complex health information, which refers to information that is complicated, hard to interpret and understand, even though it is accurate [1]. Prior research argues that different categories of information seekers use different approaches to obtain information, and therefore health information websites have to design accordingly for greater usability and readability in order to maximize their impact and benefits. To further complicate this phenomenon, research has shown that health information-seeking behavior may manifest differently depending on a number of different factors ranging from the health literacy and digital literacy of information seekers [2], to the urgency, personal goals and education level of information seekers [3]. Therefore, it is hard to predict how well users might navigate through a website that is presenting health information. Set against this background, GA can be a valuable tool for identifying focuses of improvements because it helps to track the behavior of a wide range of visitors to the same website. It has been widely used in a range of applications, such as e-commerce websites [4], online learning platforms [5,6], scholar websites [7] and health information websites [8]. GA’s capabilities to understand what visitors are doing on websites are important because GA can guide a better design for matching the diverse needs, search approaches and usage patterns of information seekers. The use of GA can also set the standard for improving the usability of websites, which is an issue of health IT slowly addressed by the sector [9]. As such, there is an increasing amount of health research using GA as an analytical methodology recently.
We found a wide range of literature leveraging the capabilities of GA in different health research. As web-based interventions are actively developed for various purposes, GA is used for evaluating the processes of sexual health interventions [10] and health portals [11,12]. In the meantime, there are many health information websites and social media campaigns created for health promotion and education, and GA is adopted for understanding the demographics of visitors [13,14], browsing behaviors [14,15], activities and durations on websites [13,16], as well as the effectiveness of the websites [17,18,19]. Additionally, websites of medical schools can gain advantages with GA [20,21]. GA is used for studying the interests and preferences of the visitors of such websites and improving the content on these websites, so that prospective medical students can better understand their careers and expectations, which allows medical schools to recruit well-prepared students [21,22]. Finally, GA can be used for studying information-seeking behaviors in general [23].
Although GA is frequently used in academic research, the data provided by GA are not fully utilized. Table 1 lists the common variables and data features used in the literature. As shown in the table, most research has analyzed basic variables such as numbers of users and sessions, bounce rates, duration of visits, etc. Path exploration, which is a feature to understand users’ series of activities and navigation flows on a website [24], is often overlooked in much research with GA. While a few studies investigate the navigations of users within websites, e.g., [6,14], there are no systematic methodologies to guide the analysis with navigation paths in GA. This motivates our work to summarize our experience of studying navigation flows using path exploration.
Stem cell science is a particularly challenging space for people seeking information to navigate due to the proliferation of commercial clinics marketing unsubstantiated claims directed towards consumers about their reputed “stem cell” service; a heightened awareness of the promise of stem cell science exists, and unmet needs of many living with currently incurable conditions affecting their quality of life [26]. In addition, because of the complexity of stem cell treatments, involving different body parts, treatment choices and fast-paced research, patients and information consumers demand credible, understandable and easy-to-access information in this space [19].
This paper aims to demonstrate the needs of patients and users with GA path data to understand their behaviors with both top-down and bottom-up strategies using real-world data from Stem Cells Australia (SCA), https://www.stemcellsaustralia.edu.au (accessed on 19 October 2022), which is a dedicated website designed for people curious to learn more about stem cell research and what therapies might be available to help them or their loved ones. The information on the website is curated by a team of independent experts from the University of Melbourne and leading Australian community groups and patient advocates. We argue that GA was useful for making SCA better, and in general, it also illustrates the value of such analytics to other websites with complex health information. In the next section, we introduce our methods to collect and transform data for further processing. In addition, since information visualizations can help people to perceive insights within complicated connections and flows, we adopted two types of information visualizations, namely Treemap and Sankey diagrams, to illustrate how to identify useful clues from such navigation flows. Our contributions are to provide a systematic approach to allow observing peoples’ different search approaches theoretically, as well as to highlight practical improvement areas (e.g., design, content and layout) for health websites based on GA analyses of navigation flows.

2. Methods

GA provides a wide range of data describing user demographics (for example, numbers of users and sessions, countries/areas of origin) and descriptive variables of browsing behaviors (for example, numbers of pages viewed and numbers of web pages in sessions). Prior research has investigated its usefulness and effectiveness in scientific research [7,14,23], but it is less used for understanding users’ complicated navigation flows. As such, we focus on the GA variables that reflect path exploration and the transitions of navigation flows of website visitors. These variables require further processing and analyses in order to obtain useful insights. Additionally, we leveraged information visualization to help to make sense of a large amount of complex data. In the below sub-sections, we explain our approaches and visualization methods for analyzing these variables.

2.1. Data Sources

In this work, we used the data collected from SCA to illustrate our approaches to working with GA data. The current version of this website was designed based on participatory design principles and was launched in January 2021. Funded by the University of Melbourne, this information portal is a legacy of an initiative established by the Australian Government between 2011 and 2019 to support stem cell researchers to develop novel diagnostic, therapeutic and biotechnological applications [27]. GA was installed on the website to gain a glance at the usage of the site, and to allow research activities for understanding users better and further improving the website. In this paper, we used the data collected in February 2021 from GA. Although the COVID-19 epidemic might affect the behaviors of website visitors in this period, it did not hinder the demonstration of the analysis of navigation flows and user activities based on these data. Ethics approval was not required because GA reported aggregated data and no data of individuals were involved.

2.2. Device and Traffic Types

GA classifies web traffic into three different categories, desktop, tablet and mobile, based on the types of devices used by web visitors. These data have been used in other research as well; however, we need to mention that some parts of these data were merged for better partitioning navigation flows in our work. Since both desktop and tablet devices usually share some characteristics, such as a larger screen compared with mobile devices and similar screen size ratios, a desktop version of a website was displayed on both types of devices. Another consideration was that tablet traffic had only a relatively small volume of traffic. As such, the data of desktops and tablets were merged in our analyses. The two-sided independent t-test was used to statistically test the differences of metrics between two device types.
Additionally, we adopted three different traffic types offered with GA, namely direct traffic, referral traffic and organic traffic, to guide us to differentiate the traffic originating from various sources. Traffic types can help to determine how users get to know the websites. Direct traffic refers to direct access to websites through web addresses, bookmarks and browsing histories, and such traffic is directly initiated by users. Referral traffic denotes visits that are referred with social media posts or other external websites (such as from a link on a web page). Organic traffic refers to the traffic brought with search engines, i.e., a web page is returned in a search result and a user clicks on the link in the list of the search results. One-way ANOVA was used to examine the differences among three types of traffic statistically.

2.3. Working with Paths of Web Pages

Web browsers use web addresses (technically known as Uniform Resource Locators, URLs) to load web pages on the internet. Figure 1 shows an example of the format of URLs. Common parts of a URL include a domain name (host name) representing the identity of a website and the path section. Many types of data recorded in GA are corresponding to the path section of web addresses, and these paths contain information for understanding what readers seek. For example, the URL in Figure 1 denotes a web page of SCA read by a user. The path can be split into segments with the slash symbol (/) and these segments show a hierarchy of information like the folder structures in computers. In modern websites, the first left-most segment usually represents the top-level category of the web page, the second segment represents the sub-category and so on. The last path segment depicts the name of the web page. While this interpretation of path segments is only a convention, many websites follow this convention in hopes of gaining more traffic from search engines. In addition, this can help researchers to analyze the navigations from one category to another.
With this category information, the path of a web page can be used for aggregating navigation data. Table 2 shows the examples of these web page paths and their numbers of page views as recorded with GA. Using the path segments, we derive their top categories and sub-categories as listed in the second and third columns. In this way, we started to observe the total number of views at a page level and aggregated the numbers up to the top level of categories; therefore, this is considered a bottom-up analysis. Using the path “/conditions/explore/osteoarthritis/” as one example, it represents a web page named “osteoarthritis” in the “explore” sub-category inside the “conditions” category and this page had 68 views. We can also view the numbers at the category level instead of the page level. With the same example, the “conditions” category had 74 + 68 = 142 views as both “osteoarthritis” and “spinal-cord-injuries” pages contributed to the total. Additionally, it is worth mentioning that paths are case-sensitive by definition and we had to convert them to lowercase, so that computers could treat spellings with different cases as the same category, which made aggregations easier. Leveraging this method, we can evaluate the popularity of web pages and their multiple levels of categories by evaluating the aggregated numbers of views. Considering these numbers may not be intuitive at the first glance, we created Treemap visualizations to further illustrate the data (discussed in Section 3.2).

2.4. Deriving Navigation Flows

Another useful feature of GA is the navigation data. They contain which web pages are visited by users, and what other pages are also viewed by users consequently on the website. With these data, we can find out what topics or content are interesting to users, what other content they would like to follow up on and which areas are more engaging with the audiences. Table 3 shows a few examples of raw navigation data directly from GA. As seen in the table, rather than showing where a user went from/to, it shows the path of a web page and which web page came before that one. This is not a straightforward way to understand the navigation flows of users.
Although there is valuable information within, raw navigation data require further cleansing and processing so that we can extract useful insights. Similar to the approach for analyzing web page paths introduced in the previous sub-section, the first step was to convert these paths to lowercase and separate each path into segments, and then we only measured the first path segments (i.e., the top-level categories). We also created a “home” category for the path with a single slash “/” (which is the path for the home page). For this analysis, we were interested in the flows among different high-level categories instead of pages, to avoid scattered and trivial traffic recorded on individual pages. This approach is also known as a top-down approach. To make the data more readable, we swapped the first (path) and second (previous page path) columns in the original data. The examples in Table 3 were transformed into the data displayed in Table 4. In this case, we used path hierarchies to aggregate the numbers of views of lower levels to higher ones. While we chose to study the highest level of the paths in this paper, readers could choose to aggregate to sub-levels depending on their needs.
It might be difficult to understand navigation flows by using solely numbers, and therefore we used Sankey visualizations to show the transition from one category to another. An example of this visualization can be seen in Section 3.3. Sankey diagrams were firstly seen in 1898 for showing the energy flows of engines [28], and have been adopted in academic research to show web traffic [8]. The visualization shows two columns of nodes, depicting the source and the destination of flows. Each column is broken down into different colored parts to show categories of web pages and their sizes display the numbers of web pages included in such categories. The flows in the middle of the visualization reflect the volume of web traffic flowing from one category to another. In this paper, we used HTML5 and D3.js software libraries to draw Sankey visualizations. The visualizations created with this approach were interactive, which allowed others to explore the flows and the relationships among categories of web pages by themselves.

3. Results

This section presents the analysis based on devices and traffic types, as well as the results of our web page path and navigation flow analyses.

3.1. Device and Traffic Types

Table 5 displays the metrics of web users visiting SCA by different types of devices in a month. In this example, it could be clearly seen that desktop and tablet traffic had a higher ratio than mobile traffic. Desktop and tablet traffic also had a larger number of pages read per session and a longer average session length, while mobile traffic showed a greater bounce rate. However, when compared with the new user ratios, mobile traffic attracted a higher ratio (967/1046 = 92%) of new users than desktop and tablet users (2074/2485 = 83%). These figures illustrated the different behaviors exposed by users with different devices. Desktop and tablet users included more returning users, and they tended to read more articles and stay longer. On the other hand, mobile devices could gain more new users; meanwhile, mobile users appeared to read less and for a shorter time. The differences of means of bounce rates, pages per sessions and average session durations were statistically significant at the p < 0.0001 level.
Table 6 shows the metrics of different traffic types in the same month. Despite that the statistical tests were not significant, in the case of SCA, organic traffic was observed as the traffic type with the highest volume, followed by direct traffic and lastly referral traffic, which suggested that much of the traffic came from search engines. For referral traffic, although it was the lowest in number, it brought the highest ratio (93%) of new users to the website. This was consistent with the features of social media platforms and other websites for redirecting users to different locations on the web. On the other hand, direct and organic traffic was relatively higher in terms of the number of pages read and the average session length. These observations reflected the different characteristics of the sources of users and their different behaviors.
It is worthwhile to note that, due to GA’s technical limitations, the device or traffic types of a small number of visits cannot be determined; therefore, they were considered missing data and removed. In this case, the sums of users, new users and sessions do not add up in Table 5 and Table 6.

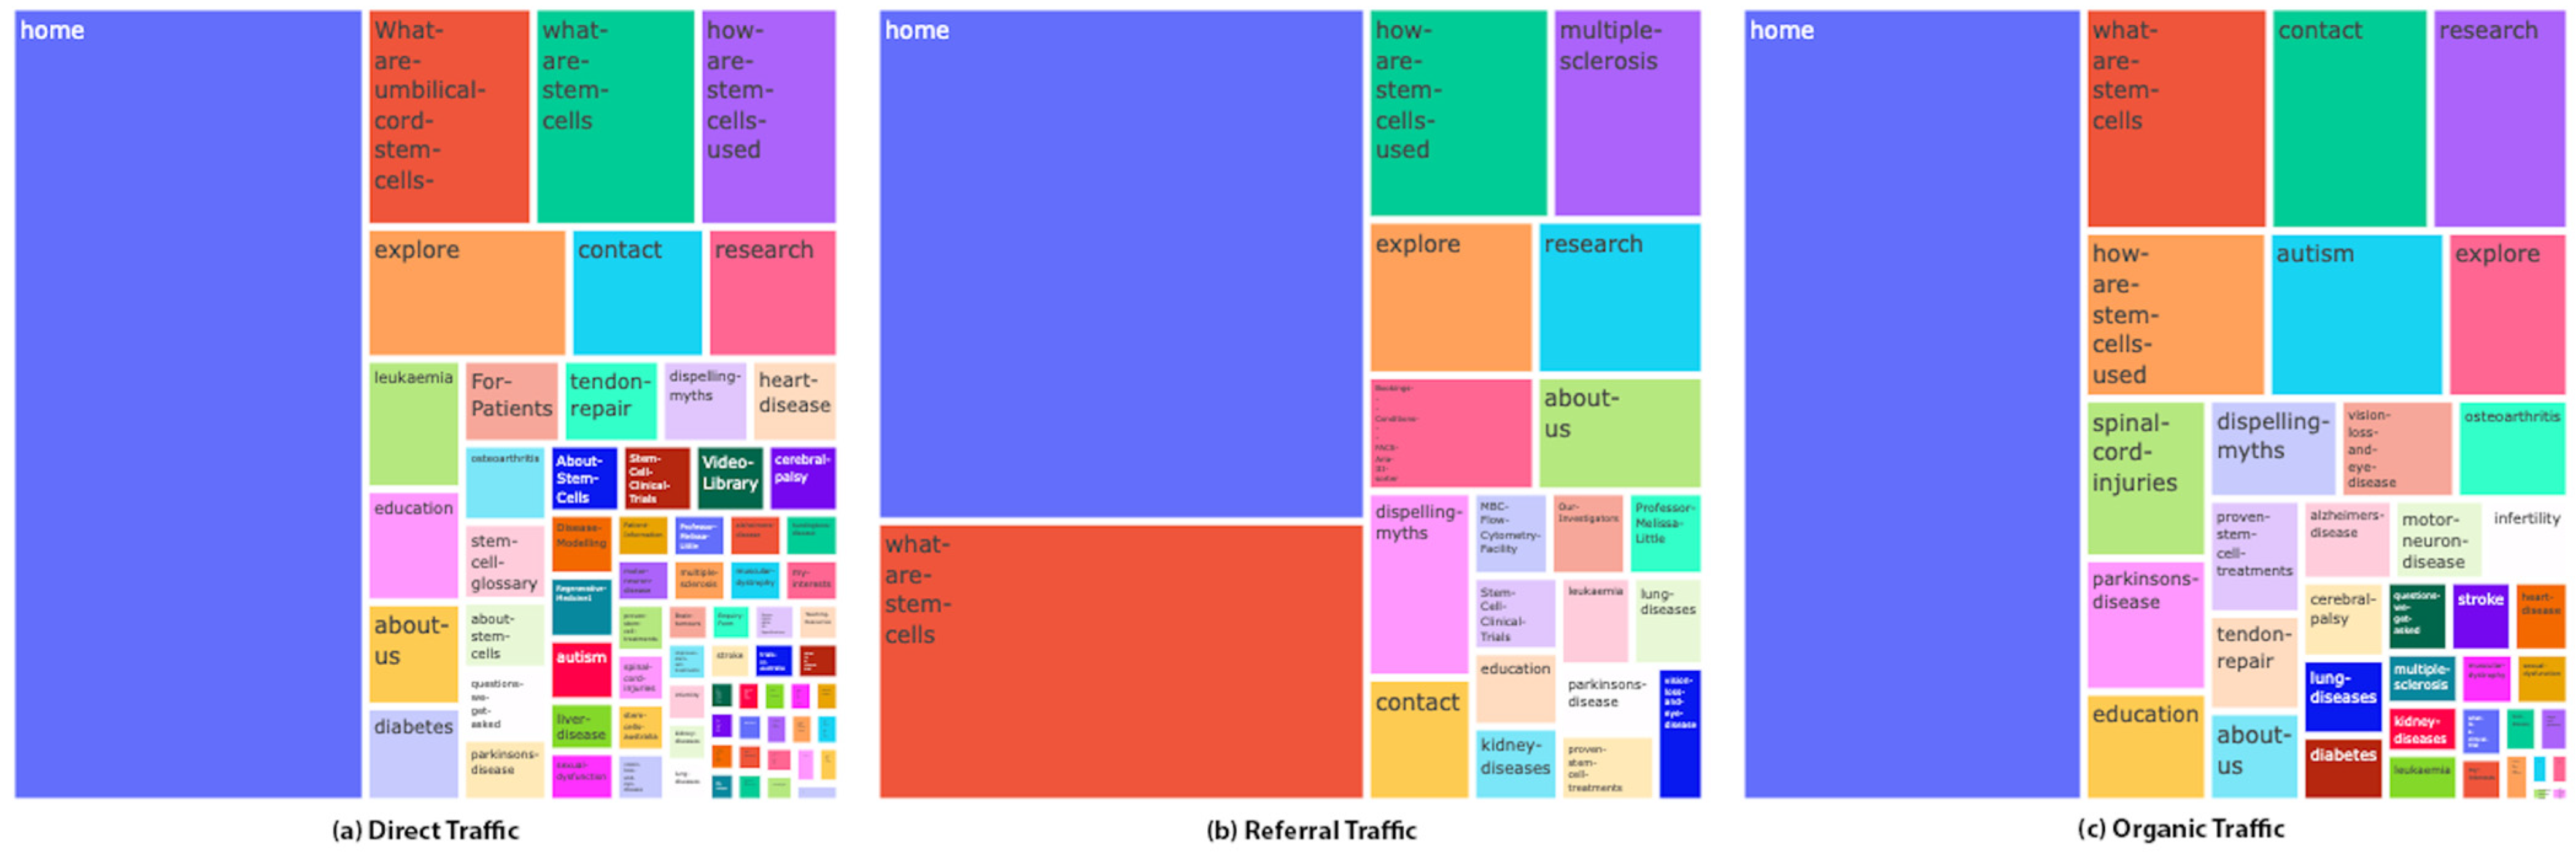
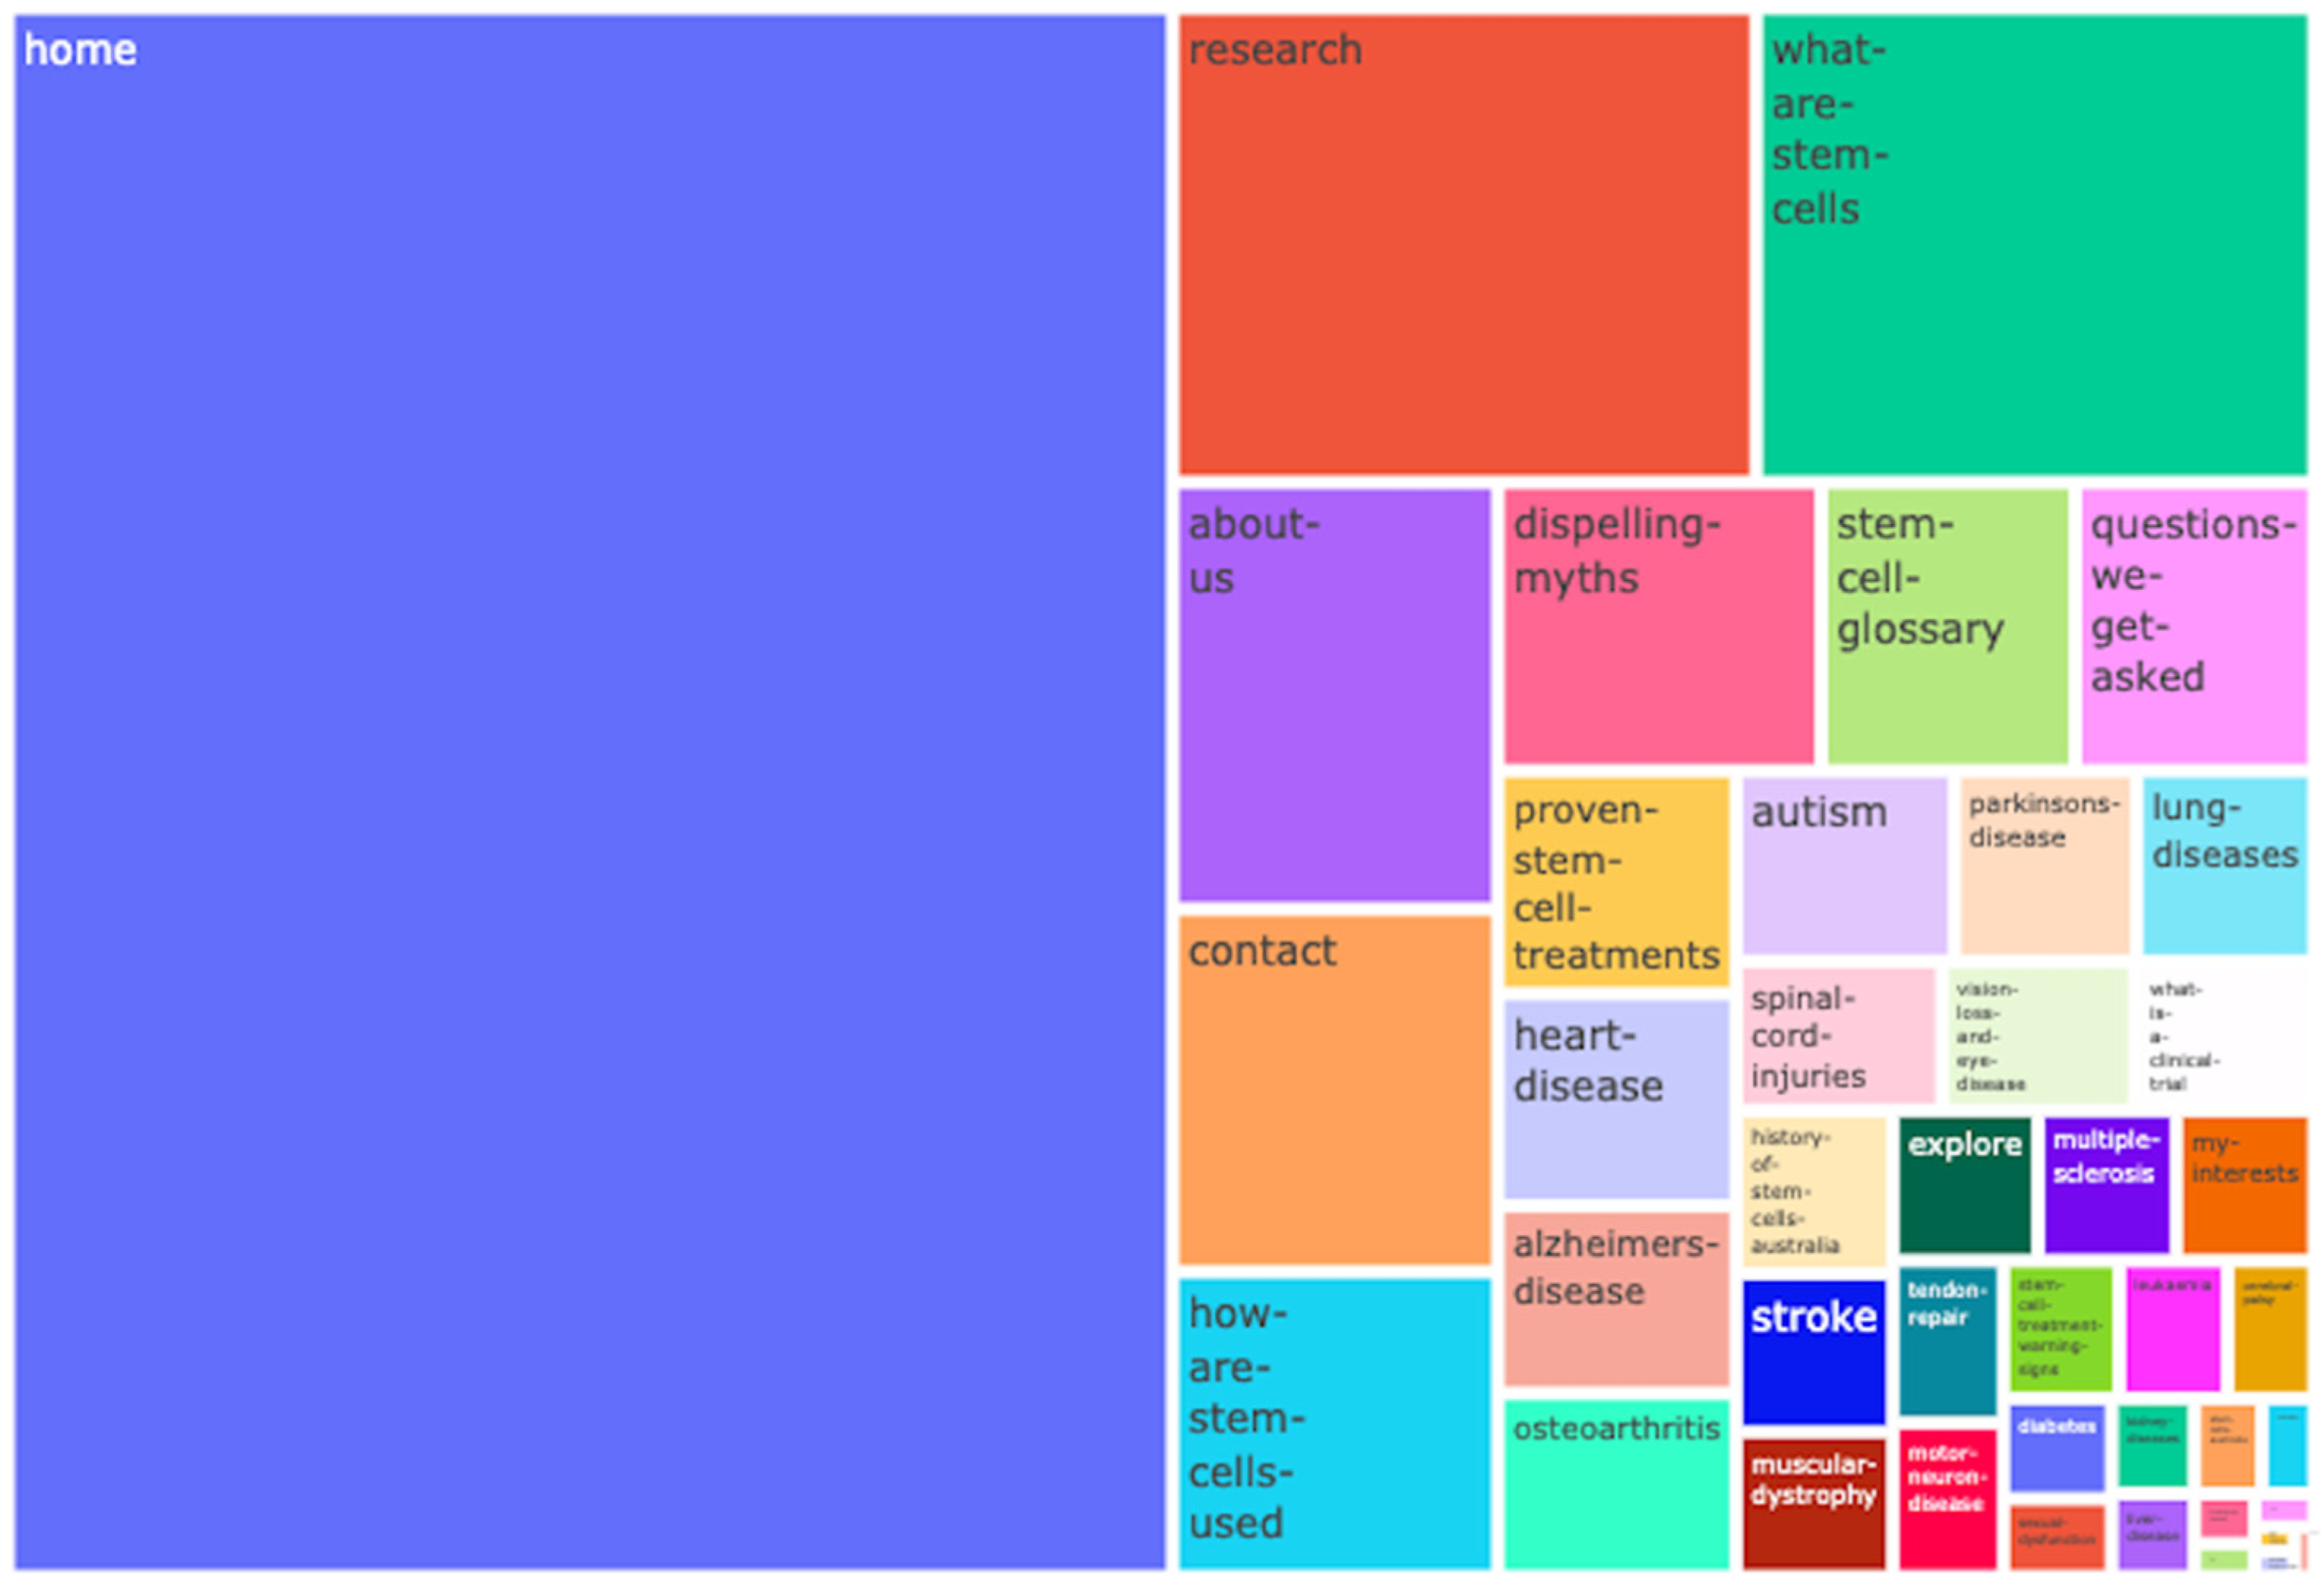
3.2. Path Analysis Results

Table 7 lists five examples of viewed categories of web pages to illustrate the use of a path segment analysis. It could be seen that the home page (named “home” in the table) attracted the greatest number of views. Thanks to the meaningful organization using the path components of web addresses, it could be identified that some areas of the website, such as “research” and stem cell information (i.e., “how-are-stem-cells-used” and “what-are-stem-cells”), gained hundreds of visits. Additionally, the full set of page views data can be visualized using a Treemap diagram as shown in Figure 2. With the visualization, we could evaluate that the home page received almost half of the traffic. Apart from the home page, other topics like “research”, “what-are-stem-cells”, “about-us”, “dispelling-myths”, etc., should receive more attention from the web administrators because of their relatively high number of views. The interactive version of this Treemap (not included in the manuscript) could be used to identify web page categories with the least traffic (i.e., the smallest rectangles at the bottom-right corner).
We further divided these data into three traffic types, direct, referral and organic, and visualized them in Figure 3. In terms of content, direct traffic demonstrated a mixed pattern with different topical areas visited by users. Referral and organic traffic appeared more focused and specific content was accessed. However, organic traffic showed more variety in the composition of categories. Moreover, because of the definition of organic traffic, its data reflected what information users were looking for in search engines. In this instance, it could be seen that those users searched a range of information from generic questions like “what-are-stem-cells” to particular conditions such as “autism” and “spinal-cord-injuries”.

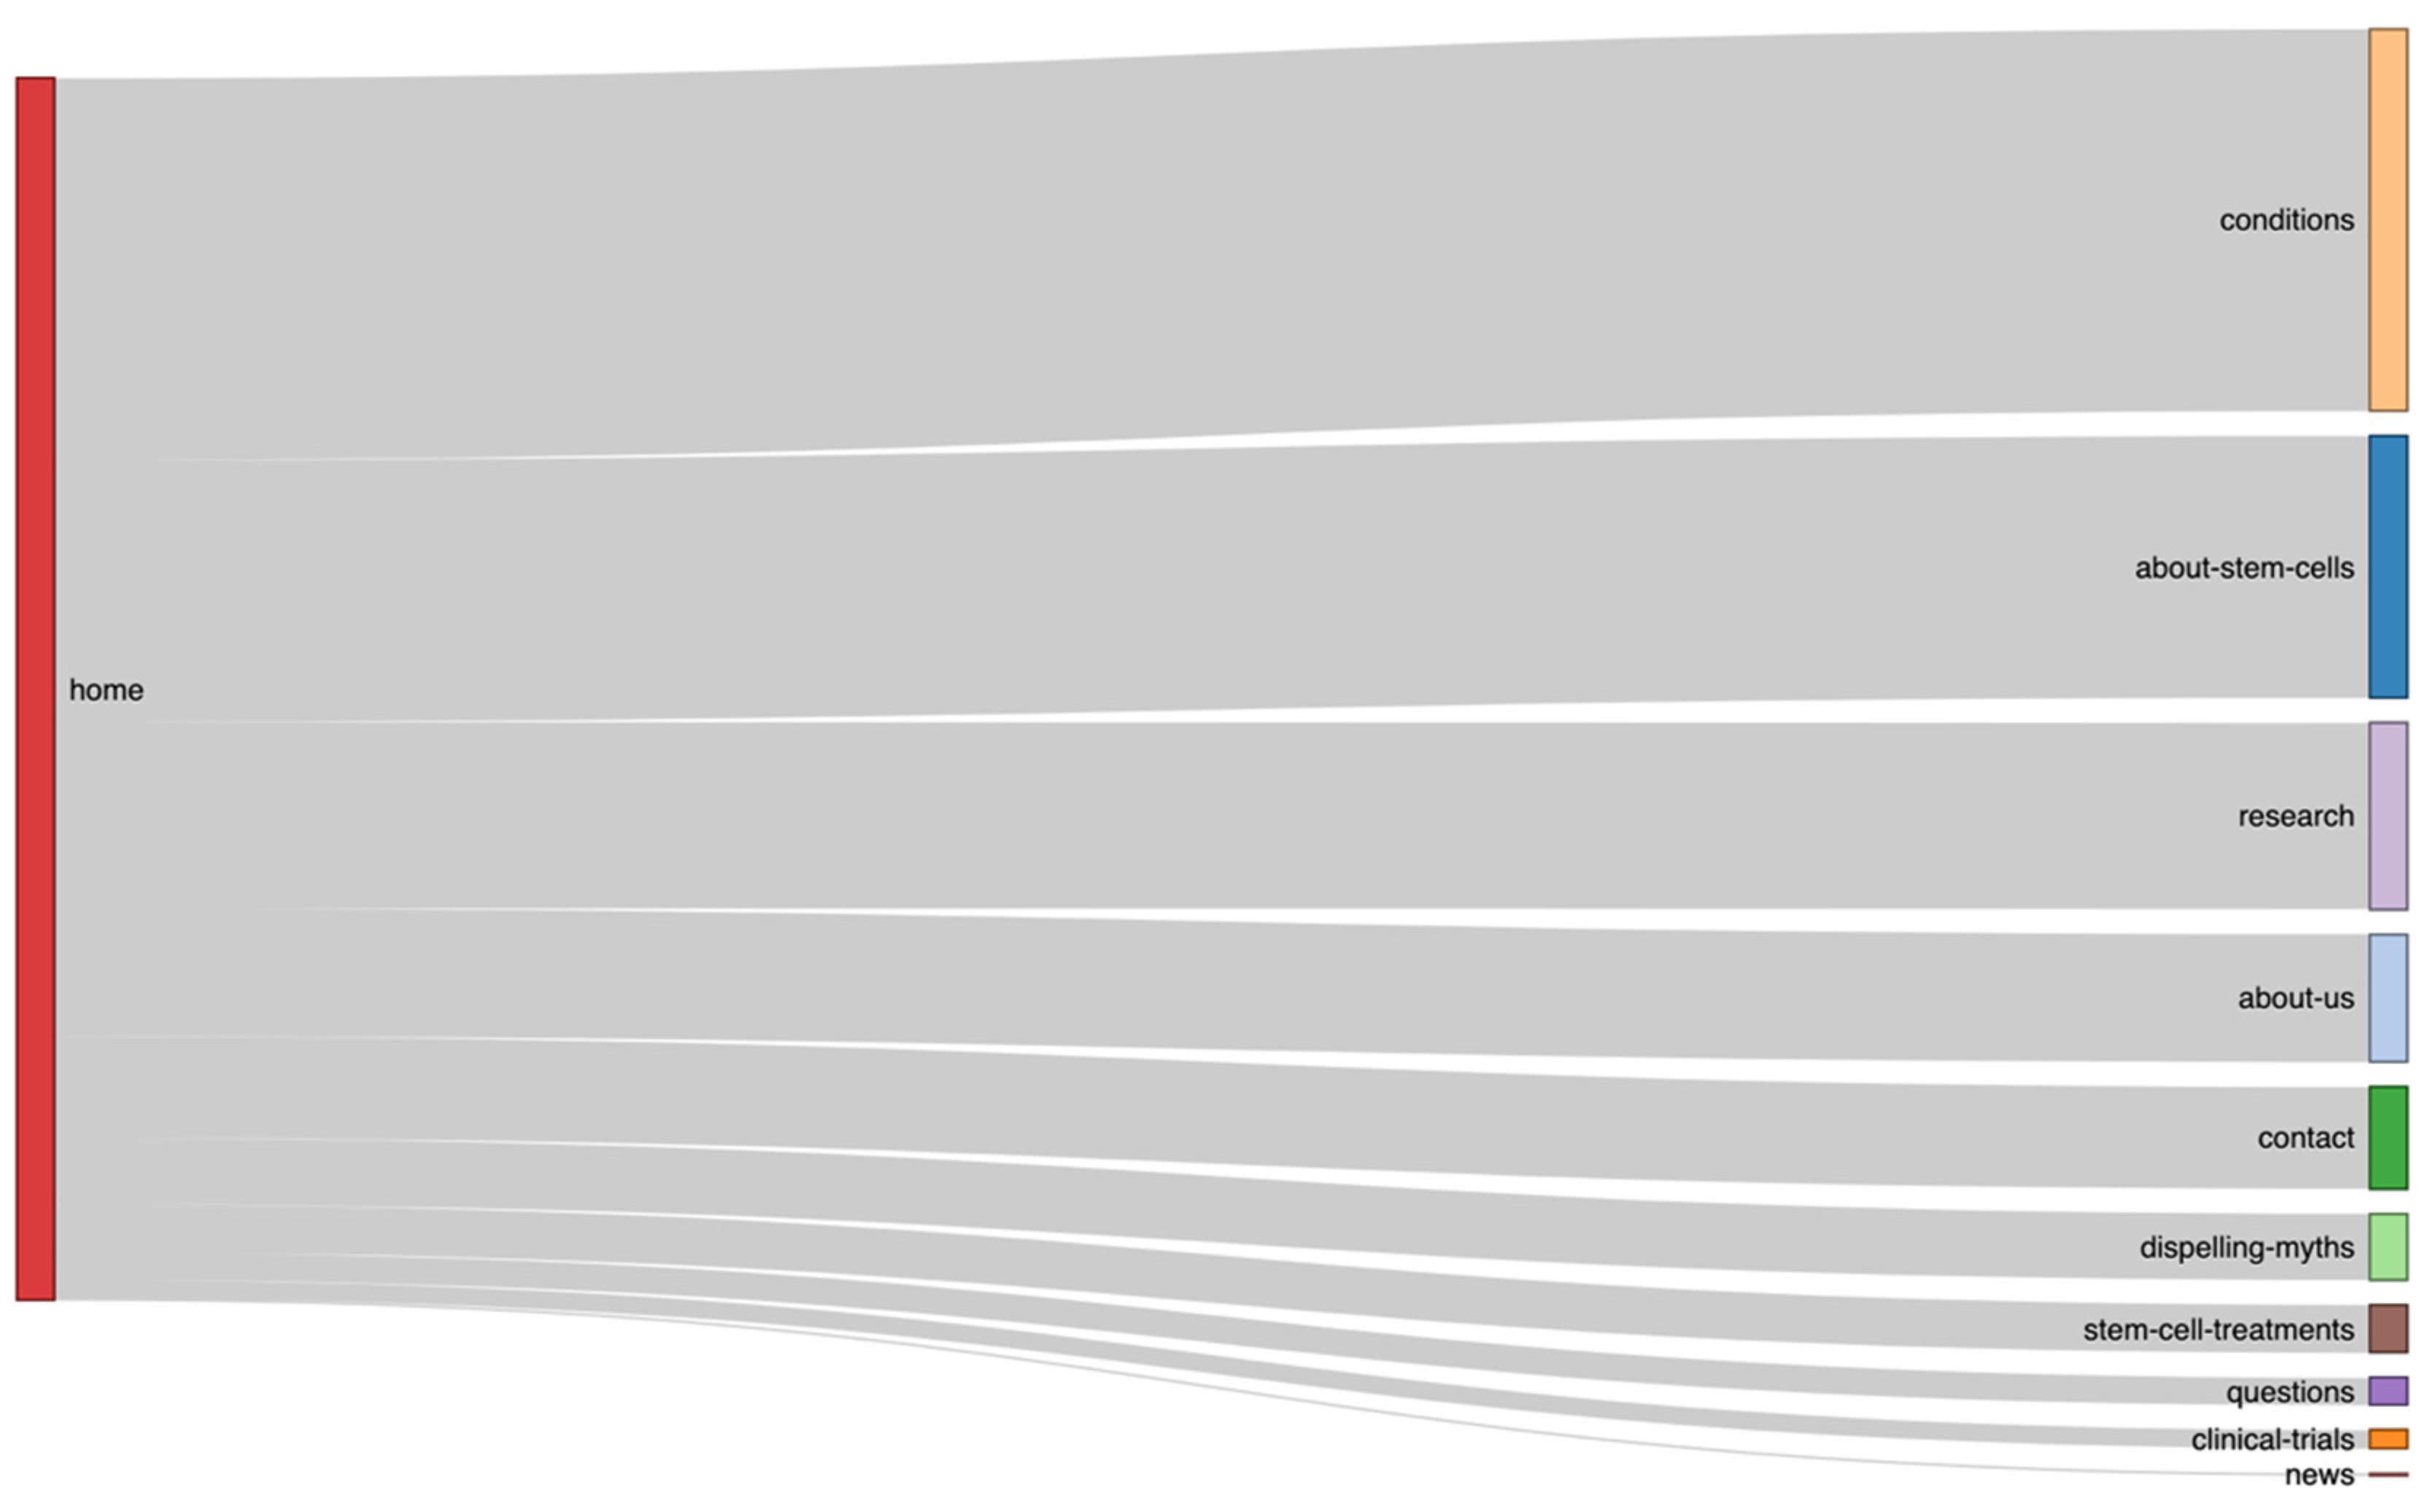
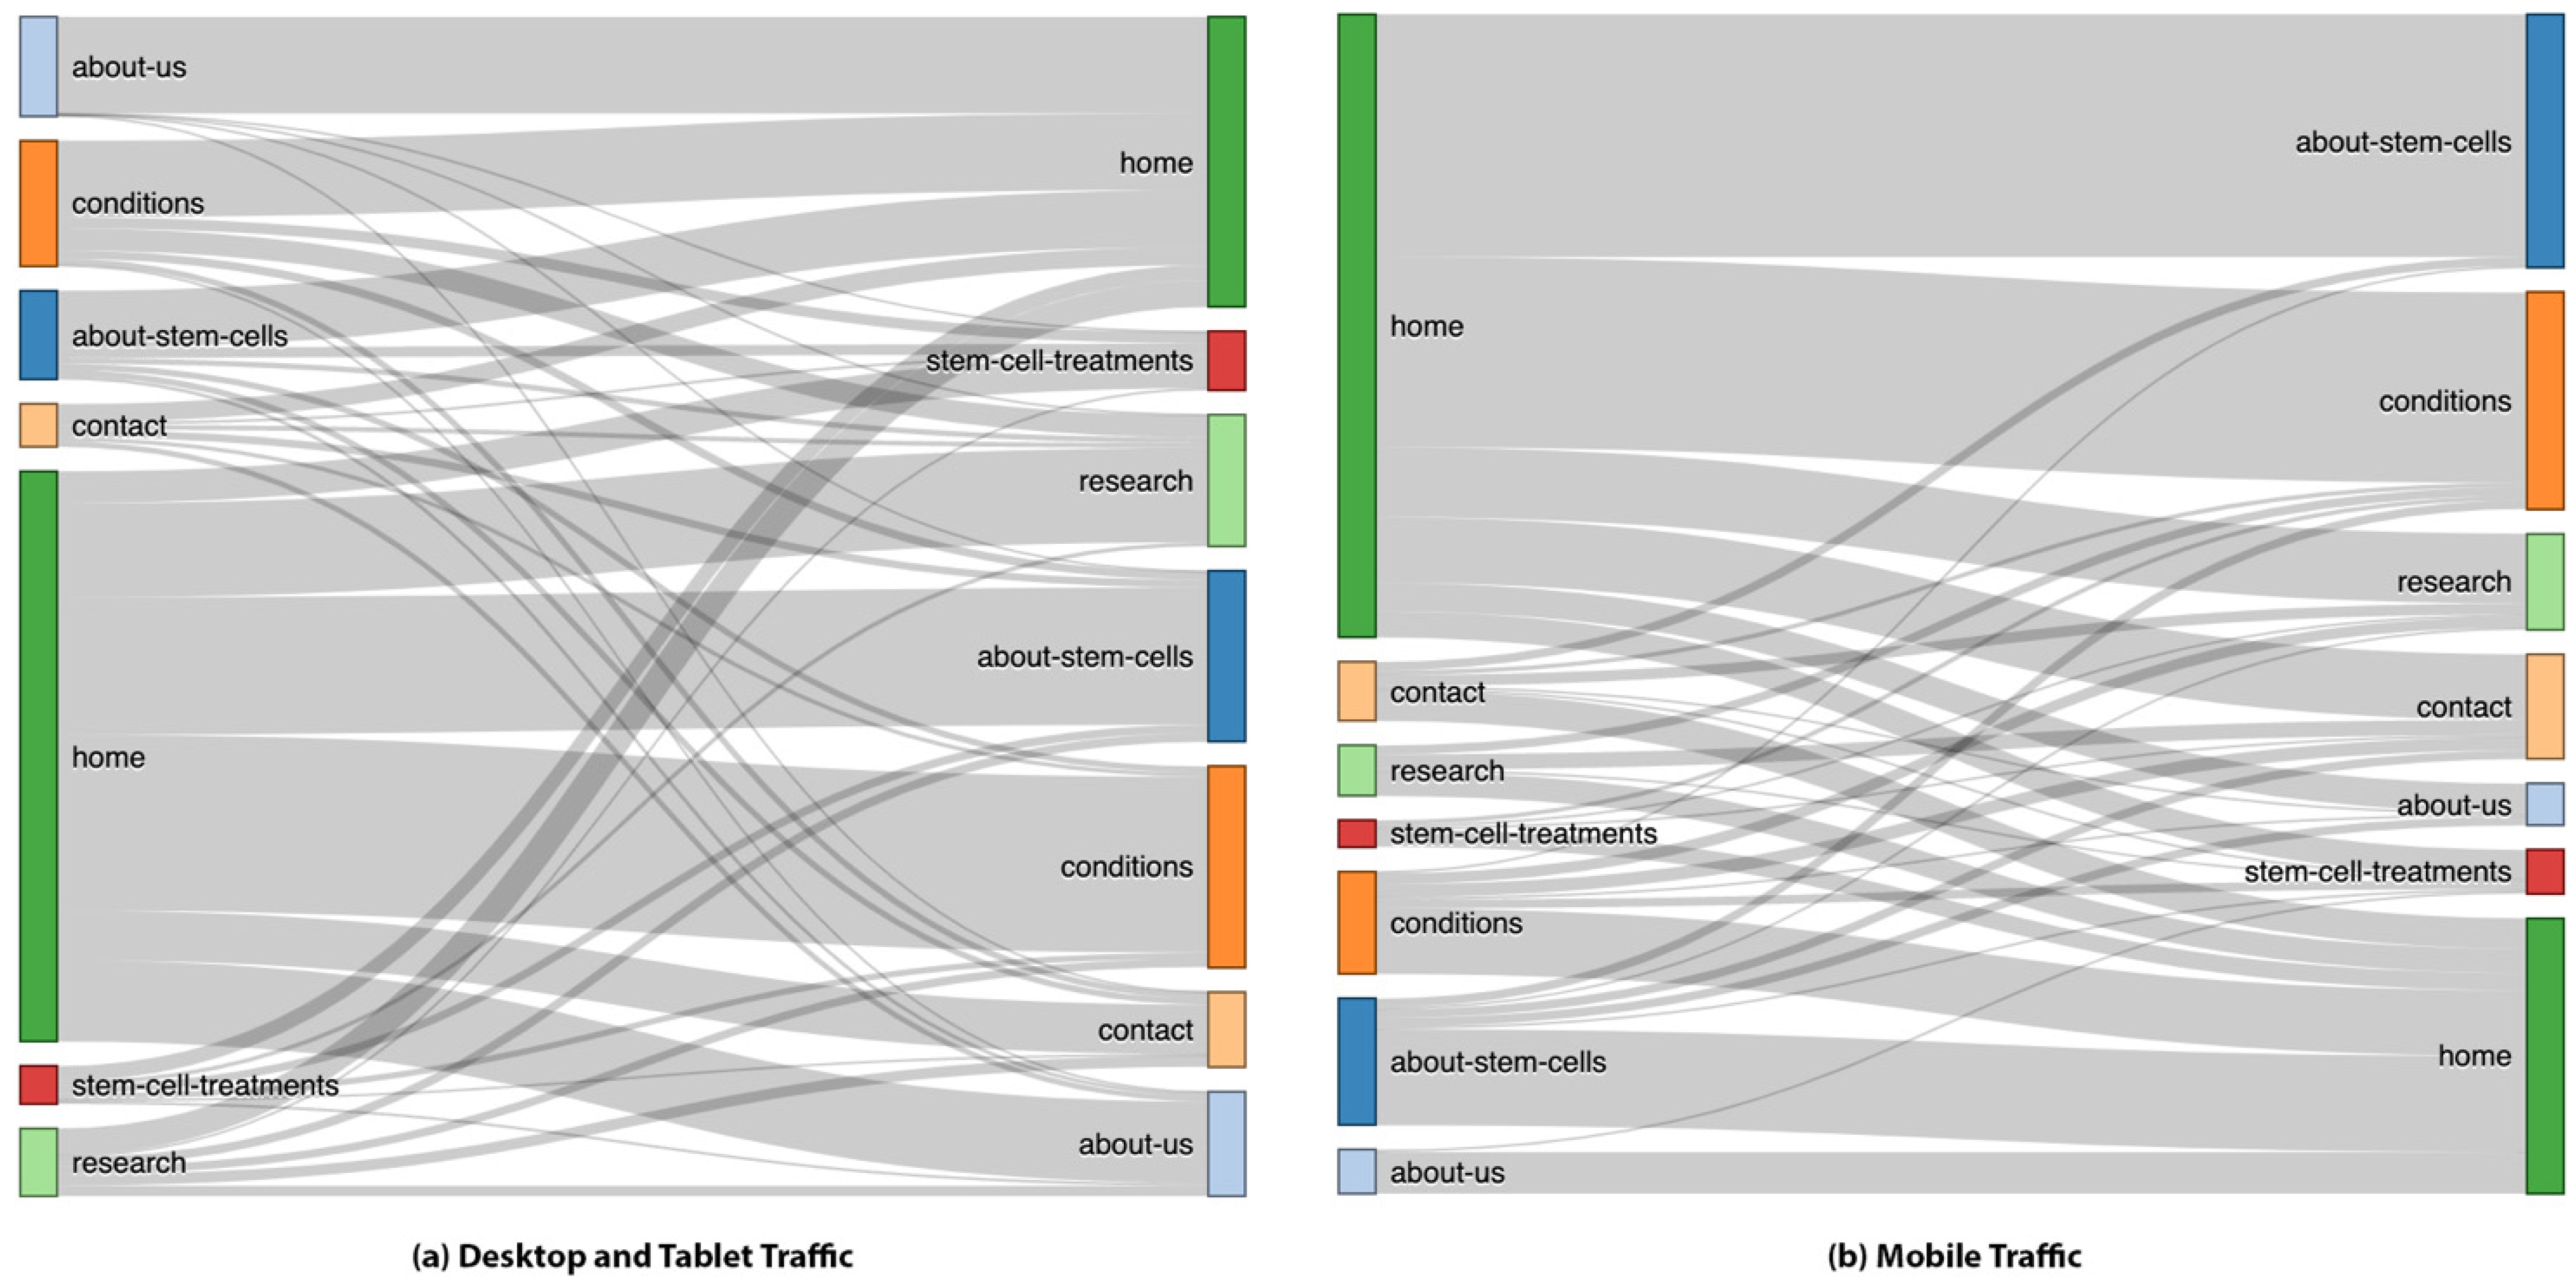
3.3. Results of Navigation Flow Analysis

Table 8 lists the composition of traffic flowing from the home page to other destinations within the website at the level of content categories. It could be seen that a relatively higher volume of traffic originating from the home page (“home”) travelled to information about stem cells (“stem-cells-information”) and related health conditions (“conditions”). Correspondingly, the Sankey visualization of such data (Figure 4) could clearly illustrate the trends of website users and how they navigated from the home page to other pages. The visualization suggested three tiers of traffic volume: conditions and about-stem-cells had more traffic from home; research, about-us and contact had moderate levels of traffic; and other website areas including dispelling-myths, questions, clinical-trials and news received the lowest volume of traffic.
Figure 5 presents the twisted visualizations that illustrate the complicated navigation flows. In both sub-figures (a) and (b), there was a substantial amount of traffic flowing into the “home” category, suggesting that users returned to the home page and restarted information seeking. As shown in Table 9, the percentage of traffic returning to the home page ranged from 39.8 to 97.2% on desktops and tablets, and 47.8 to 95% with mobile traffic. These patterns demonstrated a kind of typical behavior of looking for extra information by going back to the home page and following other links. This visualization can also help researchers to understand what categories of information users follow up with after reading a certain type of information. For example, “stem-cell-treatments” were connected with “research” in the visualization, suggesting that these two categories of information were often browsed one after another. In addition, the visualization placed both the charts of desktop and tablet traffic (Figure 5a) as well as mobile traffic (Figure 5b) side-by-side, so that the traffic flows of different types of users could be compared. An observation was that more mobile traffic arrived at the home page initially and more of these users navigated to “about-stem-cells” and “conditions” next. In sum, both desktop and tablet and mobile traffic showed a high ratio of users going back to the home page after reading other categories of information.

4. Discussion

Below we discuss our principal findings, followed by the limitations of our methodology.

4.1. Principal Findings

People often obtain complex health information on the internet for self-management but the complexity of navigating through the web is a challenge for many [29]. The information retrieval discipline has defined two approaches for seeking information, namely a focused and exploratory search [30]. In the context of health information, a focused search means that information seekers tend to search for a narrow scope of health topics from a small number of information sources; an exploratory search refers to the combined behaviors of finding, learning and investigating a wider range of topics from multiple sources. Depending on personal and situational factors, an exploratory search is adopted by users and it is beneficial for them to enhance their knowledge of the health topics of their concerns [31]. As shown in our analysis, it is valuable to examine navigation flows because it can show the information-seeking approaches of users, as well as their starting and ending points. In the above example (Figure 4), users after reading “conditions” and “about-stem-cells” categories either browsed a mix of different categories such as “research” or the home page (“home”), meaning that they kept searching for additional information after reading the first page. This was one of the actions of exploratory users. Additionally, the twisted traffic flows indicated that users were not satisfied with only one category of information but a wide range of content. These interchanging traffic flows show that the interests of seekers keep changing within their journeys. While a focused search is straightforward and modern websites are designed for that, an exploratory search is harder to identify. With the GA data, we can observe the existence of exploratory searches within health websites, which makes GA a useful tool for profiling users who seek health information.
Our GA data analysis revealed several insights and these could be applicable to other websites for making practical design improvements. We identified different usage patterns shown with different types of devices and traffic. Desktop and tablet users typically viewed a variety of topics, whereas mobile visitors tended to have a more specific focus. Based on our earlier discussion between a focused and exploratory search, mobile users could be mapped to the focused category because they visited the site for a shorter period of time for some specific content, whereas users contributing desktop and tablet traffic stayed longer and were interested in more categories of content and can be seen as exploratory users. While health websites are responsive by design (i.e., showing different layouts based on the type of devices), our analysis suggests that it is not enough to only adjust the appearance and features. This indicates that users from different sources require different information and use different search approaches.
As reflected in Figure 5 and Table 9, users struggled to find information as their navigation flows twisted and they often returned to their starting point. The implication is that web designers should carefully consider showing different designs for users from different origins. Taking these user preferences into account, websites can show multiple featured links on the front page for desktop and tablet users, by using insights in Figure 3 to identify categories of information that are often read. On the other hand, a simple home page will be more appropriate for mobile users. Another key implication is that while the health information here might be complex and contains different aspects of the health research, users might want something more direct and relevant to their own needs only, without the needs of navigating multiple locations. Health information without appropriate content design might lead to a complex navigation flow; therefore, the GA data can show what users are looking for, which may guide content developers to consider what is to be conveyed on a website.
Our example shows a data-driven approach of using GA data for improving and refining complex health information. One use of the above-mentioned visualizations is that they can easily identify popular categories and web pages within a website. Additional content can be authored for these categories and pages as they are viewed by many users. Another useful finding is the connections between content categories as shown in the Sankey visualization, which can indicate what information users need. There are many web pages within a site and sometimes it is not apparent what different topics are read by the audiences at the same time. According to the example shown in Figure 4, “stem-cells-information” was often browsed together with “research”, and this indicated that both categories of health information could be organized coherently. For this example, more research-related information could be added to the stem cell pages, and the web page design could be improved by adding links among these categories, which enable readers to navigate more easily among these categories. In addition, these data can be used in recommendation systems so that such sophisticated systems can suggest further readings that are more relevant to users at the end of each web page.
Our analytical approach can also help to identify the content that is important to users but often overlooked by website administrators. For example, information such as contact details and “about-us” is usually considered as supportive information. However, there was a notable volume of traffic traveling to these areas, following the reading of predominating categories of information such as “conditions” and “about-stem-cells”. This may suggest that users may need reassurance about the information they read, given that stem cell information is complex and there is much information portraying as legitimate on the internet [32]. Prior research has highlighted that the branding and the identity of a website are critical for health information seekers to judge its authenticity and reliability [33]. Our work reflects similar expectations from users, and the findings imply that websites should not ignore supportive information and should provide enough context for users, such as information about the organizations, the professionals and contact details, which will help them to understand who is behind the sites and what the potential benefits/harms could be. This will be an important aspect to let users build trust with quality websites. On the other hand, it is suggested that some users prefer to find extra information for self-management [29], and therefore they seek offline contacts to follow up with health professionals or local health services after reading information online. In the case of stem cells science, carefully curated direct-to-consumer marketing targets people who are desperate but unable to find information about treatments [34]. As a preliminary solution, health websites can start playing an important role in providing pointers to offline services and support that users may be able to access in reality.

4.2. Limitations

Our approach partially relies on the analysis of the paths in URLs and therefore this approach is limited when these paths cannot reflect the categorical organization of a website. However, modern websites generally arrange their content properly for increasing their possibilities of being shown in search results, and therefore this limitation should only affect websites using older architectures. Another limitation is that GA only provides aggregated data at daily or weekly levels. That is, individual navigation flows cannot be extracted from the database, and that limits the use of statistical tests. However, the data provided are enough for our purposes to understand users and identify room for improvements within a website. Despite these limitations, GA remains an easy and understandable dataset available to health website administrators. As suggested in [9], other methods such as user interviews and on-page heat mapping can provide additional aspects of website usability, which overcome the shortcomings of GA. Finally, our sample analysis included only a month of data, which may limit the generalization of the findings. It is possible to include more data in future work.

5. Conclusions

Health information websites remain the main information source for patients and health consumers, and GA is a low-cost tool for understanding the performance of health websites. This paper showcases a series of steps to extract information from URL paths, aggregate path data and present the data with Treemap and Sankey visualizations, for analyzing the navigation flow data from GA. Our results show the potential of these tools for designing content and functions that fit better with users’ diverse needs. Our work also highlights the need to curate information carefully for users from different origins and technologies, which can be identified using our methods combined with GA data. Website administrators can adopt these insights to provide better information for their audiences.

Author Contributions

M.M., S.C. and P.C.-I.P. contributed to the conception of the work, the design of the work and data interpretation; P.C.-I.P. performed the analysis, created the software used in the work and wrote the first draft; M.M., S.C. and P.C.-I.P. substantively revised the draft. All authors have read and agreed to the published version of the manuscript.

Funding

This research and the APC were funded by a Macao Polytechnic University research grant (project code: RP/FCA-10/2022). PP obtained funding from Macao Science and Technology Development Fund (funding ID: 0048/2021/APD). Funding for the Stem Cells Australia website was provided by the Australian Research Council through the Special Research Initiative in Stem Cell Science (SRI110001002) and the University of Melbourne. MM received funding through reNEW, the Novo Nordisk Foundation Center for Stem Cell Medicine (NNF21CC0073729).

Institutional Review Board Statement

A website is not required to consent visitors for data collection and therefore the consent to participate was waived.

Informed Consent Statement

Not applicable.

Data Availability Statement

The datasets used and/or analyzed during the current study are available from the corresponding author on reasonable request.

Acknowledgments

The authors acknowledge the assistance from Chi Deng for data preparation.

Conflicts of Interest

The authors declare no conflict of interest.

Abbreviations

GAGoogle Analytics
SCAStem Cells Australia
URLUniform Resource Locator

References

  1. Tao, D.; LeRouge, C.; Smith, K.J.; De Leo, G. Defining Information Quality Into Health Websites: A Conceptual Framework of Health Website Information Quality for Educated Young Adults. JMIR Hum. Factors 2017, 4, e25. [Google Scholar] [CrossRef] [PubMed]
  2. Gutierrez, N.; Kindratt, T.B.; Pagels, P.; Foster, B.; Gimpel, N.E. Health Literacy, Health Information Seeking Behaviors and Internet Use Among Patients Attending a Private and Public Clinic in the Same Geographic Area. J. Community Health 2014, 39, 83–89. [Google Scholar] [CrossRef]
  3. Zimmerman, M.S.; Shaw, G. Health Information Seeking Behaviour: A Concept Analysis. Health Inf. Libr. J. 2020, 37, 173–191. [Google Scholar] [CrossRef]
  4. Ahmed, H.; Jilani, T.A.; Haider, W.; Abbasi, M.A.; Nand, S.; Kamran, S. Establishing Standard Rules for Choosing Best KPIs for an E-Commerce Business Based on Google Analytics and Machine Learning Technique. Int. J. Adv. Comput. Sci. Appl. 2017, 8, 5. [Google Scholar] [CrossRef]
  5. Filvà, D.A.; Guerrero, M.J.C.; Forment, M.A. Google Analytics for Time Behavior Measurement in Moodle. In Proceedings of the 2014 9th Iberian Conference on Information Systems and Technologies (CISTI), Barcelona, Spain, 18–21 June 2014; pp. 1–6. [Google Scholar]
  6. Luo, H.; Rocco, S.; Schaad, C. Using Google Analytics to Understand Online Learning: A Case Study of a Graduate-Level Online Course. In Proceedings of the 2015 International Conference of Educational Innovation through Technology (EITT), Wuhan, China, 16–18 October 2015; pp. 264–268. [Google Scholar]
  7. Plaza, B. Monitoring Web Traffic Source Effectiveness with Google Analytics. Aslib Proc. 2009, 61, 474–482. [Google Scholar] [CrossRef]
  8. Pang, P.C.-I.; Harrop, M.; Verspoor, K.; Pearce, J.; Chang, S. What Are Health Website Visitors Doing: Insights from Visualisations towards Exploratory Search. In Proceedings of the 28th Australian Conference on Computer-Human Interaction; Association for Computing Machinery: New York, NY, USA, 2016; pp. 631–633. [Google Scholar]
  9. Fundingsland, E.L., Jr.; Fike, J.; Calvano, J.; Beach, J.; Lai, D.; He, S. Methodological Guidelines for Systematic Assessments of Health Care Websites Using Web Analytics: Tutorial. J. Med. Internet Res. 2022, 24, e28291. [Google Scholar] [CrossRef]
  10. Crutzen, R.; Roosjen, J.L.; Poelman, J. Using Google Analytics as a Process Evaluation Method for Internet-Delivered Interventions: An Example on Sexual Health. Health Promot. Int. 2013, 28, 36–42. [Google Scholar] [CrossRef]
  11. Song, M.J.; Ward, J.; Choi, F.; Nikoo, M.; Frank, A.; Shams, F.; Tabi, K.; Vigo, D.; Krausz, M. A Process Evaluation of a Web-Based Mental Health Portal (WalkAlong) Using Google Analytics. JMIR Ment. Health 2018, 5, e50. [Google Scholar] [CrossRef] [PubMed]
  12. Jeong, D.; Cheng, M.; St-Jean, M.; Jalali, A. Evaluation of eMentalHealth.ca, a Canadian Mental Health Website Portal: Mixed Methods Assessment. JMIR Ment. Health 2019, 6, e13639. [Google Scholar] [CrossRef]
  13. Kirk, M.; Morgan, R.; Tonkin, E.; McDonald, K.; Skirton, H. An Objective Approach to Evaluating an Internet-Delivered Genetics Education Resource Developed for Nurses: Using Google AnalyticsTM to Monitor Global Visitor Engagement. J. Res. Nurs. 2012, 17, 557–579. [Google Scholar] [CrossRef]
  14. Pakkala, H.; Presser, K.; Christensen, T. Using Google Analytics to Measure Visitor Statistics: The Case of Food Composition Websites. Int. J. Inf. Manag. 2012, 32, 504–512. [Google Scholar] [CrossRef]
  15. Burgess, K.; Atkinson, K.M.; Westeinde, J.; Crowcroft, N.; Deeks, S.L.; Wilson, K. Barriers and Facilitators to the Use of an Immunization Application: A Qualitative Study Supplemented with Google Analytics Data. J. Public Health 2017, 39, e118–e126. [Google Scholar] [CrossRef] [PubMed]
  16. Gordon, E.J.; Shand, J.; Black, A. Google Analytics of a Pilot Mass and Social Media Campaign Targeting Hispanics about Living Kidney Donation. Internet Interv. 2016, 6, 40–49. [Google Scholar] [CrossRef]
  17. Chong, C.; Smekal, M.; Hemmelgarn, B.; Elliott, M.; Allu, S.; Wick, J.; McBrien, K.; Jackson, W.; Bello, A.; Jindal, K.; et al. Use of Google Analytics to Explore Dissemination Activities for an Online CKD Clinical Pathway: A Retrospective Study. Can. J. Kidney Health Dis. 2022, 9, 20543581221097456. [Google Scholar] [CrossRef]
  18. Ogrodniczuk, J.S.; Beharry, J.; Oliffe, J.L. An Evaluation of 5-Year Web Analytics for HeadsUpGuys: A Men’s Depression E-Mental Health Resource. Am. J. Men’s Health 2021, 15, 15579883211063322. [Google Scholar] [CrossRef]
  19. Pang, P.C.-I.; Munsie, M.; Chang, S.; Tanner, C.; Walker, C. Participatory Design and Evaluation of “Stem Cell Australia” Website for Delivering Complex Health Knowledge: Mixed Methods Approach. J. Med. Internet Res. 2023, 25, e44733. [Google Scholar] [CrossRef]
  20. Komenda, M.; Víta, M.; Vaitsis, C.; Schwarz, D.; Pokorná, A.; Zary, N.; Dušek, L. Curriculum Mapping with Academic Analytics in Medical and Healthcare Education. PLoS ONE 2015, 10, e0143748. [Google Scholar] [CrossRef]
  21. Massanelli, J.; Sexton, K.W.; Lesher, C.T.; Jensen, H.K.; Kimbrough, M.K.; Privratsky, A.; Taylor, J.R.; Bhavaraju, A. Integration of Web Analytics Into Graduate Medical Education: Usability Study. JMIR Form. Res. 2021, 5, e29748. [Google Scholar] [CrossRef]
  22. Chen, S.-C.; Tsao, T.C.-Y.; Lue, K.-H.; Tsai, Y. Google Analytics of a Pilot Study to Characterize the Visitor Website Statistics and Implicate for Enrollment Strategies in Medical University. BMC Med. Educ. 2020, 20, 483. [Google Scholar] [CrossRef] [PubMed]
  23. Clark, D.J.; Nicholas, D.; Jamali, H.R. Evaluating Information Seeking and Use in the Changing Virtual World: The Emerging Role of Google Analytics. Learn. Publ. 2014, 27, 185–194. [Google Scholar] [CrossRef]
  24. Google Path Exploration. Available online: https://support.google.com/analytics/answer/9317498?hl=en (accessed on 1 July 2022).
  25. Google Glossary: Session. Available online: https://support.google.com/analytics/answer/6086069?hl=en (accessed on 1 July 2022).
  26. Tanner, C.; Petersen, A.; Munsie, M. ‘No One Here’s Helping Me, What Do You Do?’: Addressing Patient Need for Support and Advice about Stem Cell Treatments. Regen. Med. 2017, 12, 791–801. [Google Scholar] [CrossRef] [PubMed]
  27. Australian Research Council Stem Cells Australia Highlights ARC-Funded Research. Available online: https://www.arc.gov.au/news-publications/media/research-highlights/stem-cells-australia-highlights-arc-funded-research (accessed on 1 August 2022).
  28. Kennedy, A.B.W.; Sankey, H.R. The Thermal Efficiency of Steam Engines. Minutes Proc. Inst. Civ. Eng. 1898, 134, 278–312. [Google Scholar] [CrossRef]
  29. Lee, K.; Hoti, K.; Hughes, J.D.; Emmerton, L. Dr Google and the Consumer: A Qualitative Study Exploring the Navigational Needs and Online Health Information-Seeking Behaviors of Consumers with Chronic Health Conditions. J. Med. Internet Res. 2014, 16, e262. [Google Scholar] [CrossRef]
  30. Marchionini, G. Exploratory Search: From Finding to Understanding. Commun. ACM 2006, 49, 41–46. [Google Scholar] [CrossRef]
  31. Pang, P.C.-I.; Verspoor, K.; Chang, S.; Pearce, J. Conceptualising Health Information Seeking Behaviours and Exploratory Search: Result of a Qualitative Study. Health Technol. 2015, 5, 45–55. [Google Scholar] [CrossRef]
  32. Petersen, A.; Tanner, C.; Munsie, M. Navigating the Cartographies of Trust: How Patients and Carers Establish the Credibility of Online Treatment Claims. Sociol. Health Illn. 2019, 41, 50–64. [Google Scholar] [CrossRef]
  33. Pang, P.C.-I.; Temple-Smith, M.; Bellhouse, C.; Trieu, V.-H.; Kiropoulos, L.; Williams, H.; Coomarasamy, A.; Brewin, J.; Bowles, A.; Bilardi, J. Online Health Seeking Behaviours: What Information Is Sought by Women Experiencing Miscarriage? Stud. Health Technol. Inform. 2018, 252, 118–125. [Google Scholar]
  34. Zarzeczny, A.; Tanner, C.; Barfoot, J.; Blackburn, C.; Couturier, A.; Munsie, M. Contact Us for More Information: An Analysis of Public Enquiries about Stem Cells. Regen. Med. 2020, 14, 1137–1150. [Google Scholar] [CrossRef]
Figure 1. The format of a URL and our approach to extract information from the path of a URL.
Informatics 10 00080 g001
Figure 2. Treemap visualization of web page categories.
Informatics 10 00080 g002
Figure 3. Treemap visualizations of (a) direct; (b) referral; and (c) organic traffic.
Informatics 10 00080 g003
Figure 4. Sankey visualization showing traffic from home page to other parts of the website.
Informatics 10 00080 g004
Figure 5. Side-by-side Sankey visualizations of desktop and tablet traffic as well as mobile traffic.
Informatics 10 00080 g005
Table 1. GA variables used in other literature (descriptions based on [9,14,25]).
VariableDescriptionResearch That Used the Variable
New and Returning UsersThe numbers of users that are new to a website or revisiting a website[4,13,16]
Session Count and LengthA session refers to a period of time that a user is active on a website. These variables count the number of sessions and their durations[16,17,18,20,21]
Bounce RateBounce rate is the ratio of users that visit a website exiting without going to the second page. It usually means that users do not achieve their goals through interacting with a website[6,7,10,13,16,17,18,20,21]
Time on SiteThe duration of time users spent on a website[6,10,13,16,17,18,20,21,22]
Page ViewsThe total number of web pages viewed in a session on a website[7,10,11,13,16,17,18,20,21,22]
Table 2. Examples of paths, categories derived from paths and the numbers of page views.
Path (Collected from GA)Top Category (Derived)Sub-Category (Derived)Number of Views
/about/about-stem-cells/how-are-stem-cells-used/aboutabout-stem-cells140
/conditions/explore/spinal-cord-injuries/conditionsexplore74
/conditions/explore/osteoarthritis/conditionsexplore68
/contact/contact(N/A)12
/Research/research(N/A)12
Table 3. Examples of raw navigation data from GA.
PathPrevious Page PathNumber of Views
/about-stem-cells/for-patients.aspx/(denotes the home page)274
/contact//research/12
/News-Events/What-s-On-.aspx/News-Events.aspx6
/conditions/explore/parkinsons-disease//conditions/explore/autism/5
/Our-Research/Previous-Research-Programs.aspx/about/AboutUs.aspx10
Table 4. Examples of processed navigation data at the top category level.
OriginDestinationNumber of Views
homeabout-stem-cells274
researchcontact12
news-eventsnews-events6
conditionsconditions5
our-researchabout10
Table 5. Device types of SCA and t-test results.
Desktop and Tablet TrafficMobile Traffict Statisticp-Value
Users24851046------
New Users2074967------
Sessions26841113------
Bounce Rate0.69 (SD = 0.059)0.72 (SD = 0.080)12.348p < 0.0001 *
Pages Per Session1.95 (SD = 0.309)1.65 (SD = 0.264)−28.378p < 0.0001 *
Average Session Duration (Seconds)100.06 (SD = 41.180)53.68 (SD = 35.744)−32.798p < 0.0001 *
* Statistically significant.
Table 6. Traffic types of SCA and ANOVA results.
Direct TrafficReferral TrafficOrganic TrafficF Statisticp-Value
Users516822944------
New Users449762516------
Sessions62843151------
Bounce Rate0.76 (SD = 0.118)0.77 (SD = 0.310)0.69 (SD = 0.049)1.650p = 0.1978
Pages Per Session1.93 (SD = 1.404)1.43 (SD = 1.200)1.87 (SD = 0.239)1.990p = 0.1426
Average Session Duration (Seconds)105.93 (SD = 142.799)95.86 (SD = 130.272)85.10 (SD = 29.224)2.813p = 0.0653
Table 7. Sample data of web pages and their corresponding numbers of views.
Web Page NameNumber of Views
home3686
about-us280
how-are-stem-cells-used200
research558
what-are-stem-cells534
Table 8. Samples of aggregated navigation data in categories.
OriginDestinationCount
homeabout-stem-cells229
homeabout-us112
homeclinical-trials16
homeconditions334
homecontact89
homedispelling-myths58
homenews2
Table 9. Ratios of traffic returning to the home page.
Desktop and Tablet TrafficMobile Traffic
OriginCount of Outgoing TrafficCount Returning HomePercentageCount of Outgoing TrafficCount Returning HomePercentage
about-stem-cells1298364.3%584475.9%
about-us14414097.2%201995.0%
conditions18211161.0%473063.8%
contact622641.9%271451.9%
research983939.8%231147.8%
stem-cell-treatments552240.0%12866.7%
total67042162.8%18712667.4%
Disclaimer/Publisher’s Note: The statements, opinions and data contained in all publications are solely those of the individual author(s) and contributor(s) and not of MDPI and/or the editor(s). MDPI and/or the editor(s) disclaim responsibility for any injury to people or property resulting from any ideas, methods, instructions or products referred to in the content.

