Abstract
Explainable Artificial Intelligence (XAI) has successfully solved the black box paradox of Artificial Intelligence (AI). By providing human-level insights on AI, it allowed users to understand its inner workings even with limited knowledge of the machine learning algorithms it uses. As a result, the field grew, and development flourished. However, concerns have been expressed that the techniques are limited in terms of to whom they are applicable and how their effect can be leveraged. Currently, most XAI techniques have been designed by developers. Though needed and valuable, XAI is more critical for an end-user, considering transparency cleaves on trust and adoption. This study aims to understand and conceptualize an end-user-centric XAI to fill in the lack of end-user understanding. Considering recent findings of related studies, this study focuses on design conceptualization and affective analysis. Data from 202 participants were collected from an online survey to identify the vital XAI design components and testbed experimentation to explore the affective and trust change per design configuration. The results show that affective is a viable trust calibration route for XAI. In terms of design, explanation form, communication style, and presence of supplementary information are the components users look for in an effective XAI. Lastly, anxiety about AI, incidental emotion, perceived AI reliability, and experience using the system are significant moderators of the trust calibration process for an end-user.
1. Introduction
Recent breakthroughs in algorithmic techniques and the complementary development of more capable computing tools have exponentially progressed the artificial intelligence (AI) field. These advancements have boosted AI’s analytical power, enabling convolution to take on more cognitively demanding tasks [1,2]. As an effect, AI can now be seen powering different systems, for multitudes of uses, and at varying levels of human augmentation.
While the added utility that AI can potentially bring is undeniably beneficial, unfortunately, it also detriments the possible adoption of users to it. Why? Because these advancements were realized by sacrificing AI’s interpretability or the ability to understand how and why the AI came up with its recommendations. This stems from using complex algorithms (i.e., machine learning—ML and deep learning—DL) that are inherently incomprehensible [3]. In return, it restricts how trust [4,5,6,7,8] and subsequent reliance [9] can be calibrated accurately, given that users are unaware of AI’s actual inner workings. This often leads to over-trusting an incapable AI or, at worst, abandoning a reliable AI, which is a pressing issue considering how society frames AI’s role in the future [10,11].
So, why do the experts that developed the algorithms not just provide the explanations? As simple as it seems, this will not work as AI functions similarly to human brains [12]. Evolution will happen as it learns, creates rules, contextualizes, and eventually adapts to gain performance. Because of this, new parameters (“hidden layers” in the context of ML) that are not originally part of the understandable design are added to the system, making it inexplainable to all users, including the developers [13]. For this reason, the issue is often tagged as the black box paradox of AI [14].
As a workaround solution, the innovative field of explainable AI (XAI) has been introduced. Rather than entirely unpacking the algorithms that the AI uses, which is difficult, it focuses on providing human-level explanations conceptualized from the comprehensible facets of the AI [15]. It centers on the AI’s purpose, process, and performance to grant cognitive resources [16,17] to help developers [18] (e.g., troubleshooting, understanding limitations, and improving performance) and to answer critical questions raised by an end-user [19]. Often, this is in the form of visualization tools embedded in the AI interface for interaction [20].
Take image recognition, for instance, which is one of the first, most prominent, and well-researched AI domains. XAI is being used as an alternative in explaining the thinking process of the AI (e.g., heat maps, feature examples, rule explanations, etc.). This makes the complex analysis per bitmap (i.e., geometric coding and pattern analysis) [21] comprehensible and deducible for trust and reliance assessment for adoption [22,23]. As a result, more demanding tasks (e.g., self-driving cars with visualization, facial recognition with saliency maps, etc.) are being unlocked and adopted across different functions [20]. This goes the same with other domains, which saw positive changes upon using XAI [15].
The benefits from XAI have encouraged many scholars to expand the field by developing newer techniques, with the majority taking on the challenge of providing a deeper and more accurate representation of AI’s complex inner workings (e.g., Deterministic Local Interpretable Model-Agnostic Explanations, Shapley Additive Explanation, and Quantitative Testing with Concept Activation Vectors) [8,15]. As a result, most of the research has centered on what information XAI should carry, or focused on its role as a cognitive repository of explanation [24,25]. Although this is theoretically useful given the field’s infancy and rapidly expanding AI use cases, the spotlight from current research has underrepresented the end-users and centered more on the developers [26,27,28].
Three foundational aspects can be synthesized from the current research stream that supports the claim. First, expertise with ML and DL is needed to understand current XAI techniques, which a typical end-user does not have [18,19]. Next, the goal is often directed at improving AI’s algorithm [29,30] and not on an end-user’s fundamental goal of triggering adoption and its prerequisite of trust. Lastly, current techniques were mainly viewed as a cognitive resource rather than a bridge in human–computer interaction (HCI) [25,31]. This means that little to nothing is known about how XAIs are perceived by an end-user when embedded in an AI, considering its inherent characteristics. With the limited understanding of the end-user context, this can cause a significant threat to the trajectory of AI’s role in society, viz., possibly halting the advantages AI can bring to the day-to-day life of humans.
Considering the gap in the context of end-user XAI, this study is proposed to answer the question: “How to create an end-user-centric XAI?”. As pointed out by recent works, people are approaching XAI with the same attitude of expectation they are employing towards another human [32,33,34]. This entails that, in using XAI, interaction process (how the stimuli were used), structure (how it is presented), and variability (possible external influences) can play essential roles in making a judgment (i.e., trust and reliance) [29,31,33,35,36,37]—aspects that have been limited in existing XAI research. With that, the problem will be examined following the objectives:
- Determine how an end-user calibrates trust from XAI.
- Identify the factors that can significantly change how trust can be calibrated.
- Examine possible moderating factors that can affect the calibration process.
- How do external factors moderate the effect of XAI in the calibration process?
The remainder of this paper is divided into six sections. The next section presents the background of the study. Section 3, Section 4 and Section 5 confer the experiment design, give the data-gathering results, and discuss the findings with respective recommendations based on the study’s objectives. Finally, the last section closes the paper with the conclusion.
2. Review of Related Literature
Using this idea and the different theories in other spaces that similarly examined cognitive-based stimuli, this study aims to address the problem through the interaction lens in terms of the trust calibration process, design for the structure, and external limits for influences.
2.1. Trust Calibration
Trust calibration is a dynamic process as it encompasses different dimensions (e.g., performance, reliability, predictability, etc.), and can be processed on various routes. In the study conducted by Lee and See [38], they identified three possible ways to tune trust based on rationality, societal belief or norms, and engagement of emotions. They devised these routes as cognitive and affective routes. Cognitive can be further broken down as analytic and analogic. The applicability of the routes mainly depends on the available information, the relationship between the trustee and trustor, and how the information can be elaborated in that situation.
2.1.1. Cognitive Trust Calibration
If trust is formed from a rational evaluation of a trustee’s salient behavior, this is considered analytic processing [39]. This method overstates cognitive capacities as a limitation for rationality, and understates the influence of emotions and strategies for trust formation. This functions as knowledge-based processing, relying on a function-based mental model of the system such as with motivation, interests, performance, and capabilities [38]. Further, knowledge can be sourced through direct observation, possible intermediaries, and presumptions available to the trustor.
On the other hand, if trustworthiness is determined based on societal norms, reputable opinions, or any enabling information without direct contact, analogic processing is considered. This method heavily assumes that trust can be developed as an offset of belief from significant intermediaries and not on the direct experience from the system being considered. This is less cognitively taxing than analytic processing and mainly uses rules and presumptions [39].
2.1.2. Affective Trust Calibration
Aside from cognitive, another way to calibrate trust is via emotions or how people feel. As the name implies, affective processing is strictly based on the emotions generated by and toward the entity [39]. Compared to the analytical and analogical of cognitive processing, this method minimizes the need for rational cues and prioritizes how people feel about the system—the core influence of trust on behavior [40]. In addition, this route mainly focuses on moment-to-moment trust—subjected to intrinsic and environmental factors—since emotion tends to fluctuate over time (e.g., expectation does not conform to the ongoing experience). In the simplest terms, the core belief on this route is that people think and feel trust.
Lee & See [38], in their well-cited HCI study, propose the idea of the affective route suggesting that trust might also be induced by irrational factors, such as emotions and moods (additional discussion is presented in the Affect section). Operationally, this leverages the user’s emotional responses to the stimuli rather than its intellectual or cognitive resources. The idea is deeply rooted in the social science paradigm, which argues that in an interaction, aside from the cognitive gain, people can also develop affective states (e.g., positive or negative mood, happy, sad, confused, and scared emotions), which can be infused in the evaluation of the trustee’s abilities, competence, and trustworthiness [41,42,43,44]. These can run as short-term emotions or long-term moods, allowing them to act as continuously shifting influences that continually alter perception and trigger the mental processes that lead to particular behaviors [45,46].
Madsen & Gregor [47] also pointed out that affective processing can calibrate trust more rapidly and unconsciously; needs little to no cognitive resources; and can also be developed outside the interaction from the stimuli (e.g., disposition or personality), which makes the argument of it being dominant over cognitive processing. For example, Myers & Tingley’s [48] money trust game identified that negative emotions (i.e., anxiety and fear) could decrease trust, but only if those negative emotions make people feel less sure about their current situation. Conversely, people tend to trust more if they experience positive emotions even though the game presents a certainty of losing. In hospitality research, Jin & Merkebu [49] found that in an upscale restaurant, positive emotion significantly led to higher customer trust and gratitude even in varying conditions of service (i.e., fast and slow serving time). Fundamentally, people navigating through the affective route can decide not to trust simply because of uneasy feelings that cannot be explained rationally, or by trusting a system due to a particular emotion that developed during the moment of interaction.
2.1.3. Synthesis for Trust Calibration
Relating this processing to XAI, current research has focused on cognitive processing. As presented previously, the running hypothesis in the research stream is that interpretability has a direct relationship with the depth of cognitive information it provides. More so, all the identified goals for XAI are regressed against its cognitive aspect. For example, by allowing people to think, they will understand that AI is trustworthy.
On the contrary, affective processing is still an area to be explored for XAI trust calibration. As of the writing of this paper, there are no studies that tried to evaluate the affective ability of XAI to calibrate trust. At the very least, there are pieces of evidence showing the ability of XAI to engender emotions. For instance, Jensen et al. [50] successfully classified four primary affective states out of the nineteen pre-identified emotions, which include hostility, positivity, anxiety, and loneliness, by showing additional explanations of the process and performance of a drone AI system. Albayram et al.’s [51] work on safety-critical AI systems factored negative individualistic emotion, positive emotion, and negative prosocial emotions as the three main states out of 44 pre-identified emotions upon subjects’ exposure to the explanation of role and criticality of the situation. By examining human facial reactions and signals (i.e., brow, cheek, and lips movement), Guerdan et al. [52] successfully identified that emotions such as happiness and anger are manifested when people interact with XAI interfaces.
There are also pieces of evidence showing the emotion–trust relationship for XAI. For example, eight pictures depicting positive or negative moods were used by Phillips and Madhavan [53] to manipulate the participants’ initial emotional state. Their experiment determined that users with positive moods are more susceptible to trust AI recommendations than negative moods. Merritt (2011) and Du et al. (2020) used affectively laden video clips (i.e., happy, sad, scary) to prime the emotional status of the participants. The former suggests that the decision-making process is driven emotionally rather than rationally, while the latter proved that positive valence led to better takeover quality. Gompei & Umemuro [54] discovered that trust towards utility information (e.g., instructions for a task, explanations from an event) from social robots is developed via the affective route. Specifically, the degree of feelings is directly correlated to the trust towards the information and the robots (i.e., positive emotion leads to higher trust). For automated computer warnings, Buck et al. [55] found that the quality of cognitive information presented by the alerts was not the primary determinant of trust. Affective state fundamentally calibrated the trust stance of users with positive affect building more trust than other developed emotions such as anxiety, hostility, and loneliness. Bernardo & Tangsoc [56] identified that trust seals (i.e., certification showing payment assurance) serve as affective cues rather than cognitive stimuli. As verified from the post hoc interview, exposed people developed a sense of happiness and confidence which triggered trust formation. For intelligent personal assistants, Chen & Park [57] determined that even if it is intended to deliver factual responses, trust is primarily calibrated based on the feeling of positive social attraction rather than the correctness of the information it provides.
2.2. Emotional or Affective Design
With the consideration of the affective path approach, emotional design, also known as affective design, is considered. This is a research field concerned with creating designs that elicit emotions from users to trigger specific behavior [58,59]. This attempts to define the subjective emotional relationships between users and stimuli and explore the affective properties that intend to communicate through their design attributes [46,60]. In other words, the idea is to identify a specific design element that can potentially engender a particular emotion that will lead to a specific change in the target behavior. This concept has been used in a variety of domains such as in the user interface of children’s e-learn to create positive attachment [61]; computer game design to enhance enjoyment and happiness [62]; eco-labels to promote positive affect which triggers purchase intention [63]; social robots to enhance positive perception and preference [35]; and trash bin signages to encourage waste segregation [64] to name a few.
In the timeline of affective design, the three most influential works were proposed by Norman [65], Jordan [66], and Khalid & Helander [67]. Conceptually, the ideas differ in how they approach design and scale its potential effect.
2.2.1. Three Levels of Processing
The Three Levels of Processing by Norman [65] views affective design in conjunction with how the human brain processes design during an interaction. It is divided into three categories which flex from a surface-level view of the design features, an experiential of its overall package, to an analytical approach that uses experience. Respectively, these are categorized as visceral, behavioral, and reflective designs.
Of the three, the lowest level is visceral. This encapsulates the distinctive visual aspects of the design, such as color, size, texture, shape, or any figurative element of the design critical to its aesthetic value. Considering XAI as an example, visceral design is concerned with how the attributes are presented, the theme of the images, the font size of the explanations, or the thickness of the elements in a graph. Because of this scope, it uses automatic or pre-wired processing that makes rapid and straightforward decisions on the stimuli through pattern matching—appealing to the immediate emotional response to how the user intuitively perceives the design.
The next level is behavioral design, which values an experiential view of the design. It operates on the performance and functionality of the design over its superficial appearance. Conceptually, this functions in parallel with traditional usability engineering, meaning designs are invested in how users carry out their activities, how accurately they achieve their objectives, how many times and errors can be committed, or how well the design accommodates different types of users. Relating again to XAI, this level of design is concerned mainly with whether the user absorbed the explanations to perceive a certain level of trust or its subsequent reliance behavior.
Lastly, the highest level is reflective design. Compared to the first two, this leverages more past experiences and knowledge rather than real-time design evaluation, using developed interest or learned preferences for design. Traditionally, this is related to the message the design sends to the user, which is evaluated on its parity with the self-image the user wants to project. With that, reflective design is approached more consciously, weighing its pros and cons according to a more rational side. In the context of XAI, this can be a design based on the user’s personal preference grown over the interaction with other explanations. For example, a user might prefer a heatmap due to their visual skills and personal belief that it is better than other forms of explanation.
2.2.2. Four Pleasures
Another way that affective design has been categorized is with the Four Pleasures by Jordan [66]. In this categorization, the main premise is that it emphasizes pleasure above all else. Meaning, functionality, an aspect that is heavily considered in the proposal of Norman [65], is not explicitly reflected. This is developed based on the known types of pleasures from an anthropological perspective, divided into four types: physio-, socio-, psycho-, and ideo-pleasure.
Physio-pleasure is an affect developed from the appreciation of the senses. For XAI, since it is presented as an explanation in the interface of the AI system, it highly leverages the sense of sight—how visually appealing the design is to deliver pleasure. On the other hand, socio-pleasure stems from the interaction with others—whether it follows a certain norm or is socially accepted. Operationally, this can be how XAI design resonates with the well-accepted or favored way of giving explanations. For instance, for visual search tasks, a visual feature-based explanation is better than a verbal one, which is socially acceptable. If the focus is on the cognitive caveat of the stimuli, psycho-pleasure is considered. In the context of XAI, this relates to the cognitive ability (i.e., memory, stress, workload) of the user on how it should be designed to limit its negative effect. This can be performed by simplifying the load presented or selecting a different form of explanation. Lastly, idea-pleasure involves the user’s values and beliefs in appreciating the design. For XAI, this mostly resonates with the aesthetic taste, which is relatively the same as the reflective design of Norman [65].
2.2.3. Framework for Affective Customer Needs
Lastly, another foundational idea used in affective design for categorization is Khalid & Helander’s [67] Framework for Affective Customer Needs. Relative to the first two, it was developed based on empirical results from an extensive survey rather than a parallel view from an anthropological phenomenon (i.e., brain functions for the three levels of processing and pleasure class for the four pleasures). They used a survey to rate product features and then categorized them using factor analysis. Their results factored three generic categories of user preference: holistic attributes, styling, and functional design. Their study highlighted that familiarity differs from users’ stance on design appreciation.
Holistic attributes can be thought of as the gestalt of the product. This means that designs are viewed as packages rather than specific components. Designs in this categorization are from products unknown to the user. In the context of XAI, these are users not familiar with the basic functionality of the system and the explanation itself. On the other hand, if the design prioritization is on specific details, this often falls on styling. This focuses on specific attributes such as colors, shapes, and sizes. The specificity is highly attributable to the user’s familiarity with the product in consideration. If the familiar users are way past the aesthetic quality of the design, they can dive into the functional level, which relates to the types of tasks the product works for the user. For XAI, this can be whether the explanation is appropriate in the given context.
2.2.4. Synthesis of Emotional or Affective Design
The different levels of design discussed, with some overlapping, showed what aspect of design specific users consider given their varying characteristics. Considering this, the study will mainly focus on the design attribute types rather than specific design components of it (i.e., color, size, and shape). This decision is driven primarily by two points. First, since there had been no study on affective design for XAI, a higher-level approach will be beneficial as an output to be used for future studies. Identifying which among XAI form types of work is more encompassing than a specific design component that can observe certain reservations. The second point follows the familiarity aspect raised by Khalid & Helander [67], wherein novice users—the focus of this study—value holistic attributes rather than specific styling.
2.3. Proposed Model and Hypothesis
Overall, the synthesis from the review of the related literature highlights the study’s setup. As for the interaction, this study will deviate from the running hypothesis of the cognitive route. Mainly, this study will center on the experience beyond the rational view through affective calibration. The XAI emotion set (XES) of Bernardo & Seva [68] will be used to measure changes. Coinciding with this, for the design, the study will value the principle of emotional design. This leverages design saliency to trigger emotions or how stimuli present their different design attributes. Following the end-user-centric approach, a pre-study will be performed to identify these design attributes. Lastly, for limitations, the study will consider both AI and user properties following the role of XAI in the interaction and qualitative claims from other HCI studies [55,69,70]. This will include AI anxiety, incidental emotions, trust disposition, and XAI experience for human factors, while also AI reliability, learning capability, brand, and experience for AI factors. To encapsulate the synthesis from the review of the related literature and the overall plan of this study, an XAI Trust Calibration Model (XAITC) model is proposed (see Figure 1). This builds upon the synthesized framework for XAI research from a user model perspective of Haque et al. [25]. Each path will be tested as a separate hypothesis to confirm the model.
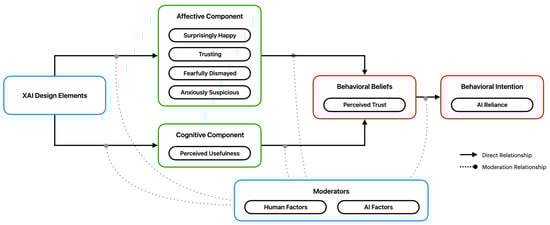
Figure 1.
XAI Trust Calibration Model.
By answering the objectives, the end goal is to provide the following contributions to the field of XAI:
- Being the first study to verify how trust calibration from XAI happens through the lens of an end-user.
- Valuing the importance of the user-centered approach, this study shed light on the user’s view of XAI design composition and its perceived importance in explaining and possibly building the theories for XAI trust research.
- Based on the results of this study, different insights on how XAI can be designed are generated, which can potentially be used to leverage the effects of emotions.
- By understanding the dynamics of external factors, better situational use of XAI can be created.
3. Materials and Methods
To test the proposed hypothesis, viz., to analyze the objectives of the study, an asynchronous experiment was designed and carried out. The goal was to simulate an interaction with XAI by using an existing AI-powered system. This was performed using an experimental testbed where different design combinations were prompted to the user in a between-subject design. Data that were recorded were based on the independent variables from the XAITC model.
To guide the development, a pre-study was conducted with four primary goals: (1) to identify the most familiar AI to avoid alienation, (2) to decide the design setup to minimize the undesirable effect of negative user experience, (3) to determine the design attributes of XAI considered to be necessary by users, and (4) to identify the configurations of the moderators. Data were collected from an online survey answered by 312 current AI users. For idea validation and feasibility assessment, results were run through a focus group discussion comprised of six AI developers and six user experience designers.
The conclusion was to use image classification AI as a use-context, with the Google Lens application as the template for the overall composition and logic flow. For the XAI, three design attributes were selected. Notably, (1) the explanation form or how XAI is presented, (2) the communication style for the explanation, and (3) the presence of supplementary information. Two levels per design attribute were considered based on the enumeration of Jian et al. [71].
For the AI features, reliability was set to differ from 70% for low and 90% for high. Learning capability defaulted to pure conditions. As for the brand, Google was selected to be the name to represent high-reputation AI. Lastly, for the time experience, two days was deemed optimal. All in all, 64 designs (26) were tested. Take note that time experience was not considered as part of the factorial computation given that it is not a design input but a moment of recording. Table 1 summarizes all design configurations for the experiment.

Table 1.
Experimental design configurations.
3.1. Participants
The snowball convenience sampling method was used for the data gathering. Initial leads were generated from direct invitations of peers and promotional ads posted in various social networking groups. Qualifications were set as being able to communicate in English, being at least 18 years old, having a normal or corrected-to-normal vision without any color blindness issues, and with experience using any AI-powered system. Considering the nature of the study, being not emotionally depressed was also a requirement to limit bias and skewness. This, however, was not posted as part of the advertisement material to avoid discrimination. Further discussion on how these requirements were confirmed will be given in the next section.
Technical requirements were also specified to facilitate the experiment effectively in remote conditions. Particularly, having a smartphone with at least 1080 × 1920 pixel resolution without any screen issues, internet connectivity of at least 5 Mbps, an updated web browser app, and availability of area conducive to the experiment. Additionally, they were required to have at least 30 min of uninterrupted time to perform the test for two days. A token worth 100 PHP (~2.00 USD) plus a performance bonus ranging from 25 PHP to 50 PHP was guaranteed in exchange for their complete involvement.
Considering the overarching goal of the paper of testing the relationships involved in the trust calibration of an end-user from XAI through the proposed XAITC model, as well as to attain a statistically capable data set, the minimum sample size was set to 152 participants. This was evaluated based on the principles set by Kline [72] for structural assessment and the result of the priori-power sample computation established from the guidelines of Westland [73] and Cohen [74]; the setup was at 0.3 anticipated effect size, 0.85 desired statistical power level, and 0.05 alpha level.
3.2. Measurements
Data were captured through an online questionnaire and an experimental testbed. The former requested the control (i.e., demographics, disposition, and situational factors) and independent variables (i.e., depressive state and incidental emotions), while the latter enabled the manipulation of XAI design attributes to measure changes from the interaction. Both tools were designed to be accessed through a web browser, with English being its default language.
3.2.1. Online Questionnaire
A three-section online questionnaire was developed and hosted through Google Forms. The first section functioned as the preliminary, where the overview, general instruction, and data consent clause were detailed. It also carried the yes-or-no screening test for English language competence, age restriction, visual acuity, and AI experience. As for the depressive state, the Mood and Feeling Questionnaire (MFQ) developed by Angold & Costello [75] was used. Moving on, the second part requested demographic and dispositional information. Age, gender, educational attainment, occupation, and income were the identified controls. For the disposition, trust assessment by Frazier et al. [76] and AI anxiety measurement by Wang & Wang [37] were contextually used. Finally, the last section inquired about AI plus XAI experiences and incidental emotions. The years of experience were in a multiple-choice form, while four new seven-point Likert questions were developed to measure incidental emotions. The XAI emotion set (XES) of Bernardo & Seva [68] was used as the reference for the different emotion groups.
3.2.2. Experiment Testbed
The three-sectioned testbed was built using Figma and was hosted through the Quant-UX prototyping site. The first section handled the instruction and examples, with three practice trials available. This was followed by the second section, which carried the main image classification task. The general workflow is as follows: (1) the participants will first select the image from the gallery, (2) the AI will generate its recommendation and explain its decision-making, and (3) the participants will decide on whether to agree or provide their classification as a measurement for their reliance. Take note that the correctness of recognition was not disclosed as the testbed’s purpose was limited to recommendation and machine learning. Finally, the third section features the rating scale sliders for the integral emotions, measured like the incidental emotions mentioned earlier. Figure 2 presents sample screenshots of the testbed.
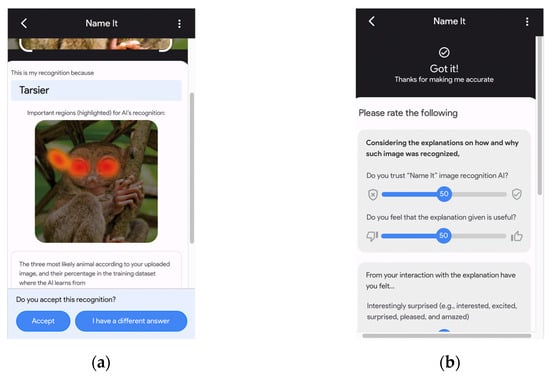
Figure 2.
Sample screenshot of experiment testbed: (a) AI classification and XAI presentation of the image being recognized; (b) dependent variable sliders to be answered after classification.
The user experience, grammar, spelling, and interface of both tools were pre-tested with nine current AI users, three English language experts, and four app developers. Recommendations were implemented before its use for the main experiment. In addition, factor consistency and validity of the newly introduced questionnaire for incidental emotions were checked.
3.3. Procedure
There are three phases in data-gathering: pre-experiment onboarding, main experiment, and post-experiment analysis.
3.3.1. Pre-Experiment Onboarding
The experiment started with the participants attending a synchronous online onboarding via Facebook Group Call. The focus was to relay the general instructions, check the setup requirements, present the data confidentiality, and explain the priming condition. In particular, the scenario was that an NGO hired the participants to help recognize pictures of different species in the Philippines saved in their database. To aid them, an image recognition AI system was developed that could give recommendations on what species the photos contain. Participants were allowed to use it or provide their own. The onboarding ended with the measurement tool links shared with the participants for asynchronous access.
3.3.2. Main Experiment
The main experiment started with the participants accessing the online questionnaire. They were allowed to do it anytime as long as they finished it uninterruptedly. Upon access, participants were prompted with the data agreement and screening questions. Those who agreed and qualified were the only ones allowed to continue. Demographic information was then requested from the participants, together with the rating for AI, XAI, and incidental emotions-related questions. Once completed, participants were forwarded randomly to any of the 24 designs of the XAI testbed.
The use of the XAI testbed started with the preliminaries: application information, general instructions, and the recap of the priming scenario. Each participant was instructed to classify 50 random photos available in the application. This was performed on two consecutive days (25 photos per day), with scores recorded to measure the performance bonus for the compensation. After completing the required task, additional instructions were given to the participants, plus the list of available schedules for the voluntary post-experiment interview and mode of call.
3.3.3. Post-Experiment Analysis
After all the data were collected, the post-experiment analysis started. It centered on analyzing experiment results, interviews, and token distribution. Initially, the data were assessed for completeness and performance. Those who garnered at least 40 correct classifications were tagged to receive an additional 25 PHP (~0.5 USD), while 50 PHP (~1 USD) was intended for those who got all correct. Once finalized, the evaluation was sent to the participants via their social media accounts and email. This contained information on how the token will be distributed, the interview schedule for those who volunteered, and the meeting access links. The interview focused on the reasoning for the answers on the dependent variables.
3.4. Technique of Analysis
The analysis was principally driven by the two-stage methodology proposed by Lowry & Gaskin [77] for Structural Equation Modeling (SEM) under a covariance-based optimization. This technique was selected, primarily, because of its ability to deduce causal relationships proposed in the objectives. In addition, it can estimate model parameters that minimize residual variance [78], is insensitive to parametric conditions [79], and is suitable for simultaneous analysis of the design constructs [80].
Analysis was segmented into two main phases. The first part is for the confirmation of the rigidity of the tool and the data it gathered. This was performed via factor analysis and measured against convergent, discriminant, and fit measures. After confirmation, SEM was performed which was further divided into mediation analysis to confirm the path of calibration, direct analysis for the relationship between the design component and integral emotions, and moderation analysis for the effect of incidental emotions and AI reliability. All tests were assessed based on their statistical significance and rigidity.
As for the data management, representative figures were computed based on the aggregate measurement from the initial trial up to the time considered. This adheres to the recommendations by Yang et al. [81] on the detectable moment of difference (i.e., the area under the curve). Since the method of use was SEM, design elements were coded dichotomously (e.g., +1, −1) to represent change. For moderators, the multigroup test was the approach used to parallel the objectives of the study. Particularly, for factors that used the Likert scale, conversion is based on the midpoint.
The main program used was IBM’s Analysis of Moment Structure (AMOS) graphics version 24. In addition, Design Expert (DX) version 13 was used to generate the design of the experiment, and IBM’s Statistical Package for the Social Science (SPSS) version 25.0 was used for all statistical tests outside SEM. For consistency, testing was held constant under a p < 0.05 significance.
4. Results
The data gathering lasted for 15 days. Seven onboarding sessions were conducted, with at most 40 participants per session. The cumulative time in the main experiment lasted 40 min, with access happening between 11:00 a.m. and 10:00 p.m. There were no recorded ethical concerns or testbed issues. As for the post-interview, 22.27% of the participants joined, with an average call lasting 10 min. Lastly, those who scored 12 or above on the MFQ were notified at most two days after the experiment and were referred to a professional health organization.
4.1. Data Screening
All in all, 234 participated in the data gathering. After filtering, only 202 were considered for analysis as the data from those who failed the requirements, tested positive for the depression test, and did not finish the experiment were removed.
The summary of the demographics is presented in Table 2. Structurally, the gender count for those who disclosed was relatively the same (male—40.59% and female—44.55%), with the majority belonging to the millennial age group (58.42%), followed by generation X (22.77%), and generation Z (16.34%). Most were degree holders (vocational—9.41%; college—68.81%; postgraduate—15.84%) and part of the working class (67.33%). Looking at AI-related factors, the majority have at least five years of experience (more than 5 years—71.78%; 3 to 5 years—25.25%; less than 2 years—2.97%), with almost all having previous interaction experience with an XAI (90.10%). For the moderators, most of the participants reported positive incidental emotions (71.78%), used the high AI reliability version (62.87%), and were recorded at the later stage of use (56.44%).
Table 2.
Summary of subjects’ demographics.
4.2. Exploratory Factor Analysis
Excellent results from the exploratory factor analysis (EFA) supported the use of the designed questionnaire to capture the latent variables of AI anxiety, incidental emotion, trust disposition, perceived usefulness, and perceived trust.
Primarily, the 0.919 Kaiser–Meyer–Olkin (KMO) measure and significant Bartlett’s test of sphericity (p < 0.001) highlighted the high proportion of variance among variables [82] (see Table 3). This was further proven by the high communality extraction ranging between 0.947 and 0.958 and high cumulative variance for five component eigenvalue at 88.710%. As for loadings, the proposed five dimensions were cleanly factored with high intercorrelation scores (minimum of 0.731) and no significant cross-loadings under a principal component analysis extraction at a varimax normalization (see Table 4). This highlighted that the structure of the questions does not overlap due to its validity securing a highly stable analysis [83].
Table 3.
Internal consistency measures.
Table 4.
Rotated component matrix.
4.3. Confirmatory Factor Analysis
Same with the findings from the EFA, confirmatory factor analysis (CFA) also attests to the structure of the dimensions (see Table 5). From the model validity test, Cronbach’s alpha and average variance explained (AVE) showed high reliability and convergent validity, respectively, as all are above the threshold of 0.70 [84]. Moreover, divergent validity also follows the same trend with minimum shared variance (MSV) being below AVE and maximum reliability (MaxR(H)) being above 0.70 [83]. All of these were achieved at an excellent fitted confirmatory model as highlighted in Table 6. Collectively, the measures validated the questionnaire’s ability to explain incidental emotion and soundness to be used for the hypothesis testing.
Table 5.
Model validity measures.
Table 6.
Confirmatory factor analysis fit estimates.
4.4. Structural Equation Modelling
A significant and good-fitting model was achieved from the 2000 bootstrapped SEM run. As summarized in Table 7, all representative measures from the three types of fit belong to the threshold limit. This highlighted the consistency of the data and its ability to reproduce the hypothesized relationship. Further, there were no suggested additional structural links from the main variables symbolizing a rigid model structure.
Table 7.
Structural equation model fit estimates.
4.4.1. Mediation Effect Analysis
Results identified that both affective and cognitive elements function as mediators in the trust and reliance calibration process from XAI (see Table 8). For affect, anxiously suspicious was the only insignificant mediator. Interestingly surprised mediates the appreciation of the explanation form, trusting mediates explanation form and supplementary information, and communication style and supplementary information for fearfully dismayed. Relating to reliance, the insignificance of anxiously suspicious was still seen with the path coming from it when mediated by perceived trust. As for the cognitive paths, all proposed mediation of perceived trust and usefulness from the design elements were significant. Overall, these findings highlight the initial proposed idea from the study that affective path calibration exists in the use of XAI.
Table 8.
Mediation effect analysis.
4.4.2. Direct Effect Analysis
Considering the results from the mediation analysis, relationships and design recommendations were successfully drawn from the direct effect analysis. Of the 21 hypothesized direct relationships, only 12 were identified to be statistically supported (see Table 9). As for the design to emotions group, explanation form significantly relates to interestingly surprised and trusting emotions. Communication style was significant to affect fearfully dismayed and anxiously suspicious. Lastly, the presence of supplementary information decreases fearfully dismayed.
Table 9.
Direct effect analysis.
For emotion to trust, all emotions aside from anxiously suspicious have a significant relationship to perceived trust. Particularly, users that felt interestingly surprised and trusting reported higher perceived trust, while reporting the opposite when fearfully dismayed was felt. As for the cognitive-based groups, perceived usefulness has a positive relationship with perceived trust. This stemmed from explanation form and communication style design elements being significant. Supplementary information, although identified be part of the mediated path, was insignificant for the direct test showing the possibility of partial mediation [88]. Lastly, perceived trust has a significant positive relationship with reliance. Given that each design was dichotomously coded for the analysis, translating the results to design means
- Example-based explanation increases interestingly surprised, trusting emotions, and perceived usefulness, while feature- and rule-based explanation decreases them.
- Logic robotic increases fearfully dismayed plus anxiously suspicious emotions and decreases perceived usefulness, while humanized communication functions the opposite.
- The presence of supplementary information decreases fearfully dismayed emotions, while the absence of it increases the effect.
4.4.3. Moderation Effect Analysis
Only half of the moderators were identified to have a significant effect. As shown in Table 10, the nested comparisons for AI anxiety and incidental emotions for human factors, while reliability and experience for the AI factors received a p-value less than 0.05, highlighted the substantial concurring difference from the full default model. With these results, deeper analysis was performed to identify the source of moderation on a per-path basis.
Table 10.
Global multi-group moderation effect analysis.
The results from the individual fit test for all moderation runs also favored the global results. As shown in Table 11, the CFI, SRMR, and PClose all passed the thresholds assuring capability for further exploration. Take note that these are the measures used considering the data were truncated due to the stratification. More so, these are insensitive with low sample size and corresponding degrees of freedom [87,89].
Table 11.
Local moderation test fit scores.
The local effect surfaced varying degrees of moderation per relationship, as presented in Table 12. For AI anxiety, the difference seen was mainly that values are higher with the low group than with the high group in three key areas. First, when fearfully dismayed emotions were felt, users with high AI anxiety experienced lower perceived trust than those who have low AI anxiety (β = −0.059 vs. β = 0.021, z-score = 2.195 and p-value = 0.014). Second, when exposed to a logic-robotic communication style, users in the high group have lower perceived usefulness than the low group (β = 0.804 vs. β = 1.185, z-score = 1.762 and p-value = 0.039). Lastly, for the relationship between perceived trust and reliance, users in the high group have lower reliance than the low group (β = 0.804 vs. β = 1.185, z-score = 1.762 and p-value = 0.039).
Table 12.
Local multi-group moderation difference effect analysis.
For incidental emotions, six paths were identified to be significantly moderated. In terms of dampening effect, when supplementary information was provided, users with positive incidental emotions experienced lower interestingly surprised and trusting emotions than those with negative (β = −0.979 vs. β = 0.457, z-score = 2.513 and p-value = 0.006 and β = −1.001 vs. β = 0.137, z-score = 1.868 and p-value = 0.031). Next, the effect of perceived trust is lower for the positive group than the negative group when trusting and fearfully dismayed emotions were felt (β = −0.017 vs. β = 0.174, z-score = 4.081 and p-value = 0.000 and β = −0.045 vs. β = 0.023, z-score = 2.071 and p-value = 0.019). Both conditions highlight that positive incidental emotions resulted in a decrease in effect towards supplementary information and perceived trust. In contrary, there are also amplification effects that surfaced from the moderation. First when logic-robotic communication style was used, the negative group had a higher perception of usefulness than the positive group (β = −0.875 vs. β = −1.058, z-score = 2.096 and p-value = 0.018). In addition, perceived trust was higher in the positive group relative to perceived usefulness (β = 0.196 vs. β = 0.028, z-score = 1.780 and p-value = 0.038).
Aside from incidental emotion, the same moderated paths for reliability and experience were determined. Specifically, these are the affective paths from trusting and fearfully dismayed emotion to perceived trust. For both instances, low AI reliability and short experience have higher perceived trust when trusting (β = 0.223 vs. β = 0.064, z-score = 3.416 and p-value = 0.000; β = 0.184 vs. β = 0.095, z-score = 1.859 and p-value = 0.032) and fearfully dismayed emotions (β = 0.027 vs. β = −0.073, z-score = 2.479 and p-value = 0.007; β = 0.018 vs. β = −0.046, z-score = 1.987 and p-value = 0.023) were experienced.
5. Discussion
Considering the quantitative results from the experiment and subsequent interviews, the study was able to successfully analyze the postulated objectives for the end-user XAI consideration.
5.1. Objective 1: Confirmation of Affective Trust Calibration for XAI
Affect was determined to be a variable route for trust calibration. This was established through the causal relationship test, anchored on the mediation analysis of the SEM. Notably, emotions belonging to the group of interestingly surprised (e.g., interested, excited, surprised, pleased, and amazed), trusting (e.g., happy, confident, secure, proud, and trusting), and fearfully dismayed (e.g., dismayed, afraid, fear, angry, and sad) were identified to be significant mediators for trust and reliance in a behavioral and use change view. On the other hand, anxiously suspicious (e.g., suspicious, concerned, confused, nervous, and anxious) emotions were unsupported. In terms of relationships, both interestingly surprised and trusting emotions have a positive relation to trust, while fearfully dismayed observe a negative stance. All of these were validated jointly with the significant mediation of the cognitive route showing that trust calibration can happen on the two routes.
Insights from the interview also second the confirmation of the variability of the affective route alongside the cognitive route. By synthesizing the claims, distinctively, participants can be divided into two types: people who value emotions and people who value information. The former works when intuition or perception were the mode of assessment, while the latter when information quality deliberation happens. This observation resonates with the elaboration likelihood model (ELM) of persuasion of Petty and Cacioppo [90], which is essentially a theory about the thinking process in the context of persuasion variables. Contextually, this is called the central route when high elaboration happens on the detail presented, while peripheral when low. Further, the interview also uncovered the same consideration of motivation and ability from ELM which dictates what route of trust calibration the user will follow. If they have high motivation (i.e., invested in the task reward, high curiosity with the XAI, aiming for a high score in the experiment) and high ability (i.e., understanding of the information on XAI, perceived expertise with the task), they will follow a cognitive path or central route, and affective or peripheral for the opposite.
Overall, these findings offset the running hypothesis on how XAI induces trust as determined in previous review studies [8,24]. This shows that XAI works similarly to other cues in the field of HCI that transverse on both trust calibration routes. Considering this study is a pioneer for testing the affective route, further studies can work on measuring such elaboration to analyze the differences in various contexts to ultimately check the variability of each route.
5.2. Objective 2: Effect of Different XAI Designs and Importance of End-User Centric Approach
For the design, two important observations were recognized. First, the pre-study was able to identify that certain design elements are being considered in the utility assessment of an XAI. From the survey, explanation form, communication style, and use of supplementary information rest on the top of the perceived important design element list. Notably, reasoning from the interview showed that these are selected as they provide the ability to see the rules AI rules, give an idea of the information used in such decision-making, and learn the details of the process. This shows that perceived important XAI design mainly echoes the original purpose of XAI among other things. For example, aesthetics can be considered. Text size and color are design elements but only very few noted their importance as they do not perform a critical role in explaining.
The next observation is that XAI design elements play a significant role both for the affective and cognitive trust calibration route, with changing each configuration producing different results. As deduced via SEM, design change will yield distinctive effects on emotions and cognitive evaluation (see Table 13 for the summary of effects). The varying effect theoretically implies that for XAI, design functions on a deeper level—a micro view as configuration rather than a macro view through categorical effect.
Table 13.
Summary of affect and cognitive change per design element.
The key findings support and explain the significant elaboration routes and ELM parallelism reflected in the first objective. The second objective unfolds that in the development of XAI, aside from the information it carries, the design also matters. More so, the common consensus highlights the subsistence of a general structure for possible design prioritization when developing an XAI. This means that the identified effects can be leveraged to create a targeted XAI for an optimized utility function for an XAI. For example, to increase trust and reliance, an XAI featuring an example-based explanation form can be tapped to have a positive change to interestingly surprised and trusting emotions, or can use human-like communication to simply remove the feeling of fearfully dismayed and anxiously suspicious emotions. Overall, the observations shed light on the importance of design and its variability for an end-user-centric XAI.
5.3. Objective 3: External Factors Delimiting XAI Effect
The results also identified that external factors are a point worth noting when developing an XAI, with both human (i.e., AI anxiety and incidental emotions) and AI factors (i.e., reliability and experience) being viable. This implies that XAI utility effectiveness works beyond the design and information as situational factors are also significant. For example, supplementary information will only cause a significant negative affective change on interestingly surprised if they have positive incidental emotions. Viewing the XAI development in this light further denotes that to mitigate transparency, design should be contextualized on the situational need of the implementation.
In addition, commentaries from the interview suggest that the moderation works on a per AI-type experience basis. For example, a user with a bad experience with image recognition carried this in the experiment with higher anxiety, negative incidental emotion, and lower perception of the AI reliability, even though they have a good experience relative to the other types. This infers that XAI, being a complementary element, was evaluated after the AI system was assessed, opening the idea that the XAI effect might differ for other AI use cases. A possible extension of the study can be performed to check this idea.
6. Conclusions
Explainable artificial intelligence (XAI) has successfully addressed the black box trust problem of artificial intelligence (AI) by allowing users to gain a human-level understanding of how AI works, even if they have limited knowledge on the complex machine learning algorithms that power it. However, concerns that current XAI techniques have been delimited in terms of their applicability and impact have been highlighted in the recent years. Particularly, the exploration has determined that it focuses more on the needs of developers and not end-users, putting AI adoption in a critical position. To provide the necessary viewpoint, this study aimed to explore end-user-centric XAI.
For the first objective, which aims to determine how an end-user calibrates trust from XAI, it was identified that it not only serves as a cognitive resource but also as an affective cue for trust and reliance change. Effectively, this study argues that XAI can be used as an information resource and irrationally via emotions through its affective contributions. Continuing that, another claim identified in the study is that information carried out by the XAI is not the only determinant for both routes. The study tested and identified that design—or manner by which XAI is presented—can also alter its effectiveness. This answers the second objective regarding the factors that can viably change trust from an XAI. Lastly, as for the third and fourth objective, which looked on the moderating factors in the trust calibration process, evidence showed that human and AI factors were capable to influence the effect. This includes anxiety and incidental emotion for the former, while AI reliability and experience for the latter. Overall, the study successfully filled in the theoretical gap acknowledged from the research stream. It opened a new understanding of the routes by which XAI calibrates trust, the importance of its design, and external factors that may alter its effectiveness.
6.1. Implications
Considering the findings from the study, several implications can be drawn both in theoretical and managerial landscapes. For theoretical, as this study viably determined that XAI also functions in the affective trust route, it opens a new path of research regarding XAI effectiveness and subsequently poses important delimitation on previous research that only approached calibration through cognitive route. Possibly, revisiting such studies can be carried out to firm up the findings relative to the importance of integral emotions. In terms of development, the study also creates a new paradigm on the course of XAI improvement research.
For the managerial, the results create a better position for the implementors and users. For the former, developers and designers can use the findings on how to better leverage the effect of XAI towards trust. For instance, they can reorient the XAI to induce more positive emotions or use XAI more on systems where the primary customers are those with high anxiety (e.g., telehealth applications, banking, security, driving). Moving on, for the users, if the results are operationalized, they can have a better interaction with AI systems, possibly allowing effective adoption.
Aside from the positive implications, another side that can be drawn from the results is the possibility of misusing XAI. From the findings, it highlights that not all users use XAI as an information resource for mental model calibration; some only use it as a cue. In addition, design can manipulate emotions that later affect trust and reliance. In this chain, faulty and manipulative XAI can be simply shown in the system and be effective if the design can produce a positive effect on the user.
6.2. Limitations and Direction for Future Research
Although the study has filled in an important research gap and has followed a well-planned methodology, there have been limitations that should be addressed for future research. First, the study can be extended and retested under different domains. This is recommended to strengthen the claims from the study and to identify the limitations of the relationship. Possibly, different purpose, level of sensitivity, and stakeholders can be viewed. In line with that, secondly, the study can be expanded to check on other types of XAI other than the tested type in the study. In the experiment, the focus has been on visual imagery type since it complements the nature of the AI system selected (i.e., image recognition). Other types such as tree diagrams or textual can be tested. Third, moderator testing can be improved by expanding its limits. For instance, the experience can be viewed for a longer time frame (e.g., 2 weeks) to have a broader and more realistic view of the relationships. This is recommended as the post-interview surfaced it on multiple occasions. Lastly, a cross demographical view can be conducted to check on differences between less and highly adopted AI communities as this directly affects the use of XAI.
Author Contributions
Conceptualization, E.B. and R.S.; methodology, E.B. and R.S.; experiment testbed, E.B.; validation, E.B. and R.S.; formal analysis, E.B.; investigation, E.B.; data curation, E.B.; writing—original draft preparation, E.B.; writing—review and editing, E.B.; visualization, E.B.; supervision, R.S.; project administration, E.B. and R.S.; funding acquisition, E.B. and R.S. All authors have read and agreed to the published version of the manuscript.
Funding
This research and the APC were funded by De La Salle University—Manila.
Institutional Review Board Statement
The ethical aspects of this research have been approved by the Social Science Ethics Review Board (SSERB) of the Philippine Social Science Council (Reference Code: CB-22-20 on 27 June 2022).
Informed Consent Statement
Informed consent was obtained from all subjects involved in the study.
Data Availability Statement
Data are not publicly available, though the data may be made available on request from the corresponding author.
Acknowledgments
The research team would like to acknowledge 80/20 Design Labs for their help in the development of the experiment testbed, Angelimarie Miguel and Wira Madria for their aid in the data curation and processing, and Naomi Bernardo, Edgardo Bernardo, Noel Bernardo, and Christiane Willits for their technical support and material donations used in the experiment.
Conflicts of Interest
The authors declare no conflict of interest. The funders had no role in the design of the study; in the collection, analyses, or interpretation of data; in the writing of the manuscript; or in the decision to publish the results.
References
- Lu, Y. Artificial Intelligence: A Survey on Evolution, Models, Applications and Future Trends. J. Manag. Anal. 2019, 6, 1–29. [Google Scholar] [CrossRef]
- Jordan, M.I.; Mitchell, T.M. Machine Learning: Trends, Perspectives, and Prospects. Science 2015, 349, 255–260. [Google Scholar] [CrossRef] [PubMed]
- Rai, A. Explainable AI: From Black Box to Glass Box. J. Acad. Mark. Sci. 2020, 48, 137–141. [Google Scholar] [CrossRef]
- Doshi-Velez, F.; Kim, B. Towards A Rigorous Science of Interpretable Machine Learning. arXiv 2017, arXiv:1702.08608. [Google Scholar]
- Castelvecchi, D. Can We Open the Black Box of AI? Nat. News 2016, 538, 4. [Google Scholar] [CrossRef]
- Schmidt, P.; Biessmann, F. Quantifying Interpretability and Trust in Machine Learning Systems. arXiv 2019, arXiv:1901.08558. [Google Scholar]
- Kliegr, T.; Bahník, Š.; Fürnkranz, J. A Review of Possible Effects of Cognitive Biases on Interpretation of Rule-Based Machine Learning Models. Artif. Intell. 2021, 295, 103458. [Google Scholar] [CrossRef]
- Linardatos, P.; Papastefanopoulos, V.; Kotsiantis, S. Explainable AI: A Review of Machine Learning Interpretability Methods. Entropy 2020, 23, 18. [Google Scholar] [CrossRef] [PubMed]
- Weitz, K.; Hassan, T.; Schmid, U.; Garbas, J.-U. Deep-Learned Faces of Pain and Emotions: Elucidating the Differences of Facial Expressions with the Help of Explainable AI Methods. TM Tech. Mess. 2019, 86, 404–412. [Google Scholar] [CrossRef]
- Preece, A. Asking ‘Why’ in AI: Explainability of Intelligent Systems—Perspectives and Challenges. Intell. Sys. Acc. Fin. Manag. 2018, 25, 63–72. [Google Scholar] [CrossRef]
- Venkatesh, V. Adoption and Use of AI Tools: A Research Agenda Grounded in UTAUT. Ann. Oper. Res. 2022, 308, 641–652. [Google Scholar] [CrossRef]
- Chowdhary, K.R. Fundamentals of Artificial Intelligence; Springer: New Delhi, India, 2020; ISBN 978-81-322-3970-3. [Google Scholar]
- Lewis, M.; Li, H.; Sycara, K. Deep Learning, Transparency, and Trust in Human Robot Teamwork. In Trust in Human-Robot Interaction; Elsevier: Amsterdam, The Netherlands, 2021; pp. 321–352. ISBN 978-0-12-819472-0. [Google Scholar]
- Savage, N. Breaking into the Black Box of Artificial Intelligence. Nature 2022. [Google Scholar] [CrossRef]
- Mohseni, S.; Zarei, N.; Ragan, E.D. A Multidisciplinary Survey and Framework for Design and Evaluation of Explainable AI Systems. ACM Trans. Interact. Intell. Syst. 2021, 11, 1–45. [Google Scholar] [CrossRef]
- Barredo Arrieta, A.; Díaz-Rodríguez, N.; Del Ser, J.; Bennetot, A.; Tabik, S.; Barbado, A.; Garcia, S.; Gil-Lopez, S.; Molina, D.; Benjamins, R.; et al. Explainable Artificial Intelligence (XAI): Concepts, Taxonomies, Opportunities and Challenges toward Responsible AI. Inf. Fusion 2020, 58, 82–115. [Google Scholar] [CrossRef]
- Singh, A.; Sengupta, S.; Lakshminarayanan, V. Explainable Deep Learning Models in Medical Image Analysis. J. Imaging 2020, 6, 52. [Google Scholar] [CrossRef]
- Miller, T.; Howe, P.; Sonenberg, L. Explainable AI: Beware of Inmates Running the Asylum Or: How I Learnt to Stop Worrying and Love the Social and Behavioural Sciences. arXiv 2017, arXiv:1712.00547. [Google Scholar] [CrossRef]
- Lopes, P.; Silva, E.; Braga, C.; Oliveira, T.; Rosado, L. XAI Systems Evaluation: A Review of Human and Computer-Centred Methods. Appl. Sci. 2022, 12, 9423. [Google Scholar] [CrossRef]
- Alicioglu, G.; Sun, B. A Survey of Visual Analytics for Explainable Artificial Intelligence Methods. Comput. Graph. 2022, 102, 502–520. [Google Scholar] [CrossRef]
- Zhang, Z.; Zhao, L.; Yang, T. Research on the Application of Artificial Intelligence in Image Recognition Technology. J. Phys. Conf. Ser. 2021, 1992, 032118. [Google Scholar] [CrossRef]
- Arun, N.; Gaw, N.; Singh, P.; Chang, K.; Aggarwal, M.; Chen, B.; Hoebel, K.; Gupta, S.; Patel, J.; Gidwani, M.; et al. Assessing the Trustworthiness of Saliency Maps for Localizing Abnormalities in Medical Imaging. Radiol. Artif. Intell. 2021, 3, e200267. [Google Scholar] [CrossRef]
- Zhang, J.; Chao, H.; Dasegowda, G.; Wang, G.; Kalra, M.K.; Yan, P. Overlooked Trustworthiness of Saliency Maps. In Medical Image Computing and Computer Assisted Intervention—MICCAI 2022; Wang, L., Dou, Q., Fletcher, P.T., Speidel, S., Li, S., Eds.; Lecture Notes in Computer Science; Springer Nature: Cham, Switzerland, 2022; Volume 13433, pp. 451–461. ISBN 978-3-031-16436-1. [Google Scholar]
- Adadi, A.; Berrada, M. Peeking Inside the Black-Box: A Survey on Explainable Artificial Intelligence (XAI). IEEE Access 2018, 6, 52138–52160. [Google Scholar] [CrossRef]
- Haque, A.B.; Islam, A.K.M.N.; Mikalef, P. Explainable Artificial Intelligence (XAI) from a User Perspective: A Synthesis of Prior Literature and Problematizing Avenues for Future Research. Technol. Forecast. Soc. Chang. 2023, 186, 122120. [Google Scholar] [CrossRef]
- Shin, D. The Effects of Explainability and Causability on Perception, Trust, and Acceptance: Implications for Explainable AI. Int. J. Hum. Comput. Stud. 2021, 146, 102551. [Google Scholar] [CrossRef]
- Rudin, C.; Radin, J. Why Are We Using Black Box Models in AI When We Don’t Need To? A Lesson From An Explainable AI Competition. Harv. Data Sci. Rev. 2019, 1. [Google Scholar] [CrossRef]
- Förster, M.; Hühn, P.; Klier, M.; Kluge, K. User-Centric Explainable AI: Design and Evaluation of an Approach to Generate Coherent Counterfactual Explanations for Structured Data. J. Decis. Syst. 2022, 1–32. [Google Scholar] [CrossRef]
- Ferreira, J.J.; Monteiro, M. Designer-User Communication for XAI: An Epistemological Approach to Discuss XAI Design. arXiv 2021, arXiv:2105.07804. [Google Scholar] [CrossRef]
- Silva, A.; Schrum, M.; Hedlund-Botti, E.; Gopalan, N.; Gombolay, M. Explainable Artificial Intelligence: Evaluating the Objective and Subjective Impacts of XAI on Human-Agent Interaction. Int. J. Hum. Comput. Interact. 2022, 1–15. [Google Scholar] [CrossRef]
- Cirqueira, D.; Helfert, M.; Bezbradica, M. Towards Design Principles for User-Centric Explainable AI in Fraud Detection. In Artificial Intelligence in HCI; Degen, H., Ntoa, S., Eds.; Lecture Notes in Computer Science; Springer International Publishing: Cham, Switzerland, 2021; Volume 12797, pp. 21–40. ISBN 978-3-030-77771-5. [Google Scholar]
- Chari, S.; Seneviratne, O.; Gruen, D.M.; Foreman, M.A.; Das, A.K.; McGuinness, D.L. Explanation Ontology: A Model of Explanations for User-Centered AI. In The Semantic Web—ISWC 2020; Pan, J.Z., Tamma, V., d’Amato, C., Janowicz, K., Fu, B., Polleres, A., Seneviratne, O., Kagal, L., Eds.; Lecture Notes in Computer Science; Springer International Publishing: Cham, Switzerland, 2020; Volume 12507, pp. 228–243. ISBN 978-3-030-62465-1. [Google Scholar]
- Chromik, M.; Butz, A. Human-XAI Interaction: A Review and Design Principles for Explanation User Interfaces. In Human-Computer Interaction—INTERACT 2021; Ardito, C., Lanzilotti, R., Malizia, A., Petrie, H., Piccinno, A., Desolda, G., Inkpen, K., Eds.; Lecture Notes in Computer Science; Springer International Publishing: Cham, Switzerland, 2021; Volume 12933, pp. 619–640. ISBN 978-3-030-85615-1. [Google Scholar]
- Liao, Q.V.; Varshney, K.R. Human-Centered Explainable AI (XAI): From Algorithms to User Experiences. arXiv 2021, arXiv:2110.10790. [Google Scholar]
- Gan, Y.; Ji, Y.; Jiang, S.; Liu, X.; Feng, Z.; Li, Y.; Liu, Y. Integrating Aesthetic and Emotional Preferences in Social Robot Design: An Affective Design Approach with Kansei Engineering and Deep Convolutional Generative Adversarial Network. Int. J. Ind. Ergon. 2021, 83, 103128. [Google Scholar] [CrossRef]
- Nawaratne, R. Human-Centric Product Design with Kansei Engineering and Artificial Intelligence. Available online: https://towardsdatascience.com/human-centric-product-design-with-kansei-engineering-and-artificial-intelligence-f38cb3c0f26d (accessed on 21 December 2021).
- Wang, D.; Yang, Q.; Abdul, A.; Lim, B.Y. Designing Theory-Driven User-Centric Explainable AI. In Proceedings of the 2019 CHI Conference on Human Factors in Computing Systems, Glasgow Scotland, UK, 2 May 2019; ACM: New York, NY, USA, 2019; pp. 1–15. [Google Scholar]
- Lee, J.D.; See, K.A. Trust in Automation: Designing for Appropriate Reliance. Hum. Factors 2004, 46, 50–80. [Google Scholar] [CrossRef]
- Hoff, K.A.; Bashir, M. Trust in Automation: Integrating Empirical Evidence on Factors That Influence Trust. Hum. Factors 2015, 57, 407–434. [Google Scholar] [CrossRef] [PubMed]
- Kramer, R.M. Trust and Distrust in Organizations: Emerging Perspectives, Enduring Questions. Annu. Rev. Psychol. 1999, 50, 569–598. [Google Scholar] [CrossRef] [PubMed]
- Lewis, J.D.; Weigert, A. Trust as a Social Reality. Soc. Forces 1985, 63, 967. [Google Scholar] [CrossRef]
- McAllister, D.J. Affect- and Cognition-Based Trust as Foundations for Interpersonal Cooperation in Organizations. Acad. Manag. J. 1995, 38, 24–59. [Google Scholar] [CrossRef]
- Panksepp, J. Affective Consciousness: Core Emotional Feelings in Animals and Humans. Conscious. Cogn. 2005, 14, 30–80. [Google Scholar] [CrossRef]
- Schwarz, N.; Bless, H.; Bohner, G. Mood and Persuasion: Affective States Influence the Processing of Persuasive Communications. In Advances in Experimental Social Psychology; Elsevier: Amsterdam, The Netherlands, 1991; Volume 24, pp. 161–199. ISBN 978-0-12-015224-7. [Google Scholar]
- Forlizzi, J.; Battarbee, K. Understanding Experience in Interactive Systems. In Proceedings of the 2004 Conference on Designing Interactive Systems Processes, Practices, Methods, and Techniques—DIS ’04, Cambridge, MA, USA, 1–4 August 2004; ACM Press: New York, NY, USA, 2004; p. 261. [Google Scholar]
- Van Gorp, T.; Adams, E. Design for Emotion; Morgan Kaufmann: Waltham, MA, USA, 2012; ISBN 978-0-12-386531-1. [Google Scholar]
- Madsen, M.; Gregor, S. Measuring Human-Computer Trust; Australasian Association for Information System: Wales, Australia, 2000; Volume 53, pp. 6–8. [Google Scholar]
- Myers, C.D.; Tingley, D. The Influence of Emotion on Trust. Polit. Anal. 2016, 24, 492–500. [Google Scholar] [CrossRef]
- Jin, N.; Merkebu, J. The Role of Employee Attractiveness and Positive Emotion in Upscale Restaurants. Anatolia 2015, 26, 284–297. [Google Scholar] [CrossRef]
- Jensen, T.; Khan, M.M.H.; Albayram, Y.; Fahim, M.A.A.; Buck, R.; Coman, E. Anticipated Emotions in Initial Trust Evaluations of a Drone System Based on Performance and Process Information. Int. J. Hum. Comput. Interact. 2020, 36, 316–325. [Google Scholar] [CrossRef]
- Albayram, Y.; Khan, M.M.H.; Jensen, T.; Buck, R.; Coman, E. The Effects of Risk and Role on Users’ Anticipated Emotions in Safety-Critical Systems. In Engineering Psychology and Cognitive Ergonomics; Harris, D., Ed.; Lecture Notes in Computer Science; Springer International Publishing: Cham, Switzerland, 2018; Volume 10906, pp. 369–388. ISBN 978-3-319-91121-2. [Google Scholar]
- Guerdan, L.; Raymond, A.; Gunes, H. Toward Affective XAI: Facial Affect Analysis for Understanding Explainable Human-AI Interactions. In Proceedings of the 2021 IEEE/CVF Conference on Computer Vision and Pattern Recognition Workshops (CVPRW), Nashville, TN, USA, 19–25 June 2021; Volume 10, pp. 3796–3805. [Google Scholar]
- Phillips, R.; Madhavan, P. The Role of Affective Valence and Task Uncertainty in Human-Automation Interaction. Proc. Hum. Factors Ergon. Soc. Annu. Meet. 2013, 57, 354–358. [Google Scholar] [CrossRef]
- Gompei, T.; Umemuro, H. Factors and Development of Cognitive and Affective Trust on Social Robots. In Social Robotics; Ge, S.S., Cabibihan, J.-J., Salichs, M.A., Broadbent, E., He, H., Wagner, A.R., Castro-González, Á., Eds.; Lecture Notes in Computer Science; Springer International Publishing: Cham, Switzerland, 2018; Volume 11357, pp. 45–54. ISBN 978-3-030-05203-4. [Google Scholar]
- Buck, R.; Khan, M.; Fagan, M.; Coman, E. The User Affective Experience Scale: A Measure of Emotions Anticipated in Response to Pop-Up Computer Warnings. Int. J. Hum. Comput. Interact. 2018, 34, 25–34. [Google Scholar] [CrossRef]
- Bernardo, E.; Tangsoc, J. Explanatory Modelling of Factors Influencing Adoption of Smartphone Shopping Application. IEMS 2019, 18, 647–657. [Google Scholar] [CrossRef]
- Chen, Q.Q.; Park, H.J. How Anthropomorphism Affects Trust in Intelligent Personal Assistants. Ind. Manag. Data Syst. 2021, 121, 2722–2737. [Google Scholar] [CrossRef]
- Helander, M.G.; Khalid, H.M. Affective and Pleasurable Design. In Handbook of Human Factors and Ergonomics; Salvendy, G., Ed.; John Wiley & Sons, Inc.: Hoboken, NJ, USA, 2006; pp. 543–572. ISBN 978-0-470-04820-7. [Google Scholar]
- Khalid, H.M. Embracing Diversity in User Needs for Affective Design. Appl. Ergon. 2006, 37, 409–418. [Google Scholar] [CrossRef] [PubMed]
- Lottridge, D.; Chignell, M.; Jovicic, A. Affective Interaction: Understanding, Evaluating, and Designing for Human Emotion. Rev. Hum. Factors Ergon. 2011, 7, 197–217. [Google Scholar] [CrossRef]
- Gasah, M.; Mat Zain, N.H.; Baharum, A. An Approach in Creating Positive Emotion for Children’s e-Learning Based on User Interface Design. IJEECS 2019, 13, 1267. [Google Scholar] [CrossRef]
- Isbister, K. How Games Move Us: Emotion by Design; Playful Thinking; MIT Press: Cambridge, MA, USA, 2016; ISBN 978-0-262-03426-5. [Google Scholar]
- Gutierrez, A.M.J.; Chiu, A.S.F.; Seva, R. A Proposed Framework on the Affective Design of Eco-Product Labels. Sustainability 2020, 12, 3234. [Google Scholar] [CrossRef]
- Dy, A.K.; Lazo, M.; Santos, A.G.; Seva, R. Affective Trash Bin Signage to Promote Waste Segregation. In Proceedings of the 21st Congress of the International Ergonomics Association (IEA 2021), Online, 13-18 June 2021; Black, N.L., Neumann, W.P., Noy, I., Eds.; Lecture Notes in Networks and Systems. Springer International Publishing: Cham, Switzerland, 2022; Volume 223, pp. 20–30, ISBN 978-3-030-74613-1. [Google Scholar]
- Norman, D.A. Emotional Design: Why We Love (or Hate) Everyday Things; Basic Books: New York, NY, USA, 2004; ISBN 978-0-465-05135-9. [Google Scholar]
- Jordan, P.W. Designing Pleasurable Products; CRC Press: Boca Raton, FL, USA, 2000; ISBN 978-1-135-73411-4. [Google Scholar]
- Khalid, H.M.; Helander, M.G. A Framework for Affective Customer Needs in Product Design. Theor. Issues Ergon. Sci. 2004, 5, 27–42. [Google Scholar] [CrossRef]
- Bernardo, E.; Seva, R. Explainable Artificial Intelligence (XAI) Emotions Set. Appl. Sci. 2022, submitted.
- Albayram, Y.; Jensen, T.; Khan, M.M.H.; Buck, R.; Coman, E. Investigating the Effect of System Reliability, Risk, and Role on Users’ Emotions and Attitudes toward a Safety-Critical Drone System. Int. J. Hum. Comput. Interact. 2019, 35, 761–772. [Google Scholar] [CrossRef]
- Du, N.; Zhou, F.; Pulver, E.M.; Tilbury, D.M.; Robert, L.P.; Pradhan, A.K.; Yang, X.J. Examining the Effects of Emotional Valence and Arousal on Takeover Performance in Conditionally Automated Driving. Transp. Res. Part C Emerg. Technol. 2020, 112, 78–87. [Google Scholar] [CrossRef]
- Jian, J.-Y.; Bisantz, A.M.; Drury, C.G. Foundations for an Empirically Determined Scale of Trust in Automated Systems. Int. J. Cogn. Ergon. 2000, 4, 53–71. [Google Scholar] [CrossRef]
- Kline, R.B. Principles and Practice of Structural Equation Modeling, 4th ed.; Methodology in the Social Sciences; The Guilford Press: New York, NY, USA, 2016; ISBN 978-1-4625-2335-1. [Google Scholar]
- Westland, C. Lower Bounds on Sample Size in Structural Equation Modeling. Electron. Commer. Res. Appl. 2010, 9, 476–487. [Google Scholar] [CrossRef]
- Cohen, J. Statistical Power Analysis for the Behavioral Sciences; Routledge: London, UK, 1988; ISBN 978-0-203-77158-7. [Google Scholar]
- Angold, A.; Costello, E.J. Short Mood and Feelings Questionnaire; APA PsycNet: Washington, DC, USA, 1987. [Google Scholar] [CrossRef]
- Frazier, M.L.; Johnson, P.D.; Fainshmidt, S. Development and Validation of a Propensity to Trust Scale. J. Trust. Res. 2013, 3, 76–97. [Google Scholar] [CrossRef]
- Lowry, P.B.; Twyman, N.W.; Pickard, M.; Jenkins, J.L.; Bui, Q. “Neo” Proposing the Affect-Trust Infusion Model (ATIM) to Explain and Predict the Influence of High and Low Affect Infusion on Web Vendor Trust. Inf. Manag. 2014, 51, 579–594. [Google Scholar] [CrossRef]
- Hsu, S.-H.; Chen, W.; Hsieh, M. Robustness Testing of PLS, LISREL, EQS and ANN-Based SEM for Measuring Customer Satisfaction. Total Qual. Manag. Bus. Excell. 2006, 17, 355–372. [Google Scholar] [CrossRef]
- Henseler, J.; Ringle, C.M.; Sinkovics, R.R. The Use of Partial Least Squares Path Modeling in International Marketing. In Advances in International Marketing; Sinkovics, R.R., Ghauri, P.N., Eds.; Emerald Group Publishing Limited: Bingley, UK, 2009; Volume 20, pp. 277–319. ISBN 978-1-84855-468-9. [Google Scholar]
- Chin, W.W. The Partial Least Squares Approach for Structural Equation Modeling. In Modern Methods for Business Research; Methodology for Business and Management; Lawrence Erlbaum Associates Publishers: Mahwah, NJ, USA, 1998; pp. 295–336. ISBN 0-8058-2677-7. [Google Scholar]
- Yang, X.J.; Unhelkar, V.V.; Li, K.; Shah, J.A. Evaluating Effects of User Experience and System Transparency on Trust in Automation. In Proceedings of the 2017 ACM/IEEE International Conference on Human-Robot Interaction, Vienna, Austria, 6 March 2017; ACM: New York, NY, USA, 2017; pp. 408–416. [Google Scholar]
- Vogt, W.P.; Johnson, R.B. The SAGE Dictionary of Statistics & Methodology: A Nontechnical Guide for the Social Sciences, 5th ed.; SAGE: Los Angeles, CA, USA, 2016; ISBN 978-1-4833-8176-3. [Google Scholar]
- Hair, J.F. (Ed.) Multivariate Data Analysis; Prentice Hall: Upper Saddle River, NJ, USA, 1998; ISBN 978-0-13-894858-0. [Google Scholar]
- Taber, K.S. The Use of Cronbach’s Alpha When Developing and Reporting Research Instruments in Science Education. Res. Sci. Educ. 2018, 48, 1273–1296. [Google Scholar] [CrossRef]
- Hu, L.; Bentler, P.M. Cutoff Criteria for Fit Indexes in Covariance Structure Analysis: Conventional Criteria versus New Alternatives. Struct. Equ. Model. A Multidiscip. J. 1999, 6, 1–55. [Google Scholar] [CrossRef]
- Schreiber, J.B.; Nora, A.; Stage, F.K.; Barlow, E.A.; King, J. Reporting Structural Equation Modeling and Confirmatory Factor Analysis Results: A Review. J. Educ. Res. 2006, 99, 323–338. [Google Scholar] [CrossRef]
- Cangur, S.; Ercan, I. Comparison of Model Fit Indices Used in Structural Equation Modeling Under Multivariate Normality. J. Mod. Appl. Stat. Meth. 2015, 14, 152–167. [Google Scholar] [CrossRef]
- Baron, R.M.; Kenny, D.A. The Moderator–Mediator Variable Distinction in Social Psychological Research: Conceptual, Strategic, and Statistical Considerations. J. Personal. Soc. Psychol. 1986, 51, 1173–1182. [Google Scholar] [CrossRef]
- Shi, D.; Lee, T.; Maydeu-Olivares, A. Understanding the Model Size Effect on SEM Fit Indices. Educ. Psychol. Meas. 2019, 79, 310–334. [Google Scholar] [CrossRef]
- Petty, R.E.; Cacioppo, J.T. The Elaboration Likelihood Model of Persuasion. In Advances in Experimental Social Psychology; Elsevier: Amsterdam, The Netherlands, 1986; Volume 19, pp. 123–205. ISBN 978-0-12-015219-3. [Google Scholar]


Disclaimer/Publisher’s Note: The statements, opinions and data contained in all publications are solely those of the individual author(s) and contributor(s) and not of MDPI and/or the editor(s). MDPI and/or the editor(s) disclaim responsibility for any injury to people or property resulting from any ideas, methods, instructions or products referred to in the content. |
© 2023 by the authors. Licensee MDPI, Basel, Switzerland. This article is an open access article distributed under the terms and conditions of the Creative Commons Attribution (CC BY) license (https://creativecommons.org/licenses/by/4.0/).