
The Prediction of Road-Accident Risk through Data Mining: A Case Study from Setubal, Portugal


Abstract
1. Introduction
2. Related Work
2.1. The Classical Approach
2.2. The Deep Learning Approach
2.3. Other Relevant Works
3. Theoretical Framework
4. Results and Discussion
4.1. Dataset
4.2. Selection of Attributes
4.3. Data Mining
5. Conclusions
Author Contributions
Funding
Institutional Review Board Statement
Informed Consent Statement
Data Availability Statement
Conflicts of Interest
References
- Hengst, M.D.; Mors, J.T. Community of Intelligence: The Secret Behind Intelligence-Led Policing. In Proceedings of the 2012 European Intelligence and Security Informatics Conference, Odense, Denmark, 22–24 August 2012; pp. 22–29. [Google Scholar]
- Castro, Y.; Kim, Y.J. Data mining on road safety: Factor assessment on vehicle accidents using classification models. Int. J. Crashworthiness 2016, 21, 104–111. [Google Scholar] [CrossRef]
- Kashyap, J.; Chandra, A.; Singh, P. Mining Road Traffic Accident Data to Improve Safety on Road-related Factors for Classification and Prediction of Accident Severity. Int. Res. J. Eng. Technol. 2016, 10, 2395–2456. [Google Scholar]
- Hussain, S.; Muhammad, L.J.; Ishaq, F.S.; Yakubu, A.; Mohammed, I.A. Performance evaluation of various data mining algorithms on road traffic accident dataset. Smart Innov. Syst. Technol. 2019, 106, 67–78. [Google Scholar] [CrossRef]
- Kumeda, B.; Zhang, F.; Zhou, F.; Hussain, S.; Almasri, A.; Assefa, M. Classification of road traffic accident data using machine learning Algorithms. In Proceedings of the 2019 IEEE 11th International Conference on Communication Software and Networks (ICCSN), Chongqing, China, 12–15 June 2019; pp. 682–687. [Google Scholar] [CrossRef]
- Chen, Q.; Song, X.; Yamada, H.; Shibasaki, R. Learning deep representation from big and heterogeneous data for traffic accident inference. In Proceedings of the 30th AAAI Conference on Artificial Intelligence (AAAI 2016), Phoenix, AZ, USA, 21 February 2016; pp. 338–344. [Google Scholar]
- Yuan, Z.; Zhou, X.; Yang, T. Hetero-ConvLSTM: A deep learning approach to traffic accident prediction on heterogeneous spatio-temporal data. In Proceedings of the ACM SIGKDD International Conference on Knowledge Discovery and Data Mining, London, United Kingdom, 19 August 2018; Volume 18, pp. 984–992. [Google Scholar] [CrossRef]
- Krukowicz, T.; Firląg, K.; Chrobot, P. Spatiotemporal analysis of road crashes with animals in Poland. Sustainability 2022, 14, 1253. [Google Scholar] [CrossRef]
- Billah, K.; Sharif, H.O.; Dessouky, S. How Gender Affects Motor Vehicle Crashes: A Case Study from San Antonio, Texas. Sustainability 2022, 14, 7023. [Google Scholar] [CrossRef]
- Saveliev, A.; Lebedeva, V.; Lebedev, I.; Uzdiaev, M. An approach to the automatic construction of a road accident scheme using UAV and deep learning methods. Sensors 2022, 22, 4728. [Google Scholar] [CrossRef]
- Tajnik, S.; Luin, B. Impact of Driver, Vehicle, and Environment on Rural Road Crash Rate. Sustainability 2022, 14, 15744. [Google Scholar] [CrossRef]
- Bokaba, T.; Doorsamy, W.; Paul, B.S. Comparative study of machine learning classifiers for modelling road traffic accidents. Appl. Sci. 2022, 12, 828. [Google Scholar] [CrossRef]
- Islam, M.K.; Gazder, U.; Akter, R.; Arifuzzaman, M. Involvement of Road Users from the Productive Age Group in Traffic Crashes in Saudi Arabia: An Investigative Study Using Statistical and Machine Learning Techniques. Appl. Sci. 2022, 12, 6368. [Google Scholar] [CrossRef]
- Islam, M.K.; Reza, I.; Gazder, U.; Akter, R.; Arifuzzaman, M.; Rahman, M.M. Predicting Road Crash Severity Using Classifier Models and Crash Hotspots. Appl. Sci. 2022, 12, 11354. [Google Scholar] [CrossRef]
- Mesquitela, J.; Elvas, L.B.; Ferreira, J.C.; Nunes, L. Data Analytics Process over Road Accidents Data—A Case Study of Lisbon City. ISPRS Int. J. Geo-Inf. 2022, 11, 143. [Google Scholar] [CrossRef]
- Guido, G.; Shaffiee Haghshenas, S.; Shaffiee Haghshenas, S.; Vitale, A.; Astarita, V.; Park, Y.; Geem, Z.W. Evaluation of Contributing Factors Affecting Number of Vehicles Involved in Crashes Using Machine Learning Techniques in Rural Roads of Cosenza, Italy. Safety 2022, 8, 28. [Google Scholar] [CrossRef]
- Kim, H.; Kim, J.-T.; Shin, S.; Lee, H.; Lim, J. Prediction of Run-Off Road Crash Severity in South Korea’s Highway through Tree Augmented Naïve Bayes Learning. Appl. Sci. 2022, 12, 1120. [Google Scholar] [CrossRef]
- Rodionova, M.; Skhvediani, A.; Kudryavtseva, T. Prediction of crash severity as a way of road safety improvement: The case of Saint Petersburg, Russia. Sustainability 2022, 14, 9840. [Google Scholar] [CrossRef]
- Infante, P.; Jacinto, G.; Afonso, A.; Rego, L.; Nogueira, V.; Quaresma, P.; Saias, J.; Santos, D.; Nogueira, P.; Silva, M. Comparison of statistical and machine-learning models on road traffic accident severity classification. Computers 2022, 11, 80. [Google Scholar] [CrossRef]
- Goldschmidt, R.; Passos, E.; Bezerra, E. Data Mining, Conceitos Técnicas, Algoritmos, Orientações e Aplicações; Elsevier: Rio de Janeiro, Brasil, 2015. [Google Scholar]
- Fayyad, U.M.; Piatetsky-Shapiro, G.; Smyth, P. Knowledge Discovery and Data Mining: Towards a Unifying Framework. In Proceedings of the Second International Conference on Knowledge Discovery and Data Mining, Portland, OR, USA, 2–4 August 1996; pp. 82–88. [Google Scholar]
- Hendrickx, T.; Cule, B.; Meysman, P.; Naulaerts, S.; Laukens, K.; Goethals, B. Mining association rules in graphs based on frequent cohesive itemsets. In Proceedings of the Pacific-Asia Conference on Knowledge Discovery and Data Mining, Ho Chi Minh City, Vietnam, 19–22 May 2015; pp. 637–648. [Google Scholar]
- Agarwal, S. Data mining: Data mining concepts and techniques. In Proceedings of the 2013 International Conference on Machine Intelligence and Research Advancement, Katra, India, 21 December 2013; pp. 203–207. [Google Scholar]
- Zhang, S.; Zhang, C.; Yang, Q. Data preparation for data mining. Appl. Artif. Intell. 2003, 17, 375–381. [Google Scholar] [CrossRef]
- Mueller, J.P.; Massaron, L. Deep Learning for Dummies; John Wiley & Sons: Hoboken, NJ, USA, 2019. [Google Scholar]
- Berry, M.W.; Mohamed, A.; Yap, B.W. Supervised and Unsupervised Learning for Data Science; Springer: Cham, Switzerland, 2020. [Google Scholar]
- Kuncheva, L.I. Combining Pattern Classifiers: Methods and Algorithms; John Wiley & Sons: Hoboken, NJ, USA, 2014. [Google Scholar]
- Sen, P.C.; Hajra, M.; Ghosh, M. Emerging Technology in modelling and graphics. Singap. Springer Singap. 2020, 937, 99. [Google Scholar]
- Belanche, L.A.; González, F.F. Review and evaluation of feature selection algorithms in synthetic problems. arXiv 2011, arXiv:1101.2320. [Google Scholar]
- Indrakumari, R.; Poongodi, T.; Singh, K. Introduction to Deep Learning. In Advanced Deep Learning for Engineers and Scientists; Springer: Cham, Switzerland, 2021; pp. 1–22. [Google Scholar]
- Eisenberg, D. The mixed effects of precipitation on traffic crashes. Accid. Anal. Prev. 2004, 36, 637–647. [Google Scholar] [CrossRef]
- Hayat, R.B.; Debbarh, M.; Antoniou, C.; Hayat, R.B.; Debbarh, M.; Antoniou, C.; Yannis, G. Explaining the road accident risk: Weather effects. Accid. Anal. Prev. 2013, 1, 456–465. [Google Scholar] [CrossRef]
- Tamerius, J.D.; Zhou, X.; Mantilla, R.; Greenfield-Huitt, T. Precipitation effects on motor vehicle crashes vary by space, time, and environmental conditions. Weather. Clim. Soc. 2016, 8, 399–407. [Google Scholar] [CrossRef]
- Febres, J.D.; Garca-Herrero, S.; Herrera, S.; Gutirrez, J.M.; Lpez-Garca, J.R.; Mariscal, M.A. Influence of seat-belt use on the severity of injury in traffic accidents. Eur. Transp. Res. Rev. 2020, 12, 1–12. [Google Scholar] [CrossRef]
- Musile, G.; Pigaiani, N.; Sorio, D.; Colombari, M.; Bortolotti, F.; Tagliaro, F. Alcohol-associated traffic injuries in Verona territory: A nine-year survey. Med. Sci. Law 2021, 61, 7–13. [Google Scholar] [CrossRef] [PubMed]
- Song, Y.; Kou, S.; Wang, C. Modeling crash severity by considering risk indicators of driver and roadway: A Bayesian network approach. J. Saf. Res. 2021, 76, 64–72. [Google Scholar] [CrossRef]
- Martn-delosReyes, L.M.; Martnez-Ruiz, V.; Rivera-Izquierdo, M.; Jimnez-Mejas, E.; Lardelli-Claret, P. Is driving without a valid license associated with an increased risk of causing a road crash? Accid. Anal. Prev. 2021, 149, 1–7. [Google Scholar] [CrossRef]
- Zhang, Z.; McDonnell, K.T.; Zadok, E.; Mueller, K. Visual correlation analysis of numerical and categorical data on the correlation map. IEEE Trans. Vis. Comput. Graph. 2015, 21, 289–303. [Google Scholar] [CrossRef]
- Bhattacharya, A.; Dunson, D.B. Simplex factor models for multivariate unordered categorical data. J. Am. Stat. Assoc. 2012, 107, 362–377. [Google Scholar] [CrossRef]
- Leon, A.C. Descriptive and Inferential Statistics. Compr. Clin. Psychol. 1998, 3, 243–285. [Google Scholar] [CrossRef]
- Sun, J. The Microbiome in Health and Disease Preface; Academic Press: Cambridge, MA, USA, 2020; Volume 171, pp. XV–XVI. [Google Scholar]
- Urbanowicz, R.J.; Meeker, M.; La Cava, W.; Olson, R.S.; Moore, J.H. Relief-based feature selection: Introduction and review. J. Biomed. Inform. 2018, 85, 189–203. [Google Scholar] [CrossRef]
- Robnik-Šikonja, M.; Kononenko, I. Theoretical and empirical analysis of ReliefF and RReliefF. Mach. Learn. 2003, 53, 23–69. [Google Scholar] [CrossRef]
- Marcano-Cedeño, A.; Quintanilla-Domínguez, J.; Cortina-Januchs, M.; Andina, D. Feature selection using sequential forward selection and classification applying artificial metaplasticity neural network. In Proceedings of the IECON 2010—36th Annual Conference on IEEE Industrial Electronics Society, Glendale, AZ, USA, 7 November 2010; pp. 2845–2850. [Google Scholar]
- Molina, L.C.; Belanche, L.; Nebot, À. Feature selection algorithms: A survey and experimental evaluation. In Proceedings of the 2002 IEEE International Conference on Data Mining, Maebashi City, Japan, 9 December 2002; pp. 306–313. [Google Scholar]
- SeguroPorDias. O Congestionamento nas Estradas da Cidade do Porto (Congestion on the Roads of the City of Porto). Available online: https://seguropordias.pt/blog/tr%C3%A2nsito-porto-portugal (accessed on 29 December 2022).
- Ren, H.; Song, Y.; Wang, J.; Hu, Y.; Lei, J. A Deep Learning Approach to the Citywide Traffic Accident Risk Prediction. In Proceedings of the 2018 21st International Conference on Intelligent Transportation Systems (ITSC), Maui, HI, USA, 4–7 November 2018; pp. 3346–3351. [Google Scholar] [CrossRef]


| Weather Conditions: | Precipitation, Temperature; Wind Force |
|---|---|
| Human behavior: | Seat belt use, cell phone use, alcohol consumption calendar |
| Road conditions: | Road networks, luminosity, road identification, traffic volume |
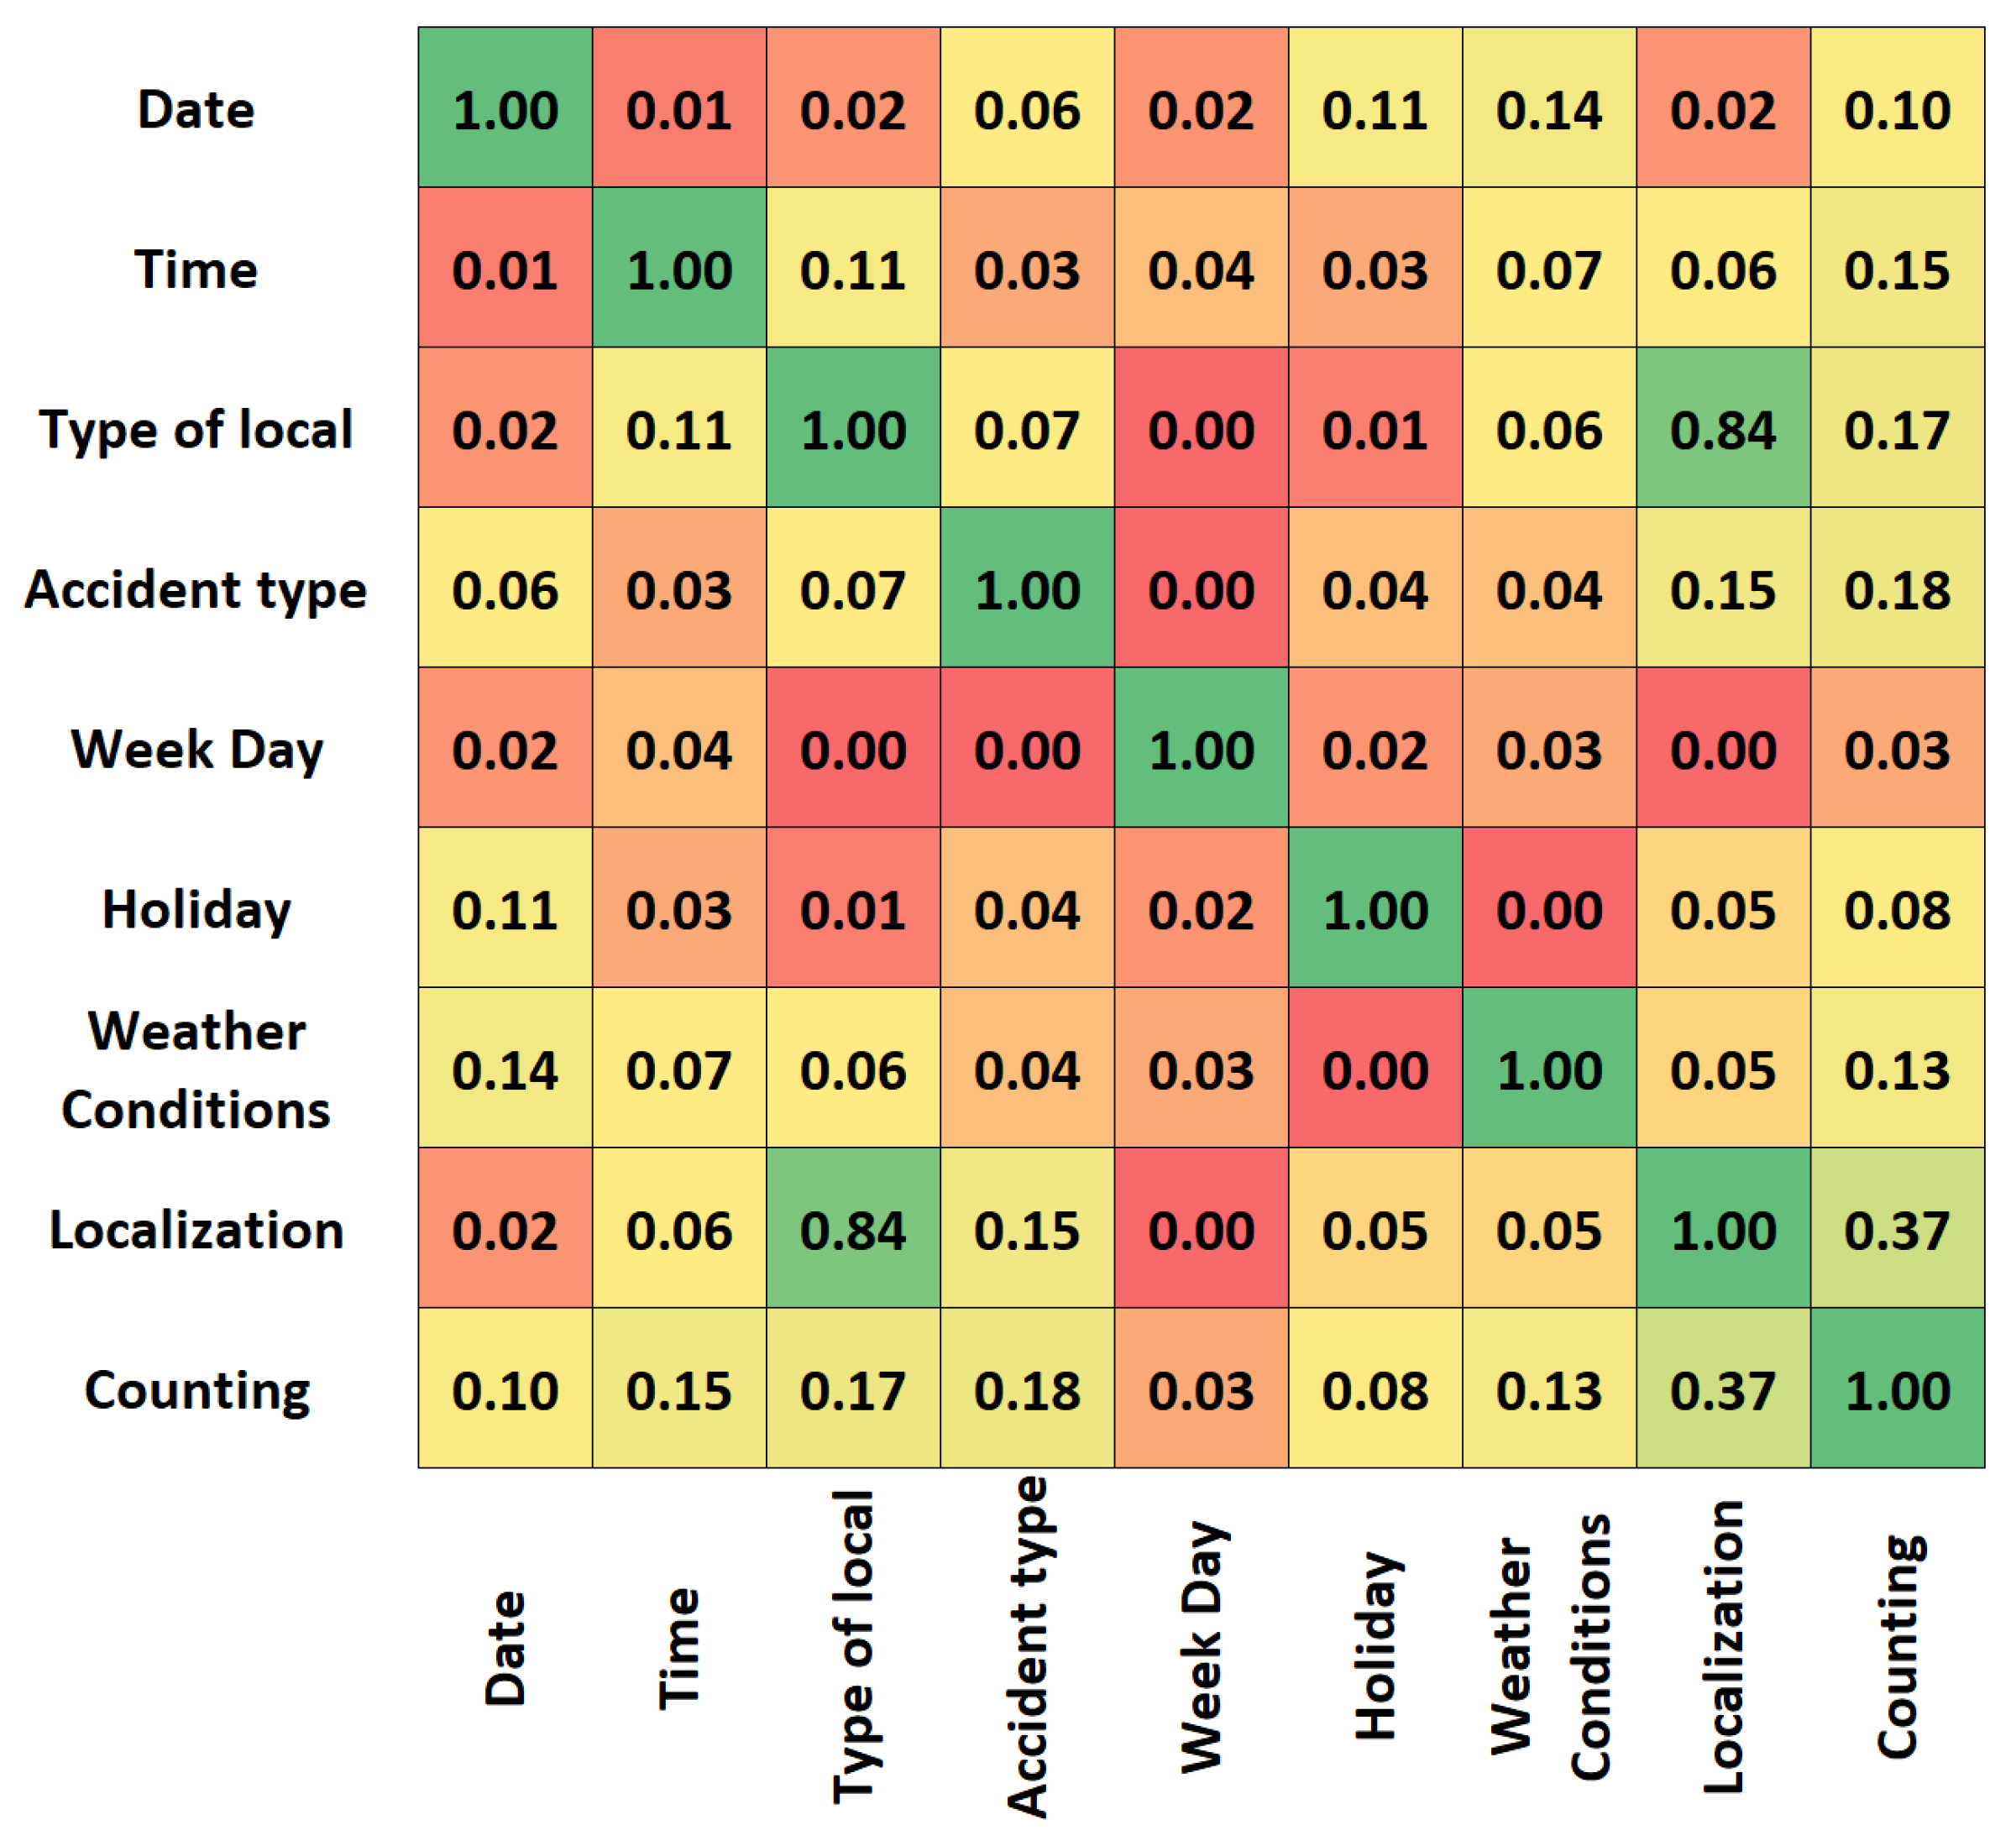
| Values of Cramer V Coefficient, | Interpretation |
|---|---|
| [0.25; 1.00] | Very Strong |
| [0.15; 0.25] | Strong |
| [0.10; 0.15] | Moderated |
| [0.05; 0.10] | Weak |
| [0; 0.05] | Very Weak |
| Attribute | Type/Format of Data |
|---|---|
| Identification of accident | Serial number |
| Date | dd/mm/yyyy |
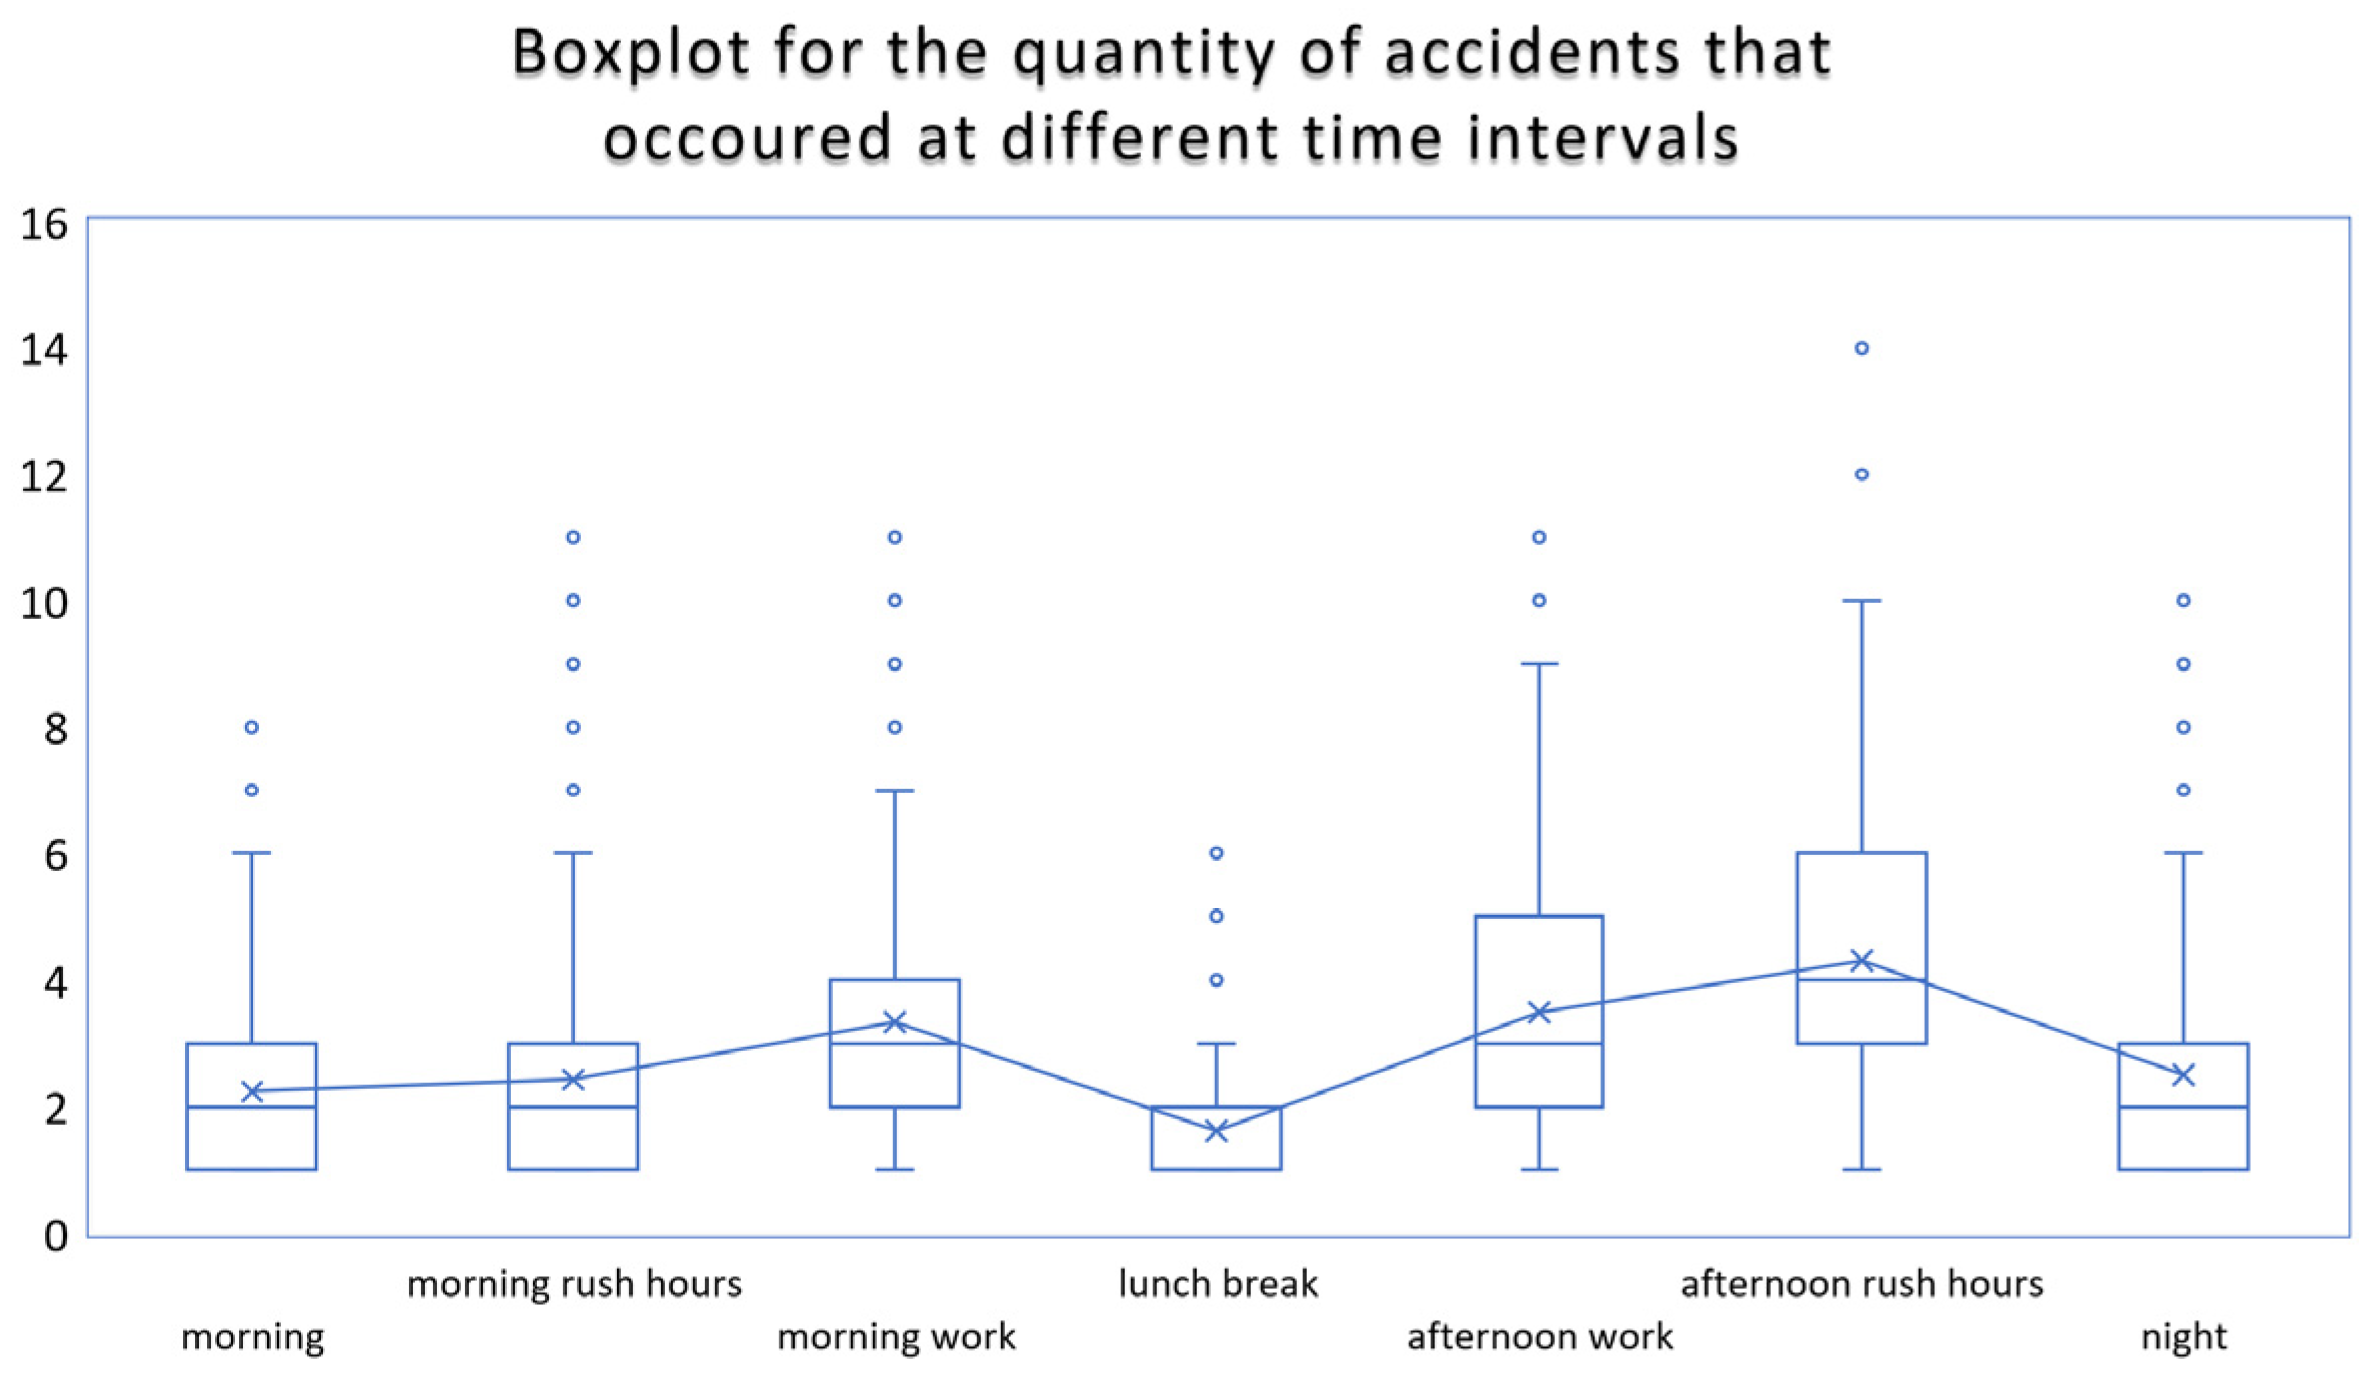
| Time | {Morning, morning work, morning rush hours, lunch break, afternoon work, afternoon rush hours, night} |
| Type of local | {Motorway, itineraries or national roads, village roads} |
| Localization | {Urban location, non-urban location} |
| Type of accident | {Damage only, with injured} |
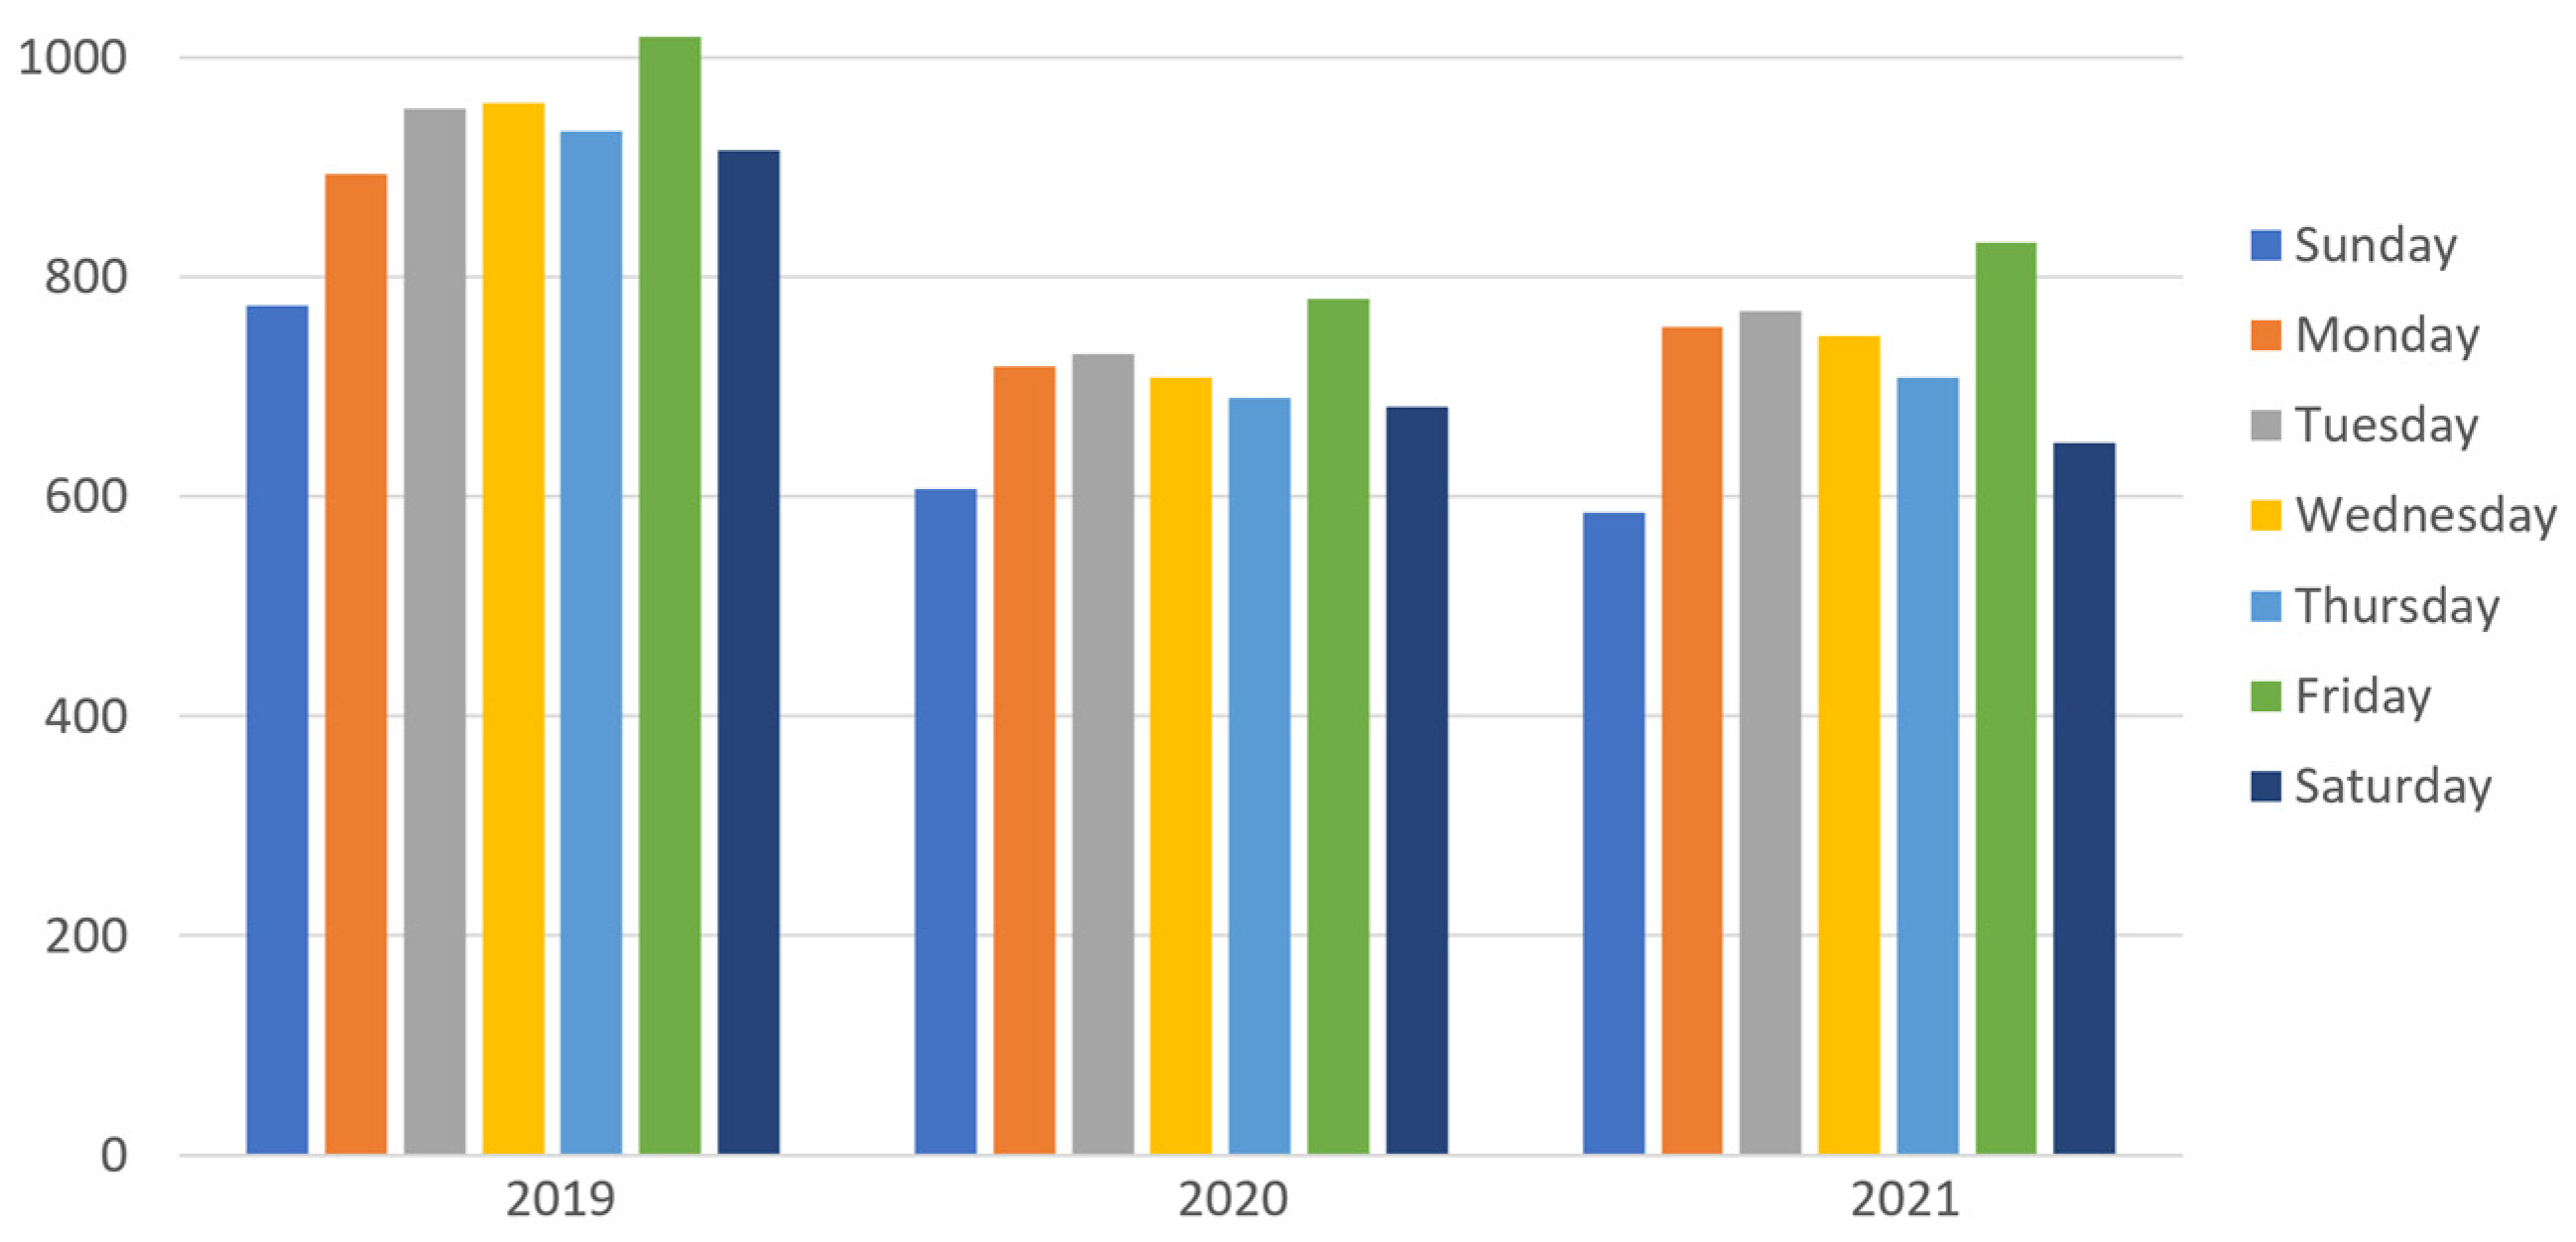
| Day of the week | {Monday, Tuesday, Wednesday, Thursday, Friday, Saturday, Sunday} |
| Holiday | Boolean |
| Alcohol | Numerical with 2 decimal digits (g/L) |
| Administrative offenses | Numerical with 2 decimal digits |
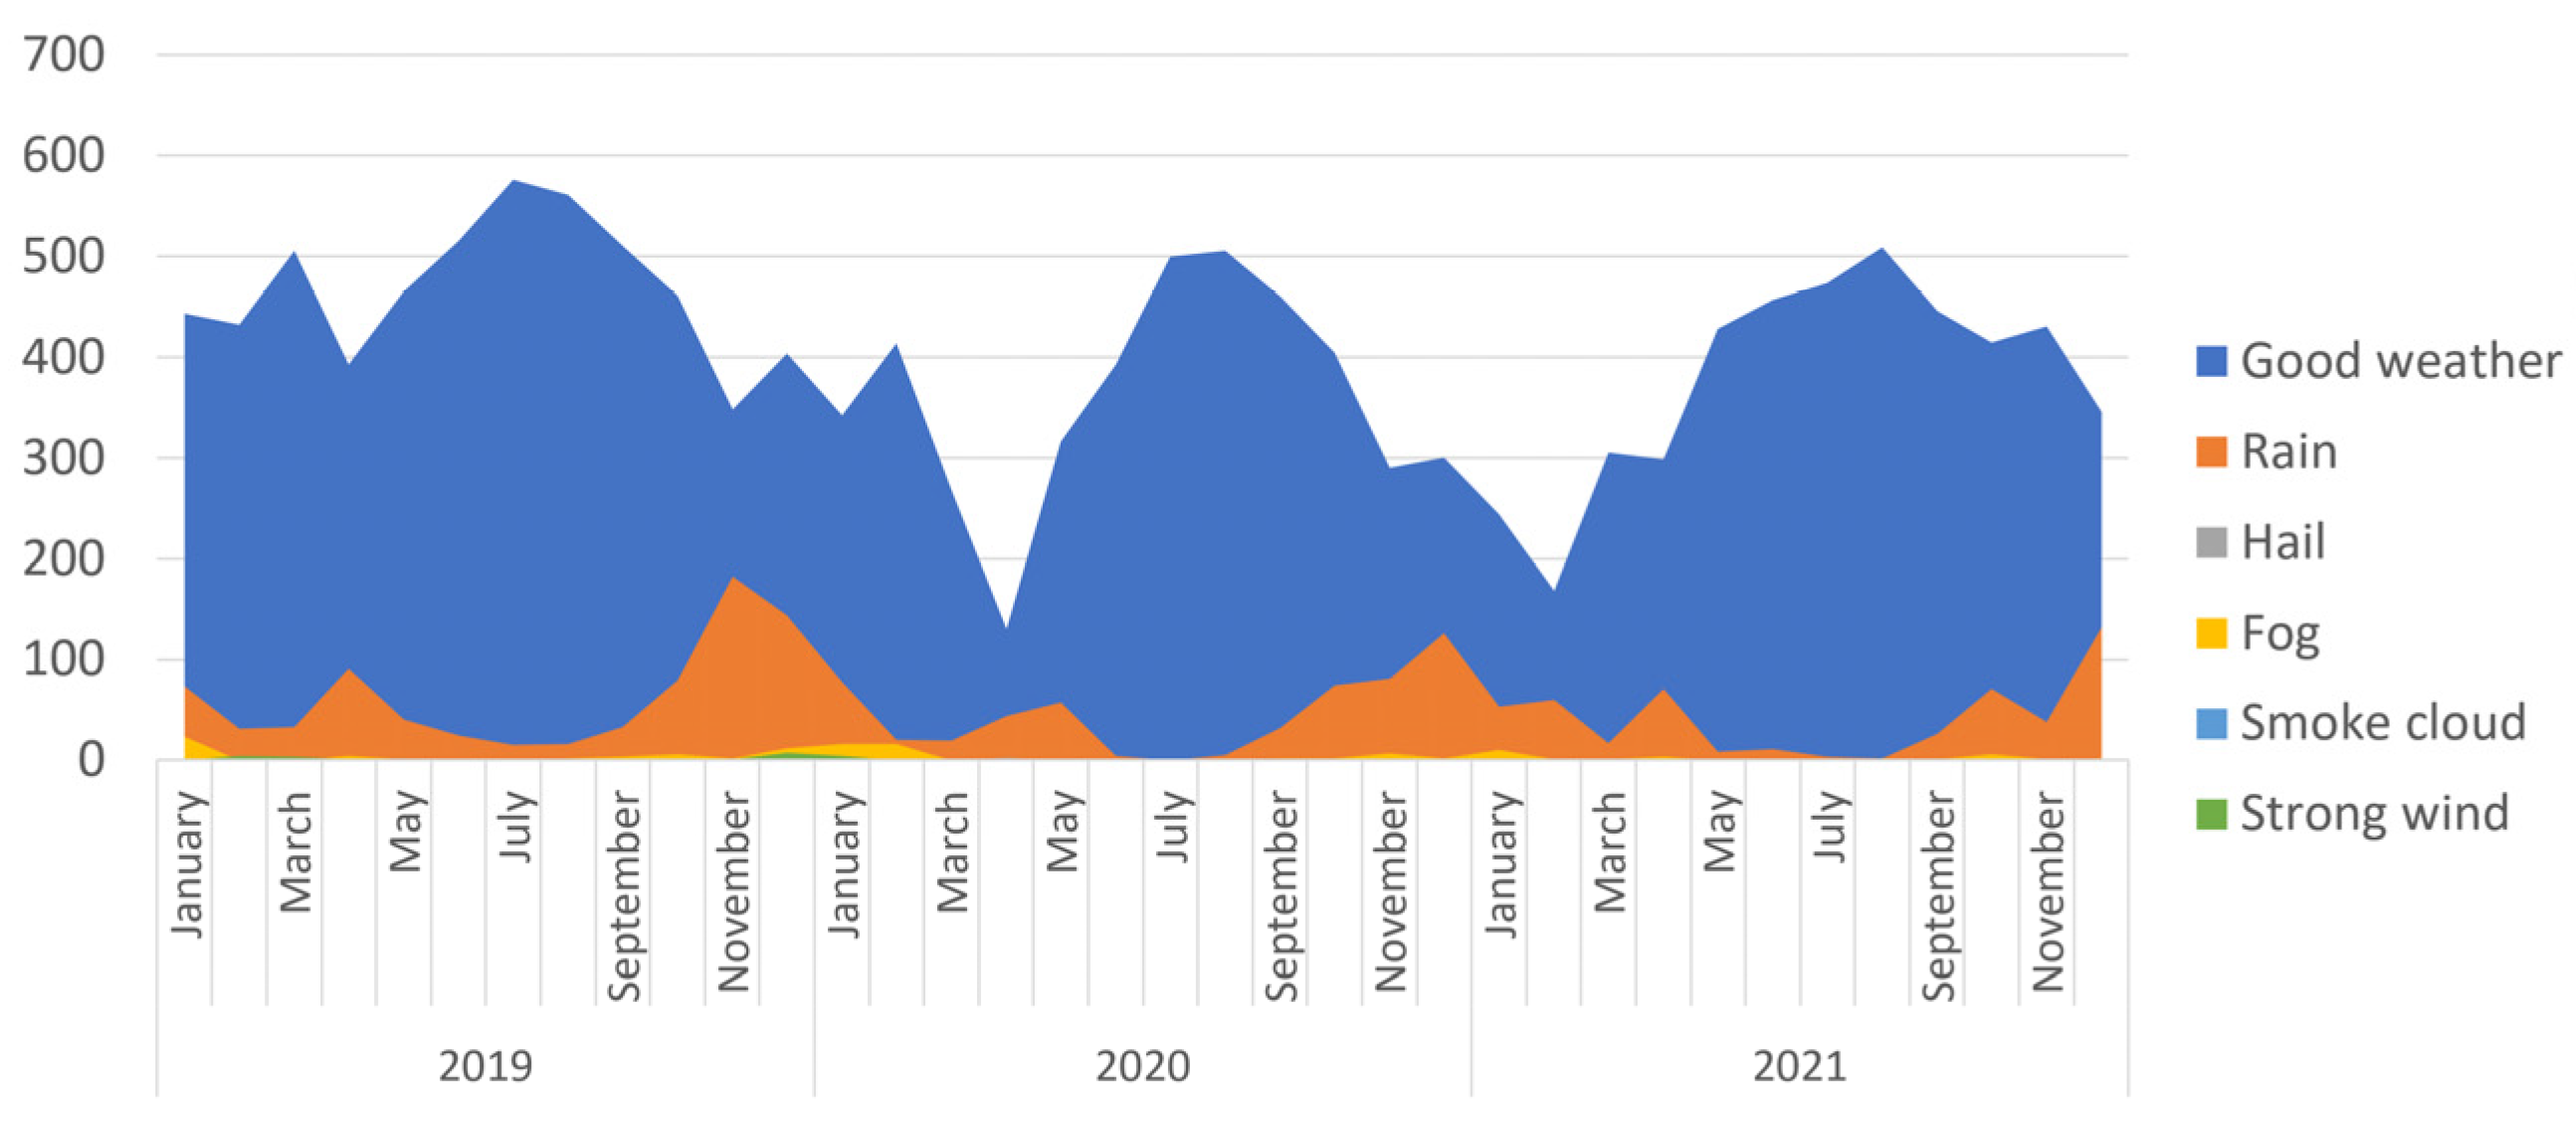
| Weather conditions | {Good weather, fog, rain, strong wind, hail, smoke cloud} |
| Motorways | Considered Relevant by Both Algorithms | Considered Irrelevant by Both Algorithms |
|---|---|---|
| RBA & SBS | Rain, morning work, afternoon rush hours, Friday, Saturday, August, February | Sunday |
| Classes | Range of the number of accidents |
|---|---|
| Low Risk | <1.5 |
| Medium Risk | ≥1.5 & <2.5 |
| High Risk | ≥2.5 |
| Algorithm | MAE (Distance) | Accuracy (%) |
|---|---|---|
| kNN | 0.74 | 56% |
| Linear Regression | 0.63 | 57% |
| Lasso Regression | 0.60 | 54% |
| Ridge Regression | 0.61 | 52% |
| Decision Tree | 0.69 | 56% |
| Neural Network | 0.57 | 89% |
| Algorithm | MAE (Distance) | Accuracy (%) |
|---|---|---|
| kNN | 0.30 | 81% |
| Linear Regression | 0.27 | 86% |
| Lasso Regression | 0.28 | 86% |
| Ridge Regression | 0.28 | 80% |
| Decision Tree | 0.31 | 76% |
| Neural Network | 0.55 | 87% |
| Algorithm | MAE (Distance) | Accuracy (%) |
|---|---|---|
| kNN | 0.93 | 48% |
| Linear Regression | 0.85 | 50% |
| Lasso Regression | 0.80 | 51% |
| Ridge Regression | 0.79 | 50% |
| Decision Tree | 0.91 | 55% |
| Neural Network | 0.52 | 88% |
| Algorithm (Regression with Neural Network) | MAE (Distance) | Accuracy (%) |
|---|---|---|
| General model | 0.49 | 88% |
| Motorways (9.3% of total accidents) | 0.57 | 89% |
| Itineraries or national roads (30% of total accidents) | 0.55 | 87% |
| Village roads (60.7% of total accidents) | 0.52 | 88% |
| Type of Road | Percentage of Accidents involving Injuries or Deaths | Nº of Injured/Dead per Accident |
|---|---|---|
| Motorway | 25.1% | 1.7 |
| Village roads | 17.3% | 1.2 |
| Itineraries or national roads | 29.8% | 1.42 |
Disclaimer/Publisher’s Note: The statements, opinions and data contained in all publications are solely those of the individual author(s) and contributor(s) and not of MDPI and/or the editor(s). MDPI and/or the editor(s) disclaim responsibility for any injury to people or property resulting from any ideas, methods, instructions or products referred to in the content. |
© 2023 by the authors. Licensee MDPI, Basel, Switzerland. This article is an open access article distributed under the terms and conditions of the Creative Commons Attribution (CC BY) license (https://creativecommons.org/licenses/by/4.0/).
Share and Cite
Dias, D.; Silva, J.S.; Bernardino, A. The Prediction of Road-Accident Risk through Data Mining: A Case Study from Setubal, Portugal. Informatics 2023, 10, 17. https://doi.org/10.3390/informatics10010017
Dias D, Silva JS, Bernardino A. The Prediction of Road-Accident Risk through Data Mining: A Case Study from Setubal, Portugal. Informatics. 2023; 10(1):17. https://doi.org/10.3390/informatics10010017
Chicago/Turabian StyleDias, David, José Silvestre Silva, and Alexandre Bernardino. 2023. "The Prediction of Road-Accident Risk through Data Mining: A Case Study from Setubal, Portugal" Informatics 10, no. 1: 17. https://doi.org/10.3390/informatics10010017
APA StyleDias, D., Silva, J. S., & Bernardino, A. (2023). The Prediction of Road-Accident Risk through Data Mining: A Case Study from Setubal, Portugal. Informatics, 10(1), 17. https://doi.org/10.3390/informatics10010017